paleomagnetism of the mesozoic in alaska … of the mesozoic in alaska a h dissertation c~: ... 3-20...
TRANSCRIPT

PALEOMAGNETISM OF THE MESOZOIC
IN ALASKA
A H
DISSERTATION c~:
Presented to the Faculty of the *
University of Alaska in Partial Fulfillment "
*-'*U
of the Requirements
for the Degree of t ,
DOCTOR OF PHILOSOPHY
CD
by -
Duane R. Packer Ci
College, Alaska uL
May 1972
https://ntrs.nasa.gov/search.jsp?R=19740018802 2018-06-03T05:14:41+00:00Z

PALEOMAGNETISM OF THE MESOZOIC
IN ALASKA
APPROVED:
Chairman
APPROVED: DATE:Dean of the College of
Earth Sciences and
Mineral Industry
Vice President for Research
and Advanced Study
I/

ABSTRACT
Over 400 oriented cores of Permian, Triassic, Jurassic, and
Cretaceous sedimentary and igneous rocks were collected from 34 sites
at 10 areas throughout southern Alaska. After magnetic 'cleaning' in
successively higher alternating fields 179 samples were considered to
be stable and to give statistically consistent results within each
site and age group. Due to the lack of a sufficient number of stable
samples, the results from Permian, Triassic, and Cretaceous rocks
were inconclusive. The nine remaining Jurassic sites represent 100
samples from three general areas in southern Alaska.
The mean paleomagnetic declinations calculated with respect to
the present, Carey's model, and Grantz's model are not significantly
different from one another and do not show a systematic change along
the strike of the orocline. The paleomagnetic poles for the Jurassic
from southern Alaska and North America are separated in the opposite
direction to be explained by the Alaskan orocline. The Alaskan
orocline as Carey defined it, therefore, does not appear to be a
valid concept.
The southern Alaskan Jurassic paleomagnetic pole is significantly
different from the North American Jurassic pole. This suggests that
since the Jurassic, southern Alaska must have moved approximately 18
degrees north and rotated 52 degrees clockwise to reach its present
position. Tectonic interpretation of these results give a possible
explanation for many of the geologic features observed in southern
Alaska.
hrVT , 71

ACKNOWLEDGEMENTS
I would like to acknowledge with sincere gratitude and
indebtedness the continual guidance, support, and encouragement
offered by Dr. David B. Stone, who suggested this research topic
originally and who was always more than willing to discuss its many
aspects at length. I would also like to thank Dr. Douglas K. Bingham
for "initiation" into the practical intricacies of paleomagnetic
collection and data refinement.
For invaluable support in many ways while in the field and for
other assistance I offer sincere thanks to Dr. R. B. Forbes of the
Geophysical Institute and to J. W. Deininger of the Geology Department,
University of Alaska; D. H. Richter, N. A. Matson, and F. R. Weber of
the Alaska Branch, United States Geological Survey; and B. Bender of
the Columbia-Ward Cannery at Chignik, Alaska. I also thank G. W. New-
man of Humble Oil and Refining Co., for field support and joint
collection and analysis of results.
A special tribute is due to Genevieve Edsall for the myriad of
top-quality paleomagnetic measurements she conducted and for her close
attention in completing the numerous other details of the work. Thanks
are due to Pat Kirton for typing the preliminary draft. I would like
also to thank LuAnne, my wife, for her typing and editing of the first
drafts, and for her patience with long hours.
This work was supported by a National Defense Education Act,
Title IV, fellowship through the Geology Department, University of
Alaska; and by grants GA 1216 and GA 12014 from the National Science
iv

Foundation, Geophysics and Earth Science Section, grant NGL-02-001-063
from the National Aeronautics and Space Administration, and State of
'laska funds through the Geophysical Institute, University of Alaska.
V

TABLE OF CONTENTS
Page
ABSTRACT
ACKNOWLEDGEMENTS iv
TABLE OF CONTENTS vi
LIST OF ILLUSTRATIONS viii
LIST OF TABLES xi
CHAPTER I. ARCUATE TECTONIC FORM OF ALASKA 1
Topographic expression 1
Geologic expression 2
Discussion of origin 7
CHAPTER II. PALEOMAGNETIC APPROACH 17
Remanent magnetization 17
Paleomagnetism 19
Techniques 21
Application to structural problems 23
CHAPTER III. MESOZOIC PALEOMAGNETIC RESULTS FROM ALASKA 25
Alaska Peninsula 25
Geologic setting of the Alaska Peninsula 25
Sites on the Alaska Peninsula 31
Chignik Lake (CHL) 31
Chignik Lagoon (CHG) 41
Puale Bay (PLB) 42
Cape Kekurnoi (CPK) 45
vi

P'age
Katmai area (KTM) 50
Tuxedni Bay (TXD) 57
Southcentral Alaska 66
Geologic setting of the Upper MatanuskaValley 66
Sites in the Upper Matanuska Valley 70
Sheep Mountain (SHP) 70
Geologic setting of the MentastaMountains 73
Sites in the Mentasta Mountains 74
Mentasta (MNT) 74
Nabesna area (NBS) 75
Whitehorse, Canada 83
Geologic setting of the Whitehorse area,Canada 83
Sites near Whitehorse, Canada 87
Whitehorse, Canada (WTH) 87
CHAPTER 1l. ALASKAN MAGNETIC DECLINATIONS AND VIRTUALGEOMIAGNETIC POLES 91
Alaskan orocline 97
Alaskan paleomagnetic poles 101
Polar wandering curves 104
CHAPTER V. TECTONIC IMPLICATIONS OF ALASKAN PALEOMAGNETICDATA 126
Summary and Conclusions 126
Tectonic implications 127
Speculative reconstruction 127
Recommendations for future work 133
APPENDIX 135
REFERENCES 154
vii

LIST OF ILLUSTRATIONS
Figure Page
1-1 Major fault trends in Alaska and northwestern Canada. 4
1-2 Alaskan orocline and Arctic sphenochasm. 8
1-3 Correlation of tectonic elements between Alaska and
Siberia in mid Paleozoic time. 13
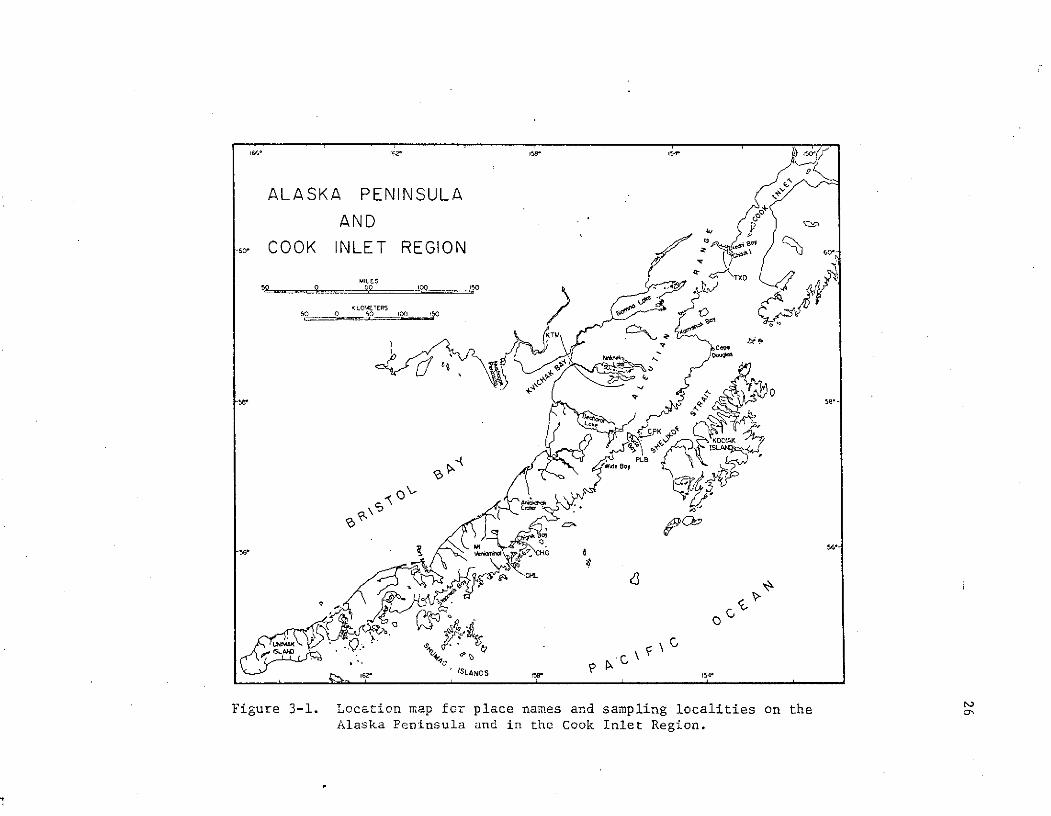
3-1 Location map for place names and sampling localities
on the Alaska Peninsula. 26
3-2 Paleomagnetic data for CHL-1, Chignik Lake, Alaska. 36
3-3 Paleomagnetic data for CHL-2, Chignik Lake, Alaska. 37
3-4 Paleomagnetic data for CHL-3, Chignik Lake, Alaska. 38
3-5 Paleomagnetic data for CHL-4, Chignik Lake, Alaska. 39
3-6 Paleomagnetic data for CHL-5, Chignik Lake, Alaska. 40
3-7 Paleomagnetic data for CHG, Chignik Lagoon, Alaska. 44
3-8 Paleomagnetic data for PLB, Puale Bay, Alaska. 47
3-9 Paleomagnetic data for CPK, Cape Kekurnoi, Alaska. 49
3-10 Paleomagnetic data for KTM-1, Katmai area, Alaska. 53
3-11 Paleomagnetic data for KTM-2, Katmai area, Alaska. 54
3-12 Paleomagnetic data for KTM-3, Katmai area, Alaska. 55
3-13 Paleomagnetic data for TXD-1, Tuxedni Bay, Alaska. 61
3-14 Paleomagnetic data for TXD-2, Tuxedni Bay, Alaska. 62
3-15 Paleomagnetic data for TXD-3, Tuxedni Bay, Alaska. 63
3-16 Paleomagnetic data for TXD-4, Tuxedni Bay, Alaska. 64
3-17 Location map for place names and sampling localities
in central Alaska. 67
viii

Figure Page
3-18 Paleomagnetic data for SHP, Sheep Mountain area,Alaska 72
3-19 Paleomagnetic data for MNT, Mentasta, Alaska. 77
3-20 Paleomagnetic data for NBS-1, Nabesna area, Alaska. 80
3-21 Paleomagnetic data for NBS-2, Nabesna area, Alaska. 81
3-22 Paleomagnetic data for NBS-3, Nabesna area, Alaska. 82
3-23 Location map for place names and sampling localityin the Whitehorse area, Canada. 84
3-24 Paleomagnetic data for WTH, Whitehorse area, Canada. 89
4-1 Mean VGP's for Triassic and Permian sites. 93
4-2 Mean VGP's for Jurassic sites. 94
4-3 Mean VGP's for Cretaceous sites. 95
4-4 Magnetic declinations from Alaska for the Triassic,Jurassic, and Cretaceous. 98
4-5 Magnetic declinations for Alaskan Jurassic resultsshowing present position, Carey's model, and Grantz'smodel. 100
4-6 Selected North American paleomagnetic poles andJurassic results from southern Alaska. 102
4-7 Permian paleomagnetic poles from North America. 107
4-8 Permian paleomagnetic poles from Asia. 108
4-9 Permian paleomagnetic poles from Europe. 109
4-10 Triassic paleomagnetic poles from North America. 110
4-11 Triassic paleomagnetic poles from Asia. 111
4-12 Triassic paleomagnetic poles from Europe. 112
4-13 Jurassic paleomagnetic poles from North America. 113
4-14 Jurassic paleomagnetic poles from Asia. 114
4-15 Jurassic paleomagnetic poles from Europe. 115
ix

Figure Page
4-16 Cretaceous paleomagnetic poles from North America. 116
4-17 Cretaceous paleomagnetic poles from Asia. 117
4-18 Cretaceous paleomagnetic poles from Europe. 118
4-19 Polar wandering curve for North America. 121
4-20 Polar wandering curve for Asia. 122
4-21 Polar wandering curve for Europe. 123
4-22 Schematic representation of polar wandering curvesfor North America, Asia, and Europe. 125
x

LIST OF TABLES
Table Page
3-1 Paleomagnetic directions and pole positions for
Chignik Lake, Alaska. 33
3-2 Paleomagnetic directions and pole positions for
Chignik Lagoon, Alaska. 43
3-3 Paleomagnetic directions and pole positions for
Puale Bay, Alaska. 46
3-4 Paleomagnetic directions and pole positions for
Cape Kekurnoi, Alaska. 48
3-5 Paleomagnetic directions and pole positions for
Katmai area, Alaska. 52
3-6 Paleomagnetic directions and pole positions for
Tuxedni Bay, Alaska. 59
3-7 Paleomagnetic directions and pole positions for
Sheep Mountain area, Alaska. 71
3-8 Paleomagnetic directions and pole positions for
Mentasta, Alaska. 76
3-9 Paleomagnetic directions and pole positions for
Nabesna area, Alaska. 79
3-10 Paleomagnetic directions and pole positions for
Whitehorse area, Canada. 88
4-1 Paleomagnetic directions and pole positions for
Triassic, Jurassic, and Cretaceous sites. 96
4-2 Mean paleomagnetic pole positions for North America,Asia, and Europe. 119
xi
I. ARCUATE TECTONIC FORM OF ALASKA
The arcuate form of Alaskan topography and tectonics has been
a topic of speculation for many years, especially since the accep-
tance of continental drift ideas spurred real interest in global
geology.
TOPOGRAPHIC EXPRESSION
Besides the southern shoreline, the most obvious topographic
feature in Alaska with an arcuate form is the Alaska Range, which
is a part of the Cordillera that bounds the western edge of the
Americas. The trend traced by the Coast Mountains of Canada, the
Alaska Range and the Aleutian Range curves approximately 75 degrees
in mid-Alaska. The Tanana River and the Kuskokwim and Nushagak
Rivers create a lowland to the north that parallels the Alaska
Range. Still farther north the Kuskokwim Mountains and the Tanana-
Yukon Uplands follow the general trend of the Alaska Range, as does
the Yukon River, which has its headwaters in Canada. The Brooks
Range in northern Alaska forms an angle of about 30 degrees to the
trend of the Rocky Mountains. To the south of the Alaska Range,
the Saint Elias Mountains, the Chugach Mountains, and the Kenai
Mountains also form an arcuate belt along the Gulf of Alaska. There
are less obvious topographic features that parallel the trends of
the Alaska Range and the Brooks Range, but few other features are
continuous across Alaska.
2
GEOLOGIC EXPRESSION
Payne (1955) mapped the Mesozoic and Cenozoic tectonic elements
of Alaska and explained the tectonic history of central and southern
Alaska with a series of arcuate geosynclines and geanticlines of
different ages. The Paleozoic Seldovia, Talkeetna, and Tanana geanti-
clines, the lower Cretaceous Yakataga geosyncline, and the upper
Cretaceous Chugach Mountains, Matanuska, Alaska Range, and Kuskokwim
geosynclines are all examples of this.
Most of the following discussion of faults in Alaska is from
Grantz (1966). The right-lateral strike-slip Denali fault system,
which is well expressed topographically and defines the curvature of
the Alaska Range, consists of relatively straight fault segmerts that
extend from Chatham Strait to Bristol Bay. The Denali fault shows a
curve of about 30 degrees (Fig. 1-1).
From east to west, the Chatham Strait, Chilkat River, ShakwLk,
Denali, Holitna, and Togiak-Tikchik faults compose the Denali fault
system. The Denali fault consists of the Farewell segment, the Hines
Creek strand and the McKinley strand. Most of the faults of the
Denali fault system are thought to be older faults of an unknown
type, with imposed Cenozoic or latest Mesozoic to Recent right-lateral
displacement along a length of over 2150 km. The Chatham Strait and
Chilkat River faults became active in the early Cretaceous; the Togiak-
Tikchik and Holitna faults became active in the late Cretaceous; and
the various Denali fault segments became active in late Cretaceous or
Paleocene. All but the Chatham Strait and Chilkat River faults have

3
Figure 1-1. Major fault trends in Alaska and northwestern Canada.
(After King, 1969; Grantz, 1966; Richter and Matson,1971; and Churkin, 1970a)
Denali Fault System
1. Chatham Strait fault2. Chilkat River fault zone3. Shakwak fault4. Denali fault
4a. McKinley strand4b. Hines Creek strand4c. Farewell segment
5. Holitna fault6. Togiak-Tikchik fault
Southeastern Alaska
7. Fairweather fault8. Totschunda fault system9. Queen Charlotte Islands fault
Central and Southwestern Alaska
10. Rocky Mountain trench11. Tintina trench and fault12. Stevens Creek fault zone13. Kaltag fault14. Yukon Delta conjugate fault zone15. Aniak-Thompson Creek fault16. Iditarod-Nixon Fork fault17. Porcupine lineament18. Kobuk trench19. Castle Mountain fault20. Bruin Bay fault

180 160 14000
LEGEND
Strike-sUp foult 64*A lo ofrect d
ste-shp mewnas
4'hrust faultBso norAq sdo
Normal faultHch esdft,'n..m irs
64*
Fas obshd here V&rred
S/ Numbers refer to oe13 - 200 m -
4b Sub-sea contour
14 15 100 0 100 200 MILES
O 4c 410 100 LOMETERS
20"
,..OF AL S
. ..200-",
110, 10 "4,0
160* I (Oo "
Figure 1-1.
5
experienced motion in Recent times. Estimates of the total right-
lateral offset of the Denali fault system range from 240 km (St.
Amand, 1957), to 80 km (Brew and others, 1966). The Totschunda fault
system, which is an extension of the Fairweather fault, intersects
the Denali fault system in the Mentasta Mountains at 144 degrees west
longitude.(Richter and Matson, 1971). The Fairweather fault and
Totschunda fault systems are apparently no older than early Pleistocene
and are active today. The motion of these faults is predominantly
right-lateral, with up to 10 km displacement. All of these faults
are relatively straight but intersect to form a complex and definitely
arcuate fault trace.
The Tintina and the Kaltag faults may also form an arcuate fault
system (Fig. 1-1), approximately 150 miles north of the Denali fault
system (Churkin, 1970a). From Canada, the Rocky Mountain trench,
extrapolated across the Liard Plain, trends into the Tintina trench
and Tintina fault which extend into Alaska (Roddick, 1967). It is
unclear whether the Tintina fault bends westward into the Stevens
Creek fault zone and still further west into the Kaltag fault or
trends into the Kobuk trough. The right-lateral Tintina fault was
active in lower Paleozoic (Roddick, 1967), from Jurassic through late
Cretaceous, and from Oligocene through Pliocene (Grantz, 1966). The
Tintina fault and Tintina trench have a combined length of approxi-
mately 1300 km with postulated offsets ranging from 80 km, estimated
in Alaska (Grantz, 1966), to 400 km, estimated in Canada by Roddick
(1967). It should be noted that the existence of faulting along the
Kobuk trough as suggested by Grantz (1966) and King (1969) is now
being questioned (Fritts, personal communication, 1972).

The Kaltag fault may bend into the Tintina fault or trend north-
east into the Porcupine lineament as mentioned above (Fig. 1-1). The
right-lateral Kaltag fault can be traced westward onto the Bering
shelf (Scholl et al., 1970). The Kaltag, which is 400 km long on
land, has been active from the late Cretaceous to the Recent and has
a displacement of approximately 140 km.
In western Alaska, approximately half-way between the Farewell
segment of the Denali fault and the Kaltag fault, lies the right-
lateral Iditarod-Nixon Fork fault. The Iditarod-Nixon Fork fault
became active in late Cretaceous and has displacement until Recent
time with a maximum total offset of 110 km. This 500 km long fault,
although.predominantly strike-slip, has a reverse dip-slip component
which is upthrown on the north. Even though the Iditarod-Nixon Fork
fault cannot be traced east beyond 152 degrees west longitude, and
thus cannot be traced around the bend, its sense of motion, age, and
trend are identical to the western portions of the Denali fault system
and the Kaltag-Tintina faults. Trending north from the Togiak-Tikchik
fault, terminating the Iditarod-Nixon Fork fault, and ending in the
Kaltag fault, is the left-lateral Aniak-Thompson Creek fault, which
has about 40 km of late Cretaceous or Tertiary displacement.
Approximately 110 miles south of the Farewell segment of the
Denali fault, the Castle Mountain fault follows a parallel trend.
The Castle Mountain fault has had possibly up to tens of kilometers
of right-lateral displacement along a length of approximately 450 km
since late Cretaceous. Apparently the Castle Mountain fault does not

7
make a bend and trend into the Chitina Valley to connect with the
Fairweather fault as postulated by St. Amand (1957), but splays out
in the southern Talkeetna Mountains just north of the upper Matanuska
Valley (Grantz, 1966).
On the west coast of Cook Inlet, to the southwest of the Castle
Mountain fault, is the Bruin Bay fault, which is nearly parallel to
the Hlolitna fault of the Denali fault system. Both the Bruin Bay
fault, and a parallel fault along the northwest shore of Kodiak
Island, are high-angle reverse faults upthrown on the north. On the
southeast shore of Kodiak Island are at least two major normal faults
upthrown onthe northwest, which are nearly parallel to the Holitna
fault. The Bruin Bay fault became active in the mid to late Jurassic,
while the faults on Kodiak Island became active in the early to mid
Tertiary. Other areas in southern Alaska also have thrust faulting
that parallels the general trend of the Denali-fault system, as shown
in Figure 1-1.
DISCUSSION OF ORIGIN
Alaska appears arcuate in both topographic and geologic form.
In view of the increasing evidence for plate tectonics, an understand-
ing of the contact between Eurasian and North American plates would
answer many questions about the geologic history of the North Pacific
and Arctic Oceans. The arcuate form of Alaska either developed as
such from the beginning, is tectonically controlled, or is the result
of some combination of the two. Carey (1958) explained the arcuate
tectonic form of Alaska by the Alaskan orocline (Fig. 1-2), which is

ASIA
ALASKAN/OROCLINE - -
28SimpleSTensionRift
NORTHAMERICA
Figure 1-2. Alaskan orocline and Arctic sphenochasm.(From Carey, 1958.)

9
the compressional side of a rift that he called the Arctic spheno-
chasm. The Arctic sphenochasm has an opening of about 30 degrees
which is distributed into two en echelon tension rifts, forming the
Arctic Ocean and the Greenland, Barents, and Kara Seas and the
Khatanga, Davis Strait, and Baffin Bay troughs. Carey also developed
explanations for many other features around the Arctic Ocean that
followed from the Alaskan orocline hypothesis.
Carey's pivot point for the Alaskan orocline is approximately
148 degrees west longitude and 64 degrees north latitude, which is a
point just north of the bend in the Alaska Range. He divides the
hinge region of the orocline into a complex array of orotaths,
sphenochasms, rhombochasms, and megashears in an attempt to match
similar topographic and geologic features of Alaska and eastern
Siberia. Further evidence Carey uses in support of the Alaskan
orocline are the Precambrian through present virtual geomagnetic
poles for Britain and North America, whose curves intersect at 30
degrees and fit the Alaskan orocline better than other explanations
of that time for opening of the Atlantic. However, due to the few
data that these poles represent, and to the large statistical error
limits involved, all that is proven is that North America and Britain
did drift apart; the data may not be used to demonstrate with any
certainty about what axis this occurred. Another supporting factor
for the Alaskan orocline is the coherent pattern of paleogeography it
presents.
Grantz (1966) argues that insofar as the mountains are a late
Miocene and Pliocene feature, younger than the postulated formation
10
of the arcuate tectonics, they cannot be a direct result of oroclinal
bending. In fact, the trend of the Cenozoic mountains show greater
curvature than that of the Mesozoic tectonic elements and late Meso-
zoic faults. The curves of the present mountains, though, are
probably the resuilt of earlier orogenic trends which may reflect
oroclinal bending. Curved late Mesozoic features, such as strike-
slip fault zones, might lead to evidence of oroclinal origin.
Grantz (1966), in his study of strike-slip faults in Alaska,
presents two possibilities for the internal rotation of Alaska along
the arcuate fault patterns. The first possibility is that the faults
were once straight but have been bent up to 50 degrees along a north-
erly striking axial plane; the second is that the right-lateral--
the most recent--motion has adopted favorably situated members of an
old and extensive fault system.
Grantz pursues several lines of reasoning regarding these possi-
bilities. One is based on a hypothesis of St. Amand (1957), which
suggests the right-lateral faults are in response to counterclockwise
rotation of the Pacific Basin; however, in light of recent plate.
tectonic evidence (Atwater, 1970; McKenzie and Parker, 1967; and
others) this hypothesis seems an unlikely explanation. Work by
Richter and Matson (1971) on the Totschunda fault system also indi-
cates a different sense of stress for southern Alaska. This line of
reasoning, in any case, would not apply to interior Alaska and the
Tintina-Kaltag faults. Another way of creating the arcuate form is
by regional compression, which would result in conjugate strike-slip
faulting. Most of the strike-slip faults in Alaska are straight;
however there appear to be no conjugate faults except in the Yukon
Delta area (Grantz, 1966).
Restoring the movement along the faults on the western side of
the bend by a simple mechanical model, Grantz (1966) was able to
demonstrate how the bend could be straightened by rotations of up to
50 degrees. Rotation in this mechanical model is around individual
pivots along a north trending axis at about 148 degrees west longi-
tude. Fifty degrees is also approximately the amount by which the
Mesozoic tectonic elements (Payne, 1955) are bent. Despite similar-
ities, it seems that such a simple model of bending does not ade-
quately explain several factors, such as only 7 degrees of rotation
required to restore the Castle Mountain fault and the apparent lack
of maximum stress concentration in the axial region of the bending
(Grantz, 1966). Of course intrpretation is complicated by lack of
data on the type and extent of Paleozoic and earlier displacements
along the faults. Grantz (1966) also suggested that the arcuate
tectonic form of Alaska might represent one limb of a buckle created
by longitudinal drift of North America toward Siberia and not by a
simple rotation about a pivot in Alaska, as was Carey's (1958)
hypothesis.
Churkin (1969, 1970a, 1970b) has correlated Pre-Cambrian,
Paleozoic, and early Mesozoic rocks of Alaska and Siberia. Work
reported on by Churkin (1970a) indicates that Wrangell Island, north
of Siberia, is connected across the Chukchi Sea to the Lisburne
Peninsula by bathymetric and gravity anomalies, and that these repre-
sent a structural extension of the Brooks Range. Fossiliferous

12
Mississippian rocks, which are a part of a sequence of marine sediments
and non-marine conglomerates with outcrops of comparable sections on
Wrangell Island, in the Brooks Range, and in the Arctic Islands, thus
probably represent a clastic wedge deposited around the Canada Basin
(Fig. 1-3). Paleozoic plutonic history also appears to be similar.
At Cape Dezhneva, the easternmost tip of the Chukotsk Peninsula,
there is a gneiss and amphibolite dome surrounded by marble and schist.
A similar structure is present in the Kigluiak Mountains on the Seward
Peninsula across the Bering Strait, about 60 miles east of Cape
Dezhneva. Fossils of Ordovician and Silurian age have been found in
limestones overlying both structures. Rubidium-strontium ages on both
metamorphic domes indicate Precambrian and Cretaceous metamorphic-
plutonic events. Thrust faulting and plutonic activity also appear
to have a good correlation on both sides of the Bering Strait (Churkin,
1970a).
Churkin (1970a) also reports that St. Lawrence Island has an
almost complete Devonian through Triassic section that resembles
rocks of both the Chukotsk Peninsula and the western Brooks Range.
Farther inland, the Yukon-Porcupine Rivers area in Alaska and the
Kolmski massif in Siberia have similar sections of carbonate and
terrigenous rocks.
Churkin (1970b) attempts to correlate the Paleozoic submarine
volcanic rocks and volcanoclastic sedimentary rocks--eugeosynclinal
deposits--that occur in southeastern Alaska, western Canada, and the
Alaska Range with Chukotka (Fig. 1-3). The best section, where
Ordovician through Permian rocks (including plutonic rocks and

,,,< ; -.. EXPLANATION.;f10, -, _ . ... . 6...,---.
) s° ° .. ,
Soo o
S RA ..Soo , "Circumpacific-- ,- IDGE geosynclinal belt
" I ' "- Carbonate rock
S Wr . -' shelf areas
0
,,o:, .. Gco '
- "o o o
C -e , Circumarctic
S , geosynclinal belt
461
Precambrian150shield
Figure 1-3. Correlation of tectonic elements between Alaska and Siberia in mid Paleozoictime. (From Churkin, 1970b.)

14
associated conglomerates) are exposed, is in southeastern Alaska.
This same rock sequence is found in incomplete sections in some areas
of the Alaska Range and farther south. Churkin (1970b) cites Russian
work that reports similar volcanic-terrigeneous rock units around the
northwestern rim of the Pacific Basin in the Koryak Mountains of
Chukotka. Churkin (1970b) proposes that, based on the correlation of
these Paleozoic sections, the Cordilleran geosyncline of southern
Alaska continues west to become the Koryak geosyncline.
The conclusion Churkin (1970a) draws is that Alaska and Chukotka
have been connected since Paleozoic time and probably since the Pre-
cambrian. This, of course, precludes any large-scale continental
drift between Alaska and Siberia. Recent geologic and geophysical
evidence from the Arctic Ocean indicates that Carey's (1958) idea
of a single rifting creating the Arctic Ocean is probably incorrect.
The geometry of the Canada Basin opposed to the Eurasian Basin, the
active Nansen Cordillera, the inactive Alpha Cordillera, and the non-
volcanic Lomonosov Ridge all indicate a complex origin for the Arctic
Ocean Basin. Rather than Carey's simple rifting, Churkin has proposed
spreading along the Nansen Cordillera in the Eurasian Basin, as the
extension of the opening of the Atlantic Ocean, and compression in the
Verkhoyansk and Cherski Mountains in Western Siberia. This implies
that the Canada Basin formed earlier. Hamilton (1970) believes that
the Nansen Ridge ends in a right-lateral fault that trends east along
the northern coast of Siberia, through the Chukotsk Peninsula and into
the Bering Sea. The pole of rotation for the drifting of North America
with respect to Eurasia, based on azimuths of fractures across the

15
northern part of the mid-Atlantic ridge, is 78 degrees north, 102
degrees east (LePichon, 1968). The pole based on best fit for
Greenland against Europe is 73 degrees north, 96.5 degrees east
(Bullard et al., 1965). More recent work by Pitman and Talwani
(1972), show the pole of rotation for the Atlantic north of the
Azores to be around 149 degrees east longitude and 65 degrees north
latitude. These poles are near the apex of Churkin's proposed
hinge zone.
Compression of this magnitude, Churkin (1970b) feels, was
taken up by closing a break in the Verkhoyansk Mountain region
rather than creating a buckle between Alaska and Siberia. The
Verkhoyansk Mountain area is a fold belt that forms the boundary
between the Precambrian and Paleozoic Siberian platform and the more
intensely deformed Mesozoic Chukotka fold belt (Churkin, 1970b).
Churkin (1969) proposed that the bend in Alaska is largely the
result of a long period of regional stress created by spreading of
the Pacific sea floor, oriented against the continental margin of
the Gulf of Alaska. This is supported by faults and folds in the
Koryak Mountains and around the Gulf of Alaska (Stoneley, 1967), and
by magnetic anomalies in the Gulf of Alaska (Pitman and Hayes, 1968).
Land movements associated with the 1964 Alaska earthquake also support
this concept (Plafker, 1965).
The arcuate Alaskan form thus may be the result of a combination
of tectonic bending and formation under regional stress; however, the
complexities involved are obvious from the above discussion. The
question is far from being resolved, and Alaska is in a unique posi-

16
tion for interpretation of the tectonic history of the Arctic and
North Pacific regions. St. Amnand (1957) suggested that remanent
magnetization of appropriate rocks in Alaska be measured to see if
any rotation was indicated. Chantry-Price (1967) attempted a pre-
liminary study of the Alaskan orocline by collecting rocks of
different ages at six sites. Due to questionable stability of the
samples collected or an intensity too small to measure successfully,
his results were inconclusive. The results of a more detailed study
are presented here.

II. PALEOMAGNETIC APPROACH
REIANENT i:AGNETIZATION
Rocks containing magnetic minerals may acquire a remanent magne-
tization known as natural remanent magnetization or NRM. Minerals
having ferrimagnetic properties at normal temperatures lie predomi-
nantly within the FeO-TiO2 -Fe 2 03 ternary system but also include
minerals such as the pyrrhotites and various oxyhydroxides of iron.
Irving (1964), Nagata (1961), Strangway (1970), and others discuss
the magnetic properties of rocks in great detail.
Rocks may obtain an NRM through thermal, chemical, or mechanical
processes or through some combination of these. Rocks become magne-
tized in the direction of the ambient magnetic field as the rock's
constituent magnetic minerals cool through their respective blocking
temperature or Tb . This process is called thermo-remanent magneti-
zation or TRM, and is generally very stable. Thus, for igneous rocks,
the geomagnetic field present at the time of formation is 'frozen' in
by TRM. A metamorphic event with temperatures above Tb also records
the geomagnetic field. Tb is determined mainly by particle size,
crystal structure, and composition (Nagata, 1961).
Chemical remanent magnetization or CRPM is also important in
recording field directions. This type of NRMK is the result of either
the formation of new magnetic minerals or recrystallization of
existing minerals at temperatures below their blocking temperatures.
As the mineral grains grow through their blocking diameter (Irving,
1964) they obtain an NRM parallel to the ambient field.
17
Another low-temperature NRM is viscous remanent magnetization, or
VRM. At the expense of previously acquired TRM or CRM, the magnetic
vector in minerals with a low coercivity and/or a short relaxation
time may change direction to become aligned with a changing geomagnetic
field. For most rock types VRM only affects 2 or 3% of TI during
periods up to 109 years, except at elevated temperatures (Nagata,
1961). Both CRM and VRM are often regarded as secondary magnetization
or 'noise' on top of the primary TRM, and various techniques can be
used to separate, eliminate or reduce their effects.
A mechanical process by which sedimentary rocks may acquire an
NRM is called detrital remanent magnetization, or DRM. Small magnetic
particles become oriented by the geomagnetic field as they settle and
are eventually consolidated into the sediment. Even though mechanical
interactions--such as shape, relative size, water velocity, and com-
paction--have an effect, experiments with different types of sediments
in still, running, and turbulent water, and tests on natural sediments,
have shown that the accuracy with which sediments record the ambient
magnetic field is good. Nagata (1961) and Irving (1964) explore DRM
in detail and have shown the existence of two types of error--an incli-
nation error, and an error due to the slope of the original bedding.
These errors may result in an inclination that is generally 20 degrees
less than that of the geomagnetic field (Nagata, 1961). However, con-
sistency tests on slumped beds in sediments, such as fine-grained
sandstone or coarse-grained siltstone, in which the magnetic particle
size was relatively smaller (at least by a factor of 2) than the
sediment particle size, have shown inclination errors to be extremely

19
small. This is believed to be a result of the magnetic minerals
aligning themselves within the interstitial spaces until compaction
and cementation locks them in place. The error caused by compaction
in most cases has been found to be small. Errors in declination are
easily averaged out.
Since secondary effects such as weathering, metamorphism, heat-
ing or VRM can alter the primary NRM, a stability check is generally
made before using magnetic data. Successively higher alternating
field (AF) demagnetization and successively higher temperature (ther-
mal) demagnetization techniques are widely used. Both methods deter-
mine the magnetic stability by measuring the resistance of NRI to
heat and magnetically induced changes. Collinson et al. (1967),
Nagata (1961), and Irving (1964) describe both methods.
PALEOMAGNETISM
Paleomagnetism is based on the use of NRM in various rock types
throughout the geologic past. Oriented samples are collected from
in situ outcrops, and the direction of the NEI vector is measured.
A number of samples from the same outcrop should be averaged to
mean out random errors in both the collection and measurement pro-
cesses, and the way in which the rock has recorded the geomagnetic
field. This NRM direction serves as a "spot" reading of the geomag-
netic field.
A basic assumption of paleomagnetism is that the average geomag-
netic field is that of a geocentric axial dipole (Briden, 1968; Creer,
1967; Runcorn, 1959a, b; Opdyke and Henry, 1969; and others). The

20
position of a geocentric dipole axis is easily calculated from a
magnetic vector at a given site, using the basic equation
tan I = 2 tan X
where I is the vector inclination and X is the paleolatitude. This
pole, calculated from a spot paleomagnetic reading, is called a
virtual geomagnetic pole, or VGP (after Cox and Doell, 1960), because
it probably does not represent a true pole. If the secular variation
component of the earth's field (which can be averaged in about 104
years) is taken into account, by averaging poles from rock units
that span at least 104 years-, the pole positions are called paleo-
magnetic poles (Irving, 1964) and probably represent true poles.
Statistical treatment is required because of the dispersion of
paleomagnetic directions which can be the result of a variety of
factors--such as secular variation, wandering of the rotational axis
of the earth, magnetic reversals, and errors both experimental in
nature and related to the acquisition of NRM. Excellent summaries
of paleomagnetic dispersions and their relative importance are given
by Doell and Cox (1963), Bingham (1971), Irving (1964), and others.
Paleomagnetic data which are assumed to have a Fisherian, or
'spherical normal' distribution (Fisher, 1953), can be treated by
statistics that deal with the directions of unit vectors, i.e. points
on a unit sphere. A set of statistical parameters, which have become
nearly standard within the literature, make possible the treatment of
paleomagnetic data (Irving, 1964; Bingham, 1971; and others). The
(N-1)best estimate of precision is k (N-R) where R is the length of the
sum of N unit vectors whose directions correspond to the data points

21
on the sphere. The radius of the circle of confidence at the 95%
level around the mean is
os1 -R 1 N-i 140
95 R 1-.95 -1
TECHNIQUES
The methods and equipment used to collect and measure the
samples for this study are similar to those used by others and are
described in the literature (Collinson et al., 1967). The par-
ticular methods and equipment used in this study are described by
Cameron (1970), Cameron and Stone (1970), and Bingham (1971).
Cores, 2.54 cm in diameter, were drilled by a gas powered
backpack drill which drives a stainless steel shaft tipped by
diamonds set in a phosphor-bronze matrix. Doell and Cox (1967)
describe a similar drill. While still attached to bedrock, the core
is fitted with a slotted copper tube through which a fiducial line
is inscribed with a brass wire. The fiducial line is oriented with
respect to magnetic north, topographic features, the sun, and the
horizontal from a moveable platform at the top of the tube which
has an inclinometer and mounts for both a Brunton compass and a sun
compass.
The cores, cut into 2.1 cm discs and marked, were measured in
either a 5 Hz spinner magnetometer (Foster, 1966) or a 5 Hz Schonstedt
Model SSM-IA spinner magnetometer, which has a sensitivity of 10- 9
emu. Errors due to orientation in the field and positioning in the
spinner magnetometer are thought to average less than 2 degrees
(Doell and Cox, 1963). Measurement error is less than 5 degrees.

22
Cores were collected in groups, referred to here as sites, with
an attempt to collect three cores or more from a stratigraphic level,
and to sample as many levels as time and conditions permitted. The
spacing laterally within a site was usually at least 100 feet, and
geographic spacing was achieved where possible by collecting at more
than one site, separated by more than one quarter mile, within the
same rock unit. The number of cores collected per site, depending
largely on logistic circumstances, numbered usually ten or more but
never less than six, as per Doell and Cox (1963). Generally samples
from a single rock unit at a given area were treated together,
statistically unweighted, if the individual sites were one mile or
less from each other. When the sites within the same rock unit from
the same sampling area have a separation of greater than one mile,
the samples were treated statistically unweighted within the site,
and the site means were then used in comparison with other areas
(Irving, 1964). Treatment to the contrary is noted within the
description of individual areas. Cores were taken only from in situ
outcrops and at least one quarter mile from faulting, in an attempt
to avoid local rotation, although in many areas in Alaska geologic
mapping or exposure is insufficient to assess this properly.
The samples, tumbled about two mutually perpendicular axes in
field free space, were subjected to sucessively higher levels of
alternating (60 Hz) field (AF) demagnetization for magnetic 'cleaning'
and as a stability test. Low-field bulk susceptibility measurements
for the samples were also made with a total and anisotropic suscep-
tibility meter (Collinson, et al., 1.963; Cameron, 1970; Cameron and
Stone, 1970).

23
Magnetic vector measurements, bedding orientations, and orien-
tation calculations were used to calculate final magnetic direction
and VGP on an IBM 360/40 electronic digital computer. Statistical
parameters were calculated on the same computer, and the results
were hand plotted on a Wulff stereographic projection.
APPLICATION TO STRUCTURAL PROBLEMS
Irving (1964) describes many applications of paleomagnetism
to structural problems, including detection of relative rotation
about a vertical axis. This rotation may be on the local fault block
or regional oroclinal scale, and is detected from the divergence of
declinations between two different areas of the same age. Of course,
the method is dependent upon the accuracy with which the declination
is measured. Irving (1964) points out that 6D = a9 5 sec I. Thus,
when the inclination is steep, the declination is poorly defined.
In several areas where oroclinal bending has been postulated
on geological grounds, paleomagnetism has shown rotation of a
similar magnitude. Geologic and paleomagnetic evidence together
suggest that Japan underwent an early Tertiary bending of 58 degrees
(Irving, 1964). Divergent declinations on the Eocene Siletz River
volcanics of Oregon compared to the Eocene Green River Formation of
Colorado, indicate a 63 degree clockwise rotation between the two
areas (Irving, 1964). This rotation corresponds to the rotation
required in the formation of the Mendocino orocline postulated by
Carey (1958). A 35 degree counterclockwise rotation of Spain, the
result of the formation of the Biscay sphenochasm, was postulated

24
by Carey (1958) to have taken place since the Mesozoic. Carey based
his idea largely on fit; however rotation of this amount brings
declinations of Permian formations from Spain into agreement with
those from Northern Europe (Irving, 1964).
The technique used in this study will consist of both a comparison
of the declinations from sites throughout Alaska and an analysis of
the VGP's of North America, Asia, and Europe, with respect to Alaska.
A systematic change in declination would be the only acceptable proof
of oroclinal bending. On the other hand, a lack of significant
change would mean no bending or one too small to be detectable with
these data. - Scattered declinations could be the result of local
fault block rotation or one or more of the undetected factors that
affect NRI as discussed above, and would be inconclusive.
The VGP for Alaska will give its latitude with respect to the
north pole assuming the geocentric axial dipole. By comparison with
the equivalent North American pole position,. Alaska's relative
latitude with respect to North America can also be determined, as
can the relationships between Asia, Europe, and North America.

III. MESOZOIC PALEOMAGNETIC RESULTS FROM ALASKA
ALASKA PENINSULA
Over 260 samples were collected at 21 different sites from the
Chignik Lake, Chignik Lagoon, Puale Bay, Cape Kekurnoi, Katmai, and
Tuxedni Bay areas on the Alaska Peninsula (Fig. 3-1). Rocks of
Permian, Triassic, Jurassic, and Cretaceous ages were represented.
The majority of the samples were sedimentary rocks with fossil age
control, but some K-Ar dated intrusive rocks were also collected.
Geologic setting of the Alaska Peninsula
The largest part of this geologic summary was taken from C. A.
Burk's G.S.A. Memoir 99, Geology of the Alaska Peninsula-Island Arc
and Continental Margin (1965), which includes an excellent biblio-
graphy of previous geologic work on the Alaska Peninsula.
Permo-Triassic detrital volcanic rocks, extrusive flows, and
limestones are exposed at various localities along the Alaska Penin-
sula, and smaller amounts of sandstones, argillites, slates, and
graywackes occur locally. These rocks, part of which are metamor-
phosed, constitute the oldest rocks on the Alaska Peninsula, and
appear to be at least 10,000 feet thick.in the Puale Bay region.
Their age is determined, due to lack of fossil control, from their
relationship to the 1500 feet of overlying late Triassic limestone
and chert.
The volcanic-rich rock units of early Jurassic age conformably
overlie the late Triassic strata. Along the southern coast of the
25
ALASKA PENINSULA
AND
COOK INLET REGION o-
MILES50 0 50 100 150
KILOM ERS 00 2 0
KTM
Co"
\ " 0
-S8
KODIK
e Boy
, - "sLANDS p 1 " \
Figure 3-1. Location map for place names and sampling localities on theAlaska Peninsula and in the Cook Inlet Region.

27
Alaska Peninsula the fossiliferous early Jurassic consists of tuffa-
ceous sandstone, calcareous sandstone and shale, limestone, and
volcanic conglomerate grading upward to fine-grained shales and
sandstones. Inland, porphyritic flows (latite to basalt), breccias,
and tuffs form up to 8000 feet of section, and from their strati-
graphic position are presumed to be of early Jurassic age.
A very complete section of middle and late Jurassic sedimentary
rocks is well-exposed in the Tuxedni Bay region, and conformably
overlies the early Jurassic. Part of this section, the Tuxedni
group, is composed of siltstones, arkoses, graywacke sandstones,
conglomerates, massive sandstones, and shales, and has been divided
into six formations (Detterman and Hartsock, 1966). Conformably
overlying the Tuxedni group, the Chinitna Formation--massive to
thinly bedded siltstone, ellipsoidal limestone concretions and
sandstone--is divided into two members (Detterman and Hartsock, 1966).
A total of at least 10,000 feet of the combined Tuxedni group and
the Chinitna formation are exposed at Tuxedni Bay. Further south-
west along the Peninsula, early Jurassic formations occur only
locally, leaving only the late Jurassic.
The upper Jurassic Naknek Formation conformably overlies the
Chinitna Formation, and is composed of a basal conglomerate, arkosic
sandstone, and siltstone. Exposed the entire length of the Alaska
Peninsula, the Naknek Formation forms a distinctive marine rock type
that reaches its maximum thickness of 10,000 feet in the Wide Bay
area. Southwest of Wide Bay the late Jurassic-early Cretaceous
Staniukovich Formation conformably overlies the Naknek. The Stan-

28
iukovich Formation, composed of fine-grained feldspathic sandstones
and arkoses, reaches a maximum thickness of 2000 feet in the Wide
Bay area and thickens and thins irregularly to the southwest. In
the Cape Douglas area the Staniukovich is conformably overlain by the
lower Cretaceous Herendeen limestone.
The sedimentary section on the southeastern shore of the Alaska
Peninsula, from the middle Jurassic through the early Cretaceous,
represents sediments deposited in a rapidly subsiding area close to
an eroding granitic source. The Aleutian Range batholiths of Jurassic
age (Reed and Lanphere, 1969) separated from the sedimentary sequence
by the Bruin Bay fault appear to have served as the source area. The
Bruin Bay fault, a high-angle reverse fault upthrown on the northwest
side, uplifted the granitic body relative to the Jurassic sediments.
On the basis of the sedimentary record, the fault must have become
active in the mid to late Jurassic time. The Jurassic batholiths,
although not exposed southwest of Wide Bay, must now be covered by
Tertiary and Quaternary age rocks, because the sedimentary sequence
contains a record of granitic erosion similar to that northeast of
Wide Bay. Similarly, the Bruin Bay fault is not exposed southwest
of Becharof Lake.
Uplift and minor deformation must have occurred on the Alaska
Peninsula in the mid Cretaceous, because all late Cretaceous rocks
rest unconformably on early Cretaceous rocks. The late Cretaceous
Chignik Formation, exposed irregularly southwest of Wide Bay, is
composed of 1250 feet of a thick basal coal member and 2000 feet of
argillaceous sandstone and siltstone. The Hoodoo Formation confor-

29
mably overlies the Chignik Formation and consists of 2000 feet or
more of siltstone and shale. The Kaguyak Formation exposed at Cape
Douglas is equivalent, in age and composition, to the Hoodoo Formation.
The Tertiary is characterized by an almost complete rock record,
consisting largely of basaltic and andesitic flows, sills and their
sedimentary debris. Paleocene rocks lie with a slight unconformity
on the upper Cretaceous or older rocks, indicating that the Alaska
Peninsula underwent minor uplift and erosion. From Wide Bay south-
west to Pavlof Bay, 5000 feet of non-marine volcanic siltstones and
interbedded flows and sills, called the Tolstoi Formation, were
deposited during the Paleocene and early Eocene. The Oligocene
Stepovak Formation, 15,000 to 20,000 feet of volcanic sandstone and
conglomerate, conformably overlies the Tolstoi and is exposed south-
west of Port Moller. Its age equivalent, the Meshik Formation,
consists of 5000 feet of coarse volcanic debris, and extends from
Port Moller to Wide Bay. In many areas it is impossible to separate
the Stepovak and Tolstoi Formations; the combined Paleocene through
Oligocene section has been called the Beaver Bay Group. The Miocene
Bear Lake Formation, composed of 5,000 feet of marine and non-marine
volcano-clastic material with chert and a basal conglomerate member
locally, unconformably overlies the Stepovak Formation. The Bear
Lake Formation is exposed from Aniakchak Crater southwest to the tip
of the Peninsula.
During earliest Tertiary time a quartz diorite body was intruded
into upper Cretaceous slate and graywacke on Kodiak Island. This
perhaps corresponds to the slight uplift in the early Paleocene. The

30
slight deformation and uplift in late Oligocene-early Miocene time is
thought to correspond to the intrusion of a mid Tertiary granodiorite
body along the Pacific coast of the Alaska Peninsula.
The deformation responsible for most of the anticlinal and syn-
clinal folding, and the local faulting associated with the anticlinal
complexes, culminated in the Pliocene. From Kamishak Bay northeast
along the west coast of Cook Inlet, a narrow strip of land southeast
of the Bruin Bay fault has undergone tight anticlinal folding and
three types of minor faulting (Detterman and Hartsock, 1966). Detter-
man and Hartsock (1966) describe cross faults, both normal and reverse,
oblique to the trend of the Bruin Bay fault. These are thought to be
due to differential uplift and stresses involved in the movement along
the Bruin Bay fault. Hinge faults that have minor rotational move-
ment, and normal faults that generally parallel the Bruin Bay fault,
are present but do not create any major offsets.
From Kamishak Bay southwest to Becharof Lake folding is reduced
to a broad anticline, the Kamishak anticline, and minor gentle folds
that have a general homoclinal dip toward Shelikof Strait. Northwest
of the Bruin Bay fault folding is local and generally restricted to
early Mesozoic age rocks, and is thought to be due to the intrusion
of the Jurassic Aleutian Range batholiths.
Southwest of Becharof Lake the style of folding changes. Three
long anticlinal arches can be seen: one from Puale Bay to Aniakchak
Crater area; one from Chignik Bay to Stepovak Bay; and one from Port
Moller to Cold Bay. All are broad features with two anticlines and
minor high-angle reverse faults on the southern margin.

31
Volcanism has continued from the Pliocene to the present, and is
continuing along the length of the Alaska Peninsula. Quaternary and
recent flows and associated pyroclastic material, glacial material,
and stream deposits, make up the recent rock record on the Alaska
Peninsula.
Sites on the Alaska Peninsula
Chignik Lake (CHL)
Fifty-two cores from the Upper Jurassic Naknek Formation were
collected at five sites along the northeast shore of Chignik Lake.
These sites are separated geographically by approximately four miles.
It is difficult to estimate the total number of stratigraphic feet
represerted by all five sites; however, each site represents at least
10 stratigraphic feet. The samples collected consist of fine- to
coarse-grained sandstone, composed of sub-angular quartz, plagioclase,
biotite, opaques, and rock fragments of granitic, volcanic, and meta-
morphic rocks. The beds for the three sites at the northwest end of
the lake have a 5 to 15 degree dip to the northeast, and the two sites
at the southeast end of the lake have dips of 10 degrees to the south-
west and southeast, respectively.
The vector directions and pole positions for CHL-1 to 5 at NRM
and demagnetization levels are given in Table 3-1, and are shown in
Figures 3-2 to 3-6. The mean NRM P (with respect to the present
horizontal) direction does not lie along the present axial dipole
field direction. An AF level of 95 oe caused a slight shift in the
position of the mean and probably removed any VRM components or
32
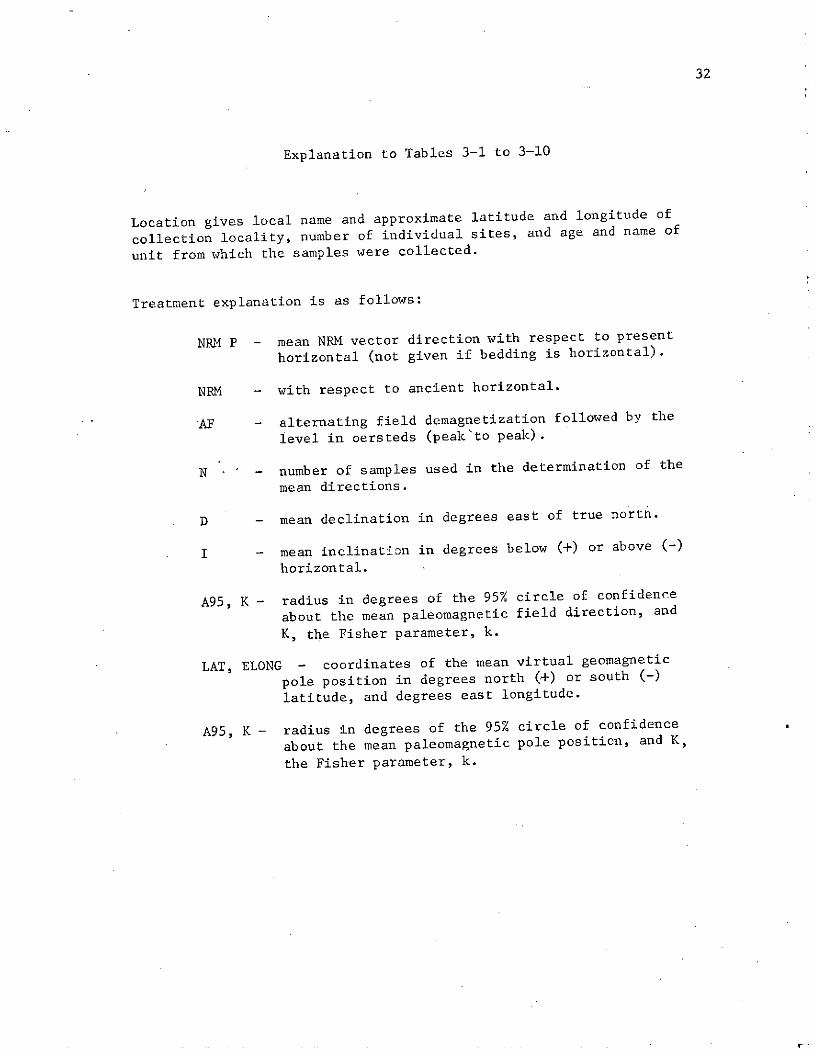
Explanation to Tables 3-1 to 3-10
Location gives local name and approximate latitude and longitude of
collection locality, number of individual sites, and age and name of
unit from which the samples were collected.
Treatment explanation is as follows:
NRM P - mean NRM vector direction with respect to present
horizontal (not given if bedding is horizontal).
NRM - with respect to ancient horizontal.
AF - alternating field demagnetization followed by the
level in oersteds (peak'to peak).
N - - number of samples used in the determination of the
mean directions.
D - mean declination in degrees east of true north.
I - mean inclination in degrees below (+) or above (-)
horizontal.
A95, K - radius in degrees of the 95% circle of confidence
about the mean paleomagnetic field direction, and
K, the Fisher parameter, k.
LAT, ELONG - coordinates of the mean virtual geomagnetic
pole position in degrees north (+) or south (-)
latitude, and degrees east longitude.
A95, K - radius in degrees of the 95% circle of confidence
about the mean paleomagnetic pole position, and K,
the Fisher parameter, k.

TABLE 3-1
PALEOMAGNETIC DIRECTIONS AND POLE POSITIONS
DIRECTION POLE POSITIONLOCATION TREATMENT N D I A95 K LAT ELONG A95 K
CHL-1 - CHIGNIK LAKE, NRM P 10 26 60 10.6 21.5 67 322ALASKA
(56.3N,201.2E) NRM 10 18 69 10.7 21.5 78 285 16.5 9.5
1 SITE AF 48 OE 10 5 72 8.0 37.6 86 262 12.9 15.0UPPER JURASSICNAKNEK FM AF 95 OE 10 1 70 6.8 51.2 89 339 10.8 21.0
AF 190 OE 10 7 63 21.2 6.2 80 352 18.3 8.0
AF 380 OE 10 5 63 7.2 45.7 79 1 10.6 21.8
CHL-2 NRM P 10 54 60 14.2 12.6 52 292(56.3N,201.1E)
NRM 10 54 55 14.2 12.6 50 296 18.4 7.81 SITE
AF 48 OE 10 59 57 13.3 14.2 48 289 18.2 8.0
AF 95 OE 10 62 61 13.5 13.8 49 282 19.5 7.1
AF 190 OE 10 75 54 19.8 6.9 39 280 25.1 4.7
AF 380 OE 10 88 41 26.9 4.2 22 279 30.8 3.4
CHL-3 NRM P 11 32 61 16.4 8.7 65 313(56.3N,201.1E)
NRM 11 49 59 16.4 8.7 56 291 22.6 5.01 SITE
AF 48 OE 11 54 49 21.9 5.3 46 300 23.0 4.9
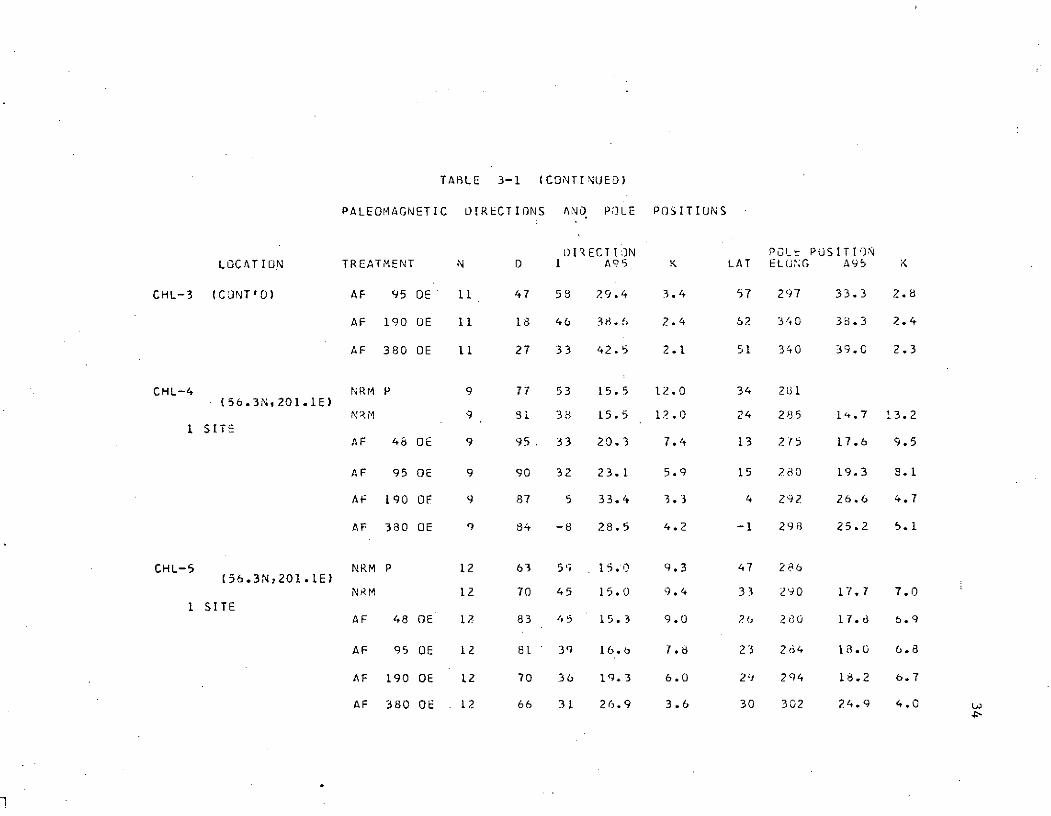
TABLE 3-1 (CONTINUED)
PALEOMAGNETIC DIRECTIONS ANO POLE POSITIONS
DIRECTIJN POLt PUSITIONLOCATION TREATMENT N D I A95 K LAT ELU;G A95 K
CHL-3 (CONT'O) AF 95 OE 11 47 58 29.4 3.4 57 297 33.3 2.8
AF 190 OE 11 18 46 38.6 2.4 62 340 33.3 2.4
AF 380 OE 11 27 33 42.5 2.1 51 340 39.0 2.3
CHL-4 NRM P 9 77 53 15.5 12.0 34 281(56.3N,201.1E)
NRM 9 s8 38 15.5 12.0 24 285 1',.7 13.21 SITE
AF 48 OE 9 95. 33 20.3 7.4 13 275 17.6 9.5
AF 95 OE 9 90 32 23.1 5.9 15 280 19.3 8.1
AF 190 OF 9 87 5 33.4 3.3 4 292 26.6 4.7
AF 380 OE 9 84 -8 28.5 4.2 -1 298 25.2 5.1
CHL-5 NRM P 12 63 59 15.0 9.3 47 286(56.3N,201.1E)
NRM 12 70 45 15.0 9.4 33 290 17.7 7.01 SITE
AF 48 OE 12 83 45 15.3 9.0 26 2t80 17.6 6.9
AF 95 OE 12 81 39 16. 7.8 23 264 18.0 6.8
AF 190 OE 12 70 36 19.3 6.0 29 294 18.2 6.7
AF 380 OE 12 66 31 26.9 3.6 30 302 24.9 4.04-

35
Explanation to Figures 3-2 to 3-16, 3-18 to 3-22, and 3-24
Paleomagnetic data for the particular sampling locality are shownaccording to the following notation:
NRM P - Mean NRM vector direction with respect topresent horizontal (not given if bedding ishorizontal).
NRM - NRM magnetic vector directions of thesamples and their mean, with respect toancient horizontal.
M x 10-6 emu/cm - Magnetic intensity vs. alternating field
demagnetization level (oersteds, peak topeak), and the corresponding change indirections of magnetization for pilot samplesduring AF demagnetization.
Demagnetization - Mean vector direction after AF demagnetizationat the indicated level (oersteds, peak topeak). This vector direction and its cor-responding VGP (not shown) are used in theanalysis of results presented in Chapter IV.
Plots are shown on Wulff stereonets with solid circles indicating lower(+) hemisphere and open circles indicating upper (-) hemisphere.
A hexagon, solid or open as above, indicates the mean vector directions;a circle of radius a 9 (except where noted) is drawn about the mean.Mean data are from re evant table.
X gives the position of the present axial dipole field.

36
N N
-(a) "(b)
1500- - 3
MI68
S1000 I
MI170
1 (d)
50o- (e)
Mi 70
M168
1000 oe 2000(c)
Figure 3-2. Paleomagnetic data for CHL-1, Chignik Lake, Alaska.(a) NPW P. (b) NRM. (c) Magnetic intensity and (d)directions of pilot samples during AF demagnetization.(e) After demagnetization at 95 oe.
37
a- )
. MI86 -
400 - (d)
200-
(c)
MI~ + I-l----- MI8
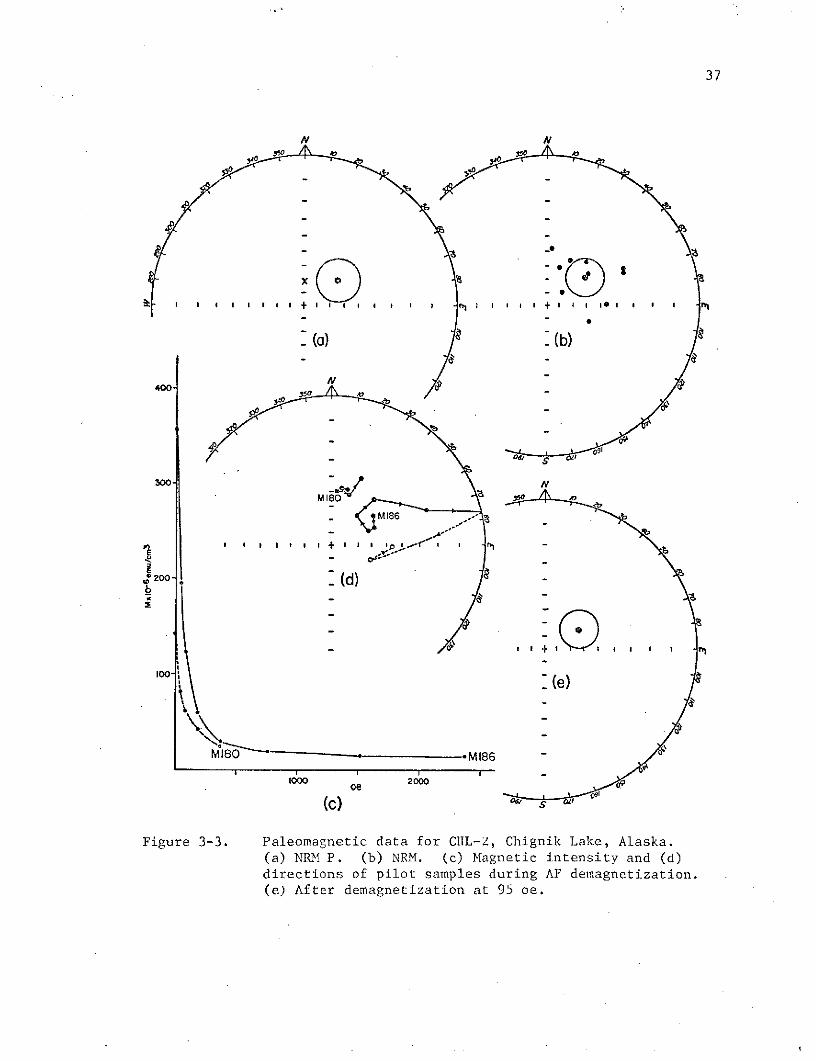
Figure 3-3. Paleomagnetic data for C1IL-Z, Chignik Lake, Alaska.(a) NI P. (b) NRM. (c) Magnetic intensity and (d)
directions of pilot samples during AF demagnetization.
(e) After demagnetization at 95 oe.

38
(a)
-<ooM195
S(e)
M 195
M 192
) oe 400
(c) s
Figure 3-4. Paleomagnetic data for CIIL-3, Chignik Lake, Alaska.
(a) NRM P. (b) NRM. (c) Magnetic intensity and (d)
directions of pilot samples during AF demagnetization.
(e) After demagnetization at 95 oe.

39
NN
(a) :(b)
4000050
I I I t I I
- MI99
0oo- (e)SS
0 20 M 204
oe 09(c)
Figure 3-5. Paleomagnetic data for CHL-4, Chignik Lake, Alaska.(a) NRM P. (b) NRM. (c) Magnetic intensity and (d)directions of pilot samples during AF demagnetization.(e) After demagnetization at 95 oe.

40
N N
I I I -(a)(a) . (b) *
M 2090
I I I I , - . -
200 400 9
(c)
Figure 3-6. Paleomagnetic data for CHIL-5, Chignik Lake, Alaska.
(a) NRM P. (b) NRM. (c) Magnetic intensity and (d)
directions of pilot samples during AF demagnetization.
(e) After demagnetization at 95 oe.
41
secondary magnetizations present. Demagnetization in successively
higher alternating fields up to 380 oe only slightly changed the mean
directions of magnetization but increased the scatter, due in part to
the increasing 'noise' level as the intensity decreases. Above 380 oe
up to 2380 oe, the directions became extremely scattered and three
samples became reversed. Intensity curves for AF demagnetization
levels are shown in Figures 3-2 to 3-6. Mean of the NRM intensity for
CHL-1 to 5 is 560 x 10- 6 emu/cm , and the mean susceptibility is
3000 x 10- 6 emu/cm 3 . The scatter of CHL-3 after demagnetization at
an AF of 95 oe is large, but the other sites after the same treatment
are a good representation of the upper Jurassic VGP.
Chignik Lagoon (CHG)
On the northwest shore of Chignik Lagoon, on both sides of Dago
Point, 21 samples were collected from the Chignik Formation of upper
Cretaceous age. These samples represent approximately 10 strati.
graphic feet per site, and are from two sites about one mile apart.
At the northeast site, CHG-1, a very fine-grained sandstone composed
of angular quartz, orthoclase, biotite, chlorite, opaques, and plagio-
clase in an argillaceous matrix was sampled. The southwest site,
CHG-2, is a fine-grained carbonaceous sandstone, composed of quartz,
plagioclase, biotite, epidote, and opaques in an argillaceous matrix.
The beds dip southeast at 15 degrees. A stratigraphic section for
this area has been described by Keller and Cass (1956). CHG-l is one
quarter of a mile south of a dip-slip fault which is upthrown on
the north.
42
CHG vector directions and pole positions are given in Table 3-2
and shown in Fig. 3-7. CHG-2 had a mean NRM P that was nearly parallel
to the present axial dipole field direction, and a demagnetization at
48 oe removed a present field component from the mean vector direction.
Although the mean NRM positions for CHG-1 and 2 were divergent, after
demagnetization their mean vector directions converged. Thus CHG-1
and 2 can be treated as a single site. Four of the vector directions
were significantly different from the mean (>600) and were omitted
from the final mean. This had negligible effect on the position of
the mean, but considerably improved the precision. The NRM intensity
of the rocks averaged 6 x 10- 6 emu/cm 3 , and after demagnetization at
48 oe was too weak to demagnetize further. The mean susceptibility
for these samples was 70 x 10- 6 emu/cm 3 . Thus it would seem that
although the samples' intensity was weak, their mean vector direction
is a fair approximation of the VGP during the upper Cretaceous.
Puale Bay (PLB)
From the upper Triassic limestone exposed near the entrance on
the northeast shore of Puale Bay, 53 cores were collected at two
different sites about a half-mile apart. PLB-1 represents over 100
feet of section, including 50 feet of volcanic agglomerate, and
PLB-2 about 25 feet of section. The beds at PLB-1 dip nearly west
at approximately 13 degrees, and PLB-2 has beds dipping west-south-
west at 22 degrees. The limestone consists of round aggregates of
calcium carbonate and opaques, probably hematite, in an argillaceous
matrix.
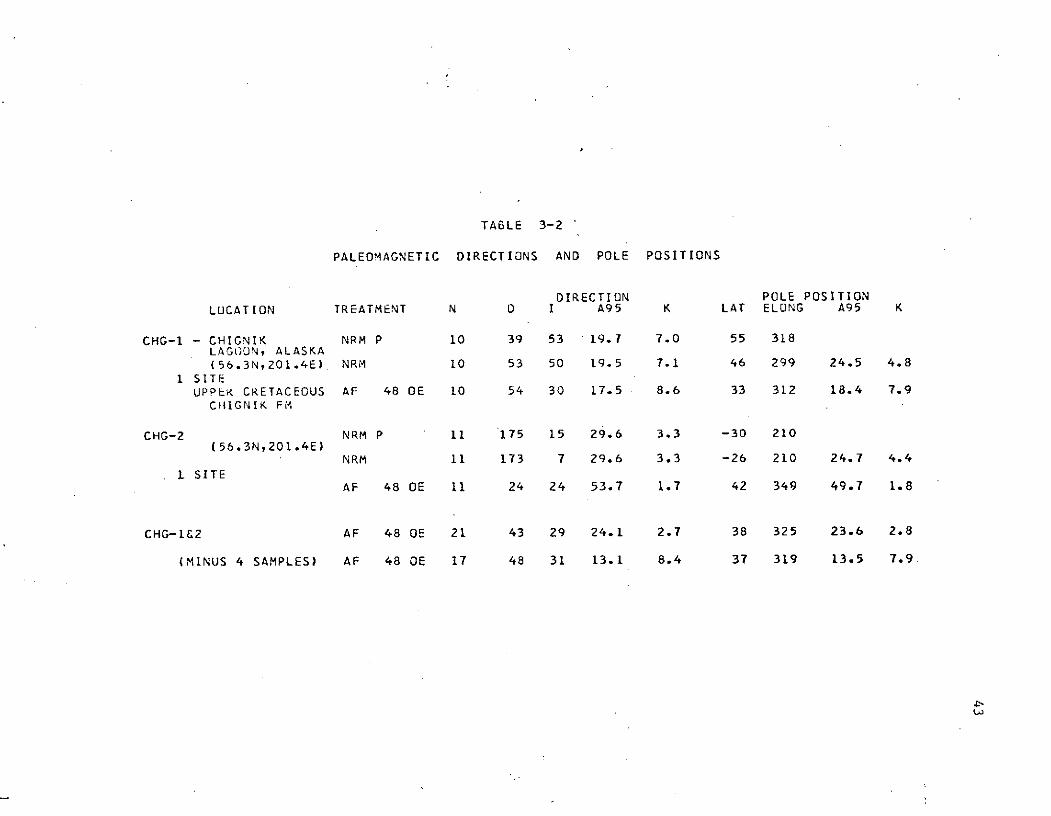
TABLE 3-2
PALEOMAGNETIC DIRECTIONS AND POLE POSITIONS
DIRECTION POLE POSITIONLOCATION TREATMENT N D I A95 K LAT ELONG A95 K
CHG-1 - CHIGNIK NRM P 10 39 53 19.7 7.0 55 318LAG UN, ALASKA(56.3N,201.4E) NRM 10 53 50 19.5 7.1 46 299 24.5 4.8
1 SITEUPPER CRETACEOUS AF 48 OE 10 54 30 17.5 8.6 33 312 18.4 7.9
CHIGNIK FM
CHG-2 NRM P 11 175 15 29.6 3.3 -30 210(56.3N,201.4E)
NRM 11 173 7 29.6 3.3 -26 210 24.7 4.4
1 SITEAF 48 OE 11 24 24 53.7 1.7 42 349 49.7 1.8
CHG-1&2 AF 48 OE 21 43 29 24.1 2.7 38 325 23.6 2.8
(MINUS 4 SAMPLES) AF 48 OE 17 48 31 13.1 8.4 37 319 13.5 7.9
4-h

44
N N
(b) -. .
0
(a) CHG-I
- o CHG-2CHG-2 o
L0 0
S0-
M 161 ° ' ,
(c)
_48.. ._
(C) . d ' oFigure 3-7. Paleomagnetic data for CHG, Chignik Lagoon, Alaska.
(a) NRF P. (b) NRM. (c) Magnetic intensity and (d)directions of pilot samples during AF demagnetization.(e) CHG-1 and 2 after demagnetization at 48 oe.

45
The vector directions and pole positions for PLB are given in
Table 3-3, and plotted in Figure 3-8. The mean NRM P direction was
nearly parallel to the present axial.dipole field direction, and
demagnetization at 48 oe did not move this significantly. These
rocks had too small an intensity to demagnetize at a higher level.
For these limestones the mean NRI intensity was 0.3 x 10- 6 emu/cm3
and their mean susceptibility was 4 x 10- 6 emu/cm 3 . These results
are marginal and should be used only with reservation as an approxi-
mation of the upper Triassic VGP for this area.
Cape Kekurnoi (CPK)
A volcanic agglomerate of Permian age containing fragments of
volcanic glass, plagioclase, olivine, augite, and opaques, weill
cemented together by calcium carbonate, was collected about a fourth
of a mile north of Cape Kekurnoi (Fig. 3-1). The twelve cores
collected represent approximately 10 feet of stratigraphic section.
Bedding is horizontal.
The results from paleomagnetic measurements of the samples
collected at CPK are presented in Table 3-4 and Figure 3-9. The
mean NRM direction was significantly different than the present axial
dipole field direction. On demagnetization at an AF of 150 oe the
mean shifted; upon further demagnetization at an AF of 190 oe the
scatter was reduced and the position of the mean did not change.
The samples became unstable when they were demagnetized at an AF
of 380 oe. The mean NRM intensity was 150 x 10- 6 emu/cm3 and the
mean susceptibility was 1800 x 10- 6 emu/cm3 . Both the behavior of
the two pilot samples shown and the complete instability of the

TABLE 3-3
PALEOMAGNETIC DIRECTIONS AND POLE POSITIONS
DIRECTION POLE POSITIONLOCATION TREATMENT N D I A95, K LAT ELONG A95 K
PLB - PUALE BAY, NRM P 53 37 79 8.6 6.2 71 247ALASKA
(57.7N,204.6E) NRM 53 314 78 8.9 5.8 66 169 14.0 2.9
2 SITES AF 48 OE 53 325 82 12.8 3.3 69 181 18.7 2.1
UPPER TRIASSICLIMESTONE
0'
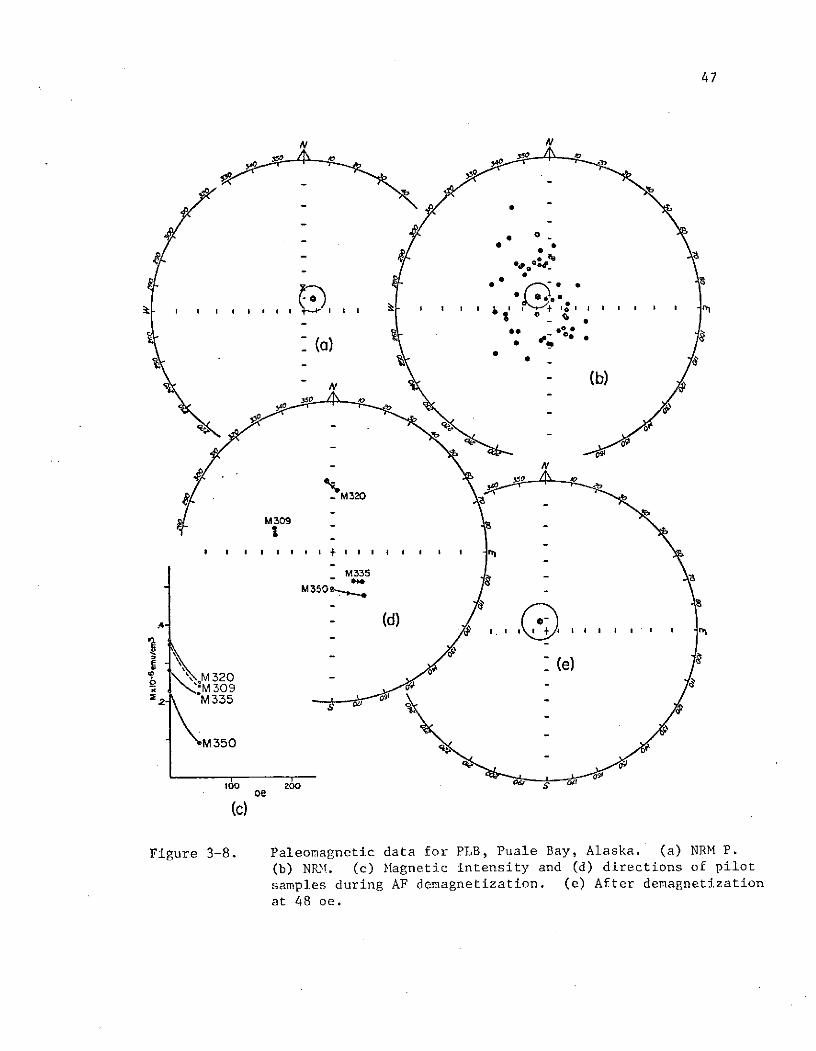
47
N
0
-ee
3 60*.. - (
t M 32 0 0
ce
()e)
(C)
(b) NRM. (c) Hagnetic intensity and (d) directions of pilot
samples during AF demagnetization. (e) After demagnetization
at 48 oe.

TABLE 3-4
PALEOMAGNETIC DIRECTIONS AND POLE POSITIONS
DIRECTION POLE POSITIONLOCATION TREATMENT N D I A95 K LAT ELONG A95 K
CPK - CAPE KEKURNOI, NRM 12 292 68 12.3 13.5 55 138 17.8 6.9ALASKA
(57.7N,204.7E) AF 150 OE 10 219 51 37.0 2.7 9 174 40.5 2.4
1 SITE AF 190 OE 10 234 57 15.9 10.2 18 162 21.8 5.9PERMIANVOLCANIC SEDS AF 380 OE 1' 207 28 74.9 1.4 -17 177 77.2 1.4
-

49
N
0-
(a)
M298
M300 p-, i i N
.(c
100-
S I (d)
M 298
M 300 s, o 200S oe 2
(b)
Figure 3-9. Paleomagnetic data for CPK, Cape Kekurnoi, Alaska.(a) NRM. (b) Magnetic intensity and (c) directions ofpilot samples during AF demagnetization. (d) Afterdemagnetization at 190 oe.

50
samples at an AF of 380 oe indicated a general instability of these
samples. The results though shown for the NRM and at an AF of 190 oe
must be considered to be marginal at best.
Katmai area (KTM)
Cores of the Jurassic Naknek Formation and Jurassic quartz
diorite batholith were collected in the Katmai area. Twenty-six
cores of gray fine-grained sandstone composed of quartz, plagioclase,
and opaques from the Naknek Formation were collected from the lower
part of the south flank of Mt. Katolinat. At this location the
Naknek is intruded by rhyolite dikes and a hornblende andesite sill,
with the sill crosscutting the dikes. The exact age of these intru-
sives is unknown, and the rocks are too altered to date by the K-Ar
method. Samples were taKen both of the intrusives (8 samples) and
from the Naknek Formation at three different sites, which have a
separation of approximately one-half mile and represent approximately
700 stratigraphic feet of section. The Naknek Formation dips at 3
degrees to the east-northeast throughout the section. Six cores of
the Naknek Formation were also collected on cliffs above Margot
Creek to the south-southeast of Mt. Katolinat. These samples repre-
sent approximately 10 feet of stratigraphic section in flat-lying
beds of fine-grained sandstone.
Twenty-seven samples of mid Jurassic (Reed and Lanphere, 1969)
quartz diorite were collected from the Aleutian Range batholith along
the shores of the Iliuk Arm of Naknek Lake. Two sites were on the
north shore, mid lake, at the base of Mt. La Gorce, and about 3 1/2
miles apart; and a third site is located on an island on the south

51
side of the lake, 7 1/2 miles from the entrance to Iliuk Arm. These
sites are a mile or more from the trace of a fault (the Bruin Bay
fault) that is upthrown on the northwest (Keller and Reiser, 1959).
Although no attitude was observed in the reconnaissance study of the
area made for this collection, it is assumed that the batholith has
not tilted or rotated significantly since its emplacement. This
assumption is probably correct considering that a part of the gentle
deformation of the sediments in this area is thought to have been
caused by emplacement of this batholith (Burk, 1965).
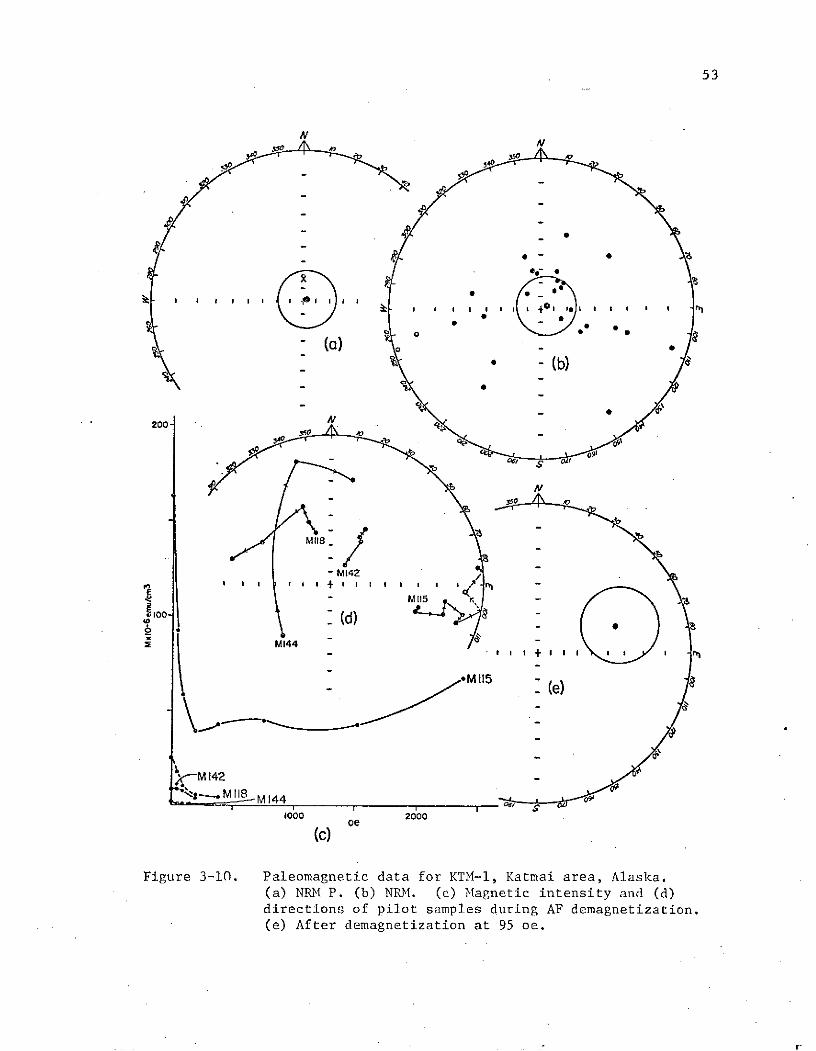
The results of NRM measurements and AF demagnetization are given
in Table 3-5 and Fig. 3-10 to Fig. 3-12. The 95% confidence limit
about the mean of NRM P for the samples from the three sites on
Mt. Katolinat included the present axial dipole field direction.
This mean (KTM-1) represents samples of the Naknek Formation only.
It appears that the intrusives had little or no effect on the surround-
ing sediments. Cores from the sediments were at least six feet from
the baked zone surrounding the intrusives. Demagnetization at an AF
of 48 oe removed most of the present field component but produced a
large scatter about the resulting mean. Upon demagnetization at an
AF of 95 oe, the scatter was reduced, but further demagnetization
at an AF of 142 oe created a nearly random distribution of directions.
The mean NRM intensity for these samples was 30 x 10- 6 emu/cm3 and
mean susceptibility was 90 x 10- 6 emu/cm 3 . Although the dispersion
is large the moderately stable results obtained after demagnetization
at an AF of 95 oe represent a tentative approximation of the upper
Jurassic VGP.

TABLE 3-5
PALEOMAGNETIC DIRECTIONS AND POLE POSITIONS
DIRECTION POLE POSITIONLUCATION TREATMENT N D I A95 K LAT ELONG A95 K
KTM-1 - KATMAI AREA, 26 69 87 21.3 2.8 60 215ALASKA(58.4N,204.6E) NRM 26 64 85 21.3 2.8 66 231 29.6 1.9
3 SITES AF 48 OE 24 38 12 46.8 1.4 28 332 41.1 1.5UPPER JURASSICNAKNEK FM AF 95 OE 24 72 34 21.8 , 2.8 29 301 21.8 2.8
KTM-2 NRM 6 354 72 15.3 20.1 89 86 23.5 9.1(58.4N,204.6E)AF 48 OE 6 288 50 9.2 54.3 37 118 9.9 47.11 SITE
UPPER JURASSIC AF 95 OE 6 286 52 10.6 41.0 37 120 12.1 31.5NAKNEK FM
AF 190 OE 6 288 47 12.0 31.9 34 115 11.3 36.2
AF 380 OE 6 278 37 13.8 24.4 22 119 12.2 30.9
AF 760 OE 6 272 27 15.9 18.7 14 120 13.4 26.1
AF 1520 OE 6 257 21 20.5 11.6 4 131 17.2 16.1
KTM-3 NRM 27 349 67 11.2 7.1 81 82 15.5 4.2(58.5N,204.5E)AF 190 OE 27 333 65 14.1 4.9 72 109 18.4 3.33 SITES
MID JURASSICGRANODIORITE
53
- -+0
(a)
200
-MI42
100- (d)
MMI1
° M115 (e)
M 142
oe
(e) After demagnetization at 95 oe.(e) After demanetization at 95 oe.

54
N
K I
(C(a)
E10-
oeK4
(b)
Figure 3-11. Paleomagnetic data for KTM-2, Katmai area, Alaska.(a) NRM. (b) Magnetic intensity and (c) directions ofpilot samples during AF demagnetization. (d) Afterdemagne tion at 95 oe.
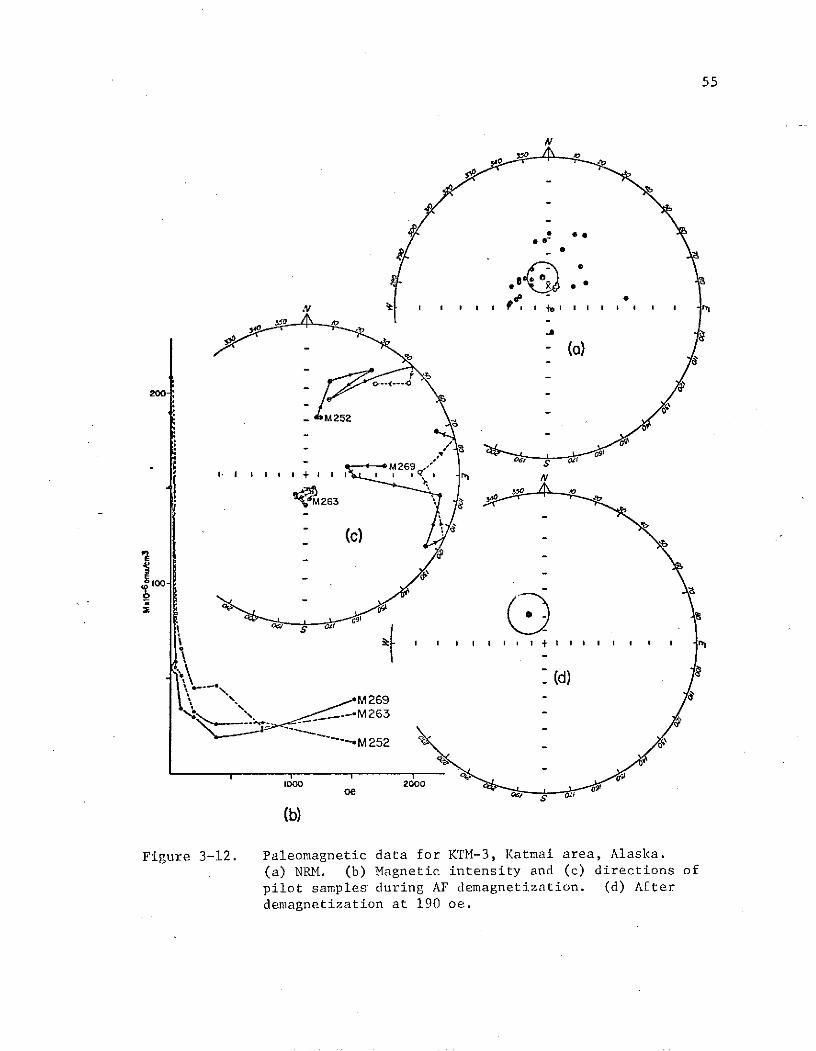
55
N
(a)
200-:
s- *------.
M252
I I I I ! > p i II
oe. d(b)
Figure 3-12. Paleomagnetic data for KTM-3, Katmai area, Alaska.
(a) NRM. (b) Magnetic intensity and (c) directions of
pilot samples during AF demagnetization. (d) After
demagnetization at 190 oe.
56
The mean of NRM measurements on samples from KTM-2 included
the present axial dipole field direction within its 95% confidence
limits. Demagnetization at an AF of 48 oe removed this present
field component and reduced the scatter. Subsequent demagnetiza-
tion at an AF of 95 oe, 190 oe, and 380 oe did not significantly
change the position of the mean. Demagnetization at an AF of 760 oe
and 1520 oe however displaced the mean significantly and increased
the scatter about it. Although the rocks did not have a particularly
high intensity--mean intensity 20 x 10- 6 emu/cm3 , and mean suscep-
tibility 275 x 10- 6 emu/cm3--the intensity decreased slowly on demag-
netization. Because the mean of the samples' magnetic direction
during demagnetization was apparently still moving the stability
of the samples are in question and the results must be considered
marginal.
Cores from the granodiorite had a mean NRM vector direction
coincident with the present axial dipole field direction. Demagne-
tization at an AF of 190 oe failed to shift it significantly away
from the present field direction. At an AF of 380 oe the samples
became unstable, probably due to a large viscous component indicated
by a lack of repeatibility of measurements. Although the a9 5
circle of confidence was fairly small after demagnetization at
190 oe, these results were unusable. (Their plots are shown, however,
for the sake of completeness.) These samples had a mean NRM intensity
of 310 x 10-6 emu/cm3 , and the mean susceptibility was 3000 x 10- 6
emu/cm 3

57
Tuxedni Bay (TXD)
At four sites, separated by approximately 16 miles, a total of
48 cores from the Naknek Formation, Tuxedni Group, Chinitna Formation
and quartz diorite, all of Jurassic age, were collected along the
shores of Tuxedni Bay. The first site (TXD-1), located across
Tuxedni Channel from Chisik Island, covers 80 stratigraphic feet of
section and ranges from fine to coarse-grained arkosic sandstone
composed of quartz, plagioclase, hornblende, biotite, opaques, and
fragments of granitic, volcanic and sedimentary rock, in a slightly
carbonaceous argillitic matrix. These 15 samples from TXD-1 are
from the tpper Jurassic Naknek Formation which dips toward the
east-southeast at 15 degrees.
Samples from the Red Glacier Formation of the middle Jurassic
Tuxedni Group were collected from the southwestern shore of Tuxedni
Bay, approximately 1 1/4 miles northwest of Fossil Point. The 14
samples from TXD-2 consist of calcareous fine-grained sandstone
composed of quartz, plagioclase, opaques, and shell fragments in a
carbonaceous argillitic matrix. Approximately 10 stratigraphic
feet were sampled in beds that dip at 15 degrees to the east-southeast.
At the third site, on the northeast shore of Tuxedni Bay less
than a quarter mile from the mouth of the Tuxedni River, 10 cores
of early Jurassic, 170 to 168 my (Reed and Lanphere, 1969), granodi-
orite were collected. Although no attitude was observed in the
reconnaissance study of the area made for this collection, it is
assumed that the batholith has not tilted or rotated significantly
since its emplacement. This assumption is probably correct, consider-

58
ing that a part of the gentle deformation of the sediments in this
area is thought to have been caused by emplacement of this batho-
lith (Burk, 1965).
Samples of the upper Jurassic Tonnie Siltstone Member of the
Chinitna Formation were collected on the westernmost tip of Chisik
Island. These 9 samples at TXD-4 are dense, calcareous fine-grained
siltstones containing shell fragments and occurring as lenticular
bodies in a coarser grained arenaceous siltstone. The samples came
from nearly 10 feet of section in beds that dip east-northeast at 12
degrees. Minor dip-slip faulting has been mapped throughout the
Tuxedni Bay area (Detterman and Hartsock, 1966); however, the samples
were collected at least one-fourth of a mile from any fault.
Results of measurements on cores from the Tuxedni Bay collection
locality are given in Table 3-6 and plotted in Figures 3-13 to 3-16.
The mean NRM P field direction for TXD-1 included the present axial
dipole field direction within its a95 circle of confidence; however
upon demagnetization at an AF of 95 oe the present field component
was removed. Demagnetization at still higher levels resulted in no
significant shift in the position of the mean but increased the
scatter. The mean NII intensity of the samples from TXD-1 was 280 x
10- 6 emu/cm , and the mean susceptibility was 3,800 x 10 emu/cm 3
Thus, despite a low-coercivity secondary component aligned along
the present field these samples are a good approximation of the
upper Jurassic VGP.
Results from TXD-2 showed the mean NRM P direction to be dis-
placed from the present axial dipole field direction. Although a

TABLE 3-6
PALEOMAGNETIC DIRECTIONS AND POLE POSITIONS
DIRECTION POLE POSITIONLOCATION TREATMENT N D I A95 K LAT ELONG A95 K
TXO-1 - TUXEDNI BAY, NRM P 15 15 67 11.1 12.9 77 341ALASKA
(60.1N,207.4E) NKM 15 48 64 11.1 12.9 60 296 14.3 8.1
1 SITE AF 95 OE 15 14 53 15.2 7.3 65 0 15.2 7.3UPPER JURASSICNAKNEK FM AF 190 OE 15 358 52 19.1 5.0 67 34 22.1 4.0
AF 380 OE 15 357 56 25.4 3.2 71 42 27.4 2.9
TXD-2 NRM P 14 239 38 14.4 8.6 5 154(60.2N,207.3E)
NRM 14 227 42 14.4 8.6 4 165 16.2 7.01 SITE
MID JURASSIC AF 95 OE 14 238 49 12.7 10.8 12 159 15.4 7.6TUXEDNI GROUPRED CLACIER FM AF 190 OE 14 242 45 16.3 6.9 12 155 17.9 5.9
AF 380 OE 14 244 43 16.3 6.9 10 153 18.8 5.4
TXD-3 NRM 10 51 52 12.1 17.0 48 314 15.2 11.1(60.3N,207.1E)
AF 95 OE 10 51 43 19.7 7.0 41 318 21.6 6.01 SITE
LOWER JURASSIC AF 190 OE 10 36 45 18.4 7.8 50 336 20.5 6.5QUARTZ DIORITE
AF 380 OE 10 35 28 23.3 5.3 39 343 22.9 5.4
'\0
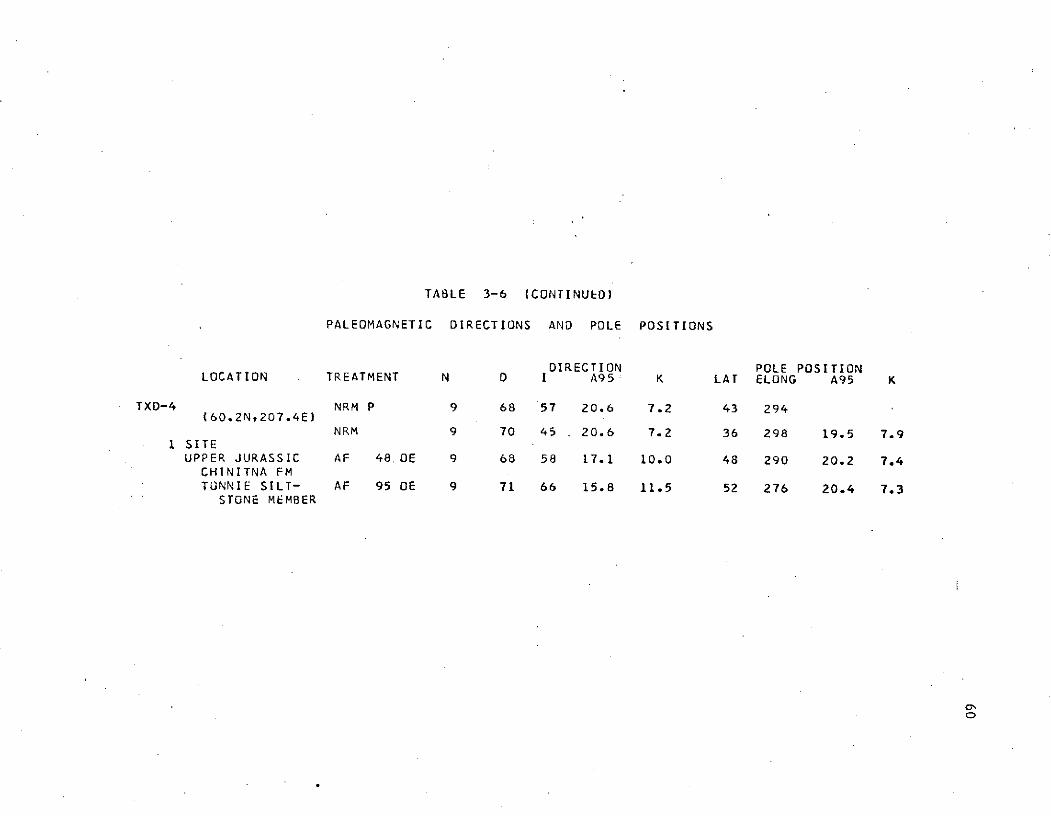
TABLE 3-6 (CONTINUED)
PALEOMAGNETIC DIRECTIONS AND POLE POSITIONS
DIRECTION POLE POSITIONLOCATION TREATMENT N D I A95 K LAT ELONG A95 K
TXD-4 NRM P 9 68 57 20.6 7.2 43 294(60.2N,207.4E)
NRM 9 70 45 . 20.6 7.2 36 298 19.5 7.91 SITEUPPER JURASSIC AF 48.OE 9 68 58 17.1 10.0 48 290 20.2 7.4CHINITNA FMTONNIE SILT- AF 95 OE 9 71 66 15.8 11.5 52 276 20.4 7.3
STONE MEMBER
0r

61
N N
500
(a) (b)~- (0
400-
.M382
300-- "A374
2 - (d)
M 374
S(e)
M 382M384
1000 2000oe
(c)
Figure 3-13. Paleomagnetic data for TXD-1, Tuxedni Bay, Alaska.(a) NRM P. (b) NRM. (c) Magnetic intensity and (d)directions of pilot samples during AF demagnetization.(e) After demagnetization at 95 oe.

62
N N
- (a)50 -
40- .
-- ,
N 09
_o d)
2 *
M 391 -
S (e)10 .
M386
.----------- M 396M 391
1000 2000oe
(c)
Figure 3-14. Paleomagnetic data for TXD-2, Tuxedni Bay, Alaska.(a) NRM P. (b) NRM. (c) Magnetic intensity and (d)directions of pilot samples during AF demagnetization.(e) After demagnetization at 95 oe.
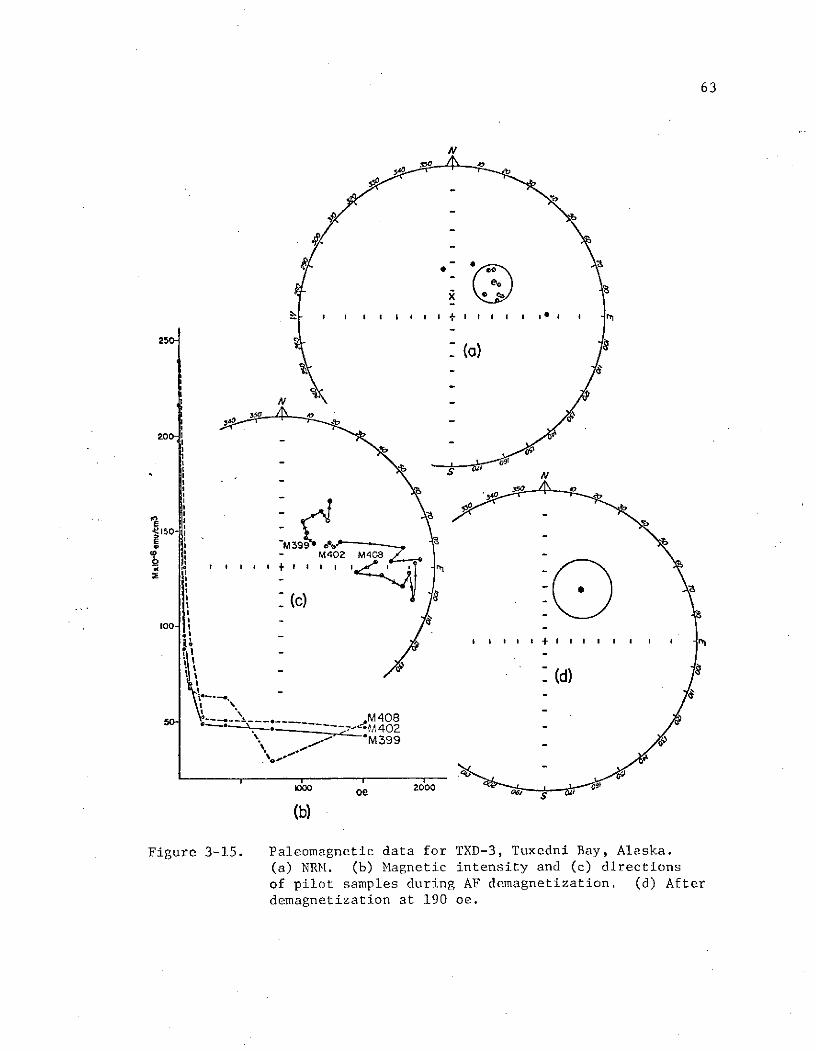
63
N
250()
0- -0
,:'
' "'
M402 M 402
-, "M399
oe 2000(b) -
Figure 3-15. Paleomagnetic data for TXD-3, Tuxedni Bay, Alaska.(a) NRM. (b) Magnetic intensity and (c) directionsof pilot samples during AF demagnetization. (d) After
demagnetization at 190 oe.

64
oe
()(a) (b)
M410
M414
directions of pilot samples during AF demagnetization.
(e) After demagnetization at 95 oe.
M 414 C 0
M410
100 200oe
(c)
Figure 3-16. Paleomagnetic data for TXD-4, Tuxedni Bay, Alaska.(a) NRM P. (b) NRM. (c) Magnetic intensity and (d)directions of pilot samples during AF demagnetization.(e) After demagnetization at 95 oe.

65
slight shift of the mean occurred upon demagnetization at 95 oe,
demagnetization at higher levels only increased the scatter. The
mean NRM intensity and susceptibility for these samples were 45 x
10 - 6 emu/cm 3 and 280 x 10- 6 emu/cm 3 , respectively. Results from the
samples collected at TXD-2 thus appear to be a good record of the
mid Jurassic VGP.
Samples from the Jurassic granodiorite at Tuxedni Bay, TXD-3,
had a mean NRM direction that was not aligned along the present
axial dipole field direction. Demagnetization at an AF of 95 and
190 oe caused slight shifts in the position of the mean of the
paleomagnetic field direction, but demagnetization at 380 oe only
increased the scatter. The mean NRM intensity for these samples
was 200,x 10-6 emu/cm3 , and the mean susceptibility was 40 x 10- 6
emu/cm3 . Thus the mean of the vector directions after demagneti-
zation at an AF of 190 oe is a good approximation of the early
Jurassic VGP, if the assumption of horizontal orientation is
correct.
The samples from Chisik Island, TXD-4, had a mean NRM P that
was not in the same direction as the present axial dipole field
direction. Demagnetization in an AF of 48 and 95 oe caused a small
shift of the mean magnetic vector direction. The samples were too
weak to demagnetize at a higher level, as the mean NRM intensity
was 4 x 10⁻⁶ emu/cm 3 , and the mean susceptibility was 35 x 10- 6
emu/cm 3. The results, however, seem to be stable and a good approx-
imation of the upper Jurassic VGP.

66
SOUTHCENTRAL ALASKA
Over 100 cores were collected at 11 different sites from the
Sheep Mountain, Mentasta, and Nabesna areas in southcentral Alaska
(Fig. 3-17). Rocks of Permo-Triassic, Jurassic, and Cretaceous age
were sampled. The rock types collected were both sedimentary and
igneous.
Geologic setting of the Upper Matanuska Valley
Capps' (1927) description of the geology of the upper Matanuska
Valley served as the main source of the geological information included
here. Waring (1936), Martin and Katz (1912), Capps (1940), and Grantz
(1964) describe various aspects of Matanuska Valley geology. More
recent geologic maps and cross sections of adjacent areas by Grantz
(1960a, b, c; 1961a, b) and Barnes (1962) are also available.
The oldest rocks in the upper Matanuska Valley are early Mesozoic
or older, and consist of slates, graywackes, basaltic greenstones,
tuffs, and associated mica schists and gneissic rocks. These metamor-
phic rocks are exposed along the flanks of the Chugach Mountains to
the south of the Valley. Throughout the Matanuska Valley the lower
Jurassic Talkeetna Formation is a widespread unit that consists of
volcanic agglomerate, breccia, and tuff with interbedded minor
amounts of shndstone and shale. Although this formation is largely
marine, its age has been established from fossil plant remains.
Middle and upper Jurassic rocks are not exposed in the upper
Matanuska Valley, although they were deposited in the Talkeetna
Mountain portion of the upper Matanuska geosyncline (Grantz, 1961a).

67
150 148 4 14 142*
CENTRALALASKA
aMILES 50 0 5
KILOMETERS 50 O 50
FAIRBANKS C:
RIV ER
ZIP
Nobessa
4: 4t
SR -K
A /
localities in central Alaska.Nobno
localities in central Alaska.

68
These rocks are sandstones of the Tuxedni Formation, siltstones of
the Chinitna Formation, and siltstones and shales of the Naknek
Formation. During the Jurassic or early Cretaceous, a quartz dio-
rite and granodiorite body was intruded into the Talkeetna Formation
on the flanks of the Chugach Mountains to the south of the Valley
(Grantz, 1961a) and in the Talkeetna Mountains to the north (Capps,
1927). The Arkose Ridge Formation was deposited directly on part
of this batholith in the lower Matanuska Valley. In the upper
Matanuska Valley during the lower Cretaceous, local deposits of
siltstone and sandstone were laid down, which unconformably overlie
the Talkeetna Formation, and are themselves unconformably overlain
by the Matanuska Formation.
The Matanuska Formation is an extensive unit in the lower Mata-
nuska Valley. Its lower half consists of shale and its upper half
of sandstone and shale (Barnes, 1962). In the upper Matanuska Valley
however, the Matanuska Formation varies locally in composition. Gen-
erally it consists of a basal coarse sandstone, unconformably overlain
by sandstone and siltstone, which is unconformably overlain by clay-
stone, siltstone, sandstone, and conglomerate. This formation spans
the entire upper Cretaceous, and in the lower Matanuska Valley it is
separated from Tertiary arkose and conglomerate by an unconformity.
In the upper Matanuska Valley, the basal portion of the overlying
early Tertiary coal-bearing sandstone, pebble conglomerate, siltstone,
and claystone, called the Chickaloon Formation, is not exposed. Simi-
larly it is impossible to distinguish the Paleocene or early Eocene
Wishbone and the Eocene Tsadaka Formations, from the Chickaloon For-
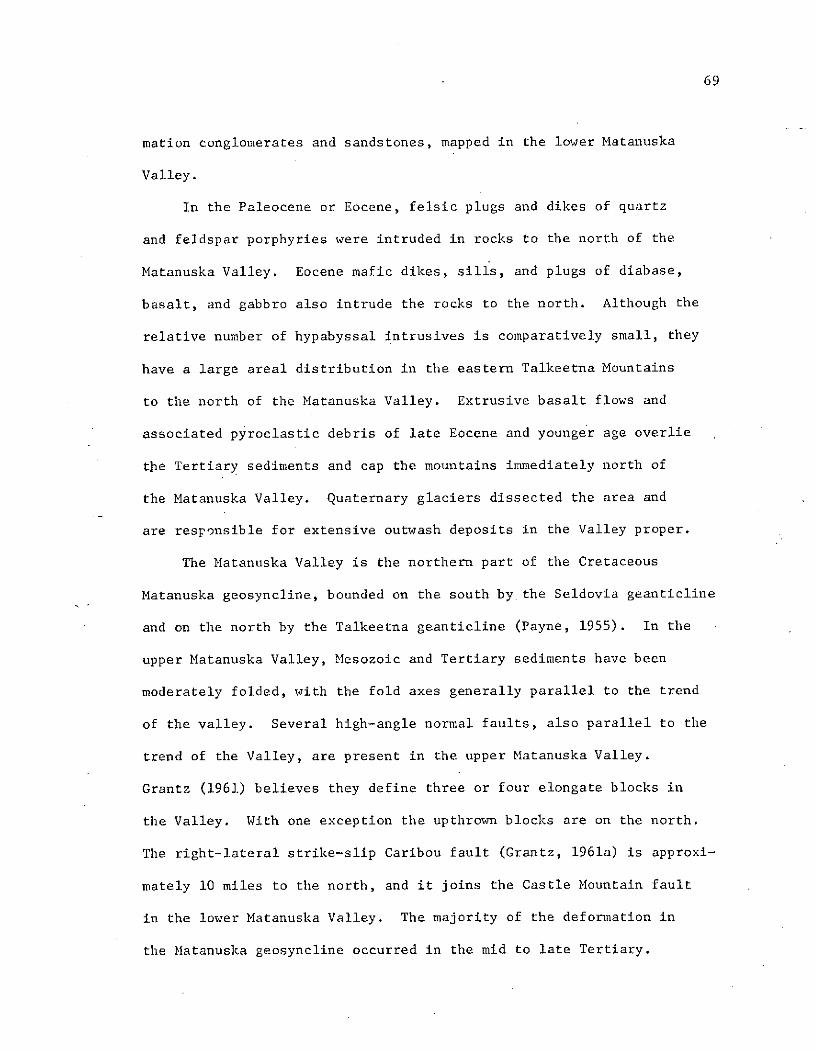
69
mation conglomerates and sandstones, mapped in the lower Matanuska
Valley.
In the Paleocene or Eocene, felsic plugs and dikes of quartz
and feldspar porphyries were intruded in rocks to the north of the
Matanuska Valley. Eocene mafic dikes, sills, and plugs of diabase,
basalt, and gabbro also intrude the rocks to the north. Although the
relative number of hypabyssal intrusives is comparatively small, they
have a large areal distribution in the eastern Talkeetna Mountains
to the north of the Matanuska Valley. Extrusive basalt flows and
associated pyroclastic debris of late Eocene and younger age overlie
the Tertiary sediments and cap the mountains immediately north of
the Matanuska Valley. Quaternary glaciers dissected the area and
are responsible for extensive outwash deposits in the Valley proper.
The Matanuska Valley is the northern part of the Cretaceous
Matanuska geosyncline, bounded on the south by the Seldovia geanticline
and on the north by the Talkeetna geanticline (Payne, 1955). In the
upper Matanuska Valley, Mesozoic and Tertiary sediments have been
moderately folded, with the fold axes generally parallel to the trend
of the valley. Several high-angle normal faults, also parallel to the
trend of the Valley, are present in the upper Matanuska Valley.
Grantz (1961) believes they define three or four elongate blocks in
the Valley. With one exception the upthrown blocks are on the north.
The right-lateral strike-slip Caribou fault (Grantz, 1961a) is approxi-
mately 10 miles to the north, and it joins the Castle Mountain fault
in the lower Matanuska Valley. The majority of the deformation in
the Matanuska geosyncline occurred in the mid to late Tertiary.

70
Sites in the Upper Matanuska Valley
Sheep Mountain (SHP)
To the west of Sheep Mountain at the base of the north end of
Anthracite Ridge, 31 cores of the Cretaceous Matanuska Formation were
collected from three sites. The sites have a total separation of
approximately two miles. Each site represents at least 10 strati-
graphic feet, and consists of tan to gray, fine- to coarse-grained
sandstone composed of quartz, plagioclase, opaques, and sedimentary
rock fragments in an argillaceous matrix. Bedding planes at SHIP-1
and 2 dip northwest at 25-30 degrees and at SHP-3, two miles south-
east, dip southeast at 53 degrees.
The results of measurements for samples from Sheep Mountain are
given in Table 3-7 and plotted in Figure 3-18. The means for NRM P
for the three sites were significantly different from the present
axial dipole field direction (Fig. 3-18). SHP-3 and SHP-1 and 2
overlapped in the NRM P plots of the means, but when the vector direc-
tions were corrected for the orientation of the bedding planes they
separated. SHP-1 and 2 had a small scatter, and SHP-3 a very large
scatter. Both means shifted upon demagnetization in an AF of 48 oe.
SHP-3 scatter was reduced but remained large, and the sample intensity
was too weak to demagnetize further. For SHP-3 the mean NRM intensity
was 1 x 10- 6 emu/cm 3 and the mean susceptibility was 1 x 10- 6 emu/cm.
SIIP-l and 2 were also demagnetized at an AF of 95 oe which decreased
the scatter, but did not shift the mean significantly. The mean inten-
sity and susceptibility for samples at SHP-1 and 2 were 2 x 10- 6 emu/cm 3
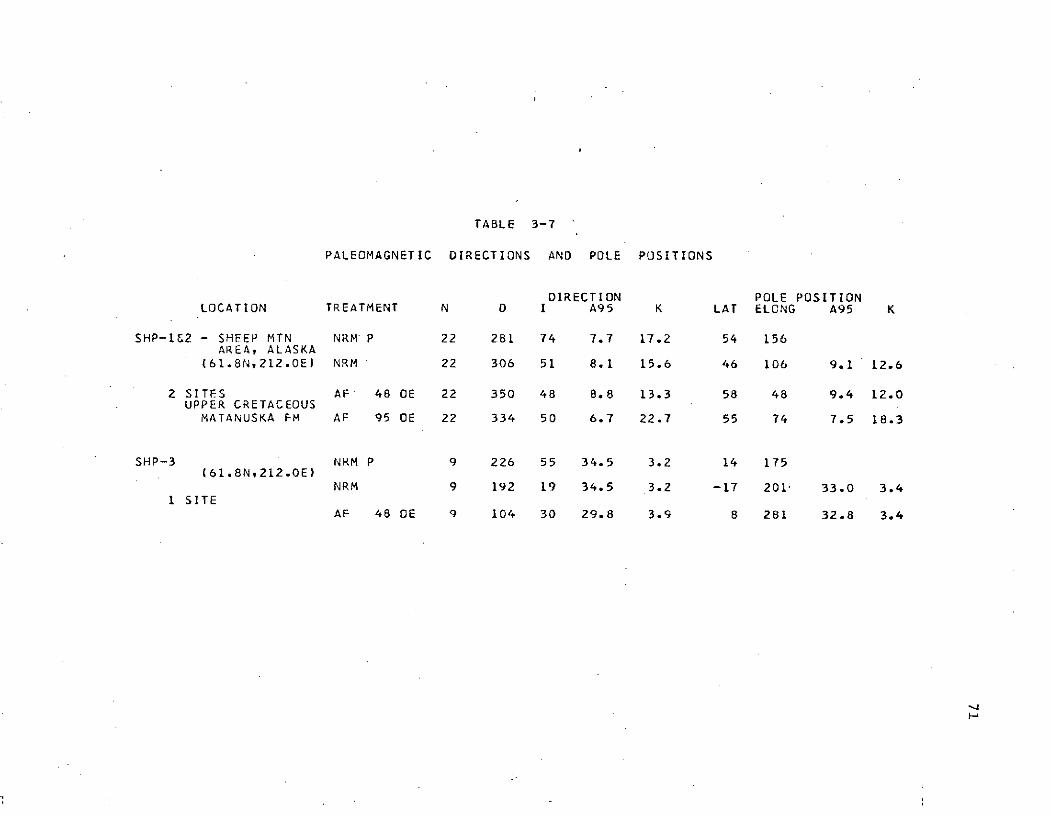
TABLE 3-7
PALEOMAGNETIC DIRECTIONS AND POLE POSITIONS
DIRECTION POLE POSITIONLOCATION TREATMENT N D I A95 K LAT ELONG A95 K
SHP-1&2 - SHEEP MTN NRM P 22 281 74 7.7 17.2 54 156AREA, ALASKA
(61.8N,212.0E) NRM 22 306 51 8.1 15.6 46 106 9.1 12.6
2 SITES AF' 48 OE 22 350 48 8.8 13.3 58 48 9.4 12.0UPPER CRETACEOUSMATANUSKA FM AF 95 OE 22 334 50 6.7 22.7 55 74 7.5 18.3
SHP-3 NRM P 9 226 55 34.5 3.2 14 175(61.8N,212.OE)
NRM 9 192 19 34.5 3.2 -17 201- 33.0 3.41 SITE
AF 48 OE 9 104 30 29.8 3.9 8 281 32.8 3.4

72
N N
II ISHP-.82 -() (
SHP-182 -
SSHP-3 SP-3
6-M2252
Figure 3-8. Paleoagnetic data for SP, SHP182
directions of pilot samples during AF demagnetization.
s M 225 (e)2 * M 232
(e) SP- and 2 after demagnetization at 95 oe, and SSHP-3
M after241 demagnetization at 48 oe.M 248
100 200
(C) . s
Figure 3-18. Paleomagnetic data for SHP, Sheep Mountain area, Alaska.
(a) NRMf P. (b) NRM. (c) Magnetic intensity and (d)directions of pilot samples during AF demagnetization.
(e) SHP-1 and 2 after demagnetization at 95 oe, and SHP-3after demagnetization at 48 oe.

73
and 15 x 10- 6 emu/cm3 , respectively. Because the mean vector posi-
tions for SHP-l and SHP-2 combined were different than SHP-3, and
because SHP-3 also seemed at least potentially unstable, it has been
ignored in the final statistics. The mean of SHP-1 and 2 probably
represents a fair approximation of the upper Cretaceous VGP.
Geologic setting of the Mentasta Mountains
Most of the geologic history presented here comes from Richter
(1967). Reports by F. H. Moffit, who did most of the early work in
this area, are summarized and referenced by Richter.
The Mentasta Mountains are divided into two geologic sections
by the Denali fault which cuts their northern flanks. To the north
of the Denali fault, Paleozoic low-grade regionally metamorphosed
sediments and volcanics make up approximately 10,000 feet of section.
These rocks consist of quartz mica schist, phyllite limestone,
marble, serpentinite, serpentine-chlorite schist, and greenstone.
These Paleozoic metamorphic units dip steeply to the southwest. On
the south side of the Denali fault relatively non-metamorphosed vol-
canic and sedimentary units dip at moderate angles to the northeast.
The oldest of these units is the Permian Mankomen Formation, which
consists of over 2500 feet of argillite, shale, limestone, and chert.
The unconformably overlying Triassic-Permian amygdaloidal basalt,
called the Slana basalt (Richter, 1967) or the Nikolai greenstone,
correlated from the southern Wrangell Mountains (Moffit, 1938), is
approximately 8000 feet thick. A massive limestone, limy siltstone
and sandstone, known as the Jack limestone, conformably overlies the
amygdaloidal basalt and occurs locally with thicknesses up to 600
74
feet. Diorite, granodiorite, and quartz monzonite bodies intruded
the rocks throughout the Mentasta Mountain area in the early Meso-
zoic. Mafic bodies (dunite) that were intruded into the Denali
fault zone can also be found within the Mentasta Mountains.
Up to 9000 feet of upper Jurassic to lower Cretaceous marine
sediments unconformably overlie the Triassic limestone. These Jura-
Cretaceous marine sediments are part of a unit that extends into the
Nutzotin Mountains to the southeast and into areas of the Alaska
Range to the northwest. Fairly extensive stream and glacial deposits,
developed since the Pleistocene, cover the valleys within and around
the Mentasta Mountains.
The Denali fault trends northwest and has probably been active
since the middle Mesozoic with most of the offset occurring during early
Tertiary time. Right-lateral strike-slip has been the principal direc-
tion of motion, but evidence for a vertical displacement can also be
observed. South of the Denali fault, folding is only evident close to
the fault zone. Richter and Matson (1971) have also described another
fault zone in the Mentasta Mountains, the Totschunda fault system, which
abuts the Denali fault from the south in the northwestern Mentasta
Mountains. The Totschunda fault has had predominantly right-lateral
offset and is believed to be no older than 2 million years.
Sites in the Mentasta Mountains
Mentasta (MNT)
Thirty-seven cores of Triassic-Permian greenstone were collected
at three sites from outcrops on a large hill 4 1/2 miles northwest of

75
Mentasta Lake. These Permo-Triassic greenstones are part of the Slana
basalt (Richter, 1967) or the Nikolai greenstones (Moffit, 1938) and
consist of green-to-maroon amygdaloidal basalt that has been metamor-
phosed through the pumpellyite-prehnite facies. MNT-l represents
approximately 10 stratigraphic feet; MNT-2, approximately 60 strati-
graphic feet; and NNT-3, approximately 50 stratigraphic feet. Bedding
orientation measured on vesicle bands at the three sites, which have
a separation of about three-quarters of a mile, generally dips north-
east at 20 to 60 degrees. These sites are approximately two miles
south of the Denali fault zone.
The mean vector directions and pole positions at NRM and demag-
netization levels are given in Table 3-8 and are shown in Figure 3-19.
The mean NRM P did not lie along the present axial dipole field direc-
tion. The mean NRM intensity was 250 x 10- 6 emu/cm3 and the mean sus-
ceptibility was 450 x 10- 6 emu/cm 3 . The moderate amount of alteration
observed in thin-section might explain the behavior of the intensities
of the pilot samples during stepwise demagnetization, and the widely
varying intensity from core to core. The scatter was fairly large, k
< 4, and often individual samples moved nearly randomly from one demag-
netization level to the next. The measurements are repeatable, however.
These results are marginal in interpreting the Triassic-Permian VGP.
Nabesna area (NBS)
Samples of the Permo-Triassic greenstone and the Jura-Cretaceous
marine sediments were collected in the Nabesna area. Fifteen cores
of Triassic-Permian greenstone (described in the Mentasta section)

TABLE 3-8
PALEOMAGNETIC DIRECTIONS AND POLE POSITIONS
DIRECTION POLE POSITIONLOCATION TREATMENT N D I A95 K LAT ELONG A95 K
MNT - MENTASTA, ALASKA NRM P 37 95 38 24.2 1.9 17 292(62.9N,216.OE)
NRM 37 82 6 22.2 2.1 7 312 19.3 2.5
3 SITESTRIASSIC-PERMIAN AF 95 OE 37 69 -11 15.9 3.2 1 327 13.7 3.9
GREENSTONEAF 190 OE 37 70 -11 17.0 2.9 1 326 15.3 3.4
AF 380 OE 37 76 -21 15.9 3.2 -8 322 14.2 3.7
u-~C'

77
NN
0 0
-*-
M24 b!
S00 *M19 - M5 o I
M5
- (e)
M2
-M37 "- I10
600- 2000oe
)..
Figure 3-19. Paeomagnetic data for Mentasta Alaska. (a) RM P.
(b) NIM. (c) agnetic intensity and (d) directions of
.pilot samples during F demagnetization. (e) After demag-
netization at 380 oe.

78
representing about 25 feet of section were collected on the east side
of Lost Creek, about 5 1/2 miles north of the Nabesna Road. The
bedding dips northwest at 45 degrees.
Approximately three miles due east of this Lost Creek site, on
either side of Platinum Creek, are two sites from which 25 cores of
the Jura-Cretaceous marine sediment unit were collected. The samples
are fine-grained calcareous sandstone composed of quartz, plagioclase,
biotite, and sedimentary and volcanic rock fragments in an argilla-
ceous and calcareous matrix. The sandstone occurs interbedded with
siltstone. NBS-1 on the east side of Platinum Creek covers 400 feet
of section in beds dipping 10-24 degrees to the east-northeast. On
the west side, NBS-3, approximately 50 feet of section is represented
in beds that dip northeast at 17 degrees.
The means of the measured paleomagnetic field directions and
paleomagnetic pole positions for cores collected in the Nabesna area
are shown in Table 3-9 and Figures 3-20 to 3-22. NBS-1, from Jura-
Cretaceous marine sediments had a mean NRM P which included the
present axial dipole field direction within its 95% confidence limits.
This component was removed after demagnetization at an AF of 48 and
95 oe, and the 95 oe level also reduced the scatter. The mean NRM
-6 3intensity and susceptibility were 10 x 10- 6 emu/cm3 and 35 x 10- 6
emu/cm 3 , respectively. The mean NRM P vector direction of the Jura-
Cretaceous marine sediments from NBS-3 did not lie along the present
axial dipole field direction. After demagnetization in an AF of 48 oe
and 95 oe, the mean shifted and at the same time the scatter decreased.
10-6 and the mean susce
The mean NRM intensity was 10 x 10 emu/cm 3 , and the mean susceptibi-
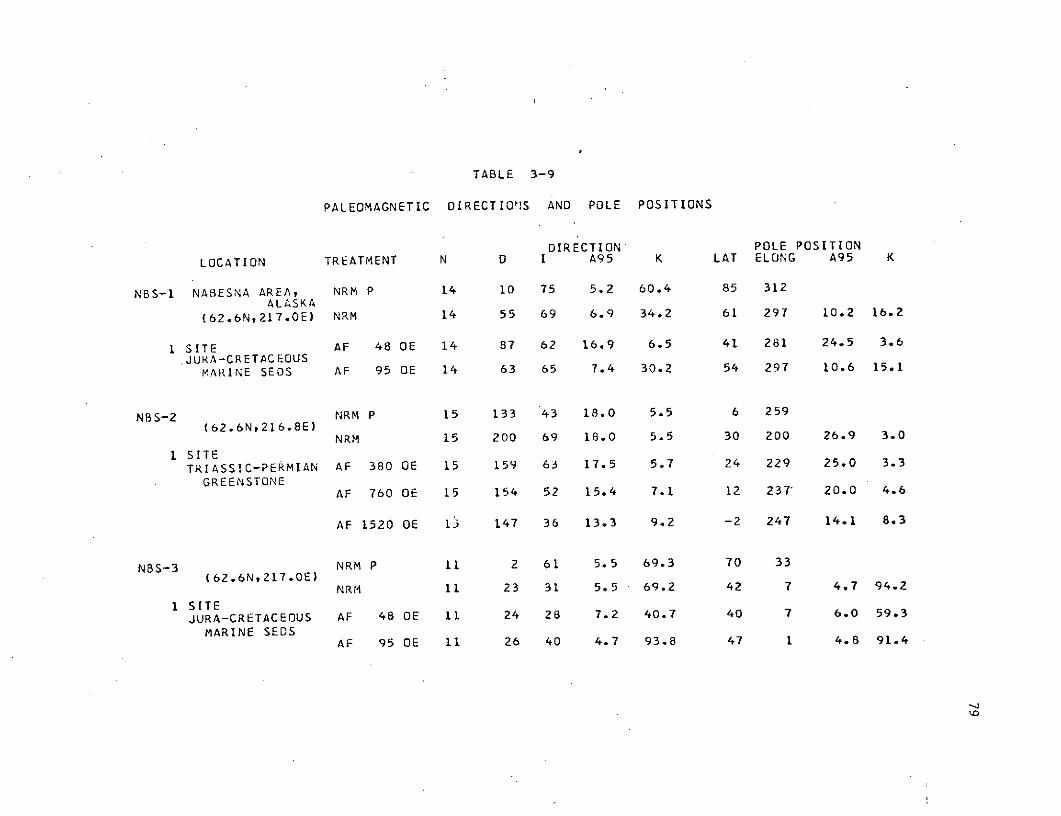
TABLE 3-9
PALEOMAGNETIC DIRECTIOIS AND POLE POSITIONS
DIRECTION POLE POSITION
LOCATION TREATMENT N D I A95 K LAT ELONG A95 K
NBS-1 NABESNA AREA, NRM P 14 10 75 5.2 60.4 85 312ALASKA
(62.6N,217.0E) NRM 14 55 69 6.9 34.2 61 297 10.2 16.2
1 SITE AF 48 OE 14 87 62 16.9 6.5 41 281 24.5 3.6
JURA-CRETACEOUSMARINE SEDS AF 95 OE 14 63 65 7.4 30.2 54 297 10.6 15.1
NBS-2 NRM P 15 133 43 18.0 5.5 6 259
(62.6N,216.8E)NRM 15 200 69 18.0 5.5 30 200 26.9 3.0
1 SITETRIASSIC-PERMIAN AF 380 OE 15 159 63 17.5 5.7 24 229 25.0 3.3
GREENSTONEAF 760 OE 15 154 52 15.4 7.1 12 237' 20.0 4.6
AF 1520 OE 13 147 36 13.3 9.2 -2 247 14.1 8.3
NBS-3 NRM P 11 2 61 5.5 69.3 70 33(62.6N,217.OE)
NRM 11 23 31 5.5 69.2 42 7 4.7 94.2
1 SITEJURA-CRETACEOUS AF 48 OE 11 24 28 7.2 40.7 40 7 6.0 59.3
MARINE SEDSAF 95 OE 11 26 40 4.7 93.8 47 1 4.8 91.4

80
N N
(a)
4M92
t5)' M86
2- -
100 20009
(c)
Figure 3-20. Paleomagnetic data for NBS-1, Nabesna area, Alaska.
(a) NRM P. (b) NRM. (c) Magnetic intensity and (d)
directions of pilot samples during AF demagnetization.(e) After demagnetization at 95 oe.
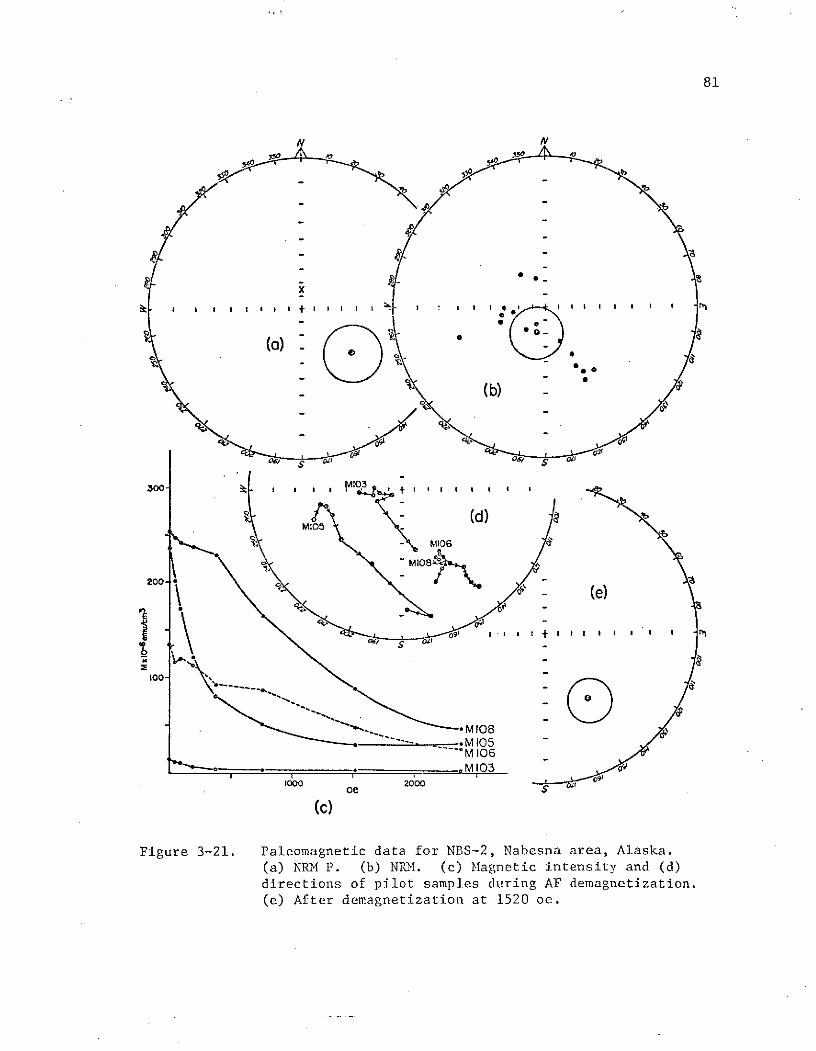
81
N N
I00 I I 0 ' T | | ,
M uo- (d)
((e)
091 I I, +II I I + I I I I I I " I
3w.M I03 -+
M105
M106
M108
0oo oe 2000 .'20 S
(c)
Figure 3-21. Paleomagnetic data for NBS-2, Nabesna area, Alaska.
(a) NRMI P. (b) NR . (c) Magnetic intensity and (d)directions of pilot samples during AF demagnetization.(e) After demagnetization at 1520 oe.

82
N N-o a 3,0 ooee
)(b)
M289
M283 7 091M283 0Mso
/ : - .(e)
M 289
100 oe s o202 0
(C)
Figure 3-22. Paleomagnetic data for NBS-3, Nabesna area, Alaska.
(a) NRM P. (b) NRM. (c) Magnetic intensity and (d)
directions of pilot samples during AF demagnetization.(e) After demagnetization at 95 oe.

83
lity was 30 x 10- 6 emu/cm 3 . The samples from both NBS-1 and 3 had
intensities too small to demagnetize further. It would appear that
both of these groups of samples arrived at a stable position by the
removal of low-coercivity secondary components. The scatter for
both sites was extremely small, and they are both good approximations
of the Jura-Cretaceous VGP.
The Triassic-Permian greenstone sampled in the Nabesna area had
an NRM P that did not lie along the present axial dipole field direc-
tion. Demagnetization at an AF of 380, 760, and 1520 oe caused a
small shift in the mean vector direction and at the same time reduced
the scatter. The mean NRM intensity was 220 x 10- 6 emu/cm 3 , and the
mean susceptibility was 630 x 10- 6 emu/cm3 . The behavior of these
samples was nearly the same as those of the same rock type collected
at MNT. The scatter was a bit less than MNT, but the secondary com-
ponents shown in the intensity upon demagnetization and the alteration
as seen in thin section were the same. These results, then, are
marginal in their representation of the Triassic-Permian VGP.
WHITEHORSE, CANADA
Geologic setting of the Whitehorse area, Canada
The geologic summary presented here is taken from J. 0. Wheeler's
Geological Survey of Canada Memoir on the Whitehorse map-area, Yukon
Territory 105 D, which was published in 1961. His work is an excel-
lent treatment of the geology, glaciation, and economic mineral depos-
its in the Whitehorse map-area. An attempt has been made to limit
the discussion, when possible, to the Takhini Hotspring vicinity where
paleomagnetic samples were collected (Fig. 3-23).

84
Flat 135015' Lake 135000o 61000'-
Mountain Laberge
ToakhiniHot Springs
0 WTH
WHITEHORSEAREA, CANADA 60045
o Whitehorse4 2 0 4 Miles
FishLake
Figure 3-23. Location map for place names and sampling locality in theWhitehorse area, Canada.

85
The Yukon group, Precambrian and early Paleozoic metamorphics,
which are composed chiefly of quartz-mica schist, quartzite, and
feldspathic gneiss is the oldest rock unit in the Whitehorse map-
area. It outcrops along a northwest trending belt approximately
30 miles southwest of Whitehorse. The Taku group, a massive lime-
stone interbedded with greenstone and chert, is exposed to the
southeast of Whitehorse. The age of the Taku group ranges from
Pennsylvanian through upper Triassic. The relationship of the Taku
group to the upper Triassic Lewes River group is unknown.
The Lewes River group is exposed in the north, central, and
eastern parts of the Whitehorse map-area. In the Takhini Hotspring
area it is the oldest unit exposed and is composed of interbedded
limestone, volcanic graywacke, and maroon sandstone and conglomerate.
Generally its composition through 10,000 feet of section ranges from
graywacke, siltstone, andesite and basalt flows, limestone, and low-
grade metamorphosed volcanic rocks. This assemblage probably repre-
sents a trough in which clastic sediments, partly of volcanic origin,
were deposited during most of Norian time. In late Norian however,
limy muds were deposited throughout the trough. This trough has
been called the Whitehorse trough and is part of the Tagish belt,
which has been classified as an idiogeosyncline that extends south
into British Columbia.
In the Takhini Hotspring area the Lewes River group is discon-
formably overlain by approximately 9500 feet of a graywacke with
interbedded conglomerate and argillite of the early to middle Juras-
sic Laberge group. To the southwest of Whitehorse, the Laberge

86
group is in fault contact with the upper Jurassic-lower Cretaceous
Tantalus Formation, which is composed of arkose, siltstone, and con-
glomerate. To the northeast of Takhini Hotspring, the Laberge group
is intruded by a mid Cretaceous peridotite body that is highly
deformed and lies parallel to the bedding plane.
The Hutshi group, consisting mainly of flows that range in
composition from basalt to rhyolite and minor graywacke and argil-
lite, is mid Cretaceous in age. On Flat Mountain to the north of
Takhini Hotspring, the Hutshi group is in contact with the Laberge
group and the Lewes River group across an angular unconformity.
This area was deformed in the early to mid Cretaceous into northeast
trending folds. In the Takhini Hotspring area the folding is rep-
resented by a broad syncline; however, the intensity of folding in-
creases to the northeast. Minor faulting also occurred during this
time. Northward trending right-lateral strike-slip faults are
predominant, one occurs in the Takhini Hotspring area. Cross faults,
both normal and reverse, are also present.
Intruded into the Hutshi group in the Takhini area is a body
of Cretaceous leucocratic granite. This body is a part of a granitic
complex known as the Coast Intrusives that outcrop in and underlie
well over half of the western portion of the Whitehorse map-area. The
rock types in order of abundance in this complex are granodiorite,
leucocratic granite, and quartz diorite. Other smaller bodies of
quartz monzonite and the Eocene or older Skukum group, an andesitic
and basaltic volcanic flow unit with associated pyroclastic debris,
are present in the Whitehorse map-area but do not occur in the Takhini

87
Hotspring area. Minor block faulting accompanied the intrusion of
some of the larger granitic bodies.
Extensive glacial deposits from the Cordillerian Ice-sheet of
Pleistocene age, recent alpine glacial deposits, and deposits of a
small Pleistocene basalt flow and pyroclastics (western Whitehorse
map-area) make up the Cenozoic record.
Sites near Whitehorse area, Canada
Whitehorse, Canada (WTH)
Forty-four cores from the upper Triassic Lewes River group were
collected from the Takhini Hotspring vicinity approximately twelve
miles northwest of Whitehorse. These samples are from two sites,
approximately a quarter of a mile apart. The rock consists of tan-
to-maroon fine-grained chlorite with minor argillaceous interstitial
material. In some area the rocks have been affected by hematite
staining that has been preferentially absorbed by the argillaceous
fraction. WTH-1 represents approximately 400 stratigraphic feet, and
WTH-2 approximately 100 stratigraphic feet. The beds dip east-north-
east at 15 to 30 degrees.
The results of measurements on the samples from WTH are presented
in Table 3-10 and Figure 3-24. The mean of NRM P was not along the
present axial dipole field direction. On demagnetization at an AF of
48 and 95 oe the mean shifted slightly and reduced the scatter of
vector directions around it. The mean intensity and susceptibility
were 30 x 10- 6 emu/cm 3 and 120 x 10- 6 emu/cm 3 , respectively. It seems
that the mean direction of these samples after demagnetization at an

TABLE 3-10
PALEOMAGNETIC DIRECTIONS AND POLE POSITIONS
DIRECTION POLE POSITIONLOCATION TREATMENT N D I A95 K LAT ELONG A95 K
WTH - WHITEHORSE AREA, NRM P 44 269 67 11.5 4.5 42 166CANADA
(60.9N,224.7E) NRM 44 19 78 .11.8 4.3 76 249 16.9 2.6
2 SITES AF 48 OE 44 65 60 10.1 5.6 50 306 12.9 3.8UPPER TRIASSICLEWES RIVER AF 95 OE 44 73 61 9.3 6.4 47 299 11.4 4.5
GROUP
0000

89
* N
0-- *
M,-,,-9
M80 '-*M55 _500 oe 000 g
(c)
Figure 3-24. Paleomagnetic data for WTH, Whitehorse area, Canada.(a) NRM P. (b) NRM. (c) Magnetic intensity and (d)
directions of pilot samples during AF demagnetization.(e) After demagnetization at 95 oe.
90
AF of 95 oe represents a stable field and a good approximation of
the upper Triassic VGP for this area.
IV. ALASKAN MAGNETIC DECLINATIONS AND VIRTUAL GEOMAGNETIC POLES
A sunimary of the results from Chapter III is presented in Figures
4-1 to 4-3. The mean virtual geomagnetic poles (VGP's) for NRM P (NRM
with respect to present horizontal), NRM (NRMI with respect to ancient
horizontal), and demagnetization levels are plotted for all sites
except KTM-3, which was unstable. Selection criteria were applied to
the "good"' results (see Chapter III), as indicated in Figures 4-la,
4-2a, and 4-3a, by discarding any results having a k < 5, namely CHL-3
and KTM-1. Also rejected was the mean pole from TXD-2 because it is
displaced from the mean of the other Jurassic samples by more than 90
degrees. There appears to be no simple explanation for this divergence
in terms of magnetic stability, local rotation, or tilting. The most
plausible explanation is probably that of a large field excursion.
These selected VGP's and their 95% circles of confidence are
plotted in Figures 4-1b, 4-2b, and 4-3b, and listed in Table 4-1.
Although there are other ways of combining the apparently stable
results from individual sites by choosing different selection criteria,
etc., they do not significantly alter the mean paleomagnetic pole
position. The particular approach used here is the most viable paleo-
magnetically and geologically. A two-tier analysis (Watson and Irving,
1957) was not applied to the data because the variances, k, are un-
equal, and because the products, KiNi., vary widely (McElhinny, 1967;
and Bingham, 1971).
For the Triassic the only stable result is WTH. No obvious expla-
nation can be found for the divergence between the two apparently mag-
91

92
Explanation to Figures 4-1 to 4-3
(a) Plots of mean VGP's for NRMI P (NRM with respect to
present horizontal) shown as ~-, NRM (NRM with respect to ancient
horizontal) shown as -O-- , and demagnetization levels for both
stable and marginal results from Chapter III shown as --. The
best demagnetization level for stable results is shown as -*-@
(b) Stable results shown within 95% circles of confidence.
'VGP's not included in mean if k < 5, or divergent (indicated by ?).
Mean is shown as .

93
MNT
(0)
, , + I I l l i i i i
PLB
+GO
- oo
Figure 4-1. (a) Mean VGP's for Triassic and Permian sites. (b)Mean of stable results. (Explanation on precedingpage.)

94
_NBS-3
(a) TXD-3 -.,4a CLCHL-4
CHL-3 CHL-5
KNBS-I C L .I 1 " Q/TXD-1 K
QL
- XD-'4 CHL-2
SKTM-2
'-', / ,C.--
Figure 4-2. (a) Mean VGP's for Jurassic sites. (b) Mean of stable
results. Separate symbols are used for each site for
clarity. (Explanation precedes Fig. 4-1.)

95
(a) CHG-2CHG-I
SHP-I 82 SHP-3
OS
Figure 4-3. (a) Mean VGP's for Cretaceous sites. (b) Mean ofstable results. CHG-1 and 2 combined (see Chap. III).(Explanation precedes Fig. 4-1.)
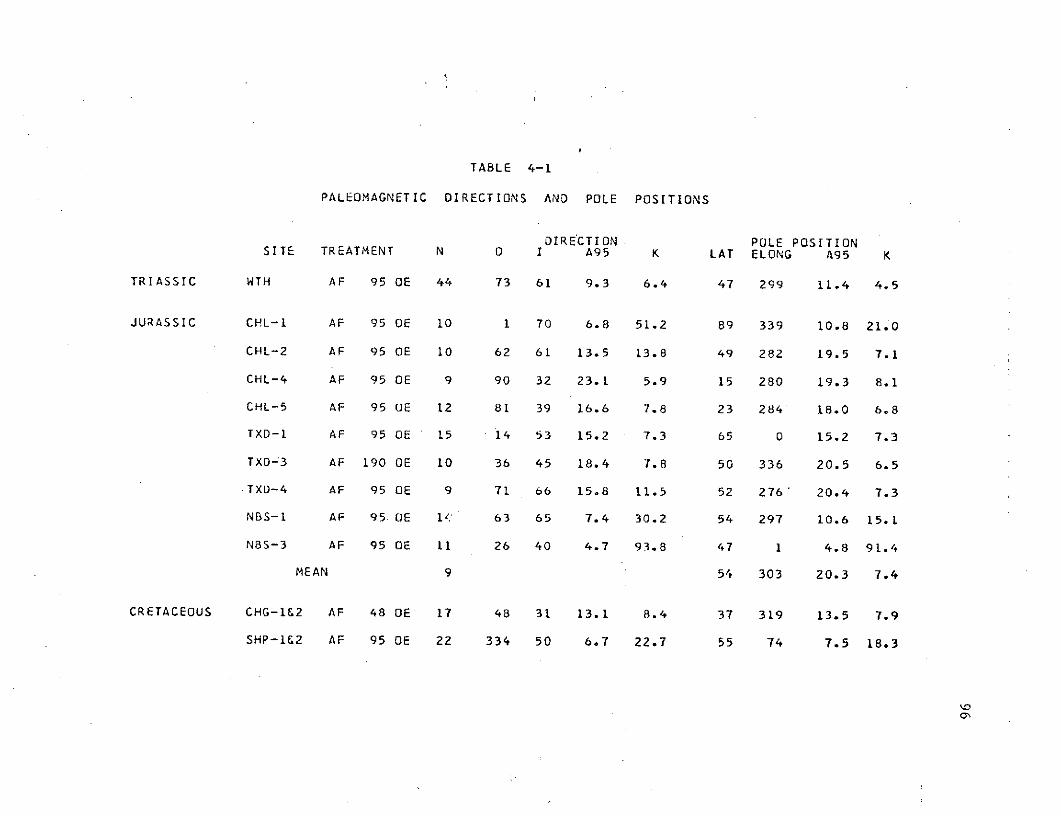
TABLE 4-1
PALEOMAGNETIC DIRECTIONS AND POLE POSITIONS
DIRECTION POLE POSITIONSITE TREATMENT N 0 I A95 K LAT ELONG A95 K
TRIASSIC WTH AF 95 OE 44 73 61 9.3 6.4 47 299 11.4 4.5
JURASSIC CHL-1 AF 95 OE 10 1 70 6.8 51.2 89 339 10.8 21.0
CHL-2 AF 95 OE 10 62 61 13.5 13.8 49 282 19.5 7.1
CHL-4 AF 95 OE 9 90 32 23.1 5.9 15 280 19.3 8.1
CHL-5 AF 95 OE 12 81 39 16.6 7.8 23 284 18.0 6.8
TXD-1 AF 95 OE 15 14 53 15.2 7.3 65 0 15.2 7.3
TXD--3 AF 190 OE 10 36 45 18.4 7.8 50 336 20.5 6.5
TXU-4 AF 95 OE 9 71 66 15.8 11.5 52 276 20.4 7.3
NBS-1 AF 95 OE 1< 63 65 7.4 30.2 54 297 10.6 15.1
NBS-3 AF 95 OE 11 26 40 4.7 93.8 47 1 4.8 91.4
MEAN 9 54 303 20.3 7.4
CRETACEOUS CHG-1&2 AF 48 OE 17 48 31 13.1 8.4 37 319 13.5 7.9
SHP-1&2 AF 95 OE 22 334 50 6.7 22.7 55 74 7.5 18.3

97
netically stable Cretaceous results from CHG-l and 2 from SHP-1 and
2. Without other measurements from these same general areas and from
southern Alaska, no firm conclusion can be drawn as to the true posi-
tion of the southern Alaskan Triassic and Cretaceous paleomagnetic
poles. It is interesting to note, however, that the mean VGP's of
Cretaceous CHG-l and 2, the stable Triassic WTH, and the Alaskan mean
Jurassic pole all have 95% circles of confidence which overlap. Also
interesting is the fact that the mean VGP's of the Cretaceous SHP-1
and 2 and the Cretaceous Taylor Highway site of Chantry-Price's study
(1967) have a9 5 circles that overlap.
The mean pole position of the nine remaining Jurassic VGP's have
a k equal to 7.4 and an a95 of 20.3 degrees (Table 4-1). The data
are a good representation of the paleomagnetic field on the basis that
it comes from sites that have a geographic spread of over 700 miles,
and have a varied lithology which includes sandstones, siltstones, and
granitic intrusives. The Jurassic period is also adequately repre-
sented by rocks that range in age from lower to upper Jurassic. Thus,
although a9 5 and k indicate a fair amount of scatter, the results are
certainly significant. Because of the inconclusive Cretaceous and
Triassic data, the Jurassic results have been used to test the oro-
cline.
ALASKAN OROCLINE
Workers attempting to define oroclines in the past have worked
mainly with declinations (see Irving, 1964), because inclinations
add still another variable. In Figure 4-4 the declinations for the

170"Pr;?\. ,0 130- 140 0"
S(a) ,- (b)
SNBS
WTH NBS
1 . T X 'xo
100 0 100 200 300KM35- 100 0 00 200 300 KM
0 15014r 160 150- 140'
SHP Figure 4-4. Magnetic declinations from Alaskafor the (a) Triassic, (b) Jurassic,and (c) Cretaceous.
CHG t 0 00 0 200 300KM
16 0 140 O .
99
stable results for the Triassic, Jurassic, and Cretaceous are shown.
Figure 4-5 shows the declination for the Jurassic after "unbending"
according to both Carey's and Grantz's models of the orocline.
Grantz (1966) modeled the Alaskan orocline as a series of rigid
bodies rotating about pivots along a north-south line in mid-Alaska
(see Chapter 1). The rotation he estimated for the Alaska Peninsula
was 40 degrees. A simple rotation of 30 degrees has also been shown
for Carey's (1958) model of the orocline (Fig. 4-5). This represen-
tation is not precisely correct, because an orocline is a 'fold',
and points near the axis would undergo relatively lesser amounts of
rotation. In practice, this would only increase the scatter of the
declinations for Carey's model, because as can be seen from Figure
4-5, the largest declinations are farthest from the pivot points.
In Figure 4-5d, the mean vector directions and their standard
deviations indicate that the two models are not significantly dif-
ferent from the present; thus it is impossible to say for sure
whether or not oroclinal bending has occurred. This is in part due
to the moderately large scatter, and hence large standard deviations,
about the means of the various models, and in part due to the fact
that not enough resolution can be obtained from the two sites on the
North American or eastern limb of the Alaskan orocline. In order to
establish a fixed point from which to determine relative motion
between the two limbs, it will be necessary to collect more samples
from the eastern limb. If the VGP's from the western limb are com-
pared with those from elsewhere in North America, as is explained
in more detail in the next section, they are displaced from each
other in the wrong direction to be explained by the Alaskan orocline.

7'o0 140 -30' 70' 160 00' 1140' 30'
(0) 6 (b)
1o0 0 00 200 o00OKM , 00" 0 0 200 300KM
0 0 14,0 I0. 150 14?*
,170'' 140' 1 0*
(C) (d) '. Present (49*-310)
i Corey'smodel (73*-35*)
Grontz'sNBS model (80*37
)
TXD D 4
a " Figure 4-5. Magnetic declinations for Alaskan
H/L X Jurassic results showing (a) presentCH ' position, (b) after rotation of 300
C L 00 20 20KM about 0 for Carey's model, and (c)
- I0
00 -00 30M -- after rotation of 40 about for

101
In summary, the relative positions of the Jurassic poles for
Alaska and North America represent relative motion in a sense oppo-
site that suggested by Carey. Thus it would seem unlikely that
Carey's concept of an Alaskan orocline is valid.
ALASKAN PALEOMAGNETIC POLES
For the purposes of comparing Alaskan data with the continents
surrounding the Arctic Ocean, a compilation of paleomagnetic poles
was made, and is given in the Appendix. The mean paleomagnetic pole
for the Jurassic from southern Alaska is shown in Figure 4-6 along
with selected Jurassic paleomagnetic poles for North America and
their mean (see next section). The Jurassic paleomagnetic pole
from southern Alaska is significantly different from the present
magnetic dipole and from the Jurassic paleomagnetic pole for North
America.
Alaska's Jurassic orientation and latitude with respect to the
present has been determined from the Jurassic mean paleomagnetic pole
position (Table 4-1). Employing the common paleomagnetic assumption
of a mean geocentric axial dipole (see Chapter II), the latitude and
orientation for any given "reference site" can be found by spherical
trigonometry from the paleomagnetic pole position, which is latitude
independent. For convenience, a "reference site" has been defined to
be located at 60 degrees north latitude and 207 degrees east longitude,
which is the location of Tuxedni Bay and also nearly the median of the
Jurassic sampling areas. The paleolatitude of the reference site
during the Jurassic has been determined to be 42 degrees north, com-

102
S++
+ *1
+
Figure 4-6. Selected North American paleomagnetic poles 0 , andtheir mean D . Mean VGP's and their mean 6 forJurassic results from southern Alaska. Circles are 95%confidence limits.

103
pared with the present latitude of 60 degrees north, thus requiring a
position approximately 18 degrees further south for Jurassic times. A
counterclockwise rotation equal to 52 degrees is also required to place
Alaska in its Jurassic orientation. Applying the 95% confidence limits,
Alaska could have been as far north as 62 degrees north latitude and as
far south as 23 degrees north latitude. The 95% confidence limits
would allow a rotation of at least 29 degrees with a maximum of 68
degrees. At lesser confidence levels, however, say the 63% confidence
level, these limits are reduced by nearly half, i.e. there is a higher
probability of the true pole position being nearer the center of the
error limits than at its edges.
Alaska's Jurassic latitude with respect to North America may also
be found by superimposing the Jurassic paleomagnetic poles for the two
blocks. Relative to the Jurassic North American pole, southern Alaska
must have had a paleolatitude equivalent to that of Oregon, the con-
tinental margins of the Alaska Peninsula and Washington-Oregon being
approximately parallel. If Alaska and Washington-Oregon were together
in the Jurassic, then the required motion, determined graphically,
could be described in terms of an opening of approximately 97 degrees
about an Euler pole at 59 degrees north, 236 degrees east. The paleo-
longitude of southern Alaska, however, is indeterminable from a single
paleomagnetic pole position.
Unfortunately the Jurassic paleomagnetic pole for North America
is not well defined because there are only four poles from sites east
of the Sierra Nevada Mountains. Poles from west of the Sierra Nevada
Mountains indicate either a complex tectonic history, a very erratic

104
magnetic field during the Jurassic, or undetected magnetic instabi-
lity (see next section).
POLAR WANDERING CURVES
The Appendix is a compilation of Permian, Triassic, Jurassic and
Cretaceous paleomagnetic poles for North America, Asia, and Europe
taken from compilations by Irving (1964) and McElhinny (1968a, b;
1969; 1970) and recently published pole positions.
An attempt was made to list every Mesozoic mean paleomagnetic
pole position for the United States, Canada, China, Union of Soviet
Socialist Republics, and European countries, available in scientific
journals in English, with the exception of results from areas in south-
ern Europe. These are not listed because of the complex tectonic his-
tory of the area. The paleomagnetic pole positions are listed system-
atically by longitude within each country, starting with the USA and
working west to England. It was also the practice to list the extremes
of latitude and longitude when samples for the same study were collected
over a large region. In a few cases many formations of the same age
were collected from a given region, and their poles have been listed
separately if so reported. This is more effective in averaging
secular variation. Care was taken to avoid duplication of results
that have been superceded by further study; however, different studies
of the same rock unit in adjacent areas are included separately.
In calculating the overall mean paleomagnetic pole, pole posi-
tions that were extremely divergent (> 40 degrees) from a visual mean
of the greatest density of points were excluded. Also excluded from

105
the mean were those poles mentioned in the original publications as
having undergone local rotation or tectonic movement. The mean paleo-
magnetic pole position for a given age follows the list of the indi-
vidual determinations used. Any poles of that age which were not
included for any of the above reasons are given after the mean for
that section.
Figures 4-7 to 4-18 are derived from the Appendix. The pole
positions and collecting sites are both shown and are connected
together when the pole is divergent from the mean and in other cases
of interest. The mean paleomagnetic pole position for each continent
by age is listed in Table 4-2. A brief explanation of some of the
mean paleomagnetic pole positions in Figures 4-7 to 4-18 follows.
Theze appears to be a difference between Permian poles determined
from eastern Asian sites and western Asian sites; a mean pole position
from the eastern sites would not be well definei (Fig. 4-7). Hamilton
(1970) cites paleomagnetic evidence to support a hypothesis that the
Siberian and Russian platforms were separated until the Permian or
Triassic, but it has not been possible to review all of the Russian
data he used.
Jurassic pole positions from North America (Fig. 4-13) show a
distinct division between those from sites east of the Sierra Nevada
Mountains and thos.e from sites west of the Sierra Nevada Mountains.
Poles 120 and 121 are west coast batholiths, and 122 and 123 are
peridotite and dunite respectively, from the Franciscan Formation.
Pole 124 represents 'divergent' results from both the peridotite and
the dunite. Pole 125 is from a number of sedimentary sections within

106
Explanation to Figures 4-7 to 4-18
* sites from which samples were collected.
0 pole positions included in the mean.
6 poles not included in the mean.
O mean pole position, within its 95% circleof confidence.
All data taken from Appendix.
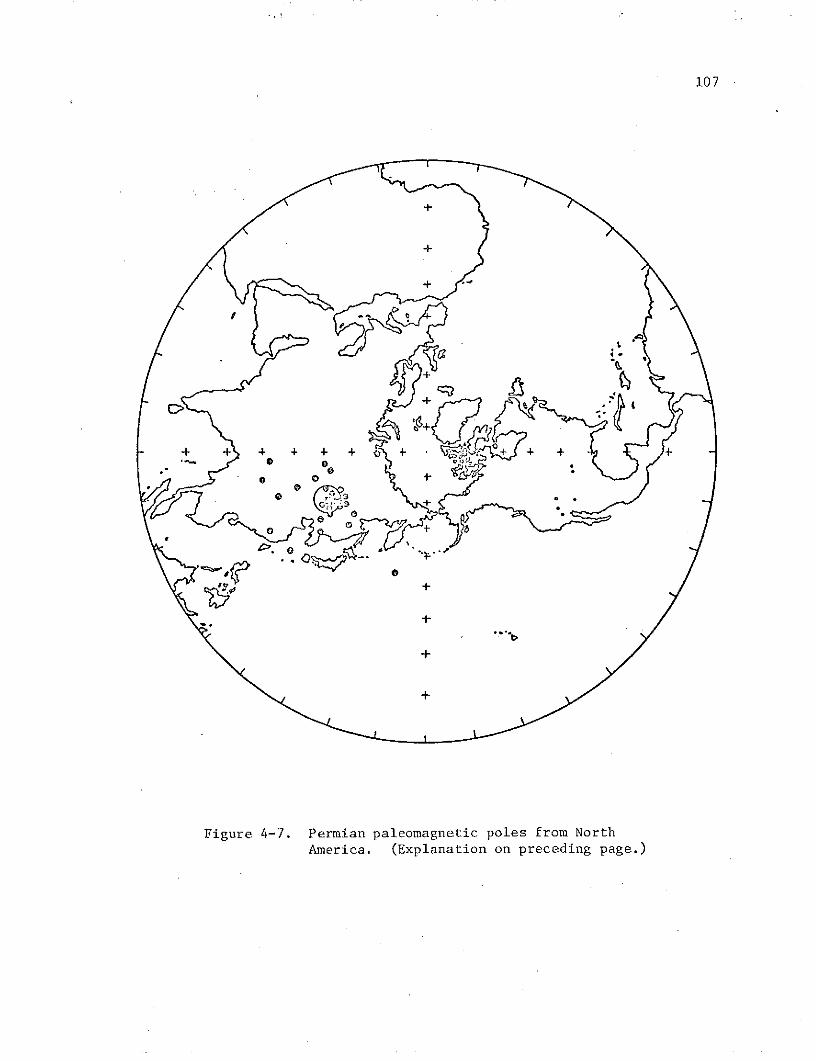
107
47
+
+
+ + *
+
+
Figure 4-7. Permian paleomagnetic poles from NorthAmerica. (Explanation on preceding page.)

108
+
+ + + * ++
51 30
34 +
Figure 4-8. Permian paleomagnetic poles from Asia.(Explanation precedes Fig. 4-7.)

109
+ --'
+ + + + + + + +
Figure 4-9. Permian paleomagnetic poles from Europe.(Explanation precedes Fig. 4-7.)
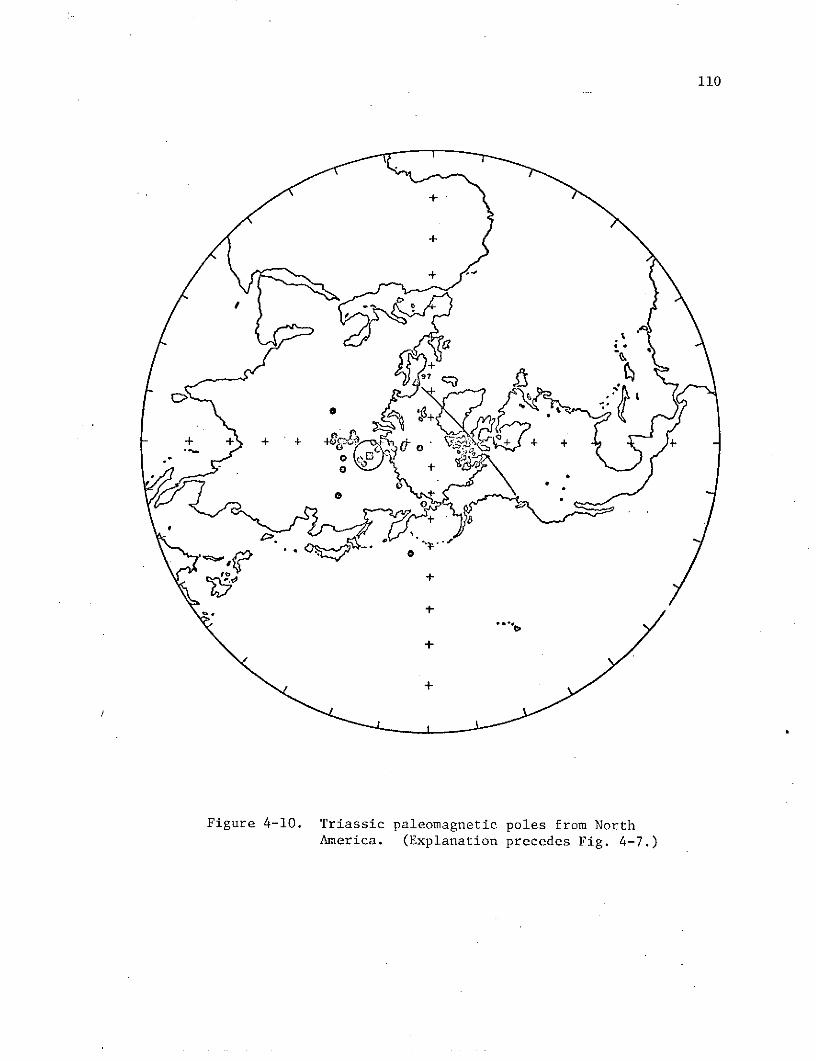
110
+ +
+
+
Figure 4-10. Triassic paleomagnetic poles from NorthAmerica. (Explanation precedes Fig. 4-7.)
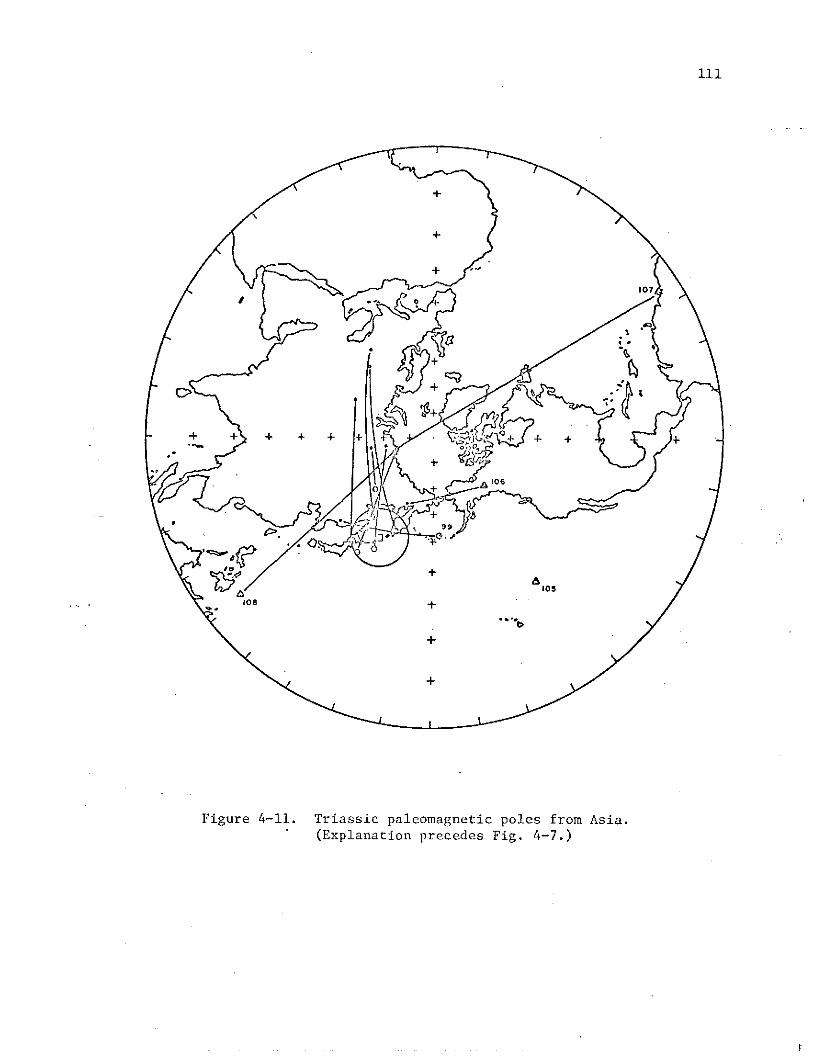
107
+
+
(Explanation precedes Fig. 4-7.)
99
Figure 4-11. Triassic paleomagnetic poles from Asia.(Explanation precedes Fig. 4-7.)

112
++
Figure 4-12. Triassic paleomagnetic poles from Europe.(Explanation precedes Fig. 4-7.)
+-
(Explanation precedes Fig. 4-7.)
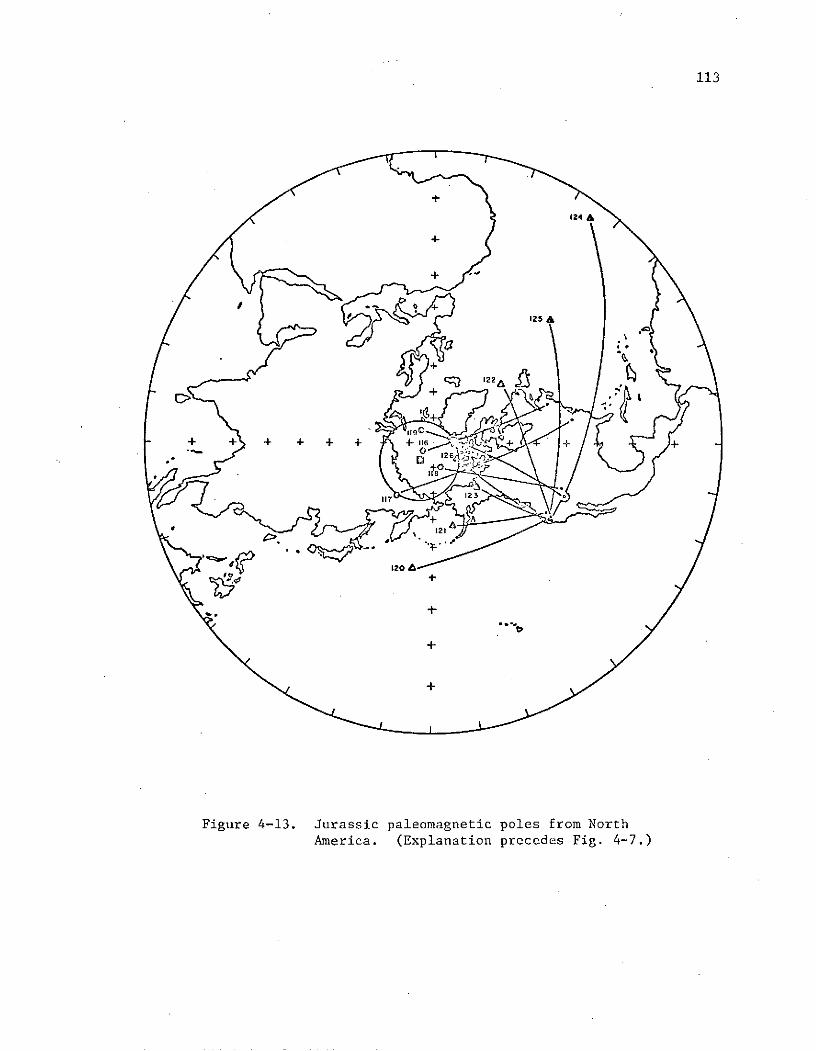
113
124 A
+
+ 1 1
C9 122
+
.II 7123
+21
120
Figure 4-13. Jurassic paleomagnetic poles from NorthAmerica. (Explanation precedes Fig. 4-7.)

114
* +
+
I37
+
Figure 4-14. Jurassic paleomagnetic poles from Asia.
(Explanation precedes Fig. 4-7.)(Explanation precedes Fig. 4-7.)
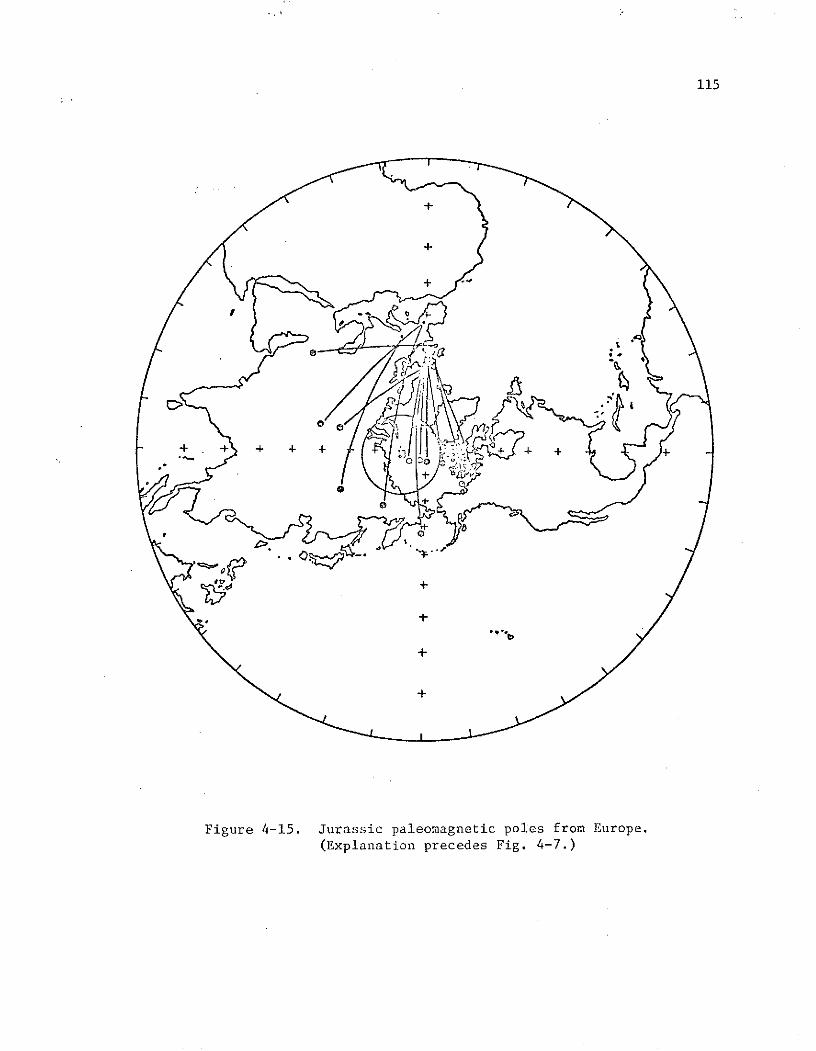
115
++ +
+
+
Figure 4-15. Jurassic paleomagnetic poles from Europe.(Explanation precedes Fig. 4-7.)

116
+
164
+
+0.
Figure 4-16. Cretaceous paleomagnetic poles from NorthAmerica. (Explanation precedes Fig. 4-7.)
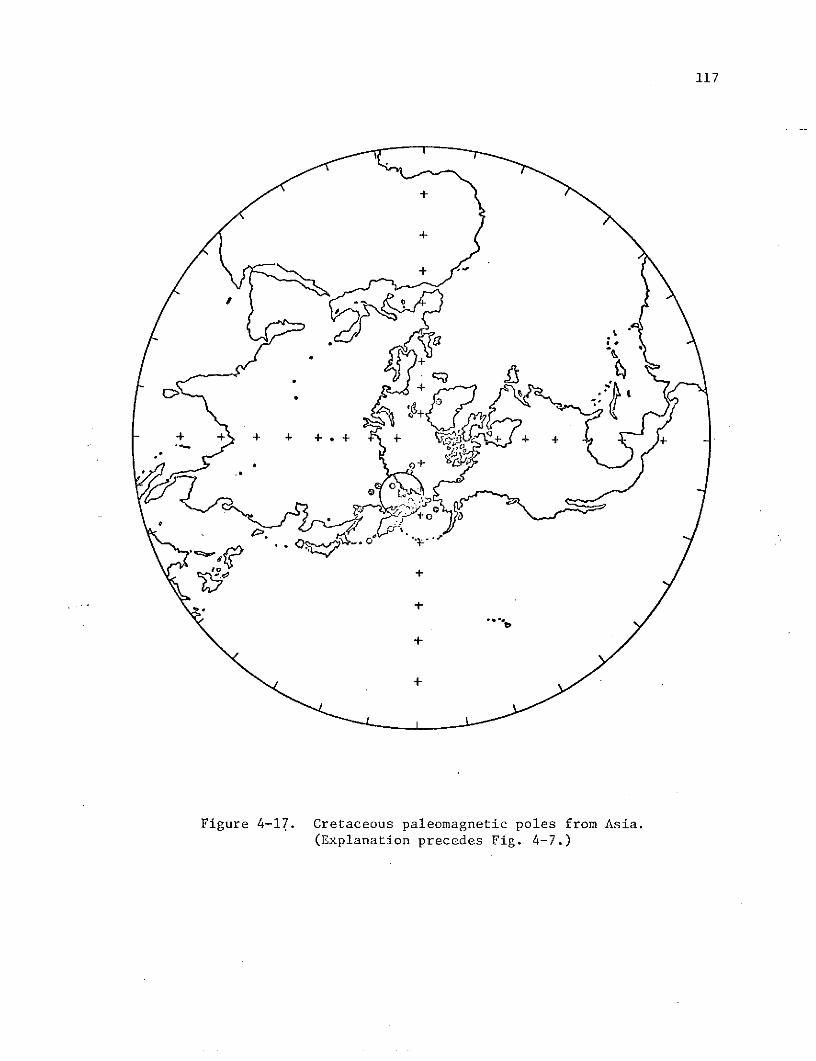
117
+ .
+
(Explanation precedes Fig. 4-7.)(Explanation precedes Fig. 4-7.)

118
+ +
(Explanation precedes Fig. 4-7.)
+: ~
(Exlanation precedes Fig. 4-7.)
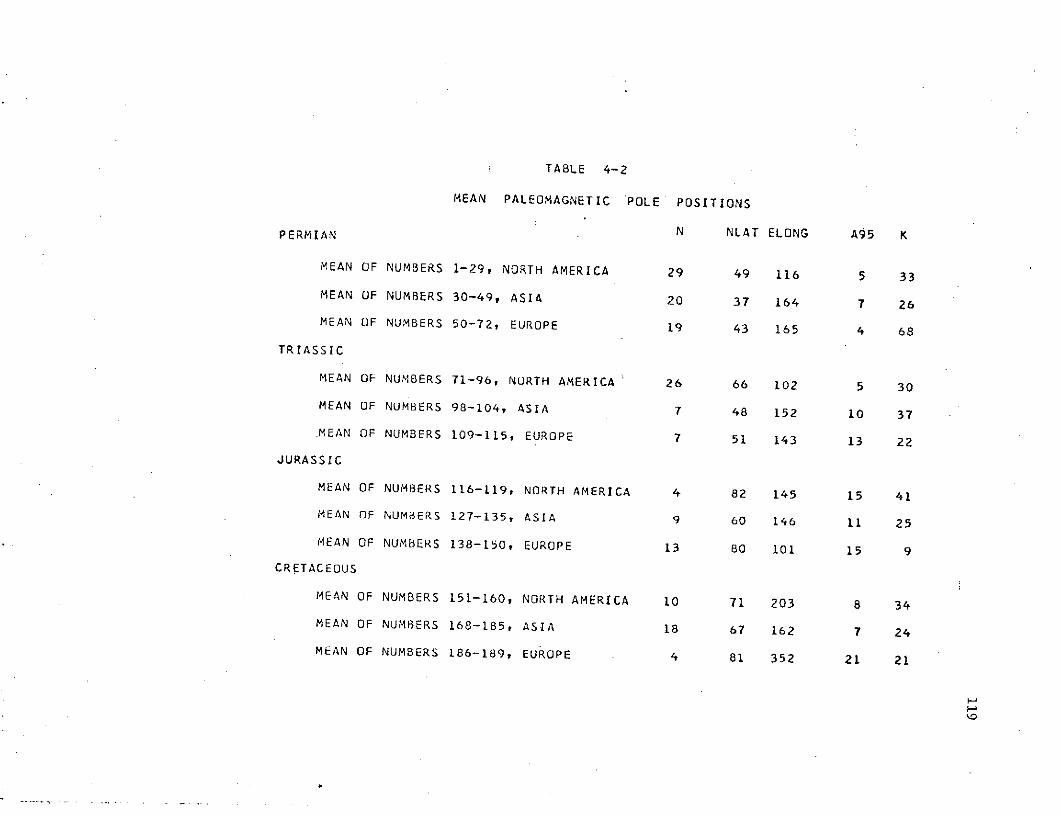
TABLE 4-2
MEAN PALEOMAGNETIC -POLE POSITIONS
PERMIAN N NLAT ELONG A95 K
MEAN OF NUMBERS 1-29, NORTH AMERICA 29 49 116 5 33
MEAN OF NUMBERS 30-49, ASIA 20 37 164 7 26
MEAN OF NUMBERS 50-72, EUROPE 19 43 165 4 68
TRIASSIC
MEAN OF NUMBERS 71-96, NORTH AMERICA 26 66 102 5 30
MEAN OF NUMBERS 98-104, ASIA 7 48 152 10 37
.MEAN OF NUMBERS 109-115, EUROPE 7 51 143 13 22
JURASSIC
MEAN OF NUMBERS 116-119, NORTH AMERICA 4 82 145 15 41
MEAN OF NUMBERS 127-135, ASIA 9 60 146 11 25
MEAN OF NUMBERS 138-150, EUROPE 13 80 101 15 9
CRETACEOUS
MEAN OF NUMBERS 151-160, NORTH AMERICA 10 71 203 8 34
MEAN OF NUMBERS 168-185, ASIA 18 67 162 7 24
MEAN OF NUMBERS 186-189, EUROPE 4 81 352 21 21

120
the Franciscan Formation. Pole 126 comes from the Island Intrusives
on Vancouver Island. It is interesting to note that the poles from
west of the Sierra Nevada Mountains are spread out along a great
circle. There is no obvious explanation for this, and any explanation
must take into account the diverse rock types, northerly geographic
spread of sites, and the time span represented.
The Cretaceous paleomagnetic poles for North America (Fig. 4-16)
have been divided into those from sites east of the Sierra Nevada
Mountains, because the Cretaceous results are probably influenced by
whatever affected the west coast Jurassic results. Pole 163 from
Cretaceous plutonic rocks in Washington indicates a paleolatitude 25
degrees south of its present position (Beck and Noson, 1972). It is
of interest to note here that the Triassic Guichon batholith in
western British Columbia gives a similarly anomalous pole (pole 97,
Fig. 4-10). Other west coast Cretaceous poles (161, 162, 164, 165)
do not indicate such a large displacement. Poles 166 and 167 from
the northeast Pacific have been determined for the Great Magnetic
Bight (Vine, 1968) and the Hawaiian seamounts (Francheteau et al.,
1970), respectively, and are displaced in the same general direction
as the Alaskan data. Tertiary seamounts in the northeast Pacific have
poles which lie on the trend between the Cretaceous and the present
geographic pole (Francheteau et al., 1970).
Polar wandering curves have been constructed (Figs. 4-19 to
4-21) from the data listed in the Appendix. Unfortunately most
pole positions are not well enough defined at the 95% confidence level
to show small movements of the poles, but all accurately portray the

121
+
+
P4
+
Figure 4-19. Polar wandering curve for North America.Mean paleomagnetic poles within 95% circlesof confidence.

122
+Q
K +
+
Figure 4-20. Polar wandering curve for Asia. Meanpaleomagnetic poles within 95% circlesof confidence.

123
+
+
P +
Figure 4-21. Polar wandering curve for Europe. Meanpaleomagnetic poles within 95% circles ofconfidence.

124
trends of the motions involved. A schematic picture (Fig. 4-22)
combining these polar wandering trends clearly indicates a contrast
between the Jurassic pole from southern Alaska and the poles for
Permian through Cretaceous from North America, Asia, and Europe. In
fact, assuming the Alaskan Cretaceous pole lies between the Jurassic
pole and the present magnetic dipole, the southern Alaskan results
have the same trend as the results from the northeast Pacific.
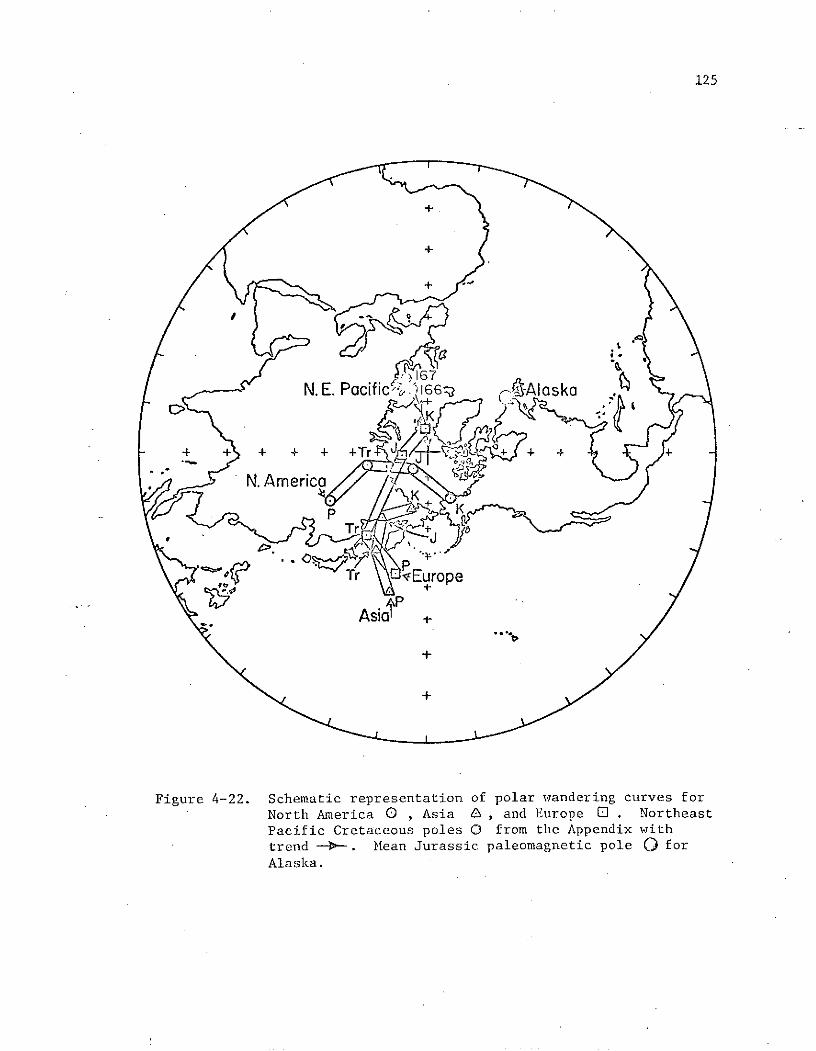
125
67N. E. Pacific-' 166- ,-Alaska
+ + + + + +Tr +~4 + +
N. America
+ K
Tr qEurope
Asia +
Figure 4-22. Schematic representation of polar wandering curves for
North America 0 , Asia 8 , and Europe 0 . Northeast
Pacific Cretaceous poles O from the Appendix withtrend --+ . Mean Jurassic paleomagnetic pole O forAlaska.

V. TECTONIC IMPLICATIONS OF ALASKAN PALEOMAGNETIC DATA
SUMMARY AND CONCLUSIONS
For the purpose of defining the Alaskan orocline, over 400
oriented cores of Permian, Triassic, Jurassic, and Cretaceous sedi-
mentary and igneous rocks were collected from 34 sites at 10 areas
throughout southern Alaska. After magnetic 'cleaning' in successively
higher alternating fields 179 samples were considered to be stable and
give statistically consistent results within each site and age group.
Due to lack of a sufficient number of stable samples, the results from
Permian, Triassic, and Cretaceous aged rocks are inconclusive. The
nine remaining Jurassic sites represent 100 samples from three general
areas in southern Alaska.
The major conclusion is that the southern Alaskan Jurassic paleo-
magnetic pole is significantly different from the North American
Jurassic pole. These poles indicate that since the Jurassic, southern
Alaska must have moved approximately 18 degrees north and rotated
52 degrees clockwise to reach its present position.
The mean paleomagnetic declinations calculated with respect to
the present, and with respect to Carey's and Grantz's models of the
possible bending of Alaska are not significantly different from one
another, and do not show any systematic change along the strike of the
orocline. Also, the paleomagnetic poles for the Jurassic from Alaska
are separated in the wrong direction to be explained by the Alaskan
orocline. The Alaskan orocline as Carey defined it, therefore, does not
appear to be a valid concept.
126

127
TECTONIC IMPLICATIONS
The above conclusions have obvious implications for any tectonic
interpretation of the geologic history of Alaska and the northeast
Pacific, because the Alaskan Jurassic pole position is significant
and must be accounted for in some way in any explanation of the geo-
logic history of Alaska. The Jurassic pole could be the result of
many local rotations, but due to the internal consistency of the data
and the overall indication of northward movement, this explanation
seems implausible. As a result, it seems worthwhile to present a
possible first attempt at a reconstruction, as an idea of what must
be done to incorporate the results of this paleomagnetic study into
the general understanding of the geology of Alaska.
The geologic history of Alaska is extremely complex, and no
clear understanding of what took place is yet available. It seems
that a reasonable picture can be constructed that explains many
features; however, the following explanation is in no way to be con-
sidered the final explanation, but rather a speculative attempt to
combine geologic and geophysical features from Alaska and the north-
east Pacific.
SPECULATIVE RECONSTRUCTION
For the Jurassic, the paleomagnetic pole for southern Alaska with
respect to the North American pole indicates a latitude equivalent to
that of Oregon-Washington, and an orientation such that the continental
margins are approximately parallel. Although longitude is indetermi-

128
nate from a single pole, it might be worthwhile to assume that in
Jurassic time the southern part of Alaska was attached to the Jurassic
west coast of North America. Because rocks from the western edge of
North America, i.e. west of the Sierra Nevada Mountains, give discor-
dant pole positions (see Chapter IV and Figs. 4-13 and 4-16), some
indicating a clockwise rotation and/or a more southerly latitude in
the past, direct matching of geologic features between the two areas
is not likely.
In the Jurassic, the west coast of North America is thought to
have been generally characterized by a subduction zone. If the
reconstruction presented here is correct, then an explanation of the
Permian and Triassic volcanics, tuffs, pillow lavas, limestones, cherts,
and volcanic breccias found on the northwestern shore of Kodiak Island
requires a small basin or gulf in which spreading and shallow marine
deposition were taking place. A comparable feature today might be
the Gulf of California and Baja California. Jurassic sediments
were deposited around the edges of this gulf also, and make up the
shallow water deposits such as the Naknek and Tuxedni Formations of
the present Alaska Peninsula (see Chapter III). The subduction zone
could also have generated the Jurassic Aleutian Range batholiths on
the Alaska Peninsula.
Lack of a mid Cretaceous sedimentary record on the Alaska Penin-
sula indicates a short period of uplift, possibly representing the end
of subduction at least locally, and the time that southern Alaska became
attached to the Pacific plate. The lower to mid Cretaceous also
appears to correspond to a new plate tectonic regime in the Pacific.

129
This is based on the central and northern Pacific magnetic anomaly
pattern which seems to have originated during the magnetically quiet
late Cretaceous. The east-west oriented anomalies of the north
Pacific, and presumably the ridge generating them appear to have
formed at a site now represented by the Chinook trough (Naugler and
Rea, 1970; Erickson, 1969). Because this occurs in the magnetically
quiet zone, it cannot be dated accurately, but all indications point
to a late Cretaceous age.
The mid Cretaceous uplift and erosion also mark the beginning of
rapid deposition of the mid to upper Cretaceous flysch deposits of
Kodiak Island. These deposits, as described by Moore (1972), formed
in a trough in which the direction of the paleocurrent was parallel
to the present coastline and flowing in what is now a southwesterly
direction. He implies that a gulf situation would best describe the
depositional features. On the Alaska Peninsula, the upper Cretaceous
Chignik and Hoodoo Formations, composed of a basal coal member, silt-
stones, and sandstones, were deposited in large basin-like areas
(see Chapter III).
By the end of the Cretaceous, Alaska was attached to the Pacific
plate, had undergone at least some rotation, and was moving north on
it. The direction of motion of the Pacific plate and hence southern
Alaska may well be represented by "hot spot" trails (Morgan, 1972). Mor-
gan, on the basis of several lines of seamounts generated by "hot spots",
calculated Euler poles about which the Pacific has moved. Over the
past 40 million years, a rotation of 34 degrees about a pole at 67
degrees north and 73 degrees west describes the movement, and for the
130
period from 40-100 million years ago the motion can be represented by
a 45 degree rotation about a pole at 23 degrees north, 100 degrees
west. A trend that ends today at the Cobb seamount is seen in the
Gulf of Alaska. By graphical methods, the 40 million year point, or
the bend in the Cobb or Gulf of Alaska seamount line is placed just
to the south of Kodiak Island. It should perhaps be noted that
Jackson et al. (1972) have dated the bend in the Hawaiian-Emperor
Chain at approximately 25 million years, compared with the 40 million
year date of Morgan (1972). The different dates have little effect
on the reconstruction presented here, because of its ill-defined time
scale.
In terms of other evidence for motions of the Pacific plate,
from the reconstruction presented it is not possible to decide between
the models presented by either Atwater (1970) or Hayes and Pitman
(1970). This is largely due to the fact that southern Alaska must
have been essentially in its present position by the time the Kula
ridge disappeared.
On the basis of Churkin's (1970a) geologic correlations of the
geology between Siberia and North America (see Chapter I) and Stone-
ley's (1971) note on Alaska's geologic evolution, it is likely that
the Brooks range was separated from southern Alaska in the Jurassic
because of southern Alaska's Jurassic paleolatitude. The compression
created by southern Alaska's northward motion must have been taken up
on the north side of the southern Alaska block. Since all the required
motion could not have been taken up on the large thrust faults present
in the Brooks Range today (Tailleur and Brosge, 1970), a subduction

131
zone is required. It seems likely that this zone must have been
located between the Brooks Range and the Alaska Range, and is possi-
bly represented today by the Tintina and Kobuk systems in Alaska, and
the Koryak Mountain system in eastern Siberia. Perhaps an ocean basin
extended eastward, almost to the Canadian b.order, and this ocean, (the
Yukon Ocean!) together with the present Bering Sea, would have been
part of the Kula or North Pacific plate, as the Aleutian subduction
zone had not yet formed.
By latest Cretaceous or early Eocene time the Yukon Ocean was
closing rapidly, and imposing severe restraints on the motion of
southern Alaska. As a result of the increased resistance a new trench
system on the south margin of the southern Alaska block began to form.
The line of weakness formed by this new trench propagated out from the
North American continental edge to Unimak Island and on across to the
Kamchatka Peninsula. The ancestral western Aleutian trench and arc
were formed, thereby cutting off the Bering Sea, and effectively
shortcircuiting the Koryak Trench. The oldest rocks on the eastern
Aleutian Islands are lower Cretaceous to Eocene (Coats, 1956), and
the oldest rocks on the western islands, the Komandorsky's, are Oligo-
cene (Vaslov, 1967), perhaps indicating development from the east.
One line of evidence for the time of onset of the eastern Aleutian
subduction might be found in the upper Paleocene-lower Eocene Shumigan
batholiths, which are exposed in the Shumigan Islands and on the north-
west shore of Kodiak Island. These intrusives were probably formed at
a time when the trench dipped at a steep angle, therefore generating
the batholiths close to the trench. As the dip of the subduction zone

132
became shallower, another group of batholiths was intruded to the
northwest, and is exposed along the southeastern shore of the present
Alaska Peninsula. These batholiths, exposed at many bays along the
length of the Alaska Peninsula, are thought to be Oligocene or Miocene
in age.
By middle Eocene the paleogeography must have been roughly similar
to that seen today, although it is likely that the change from largely
north-south to northwest-southeast motion as suggested by the 0-40
million year "hot spot" trails (Morgan, 1972) further widened the Gulf
of Alaska. It is also unlikely that Kodiak was above sea level until
after the large-scale deformation and uplift that took place in the
Pliocene.
Much of the faulting pattern observed in Alaska today might
possibly be explained as the result of the closing of the Yukon Ocean.
It was postulated by Grantz (1966) that the faulting in the western
half of Alaska could possibly be the result of compressional stress
along an axis running west-northwest to east-southeast, and that the
fault patterns represent conjugate faulting (see Chapter I). There is
conjugate faulting in the Yukon Delta region, and the Iditarod-Nixon
Fork and the Aniak-Thompson Creek faults may be part of this pattern.
The north striking part of the Denali fault system, the Chatham
Strait fault, was probably associated with the transform fault system
along which Alaska moved north. The western Denali faults, the Holit-
na and Togiak-Tikchik faults, must be the result of interaction between
the southern Alaska and central Alaska blocks upon collision.

133
The paleomovements of the central block (the portion of Alaska
between the Denali and the Tintina-Kaltag fault systems) and the
northern block (essentially the Brooks Range) have not been defined
paleomagnetically due to a lack of data. One site from the Devonian
of the western Brooks Range (Stone, unpublished data) indicates a
more northerly latitude with respect to North America, although the
exact position is uncertain.
RECOMMENDATIONS FOR FUTURE WORK
Further collection of the Jurassic on the Alaska Peninsula would
reduce the scatter of the results presented in this study, although it
would be unlikely to change the pole position significantly. Paleo-
magnetically, it is most important to sample thoroughly and systemati-
cally the several sections of Cretaceous and Cenozoic rocks exposed
on the Alaska Peninsula. These samples would facilitate a better time
resolution, a greater time span, and allow a polar wandering curve to
be constructed.
To further investigate Carey's orocline, Mesozoic rocks from the
eastern limb need to be collected. It would appear that a good study
of the many dated batholiths in western Canada could yield worthwhile
results, assuming the geology is well enough known to make a reason-
able guess at the ancient horizontal.
It is also important to paleomagnetically collect from the Brooks
Range, the northern block, and from the central block, in an attempt
to distinguish the role each has played in the tectonic history of
Alaska. Samples, which gave consistent results, from the Paleozoic

134
sections of the Brooks Range have been collected by Humble Oil and
Refining Company. In this area it is moderately easy to find suitable
limestones, shales, and sandstones, although access to the region is
difficult.
Samples from the central or interior portion of Alaska, especially
the western segment, hold the least chance of giving successful results
because of the intense deformation throughout most of the area. Expo-
sures are also extremely small and little can be determined about the
overall structure. Intrusive complexes are probably the logical
choice, if their age and ancient horizontal are well known.

APPENDIX
135

136
Paleomagnetic Directions and Pole Positions
Permian, Triassic, Jurassic, and Cretaceous age rocks from selected
sites in North America, Asia, and Europe.
Column 1 gives the map reference number of poles used in text and
figures.
Column 2 gives the location of the sampling sites by country and
geographical coordinates.
Column 3 gives name of the rock unit sampled and in some cases
specific locations. An asterisk followed by a number refers
to a special note listed at the end of the table. Abbrevia-
tions used are: combined - CMB; rocks - RX; sedimentary
rocks - SEDS.
Column 4 gives relative age-of the rock unit studied according to the
following symbols: Permian (P), Triassic (TR), Jurassic (J),
and Cretaceous (K), followed by U, M, or L, meaning Upper,
Middle, or Lower portion of that geologic age.
Column 5 gives population used in statistical computations--usually
the number of samples (pieces of rock oriented individually),
but in a few cases, the number of specimens cut from these
oriented rocks.
Columns 6 and 7 give the mean declination, in degrees east of true
north, and mean inclination, in degrees below (+) or above
(-) horizontal, after correction for known local tectonic
movement.
Columns 8 and 9 give the radius in degrees of the a95 circle of con-
fidence about the mean paleofield direction and the Fisher
(1953) parameter, k.
Columns 10 and 11 give the coordinates of the paleomagnetic pole
position in degrees north latitude and east longitude.
Columns 12 and 13 give the estimates of error, in degrees, of the pole
position in either DMA, DP, the semi-axes of the elliptical
error at the 95% confidence level, or A95, the radius of the
circular error at the 95% confidence level--whichever was
listed in the literature.
Column 14 gives the number of the reference from which these data were
taken, listed after the notes at the end of this table.
For further explanation and remarks, see Chapter IV.

PALEOMAGNETIC DIRECTIONS AND POLE POSITIONS
DIRECTION POLE POSITIONNO LOCATION ROCK NAME AGE N D I A95 K NLAT ELONG (DMDP) A95 REF
PERMIAN
I USA 39.5N,81W DUNKARD SERIES PL 57 164 8 4 177 44 122 2,4 17
2 USA 35.5N,105.2W YESO FM PL-M 143 -1 3 99 41 127 23 14
3 USA 35N,107W ABO FM CMB PL 153 32 30 100 14
4 USA 38N,109W CUTLER FM CMB P 130 20 34 107 14
5 USA 36.1N, 12.2W TORUWEAP FM GRAND CANYON P 11 157 3 7 36 47 103 4,7 20
6 USA 36.1N,112.2W HERMIT SHALE GRAND CANYON P 4 161 -7 8 76 53 101 4,8 20
7 USA 36.1N,112.ZW CUTLER GROUP P 14 151 -11 6 54 49 117 3,6 20
8 USA CUTLER FM, UTAH P 44 166 8
9 USA 27-37N,97-132W SUPAI FM, OAK CREEK PL 50 .163 1 8 40 51 96 23
10 USA 27-37N,97-132W SUPAI FM, HERMIT TRAIL PL 5 152 13 40 105 23
11 USA 27-37N,97-132W CUTLER FM-2 MEMBERS PL 16 134 9 9 17 30 126 23
12 USA 27-37N,97-132W CUTLER FM-HALGAITO MBR PL 14 151 -11 6 54 49 117 23
13 USA 27-37N,97-132W ABO FM PL 33 152 2 8 77 46 116 23
14 USA 27-37N,97-132W HENNESSEY SHALE PM 5 157 -10 53 122 23
15 USA 27-37N,97-132W TOROWEAP ALPHA MBR PM 6 154 -20 7 36 55 117 23
16 USA 27-37N,97-132W GARBER FM PM 7 348 41 74 125 23
17 USA 27-37N,97-132W WELLINGTON FM PM 11 159 -6 51 118 23
18 USA 27-37N,97-132W HERMIT SHALE PM .6 158 32 33 93 23
19 USA 27-37N,97-132W CUTLER-ORGAN ROCK P8R PM .2 138 21 12 14 28 117 23
20 USA 27-37N,97-132W DEWEY LAKE FM PU 4 336 5 52 119 23
I-.
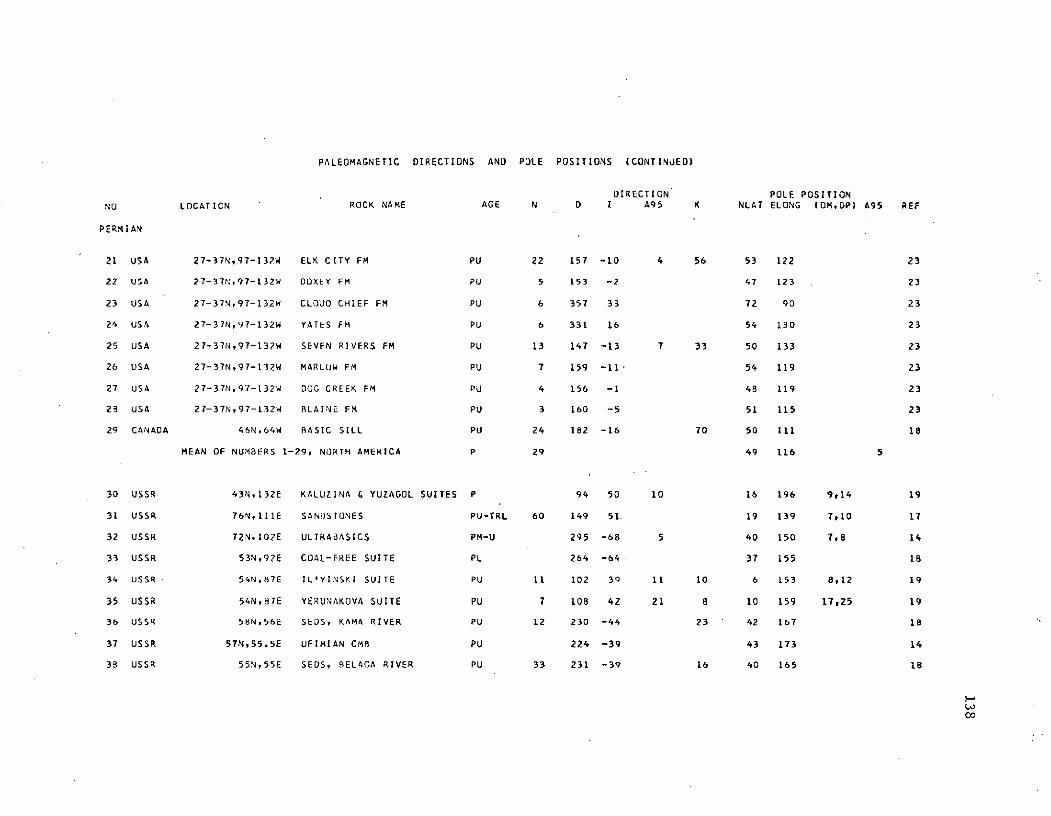
PALEOMAGNETIC DIRECTIONS AND POLE POSITIONS (CONTINUED)
DIRECTION POLE POSITIONNO LOCATION ROCK NAME AGE N D I A95 K NLAT ELONG (DM,DP) A95 REF
PERMIAN
21 USA 27-37N,97-132W ELK CITY FM PU 22 157 -10 4 56 53 122 23
22 USA 27-37t:,97-132W DOXEY FM PU 5 153 -2 47 123 23
23 USA 27-37N,97-132W CLOUO CHIEF FM PU 6 357 33 72 90 23
24 USA 27-37N,97-132W YATES FM PU 6 331 16 54 130 23
25 USA 27-37N,97-132W SEVEN RIVERS FM PU 13 147 -13 7 33 50 133 23
26 USA 27-37N,97-132W MARLUW FM PU 7 159 -11 54 119 23
27 USA 27-37N,97-132W DOG CREEK FM PU 4 156 -1 48 119 23
28 USA 27-37N,97-132W BLAINE FM PU 3 160 -5 51 115 23
29 CANADA 46N,64W BASIC SILL PU 24 162 -16 70 50 111 18
MEAN OF NUMBERS 1-29, NORTH AMERICA P 29 49 116 5
30 USSR 43N,132E KALUZINA & YUZAGOL SUITES P 94 50 10 16 196 9,14 19
31 USSR 76N,111E SANI)STONES PU-TRL 60 149 51. 19 139 710 17
32 USSR 72N,102E ULTRABASICS PM-U 295 -68 5 40 150 7,8 14
33 USSR 53N,92E COAL-FREE SUITE PL 264 -64 37 155 18
34 USSR 54N,87E ILIYINSKI SUITE PU 11 102 39 11 10 6 153 8,12 19
35 USSR 54N,87E YERUNAKOVA SUITE PU 7 108 42 21 8 10 159 17,25 19
36 USSR 58N,56E SEDS, KAMA RIVER PU 12 230 -44 23 42 167 18
37 USSR 57N,55.5E UFIMIAN CMB PU 224 -39 43 173 14
38 USSR 55N,55E SEDS, BELAGA RIVER PU 33 231 -39 16 40 165 18
Co

PALEOMAGNETIC DIRECTIONS AND POLE POSITIONS (CONTINUED)
DIRECTION POLE POSITION
NO LOCATION ROCK NAME AGE N 0 I A95 K NLAT ELONG (OM,DP) A95 REF
PERMIAN
39 USSR 57N,55E KAZANIAN CMB PU 227 -43 45 170 14
40 USSR 57N,54E SEDS, KAMA RIVER PU 54 233 -42 22 40 163 18
41 USSR 55N,53E SEDS PU 7 40 37 13 21 44 176 11,17 17
42 USSR 54N,53E SEDS, ZAVOLZH'E PU 44 227 -39 41 42 167 18
43 USSR 59N,SOE SEDS, VYATKA RIVER PU 15 228 -41 9 42 165 18
44 USSR 55N,49E SEDS, VOLGA RIVER PU 23 215 -44 20 51 178 18
45 USSR 53-61N,46-54E TARTARIAN CMB PU 42 44 4 189 47 169 4,4 14
46 USSR 60N,45E SEDS, SUKHONA RIVER PU 81 222 -43 16 45 167 18
47 USSR 48N,38F SAKMAR PL 82 219 -19 33 41 165 18
48 USSR 4BN,38E DONBASS RED SEDS PL 225 -9 33 161 14
49 USSR 49N,38E DONBASS PL 151 223 -20 37 37 161 18
NEAN OF NUMBERS 30-49, ASIA P 20 37 164 7
50 USSR 63N,159.3E SEDS * 1 P 12 39 52 8 30 52 279 22
51 USSR 54N,88E VOLCANICS PL 13 306 -42 17 6 2 137 14,20 19
52 POLAND 50N,20E VOLCANICS PL 41 205 -16 8 35 43 165 4,8 17
53 POLAND 51N,15.5E LOWER SILESIA VOLCANICS PL 60 196 -4 11 15 43 175 6,11 20
54 CZECH 49.5N,16.6E SANDSTONES P 15 216 -9 36 150 4,4 17
55 FRANCE 43.5N,6.8E ESTEREL IGNEOUS RX CM8 P 201 -18 14 50 146 14
Li.

PALEOMAGNETIC DIRECTIONS AND POLE POSITIONS (CONTINUED)
DIRECTION POLE POSITIONNO LOCATION ROCK NAME AGE N D I A95 K NLAT ELONG (DMDP) A95 REF
PERMIAN
56 FRANCE 43.SN,6.8E ESTEREL IGNEOUS & SEDS P 207 -16 5 59 47 145 3,5 14
57 FRANCE 48N,6E NIDECK PORPHYRY PM 193 -7 5 22 43 168 3,5 14
58 FRANCE 53.9N,5.7E VOLCANICS, NIDECK-DONON P 193 -13 4 134 41 169 2,4 14
59 FRANCE 46.SN,4.5E MONTCENIS SANDSTONE PM 197 6 4 93 38 162 2,4 14
60 W GERMANY 50N,8E NAHE IGNEOUS RX CMB P 195 -10 43 167 14
61 W GERMANY 48-49N,7-8E ROTLIEGENDE SEDS & LAVA PL 177 1 . 18 27 40 190 14,14 14
62 W GERMANY 49.5N,7E ST WENDEL SANDSTONE PL 181 -9 4 27 45 185 2,4 14
63 BELGIUM 50.3N,6.OE RED CUNGLOMERATE P 58 194 -14 5 129 46 166 3,5 18
64 ENGLAND 51N,4W EXETER TRAPS PL 189 -9 20 15 43 164 10,20 14
65 ENGLAND 51N,4W EXETER LAVAS PL 30 198 -25 7 50 149 4,8 18
66 ENGLAND 51N,4W EXETER LAVAS PL 66 188 -13 7 19 46 165 4,7 18
67 SCOTLAND 55.4N,4.5W MAUCHLINE LAVAS P 180 -4 8 9 36 175 4,8 14
68 SCOTLAND 55.4N,4.5W MAUCHLINE SEDS P 187 -6 12 5 37 167 6,12 14
69 SCOTLAND 55.4N,4.5W AYRSHIRE KYLITES P 190 2 12 5 34 163 6,12 14
70 NORWAY 59.7N,10.4E IGNEOUS COMPLEX PL 204 -36 1 21 47 157 1,2 14
MEAN OF NUMBERS 52-70, EUROPE P 19 43 165 4
I-0

PALEOMAGNETIC DIRECTIONS AND POLE POSITIONS (CONTINUED)
DIRECTION POLE POSITION
NO LOCATION ROCK NAME AGE N D I A95 K NLAT ELONG (DM,DP) A95 REF
TRIASSIC
71 USA 36-45N,65-80W INTRUSIVES & SEDS TRU 682 68 91 6,6 18
72 USA 41.5N,72-7W HULYOKE VOLCANIC UNIT TRU 150 12 25 3 146 60 83 2,3 6
73 USA 41.5N,72-7W TALCOTT VOLCANIC UNIT TRU 111 18 12 4 185 51 72 4,8 6
74 USA 41.5N,72-7W HAMPDEN VOLCANIC UNIT TRU 146 4 43 4 102 73 92 3,5 6
75 USA 41.5N,72-7W WEST ROCK GIANT DIKE TRU 40 9 29 4 136 63 89 3,6 6
76 USA 41.SN,72-7W HAMPDEN VOLCANIC UNIT TRU 54 O 49 7 34 79 106 7,9 6
77 USA 41.5N,72-7W MT CARMELL SILL TRU 67 10 26 4 32 61 87 3,6 6
78 USA 41.5N,72-7W CHESHIRE DIKES TRU 41 1 47 4 31 76 103 4,5 6
79 USA 42N,72.5W MASSACHUSETTS LAVAS- TRU 10 16 10 41 55 88 6,11 14
80 USA 42N,73W CONN VALLEY ROCKS TRU 12 14 15 54 86 8,15 14
81 USA 40.5N,74.9W NEWARK GROUP, NJ TRU 359 25 4 49 63 108 3,4 14
82 USA 40N,7b.5W DIABASE, PENNSYLVANIA TRU 95 0 23 3 102 62 105 2,3 17
83 USA 40N,77W NEW OXFORD FM TRU 334 48 7 36 66 174 6,8 14
84 USA 35-39N,105-111W CHINLE FM CMB TRU 55 93 14
85 USA 39.6N,106.6W UPPER MAROON FM TRL 48 346 16 56 100 19
86 USA 43N,108.5W CHUG4ATER FM (REVERSED) TRL 116 142 -31 6 5 48 171 4,7 18
87 USA 43N,108.5W CHUGWATER FM (NORMAL) TRL 47 348 39 7 10 70 143 5,8 18
88 USA 38.6N1I08.9W MOENKOPI FM TRL 318 346 17 5 85 57 89 3,5 20
89 USA 36.IN,112.2W HOSKINNINI TONGUE TRL 18 150 -16 7 23 50 121 4,7 20
90 USA 37N,113W SPRINGOALE SANDSTONE TRU 338 16 55 107 14
--

PALEOMAGNETIC DIRECTIONS AND POLE POSITIONS (CONTINUED)
DIRECTION POLE POSITIONNO LOCATION ROCK NAME AGE N D I A95 K NLAT ELONG (UMDP) A95 REF
TRIASSIC
91 CANADA 55.9N,63.4W .MISTASTIN LAKE VOLCANICS TRU 73 180 -68 2 86 118 3.3 20
92 CANADA 44.9N,65.4W NORTH MTN BASALT TRU 40 4 47 5 33 73 104 . 5,7 19
93 CANADA 44.5N,66.5W GRAND MANAN IS LAVAS TRU 8 3 55 16 12 80 100 17,24 19
94 CANADA 44N,66W DIABASE DIKE TRU 22 7 41 5 94 69 98 4,6 17
95 CANADA 52N,68W MANICOUAGAN STRUCTURE TRL 82 12 42 60 88 4,6 18
96 CANADA 51.5N,68.5W MANICOUAGAN DACITE TRL 24 12 36 10 49 57 89 6.11 18
MEAN OF NUMBERS 71-96, NORTH AMERICA TR 26 66 102 5
97 CANADA 50N,120-121W GUICHON BATHOLITH * 2 TRU 184 20 51 10 12 66 13 27
98 USSR 75N,108E RED SANI)STONE, TAIMYR TR 130 68 6 40 147 8,10 14
99 USSR 43N,132E SEDS, LIANGCHI RIVER TRM 56 70 10 53 184 15,17 19
100 USSK 71N101E SIDERIAN PLATFORM RX CMB TR 115 63 264 34 153 14
101 USSR 63-67N,88-114E SIBERIAN TRAPS CMB TR 60 133 11,11 14
102 USSR 56N,65E VOLCANICS TR 66 59 9 44 142 11,14 19
103 USSR 48-59N,38-52E TRL SUITES CM6 TRL 51 159 14
104 USSR 49Nt38E SEDS, OONBASS TRL 7 42 46 18 13 51 146 14,22 17
MEAN OF NUMBERS 98-104, ASIA TR 7 48 152 10
105 CHINA DOLERITE, PEKING * 3 TR 63 18 32 27 217 14
106 USSR 63-65N,159-159.3E SEDS * I TR 5 63 228 22
I-
.1:

PALEOMAGNETIC DIRECTIONS AND POLE POSITIONS (CONTINUED)
DIRECTION POLE POSITIONNO LOCATION ROCK NAME AGE N D I A95 K NLAT ELONG (OM,DP) A95 REF
TRIASSIC
107 USSR 76N,1IIE SANDSTONES TRM 98 168 18 4 303 4,8 17
108 USSR 76N,111E SANDSTONES TRL 160 161 39 9 129 6,10 17
109 CZECH 48.9N,19.2E WERFENIAN STRATA TRL 21 6 19 51 190 3,3 17
110 GERMANY 46.4N,11-7E LADINIAN VOLCANICS TRM 8 24 14 46 155 19
111 FRANCE 48.5N,7E VOSGE SANDSTONE CMB TRL 25 16 44 151 14
112 FRANCE 43N,1.3E VOLCANICS TRL' 26 29 47 7 69 62 114 8,8 19
113 ENGLAND 53N,2W KEUPER KARIS TRU 33 27 12 18 43 131 6,12 14
114 ENGLAND 50.7N,3.2W KEUPER MARIS (SIDMOUTH) TRU 30 23 44 134 14
115 SCOTLAND 55.6N,5.3W NEW RED SANDSTONE, ARRAN TR 214 -48 21 3 54 118 14
MEAN OF NUMBERS 109-115, EUROPE TR 7 51 143 13
.J
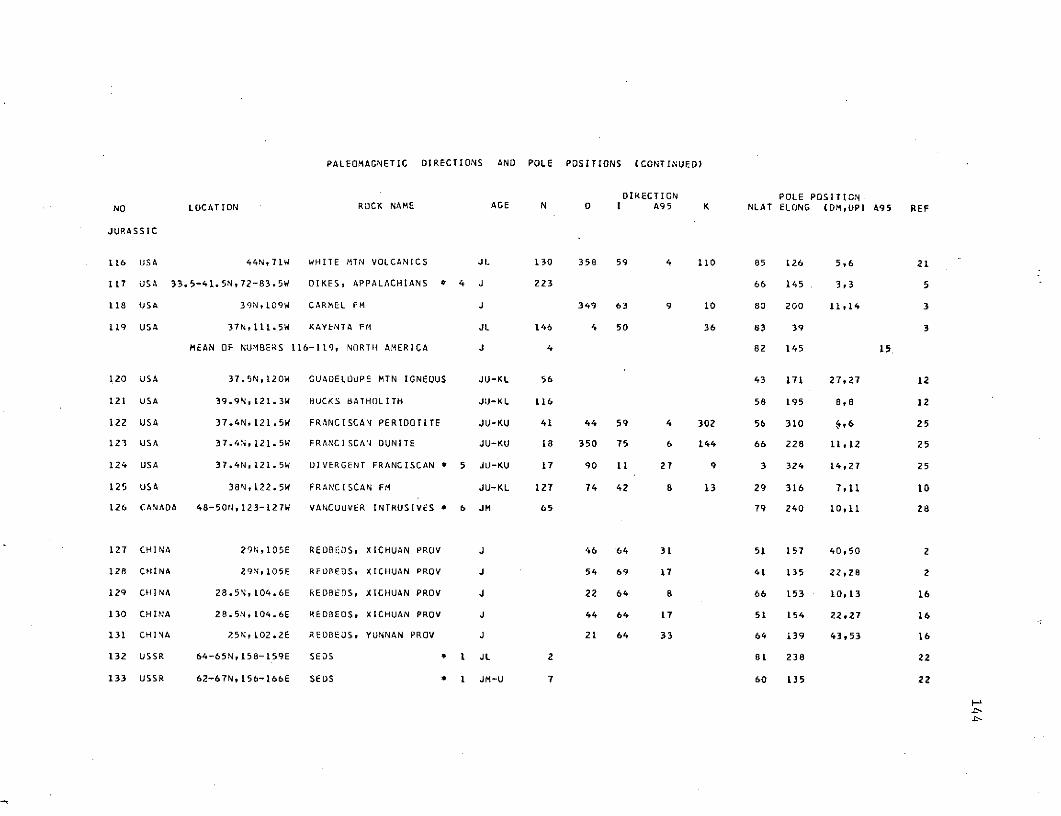
PALEOMAGNETIC DIRECTIONS AND POLE POSITIONS (CONTINUED)
DIRECTION POLE POSITIONNO LOCATION ROCK NAME AGE N D I A95 K NLAT ELONG (DM,UP) A95 REF
JURASSIC
116 USA 44N,71W WHITE MTN VOLCANICS JL 130 358 59 4 110 85 126 5,6 21
117 USA 33.5-41.5N,72-83.5W DIKES, APPALACHIANS * 4 J 223 66 145. 3,3 5
118 USA 39N,109W CARMEL FM J 349 63 9 10 80 200 11,14 3
119 USA 37N,111.5W KAYENTA FM JL 146 4 50 36 63 39 3
MEAN OF NUMBERS 116-119, NORTH AMERICA J 4 82 145 15
120 USA 37.5N,120W GUADELOUPE MTN IGNEOUS JU-KL 56 43 171 27,27 12
121 USA 39.9N,121.3W BUCKS 8AIHOLITH JU-KL 116 58 195 8,8 12
122 USA 37.4N,121.5W FRANCISCAN PERIDOTITE JU-KU 41 44 59 4 302 56 310 4,6 25
123 USA 37.4N,121.5W FRANCISCAN DUNITE JU-KU 18 350 75 6 144 66 228 11,12 25
124 USA 37.4N,121.5W DIVERGENT FRANCISCAN * 5 JU-KU 17 90 11 27 9 3 324 14,27 25
125 USA 38N,122.5W FRANCISCAN FM JU-KL 127 74 42 8 13 29 316 7,11 10
126 CANADA 48-50N,123-127W VANCUUVER INTRUSIVES * 6 JM 65 79 240 10,11 28
127 CHINA 29N,105E REDBEDS, XICHUAN PROV J 46 64 31 51 157 40,50 2
128 CHINA 29N,105E REOBEDS, XICIHUAN PROV J 54 69 17 41 135 22,28 2
129 CHINA 28.5N,104.6E REOBEDS, XICHUAN PROV J 22 64 8 66 153 10,13 16
130 CHINA 28.5N,104.6E REDBEDS, XICHUAN PROV J 44 64 17 51 154 22t27 16
131 CHINA 25N,102.2E REDBEUS, YUNNAN PROV J 21 64 33 64 139 43,53 16
132 USSR 64-65N,158-159E SEDS * 1 JL 2 81 238 22
133 USSR 62-67N,156-166E SEDS * I JM-U 7 60 135 22
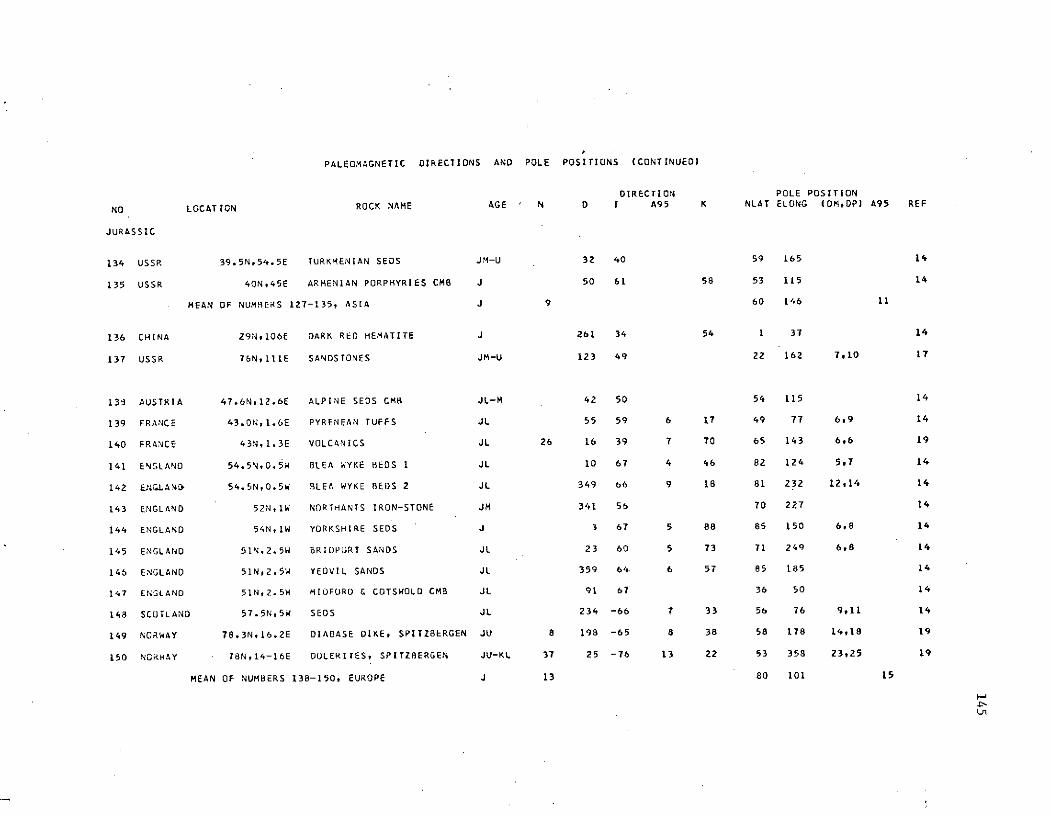
PALEOMAGNETIC DIRECTIONS AND POLE POSIFIONS (CONTINUED)
DIRECTION POLE POSITION
NO LOCATION ROCK NAME AGE N D I A95 K NLAT ELONG (DMtPI A95 REF
JURASSIC
134 USSR 39.5N,54.5E TURKMENIAN SEDS JM-U 32 40 59 165 14
135 USSR 40N,45E ARMENIAN PORPHYRIES CMB J 50 61 58 53 115 14
MEAN OF NUMBERS 127-135, ASIA J 9 60 146 11
136 CHINA 29N,106E DARK RED HEMATITE J 261 34 54 1 37 14
137 USSR 76N,111E SANDSTONES JM-U 123 49 22 162 7,10 17
139 AUSTRIA 47.6N,12.6E ALPINE SEDS CMB JL-M 42 50 54 115 14
139 FRANCE 43.0N,1.GE PYRENEAN TUFFS JL 55 59 6 17 49 77 6,9 14
140 FRANCE 43N,1.3E VOLCANICS JL 26 16 39 7 70 65 143 6,6 19
141 ENGLAND 54.5N,O.SW BLEA WYKE BEDS 1 JL 10 67 4 46 82 124 5,7 14
142 EGLA.~ 54.5N,O.SW BLEA WYKE BEDS 2 JL 349 66 9 18 81 232 12,14 14
143 ENGLAND 52N,1W NORTHANTS IRON-STONE JM 341 55 70 227 14
144 ENGLAND 54N,IW YORKSHIRE SEDS J 3 67 5 88 85 150 6,8 14
145 ENGLAND 51N,2.5W BRIDPORT SANDS JL 23 60 5 73 71 249 6,8 14
146 ENGLAND 51N,2.5W YEOVIL SANDS JL 359 64 6 57 85 185 14
147 ENGLAND 51N,2.5W MIDFORD & COTSWOLD CMB JL 91 67 36 50 14
148 SCOTLAND 57.5N,5W SEOS JL 234 -66 7 33 56 76 9,11 14
149 NORWAY 78.3N,16.2E DIABASE DIKE, SPITZBERGEN JU 8 198 -65 8 38 58 178 14,18 19
150 NORWAY 78N,14-16E DULERITES, SPITZBERGEN JU-KL 37 25 -76 13 22 53 358 23,25 19
MEAN OF NUMBERS 138-150, EUROPE J 13 80 101 15
4-1

PALEOMAGNETIC DIRECTIONS AND POLE POSITIONS (CONTINUED)
DIRECTION POLE POSITION
NO LOCATION ROCK NAME AGE N D I A95 K NLAT ELONG (DM,DP) A95 REF
CRETACEOUS
151 USA 43.5N,72.5W MT ASCUTNEY GABBRO KL 24 150 -54 64 187 21
152 USA 34.5N,92.8W RATHOLITHIC COMPLEXES KL 47 329 54 9 65 187 9,12 20
153 USA 33.3N,104.6W NIOBRARA FM, PUEBLO COLO KU 100 70 240 26
154 USA 41Ntl09W MESAVERDE GROUP SED KU 427 327 69 13 4 65 198 22,24 20
155 USA 34N,11OW DAKOTA SANDSTONE K 164 -62 75 200 9,11 14
156 USA 46N,112W MAFIC OIKE, MONTANA KU 13 53 273 7,7 13
157 USA 46N,112W ELKHORN MTN VOLCANICS KU 73 190 8,8 13
158 CANADA 45.5N,71W MT MEGANTIC INTRUSIVES KL 157 -52 7 44 69 172 7.10 14
159 CANADA 45.3N,72.8W MONTEREGIAN HILLS KL 147 156. -59 2 71 190 2,3 15
160 CANADA 78.7tN,103.7W ISACHEN I)IABASE K 284 80 8 20 69 180 14,14 14
MEAN OF NUMBERS 151-160, NORTH AMERICA K 10 71 203 8
161 USA 37.8N,119.6W GRANITE PLUTONS KU 335 61 4 202 70 171 8,10 4
162 USA 38N,120W SIERRA NEVADA PLUTONS KU 80 69 195 10,10 11
163 USA 48.6N,121W STEVENS PASS GRANITE * 7 KU 4 357 49 11 73 71 68 13 1
164 USA SAN MARCOS GABBRO * 8 KM 81 357 4 9
165 USA 56N,133W ULTRAMAFICS, SE ALASKA KM 77 206 15 9
166 NE PACIFIC GREAT MAGNETIC BIGHT * 9 KU 65 13 7,11 29
167 NE PACIFIC HAWAIIAN SEAMOUNTS * 10 KU 9 61 16 8,8 7
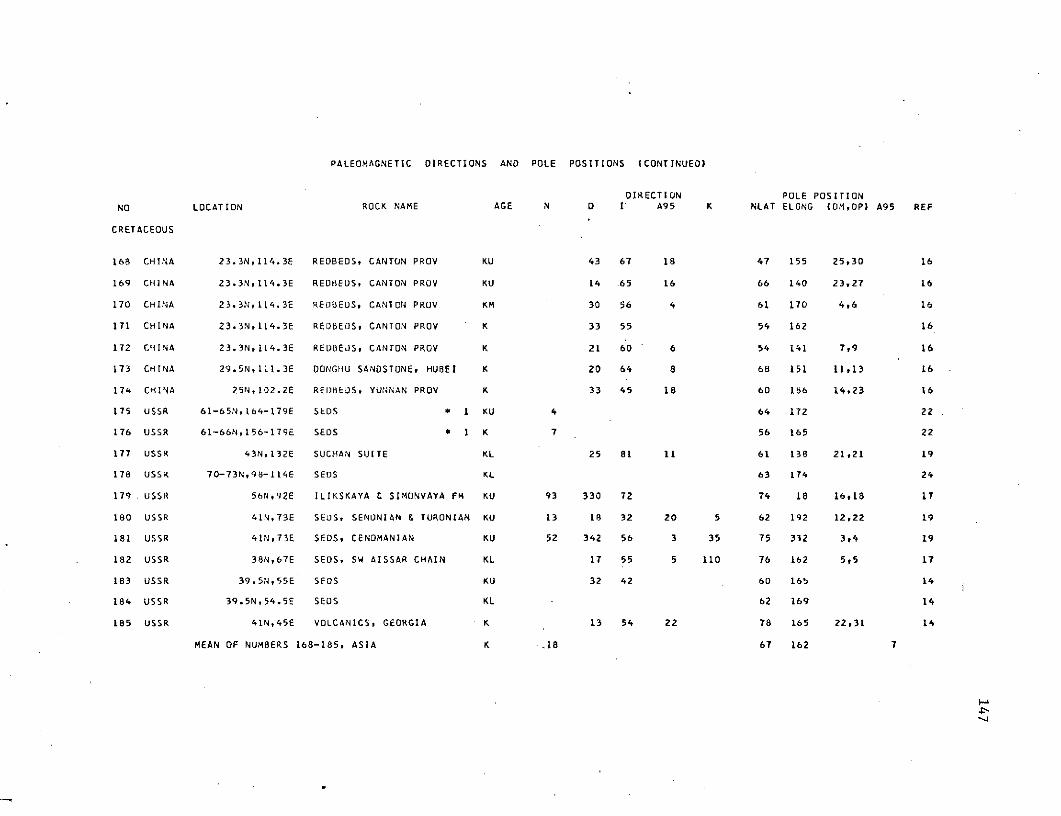
PALEOMAGNETIC DIRECTIONS AND POLE POSITIONS (CONTINUEO)
DIRECTION POLE POSITIONNO LOCATION ROCK NAME AGE N 0 I A95 K NLAT ELONG (DH,DP) A95 REF
CRETACEOUS
168 CHINA 23.3N,114.3E REDBEDS, CANTON PROV KU 43 67 18 47 155 25,30 16
169 CHINA 23.3N,114.3E REDBEUS, CANTON PROV KU 14 65 16 66 140 23,27 16
170 CHINA 23.3N,114.3E REDEDS, CANTON PROV KM 30 56 4 61 170 4,6 16
171 CHINA 23.3N,114.3E REDBEDS, CANTON PROV K 33 55 54 162 16
172 CHINA 23.3N,114.3E REDOBEUS CANTON PROV K 21 60 6 54 141 7,9 16
173 CHINA 29.5N111.3E OONGHU SANDSTONE, HUBEI K 20 64 8 68 151 11,13 16
174 CHINA 25N,102.2E REDBEDS, YUNNAN PROV K 33 45 18 60 16B 14,23 16
175 USSR 61-65N,164-179E SOS * 1 KU 4 64 172 22
176 USSR 61-66N,156-179E SEDS * 1 K 7 56 165 22
177 USSR 43N,132E SUCHAN SUITE KL 25 81 11 61 138 21,21 19
178 USSR 70-73N,98-114E SEDS KL 63 174 24
179 USSR 56N,92E ILIKSKAYA & SIMONVAYA FM KU 93 330 72 74 18 16,18 17
180 USSR 41N,73E SEDS, SENONIAN & TURONIAN KU 13 18 32 20 5 62 192 12,22 19
181 USSR 41N,73E SEDS, CENOMANIAN KU 52 342 56 3 35 75 332 3,4 19
182 USSR 38N,67E SEDS, SW AISSAR CHAIN KL 17 55 5 110 76 162 5,5 17
183 USSR 39.5N,55E SEDOS KU 32 42 60 165 14
184 USSR 39.5N,54.5E SEUS KL 62 169 14
185 USSR 41N,45E VOLCANICS, GEORGIA K 13 54 22 78 165 22,31 14
MEAN OF NUMBERS 168-185, ASIA K '18 67 162 7
f--

PALEOMAGNETIC DIRECTIONS AND POLE POSITIONS (CONTINUED)
DIRECTION POLE POSITION
NO LOCATION ROCK NAME AGE N D I A95 K NLAT ELONG (DM,DP) A95 REF
CRETACEOUS
186 CZECH 46.9N,14.9E SPECULARITE, WALDENSTEIN KU 22 158 -85 15 5 56 8 29,30 17
187 CZECH 50.2N,14.6E SANDSTONES KU 12 358 69 87 347 4,8 17
188 ENGLAND 50.5N,1.5E WEALDEN SEDS KL 345 63 2 260 79 245 2,3 14
189 ENGLAND 51N,O0.5E IRON GRIT, SUSSEX KL 120 2 72 84 11 17.
MEAN OF NUMBERS 186-189, EUROPE K 4 81 352 21
co

149
Footnotes to Appendix
*1. For the most part the -VGP's given are means of means. It was not
always possible to determine from the article (Reference 22) just
which listings were repeated in other listings, which were new
listings, as well as other important information. Therefore these
VGP's should be used with caution.
*2. This pole indicates a clockwise rotation of 40 degrees ± 10 degrees
for the southern part of the interior plateau, British Columbia
(Reference 27).
*3. Samples are from the western hills near Peking, China; the exact
location is not given (Reference 14).
*4. These dikes are stratigraphically dated as upper Triassic to lower
Cretaceous. The Jurassic age is based in part on the paleomagnetic
pole position (Reference 5).
*5. This pole includes 'divergent' sites from both dunite and peridotite
of the Franciscan Formation (Reference 25).
*6. Author states that the anomalous pole position may be explained by
approximately 15 degrees of clockwise rotation and by north-east-
ward tilt of less than or equal to 5 degrees (Reference 28).
*7. Pole is from samples of the Stevens Pass granites from central
Washington and probably indicates a 25 degree northward movement
relative to cratonic North America (Reference 1).
*8. Samples are from the San Marcos gabbro in western California, but
precise location and number of samples or sites not given (Reference
9).
*9. Magnetic field directions and VGP's determined for seamounts by
combining magnetic anomalies and seamount topography (Reference 29).

150
*10. Magnetic field directions and VGP's determined from ratio of
amplitudes of anomalies on north-south to east-west limbs of the
Great Magnetic Bight (Reference 7).

151
REFERENCES
1. Back, M. E. and Linda Noson, Anomalous paleolatitudes in
Cretaceous granitic rocks, Nature, 235, 11-13, 1972.
2. Chen Zhiqiang, Wang Cenghang and Deng Xinghui, Some rusults of
paleomagnetic research in China, in The Present and Past of
the Geomagnetic Field, Nauka Press, Moscow, pp. 309-311,
1965 (translated by E. R. Hope, Directorate of Scientific
Information Services, DRB Canada, T 462 R, 1966).
3. Collinson, D. W. and S. K. Runcorn, Polar wandering and continen-
tal drift: evidence of paleomagnetic observations in the
United States, Bull. Geol. Soc. Amer., 71, 915-958, 1960.
4. Currie, R. G., C. S. Gromme, and J. Verhoogen, Remanent magneti-
zation of some Upper Cretaceous granitic plutons in the
Sierra Nevada, California, J. Geophys. Res., 68, 2263-2279,
1963.
5. deBoer, J., Paleomagnetic-tectonic study of Mesozoic dike swarms
.in the Appalachians, J. Geophys. Res., 72, 2237-2250, 1967.
6. , Paleomagnetic differentiation and correlation of the
Late Triassic volcanic rocks in the central Appalachians (with
special reference to the Connecticut Valley), Bull. Geol. Soc.
Amer., 79, 609-626, 1968.
7. Francheteau, Jean, C. G. A. Harrison, J. G. Slater, and M. L.
Richards, Magnetization of Pacific seamounts: a preliminary
polar curve for the northeastern Pacific, J. Geophys. Res.,
75, 2035-2061, 1970.
8. Gose, W. A. and C. E. Helsley, Paleomagnetic and rockmagnetic
studies of the Permian Cutler and Pennsylvanian Rico forma-
tions, Utah (abstract), EOS Trans. Amer. Geophys. Union, 52,
189, 1971.
9. Gromme, C. S. and G. B. Dalrymple, Paleomagnetism and K-Ar ages
of Cretaceous plutonic rocks (abstract), Fourth U.S.-Japan
Seminar on Paleomagnetism, R. R. Doell, organizer, Honolulu,Hawaii, 1970.
10. Gromme, C. S. and H. J. Gluskoter, Remanent magnetization of
spilite and diabase in the Franciscan formation, western
Marin County, California, J. Geol., 73, 74-94, 1965.
11. Gromme, C. S. and R. T. Merrill, Paleomagnetism of late Cretaceous
granitic plutons in the Sierra Nevada, California: further
results, J. Geophys. Res., 70, 3407-3420, 1965.
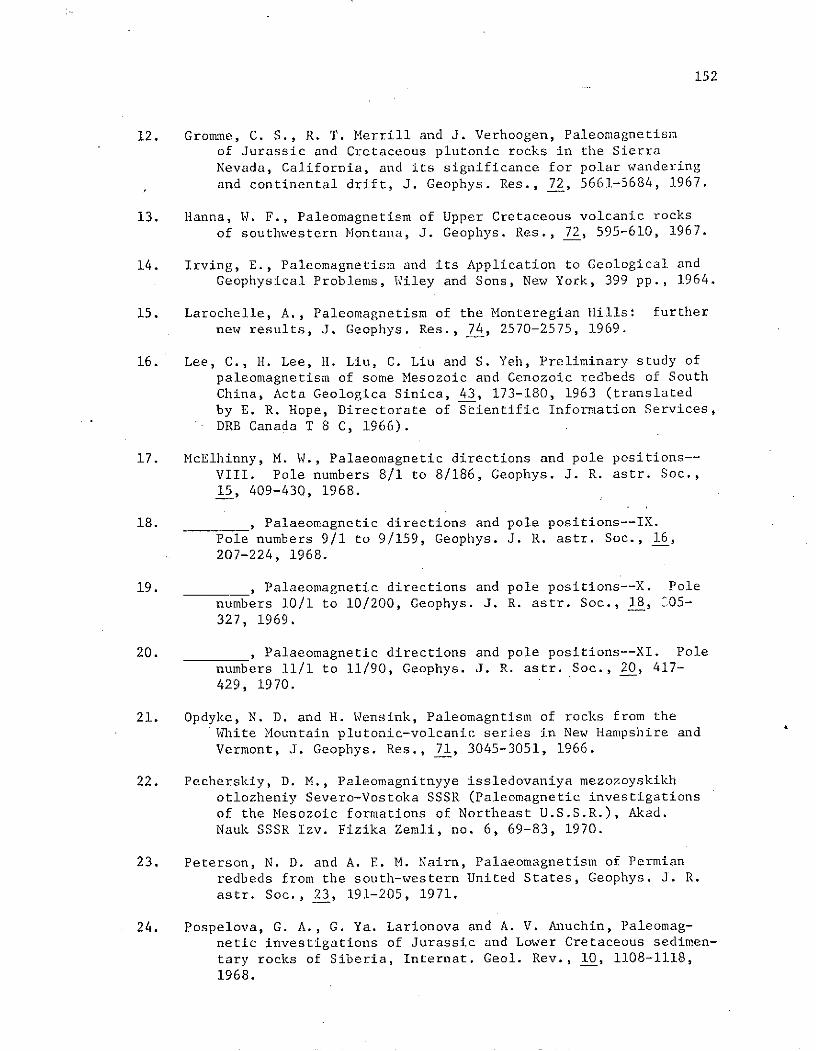
152
12. Gromme, C. S., R. T. Merrill and J. Verhoogen, Paleomagnetismof Jurassic and Cretaceous plutonic rocks in the SierraNevada, California, and its significance for polar wanderingand continental drift, J. Geophys. Res., 72, 5661-5684, 1967.
13. Hanna, W. F., Paleomagnetism of Upper Cretaceous volcanic rocks
of southwestern Montana, J. Geophys. Res., 72, 595-610, 1967.
14. Irving, E., Paleomagnetism and its Application to Geological and
Geophysical Problems, Wiley and Sons, New York, 399 pp., 1964.
15. Larochelle, A., Paleomagnetism of the Monteregian Hills: furthernew results, J. Geophys. Res., 74, 2570-2575, 1969.
16. Lee, C., H. Lee, H. Liu, C. Liu and S. Yeh, Preliminary study ofpaleomagnetism of some Mesozoic and Cenozoic redbeds of SouthChina, Acta Geologica Sinica, 43, 173-180, 1963 (translatedby E. R. Hope, Directorate of Scientific Information Services,
DRB Canada T 8 C, 1966).
17. McElhinny, M. W., Palaeomagnetic directions and pole positions--VIII. Pole numbers 8/1 to 8/186, Geophys. J. R. astr. Soc.,15, 409-430, 1968.
18. , Palaeomagnetic directions and pole positions--IX.
Pole numbers 9/1 to 9/159, Geophys. J. R. astr. Soc., 16,207-224, 1968.
19. , Palaeomagnetic directions and pole positions--X. Pole
numbers 10/1 to 10/200, Geophys. J. R. astr. Soc., 18, :05-327, 1969.
20. , Palaeomagnetic directions and pole positions--XI. Pole
numbers 11/1 to 11/90, Geophys. J. R. astr. Soc., 20, 417-429, 1970.
21. Opdyke, N. D. and H. Wensink, Paleomagntism of rocks from theWhite Mountain plutonic-volcanic series in New Hampshire andVermont, J. Geophys. Res., 71, 3045-3051, 1966.
22. Pecherskiy, D. M., Paleomagnitnyye issledovaniya mezozoyskikhotlozheniy Severo-Vostoka SSSR (Paleomagnetic investigationsof the Mesozoic formations of Northeast U.S.S.R.), Akad.Nauk SSSR Izv. Fizika Zemli, no. 6, 69-83, 1970.
23. Peterson, N. D. and A. E. M. Nairn, Palaeomagnetism of Permian
redbeds from the south-western United States, Geophys. J. R.
astr. Soc., 23, 191-205, 1971.
24. Pospelova, G. A., G. Ya. Larionova and A. V. Anuchin, Paleomag-netic investigations of Jurassic and Lower Cretaceous sedimen-tary rocks of Siberia, Internat. Geol. Rev., 10, 1108-1118,1968.
153
25. Saad, A. H., Paleomagnetism of Franciscan ultramafic rocks fromRed Mountain, California, J. Geophys. Res., 74, 6567-6578,1969.
26. Shive, P. N., Paleomagnetism of the Niobrara formation (abstract),EOS Trans. Amer. Geophys. Union, 52, 822, 1971.
27. Symons, D. T. A., Paleomagnetism of the Triassic Guichon Batho-lith and rotation in the Interior Plateau, British Columbia,Canadian J. Earth Sciences, 8, 1388-1396, 1971.
28. , Paleomagnetism of the Jurassic Island Intrusives ofVancouver Island, British Columbia, Geol. Survey of CanadaPaper 70-63, 1-17, 1971.
29. Vine, F. J., Paleomagnetic evidence for the northward movementof the North Pacific basin during the past 100 m.y. (abstract),Trans. Amer. Geophys. Union, 49, 156, 1968.

REFERENCES
154
155
REFERENCES
Atwater, Tanya, Implications of plate tectonics for the Cenozoic tec-
tonic evolution of western North America, Bull. Geol. Soc. Amer.,81, 3513-3536, 1970.
Barnes, F. F., Geologic map of lower Matanuska Valley, Alaska, U.S.Geol. Survey Misc. Investigations Map 1-359, 1962.
Beck, M. E. and Linda Noson, Anomalous paleolatitudes in Cretaceousgranitic rocks, Nature, 235, 11-13, 1972.
Bingham, Douglas K., Paleosecular variation of the geomagnetic fieldin Alaska, Ph.D. dissertation, Univ. of Alaska, 143 pp., May, 1971.
Brew, D. A., R. A. Loney and L. J. P. Muffler, Tectonic history ofsoutheastern Alaska, in A Symposium on Tectonic History and MineralDeposits of the Western Cordillera in British Columbia and Neigh-boring Parts of the United States, Can. Inst. Hin. Metall., Spec.
Vol. 8, pp. 149-170, 1966.
Briden, James C., Paleoclimatic evidence of a geocentric axial dipolefield, in Phinney, Robert A., editor, The History of the Earth'sCrust, Princeton, pp. 178-194, 1968.
Bullard, Edward, J. E. Everett and A. G. Smith, The fit of the conti-nents around the Atlantic, in A Symposium on Continental Drift,Royal Soc. London Philos Trans., Ser. A., no. 1088, 41-51, 1965.
Burk, C. A., Geology of the Alaska Peninsula - Island Arc and Conti-nental Margin, Geol. Soc. Amer. Mem. 99,250 pp., 1965.
Cameron, Christopher P., Paleomagnetism of Shemya and Adak Islands,Aleutian Islands, Alaska, Ph.D. dissertation, Univ. of Alaska,164 pp., May, 1970.
Cameron, Christopher P. and David B. Stone, Outline geology of theAleutian Islands with paleomagnetic data from Shemya and AdakIslands, Sci. Rept., Univ. of Alaska, Geophys. Inst. and GeologyDept. UAG R-213, 153 pp., 1970.
Capps, S. R., Geology of the upper Matanuska Valley, Alaska, with asection on the igneous rocks by J. B. Mertie, Jr., U.S. Geol.Survey Bull. 791, 92 pp., 1927.
, Geology of the Alaska Railroad region, U.S. Geol. Survey
Bull. 907, 201 pp., 1940.
Carey, S. W., The tectonic approach to continental drift, in Carey,S. W., editor, Continental Drift--A Symposium, Hobart, TasmaniaUniv. Geology Dept., pp. 177-355, 1958.
156
Chantry-Price, R. E., A palaeomagnetic investigation of some post-
carboniferous rocks from Alaska, M.S. dissertation, Univ. of
Newcastle upon Tyne, 130 pp., 1967.
Churkin, Michael, Jr., Paleozoic tectonic history of the Arctic Basin
north of Alaska, Science, 165, 549-555, 1969.
Paleozoic and Precambrian rocks of Alaska and their role in
its structural evolution, U.S. Geol. Survey Open File Rept. 448,
131 pp., 1970a.
, Fold belts of Alaska and Siberia and drift between North
America and Asia, in Adkison, W. L. and M. M. Brosge, editors,
Proceedings of the Geological Seminar on the North Slope of Alaska,
Los Angeles, Pacific Sec., Amer. Assn. Petroleum Geologists, pp.
Gl-G14, 1970b.
Coats, R. R., Reconnaissance geology of some western Aleutian Islands,
Alaska, U.S. Geol. Survey Bull. 1028-E, 83-100, 1956.
Collinson, D. W., K. M. Creer and S. K. Runcorn, editors, Methods in
Palaeomagnetism, Elsevier, New York, 609 pp., 1967.
Cox, A. and R. Doell, Review of paleomagnetism, Bull. Geol. Soc. Amer.,
71, 645-768, 1960.
Creer, K. M., Application of rock magnetism to investigations of the
secular variation during geologic times, in Magnetism and the
Cosmos, NATO Advanced Study Inst. on Planetary and Stellar Magne-
tism, Univ. of Newcastle upon Tyne, 1965, Elsevier, New York,
pp. 45-59, 1967.
Detterman, R. L. and J. K. Hartsock, Geology of the Iniskin-Tuxedni
Region, Alaska, U.S. Geol. Survey Prof. Paper 512, 78 pp., 1966.
Doell, Richard R. and Allan Cox, The accuracy of the paleomagnetic
method as evaluated from historic Hawaiian lava flows, J. Geophys.
Res., 68, 1997-2009, 1963.
, Palaeomagnetic sampling with a portable coring drill, in
Collinson, D. W., K. M. Creer and S. K. Runcorn, editors, Methods
in Palaeomagnetism, Elsevier, Amsterdam, pp. 21-25, 1967.
Erickson, B. H., D. K. Rea and F. P. Naugler, Chinook trough: A
probable consequence of north-south sea-floor spreading (abstract),
Amer. Geophys. Union Trans., 50, 663, 1969.
Fisher, Sir Ronald, F. R. S., Dispersion on a sphere, Proc. Roy. Soc.
A, 217, 295-305, 1953.
Foster, John H., A paleomagnetic spinner magnetometer using a fluxgate
gradiometer, Earth Planet. Sci. Lett., 1, 463-466, 1966.
157
Francheteau, Jean, C. G. A. Harrison, J. G. Slater and M. L. Richards,Magnetization of Pacific seamounts: a preliminary polar curve for
the northeastern Pacific, J. Geophys. Res., 75, 2035-2061, 1970.
Grantz, Arthur, Generalized geologic map of the Nelchina area, Alaska,
showing igneous rocks and larger faults, U.S. Geol. Survey Misc.
Investigations Map 1-312, 1960a.
, Geologic map of Talkeetna Mountains (A-2) quadrangle, Alaska,
and the contiguous area to the north and northwest, U.S. Geol.Survey Misc. Investigations Map 1-313, 1960b.
, Geologic map of Talkeetna Mountains (A-l) quadrangle, and the
south third of Talkeetna Mountains (B-1) quadrangle, Alaska, U.S.Geol. Survey Misc. Investigations Map 1-314, 1960c.
, Geologic map and cross section of the Anchorage (D-2) quad-
rangle and northeasternmost part of the Anchorage (D-3) quadrangle,Alaska, U.S. Geol. Survey Misc. Investigations Map 1-342, 1961a.
, Geologic map of the north two-thirds of Anchorage (D-1) quad-
rangle, Alaska, U.S. Geol. Survey Misc. Investigations Map 1-343,1961b.
, Stratigraphic reconnaissance of the Matanuska Formation in
the Matanuska Valley, Alaska, U.S. Geol. Survey Bull. 1181-I, 11-133, 1964.
, Strike-slip faults in Alaska, Ph.D. dissertation, Stanford
Univ., 82 pp., 1966.
Hamilton, Warren, The Uralides and the motion of the Russian and Siberian
Platforms, Bull. Geol. Soc. Amer., 81, 2553-2576, 1970.
Hayes, Dennis E. add Walter C. Pitman III, Magnetic lineations in the
North Pacific, in Hays, James D., editor, Geological Investigations
of the North Pacific, Geol. Soc. Amer. Mem. 126, pp. 291-314, 1970.
Irving, E., Paleomagnetism and its A-plication to Geological and Geo-
physical Problems, Wiley and Sons, New York, 399 pp., 1964.
Jackson, E. D., Eli A. Silver, and G. B. Dalrymple, Hawaiian-Emperor
Chain and its relation to Cenozoic circumpacific tectonics, Bull.
Geol. Soc. Amer., 83, 601-618, 1972.
Keller, A. S. and J. T. Cass, Petroliferous sand of the Chignik Forma-
tion at Chignik Lagoon, Alaska, U.S. Geol. Survey Open File Rept.
138, 5 pp., 1956.
Keller, A. S. and H. N. Reiser, Geology of the Mount Katmai area,Alaska, U.S. Geol. Survey Bull. 1058-G, 261-298, 1959.

158
King, Philip B., Tectonic Map of North America, U.S. Geol. Survey, 1969.
LePichon, Xavier, Sea-floor spreading and continental drift, J. Geophys.
Res., 73, 3661-3697, 1968.
McElhinny, M. W., Statistics of a spherical distribution, in Collinson,
D. W., K. M. Creer and S. K. Runcorn, editors, Methods in Palaeo-
magnetism, Elsevier Amsterdam, pp. 313-321, 1967.
, Palaeomagnetic directions and pole positions--VIII. Pole
numbers 8/1 to 8/186, Geophys. J. R. astr. Soc., 15, 409-430, 1968a.
, Palaeomagnetic directions and pole positions--IX. Pole num-
bers 9/1 to 9/159, Geophys. J. R. astr. Soc., 16, 207-224, 1968b.
, Palaeomagnetic directions and pole positions--X. Pole numbers
10/1 to 10/200, Geophys. J. R. astr. Soc., 18, 305-327, 1969.
, Palaeomagnetic directions and pole positions--XI. Pole num-
bers 11/1 to 11/90, Geophys. J. R. astr. Soc., 20, 417-429, 1970.
McKenzie, D. P. and R. L. Parker, The north Pacific: an example of
tectonics on a sphere, Nature, 216, 1276-1280, 1967.
Martin, G. C. and F. J. Katz, Geology and coal fields of the lower
Matahuska Valley, Alaska, U.S. Geol. Survey Bull. 500, 98 pp., 1912.
Moffit, F. H., Geology of the Slana-Tok district, Alaska, U.S. Geol.
Survey Bull. 904, 54 pp., 1938.
Moore, J. Casey, Uplifted trench sediments: southwestern Alaska-Bering
Shelf edge, Science, 175, 1103-1105, 1972.
Morgan, W. Jason, Deep mantle convection plumes and plate motions, Amer.
Assn. Petroleum Geologists Bull., 56, 203-213, 1972.
Nagata, Takesi, Rock Magnetism, Maruzen, Tokyo, 350 pp., 1961.
Naugler, Frederic P. and David K. Rea, Abyssal hills and sea-floor
spreading in the central North Pacific, Bull. Geol. Soc. Amer., 81,
3123-3128, 1970.
Opdyke, N. D. and K. W. Henry, A test of the dipole hypothesis, Earth
Planet. Sci. Lett., 6, 139-151, 1969.
Payne, Thomas G., Mesozoic and Cenozoic tectonic elements of Alaska,
U.S. Geol. Survey Misc. Investigations Map 1-84, 1955.
Pitman, W. C., III, and D. E. Hayes, Sea-floor spreading in the Gulf of
Alaska, J. Geophys. Res., 73, 6571-6580, 1968.

159
Pitman, Walter C. III, and Manik Talwani, Sea-floor spreading in theNorth Atlantic, Bull. Geol. Soc. Amer., 83, 619-646, 1972.
Plafker, Goorge, Tectonic deformation associated with the 1964 Alaska
earthquake, Science, 148, 1675-1687, 1965.
Reed, Bruce L. and Marvin A. Lanphere, Age and chemistry of Mesozoic
and Tertiary plutonic rocks in southcentral Alaska, Bull. Geol.
Soc. Amer., 80, 23-49, 1969.
Richter, D. H., Geology of the Upper Slana-Ientasta area, Southcentral
Alaska, Alaska Div. of Mines and Minerals Geologic Rept. 30, 25 pp.,
1967.
Richter, D; H. and N. A. Matson, Jr., Quaternary faulting in the east-
ern Alaska Range, Bull. Geol. Soc. Amer., 82, 1529-1540, 1971.
Roddick, J. A., Tintina trench, J. Geology, 75, 23-32, 1967.
Runcorn, S. K., On the hypothesis that the mean geomagnetic field for
parts of geologic time has been that of a geocentral axial multi-
pole, J. Atmos. Terr. Phys., 14, 167-174, 1959a.
, On the theory of the geomagnetic secular variation, Ann.de Geophys., 15, 87-92, 1959b.
St. Amand, Pierre, Geological and geophysical synthesis of the tecton-
ics of portions of British Columbia, the Yukon Territory, and
Alaska, Bull. Geol. Soc. Amer., 66, 1343-1370, 1957.
Scholl, D. W., M. S. Marlow, J. S. Creager, M. L. Holmes, S. C. Wolf
and A. K. Cooper, A search for the seaward extension of the Kaltagfault beneath the Bering Sea, Geol. Soc. Amer., Abstracts with
Programs, 2, 141-142, 1970.
Stoneley, Robert, The structural development of the Gulf of Alaska sedi-
mentary province in southern Alaska, Quart. J. Geol. Soc. London,123, 25-57, 1967.
, A note on the structural evolution of Alaska, J. Geol. Soc.,
127, 623-628, 1971.
Strangway, David W., History of the Earth's Magnetic Field, McGraw-Hill,New York, 168 pp., 1970.
Tailleur, I. L. and W. P. Brosge, Tectonic history of northern Alaska,
in Adkison, W. L. and M. M. Brosge, editors, Proceedings of the
Geological Seminar on the North Slope of Alaska, Los Angeles,Pacific Sec., Amer. Assn. Petroleum Geologists, pp. El-E120, 1970.

160
Vine, F. J., Paleomagnetic evidence for the northward movement of the
North Pacific basin during the past 100 m.y. (abstract), Trans.
Amer. Geophys. Union, 49, 156, 1968.
vlasov, G. M., editor, Geologiya SSSR, Tom XXXI, Kamchatka, Kuril'skiye i
Komandorskiye ostrova, Chast' I, Geologicheskoye opisaniye (Geology
of the USSR, Vol. 31, Kamchatka, Kuril and Komandorskiye Islands,
Part I Geological description), Izdatel'stvo "Nedra," Moscow, 1964,
NASA TT F-11, 529, 1, 428 pp., 1967.
Waring, G. A., Geology of the Anthracite Ridge coal district, Alaska,U.S. Geol. Survey Bull. 861, 57 pp., 1936.
Watson, Geoffrey S. and E. Irving, Statistical methods in rock magnetism,
Mon. Not. Roy. astr. Soc. Geophys. Suppl., 7, 289-300, 1957.
Wheeler, J. 0., Whitehorse map-area, Yukon Territory 105 D, Geol. Survey
of Canada Mem. 312, 156 pp., 1961.