palestinian central bureau of statistics (pcbs) palestine poverty maps 2009 march - 2013
TRANSCRIPT
Palestinian Central Bureau of Statistics (PCBS)
Palestine Poverty Maps 2009
March - 2013

Palestinian Central Bureau of Statistics (PCBS)
Contents • Introduction• Construction of the Palestine Poverty Maps of 2009 .• Preliminary Results.
Palestinian Central Bureau of Statistics (PCBS)
Introduction• The official poverty line in Palestine was established in 1998 by the
National Commission for Poverty Alleviation (NCPA).• This definition was developed based on expenditures data from the
Palestinian Household Expenditure and Consumption Survey (PECS) of 1996 and 1997. It was derived from a relative concept and used as absolute poverty line with two boundaries.
• The two boundaries have been constructed according to actual spending patterns of Palestinian households. The lower boundary is called “deep poverty line,” which includes a budget for food, clothing and housing. The second line “higher boundary which is called poverty line” includes other necessities including health care, education, transportation, personal care, and housekeeping supplies. The lower boundary was set at the median expenditure level of certain key items of the poorest 25 to 30 percent of households.
Palestinian Central Bureau of Statistics (PCBS)
Introduction
• Beginning in December 2009, the Palestinian Central Bureau of Statistics (PCBS) reviewed its prevailing poverty measurement methodology based on broad consultations with stakeholders within the country and supported by technical assistance from the World Bank. The aim of this exercise was to validate the prevailing practice of poverty measurement and to incorporate approaches according to international best practice.
• This resulted in several adjustments to the measurement methodology leading to revised official poverty estimates for the period from 2004 to 2009. First, to enable a meaningful comparison of living standards across the Palestinian regions, the new poverty estimates are adjusted for differences in regional prices across the Palestinian regions.
Palestinian Central Bureau of Statistics (PCBS)
Introduction• In early 2010, PCBS decided to redefine the poverty line by changing the
reference household to 2 adults and 3 children (according the new reference households that appeared in 2009), and the new poverty series begins in 2009. This new poverty series incorporates all the methodological changes referred to above.
• In Palestine, official poverty rates are not produced below regional and\ or governorate level, (upon the household sample size in the reference round), where sampling errors of the household survey "PECS" data become non-negligible.
Palestinian Central Bureau of Statistics (PCBS)
Construction of the Palestine Poverty Maps of 2009
• PCBS in collaboration with the World Bank managed to conduct the Palestine Poverty Mapping profile of 2009. Poverty mapping is an exercise to estimate poverty incidence at a disaggregated level where a typical household income and expenditure survey cannot produce statistically reliable poverty estimates due to high sampling errors. In addition, Poverty map is not necessarily maps but rather highly disaggregated databases of welfare. Depending on data availability, we can construct disaggregated maps of welfare, eg. Poverty.

Palestinian Central Bureau of Statistics (PCBS)
Construction of the Palestine Poverty Maps of 2009
• The Small Area Estimation (SAE) method, used in Palestine to produce the poverty maps, based on two primary data sets; the PECS 2009 survey and the Population Census 2007. The method takes advantage of the strengths of both sources: in the case of the PECS data its strength is associated with the fact that direct measures of poverty (i.e. expenditure data) are available, whereas in the case of the Census data its strength is associated with its size, meaning that data were collected from all households in the country as opposed to ‘sampled’ from a primary sampling unit. PECS 2009 was collected by PCBS, and includes 3,566 households.
Palestinian Central Bureau of Statistics (PCBS)
Construction of the Palestine Poverty Maps of 2009
• The census data was collected by PCBS, and covered roughly 584,549 households. A wide range of household information was collected including religion, educational attainments, labor activities, residential information, and employment and housing conditions. As is the practice in all countries, the Palestinian Census did not include household consumption and income levels, but its wide coverage of household characteristics is an advantage for imputing household consumption precisely. In addition, census data collection is limited in Jerusalem governorate J1 (J1 is that part of Jerusalem which was annexed by Israel after 1967 war).
• To construct the Poverty mapping in Palestine, per capita consumption from the survey is regressed on a set of explanatory and control variables that are common to the survey and the census. Out of sample prediction on unit record census data is then used to yield predicted per capita consumption for each household.
Palestinian Central Bureau of Statistics (PCBS)
Construction of the Palestine Poverty Maps of 2009
• A software developed by the World Bank’s research department was used in this exercise "PovMap2"; which facilitates this process, providing various statistics to help us undertake the above selections properly. Nevertheless, it is worth noting that the software cannot solve all problems and technical challenges through the process, and thus users need to check every step carefully.
Palestinian Central Bureau of Statistics (PCBS)
Obstacles in Palestinian Case• There were two issues of particular importance when
constructing the poverty maps; first selecting a good consumption model, and secondly, choosing an appropriate level of disaggregation.
• Good Consumption Model: applying the same model to all stratums (regions) may thus increase the risk of bias in poverty estimates and standard errors. Upon that, the Palestinian poverty mapping conducted two different consumption models, each of which corresponds to a stratum defined for the PECS 2009; to adjustment the regional (West Bank and Gaza Strip) differences in consumption patterns to avoid the large bias in poverty estimates and corresponding standard errors.

Palestinian Central Bureau of Statistics (PCBS)
Obstacles in Palestinian Case
• Appropriate level of disaggregation. The size of the disaggregation level, control the level of the disaggregation. Upon that, the Palestine poverty mapping chose the locality level for disaggregation. Localities with population less than 400 is merged to contiguous localities. In addition to that, Upon the limitation in data collection in Jerusalem (J1), Jerusalem governorate is excluded from the model. The governorate will be presented in the poverty mapping profile as one unit (locality) depending on data available from other surveys, eg. Poverty rates from PECS; socio-economic indicators from labor force and other surveys data sets collected in the reference year 2009.
Palestinian Central Bureau of Statistics (PCBS)
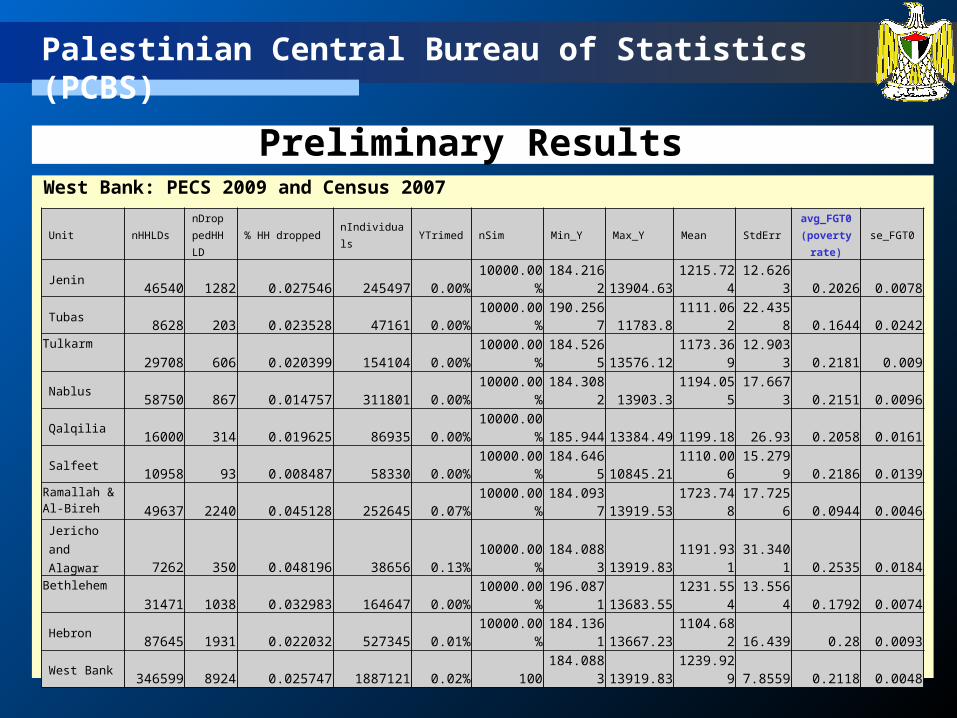
Preliminary ResultsWest Bank: PECS 2009 and Census 2007
Unit nHHLDsnDroppedHHLD
% HH dropped nIndividuals YTrimed nSim Min_Y Max_Y Mean StdErravg_FGT0
(poverty rate)
se_FGT0
Jenin 46540 1282 0.027546 245497 0.00% 10000.00% 184.2162 13904.63 1215.724 12.6263 0.2026 0.0078
Tubas 8628 203 0.023528 47161 0.00% 10000.00% 190.2567 11783.8 1111.062 22.4358 0.1644 0.0242Tulkarm
29708 606 0.020399 154104 0.00% 10000.00% 184.5265 13576.12 1173.369 12.9033 0.2181 0.009
Nablus 58750 867 0.014757 311801 0.00% 10000.00% 184.3082 13903.3 1194.055 17.6673 0.2151 0.0096
Qalqilia 16000 314 0.019625 86935 0.00% 10000.00% 185.944 13384.49 1199.18 26.93 0.2058 0.0161
Salfeet 10958 93 0.008487 58330 0.00% 10000.00% 184.6465 10845.21 1110.006 15.2799 0.2186 0.0139Ramallah & Al-Bireh 49637 2240 0.045128 252645 0.07% 10000.00% 184.0937 13919.53 1723.748 17.7256 0.0944 0.0046
Jericho and Alagwar 7262 350 0.048196 38656 0.13% 10000.00% 184.0883 13919.83 1191.931 31.3401 0.2535 0.0184
Bethlehem
31471 1038 0.032983 164647 0.00% 10000.00% 196.0871 13683.55 1231.554 13.5564 0.1792 0.0074
Hebron 87645 1931 0.022032 527345 0.01% 10000.00% 184.1361 13667.23 1104.682 16.439 0.28 0.0093
West Bank 346599 8924 0.025747 1887121 0.02% 100 184.0883 13919.83 1239.929 7.8559 0.2118 0.0048

Palestinian Central Bureau of Statistics (PCBS)
Preliminary ResultsGaza Strip: PECS 2009 and Census 2007
Unit nHHLDsnDroppedHHLD
% HH dropped nIndividuals YTrimed nSim Min_Y Max_Y Mean StdErr
avg_FGT0
(Poverty rate)
se_FGT0
Gaza
39604 525 0.013256 261681 0.07%10000.0
0% 153.1722 11368.15 1165.797 26.9933 0.2206 0.0148Gaza North
75023 1383 0.018434 474854 0.15%10000.0
0% 153.1428 11371.12 1091.651 50.6715 0.3609 0.0302Deir Al - Balah
31340 447 0.014263 197718 0.08%10000.0
0% 153.1513 11355.12 1019.664 16.6266 0.3378 0.0116Khan Yunis
42402 411 0.009693 262970 0.13%10000.0
0% 153.1324 11365.34 926.8798 17.2643 0.4261 0.0148Rafah
26391 787 0.029821 164875 0.19%10000.0
0% 153.1493 11371.25 1072.278 28.7556 0.3095 0.0201Gaza Strip
214760 3553 0.016544 1362098 0.13% 100 153.1324 11371.25 1061.285 24.2805 0.337 0.0132

Palestinian Central Bureau of Statistics (PCBS)
Poverty Percentage in Palestine by Region

Palestinian Central Bureau of Statistics (PCBS)
Localities in Palestine
Palestinian Central Bureau of Statistics (PCBS)
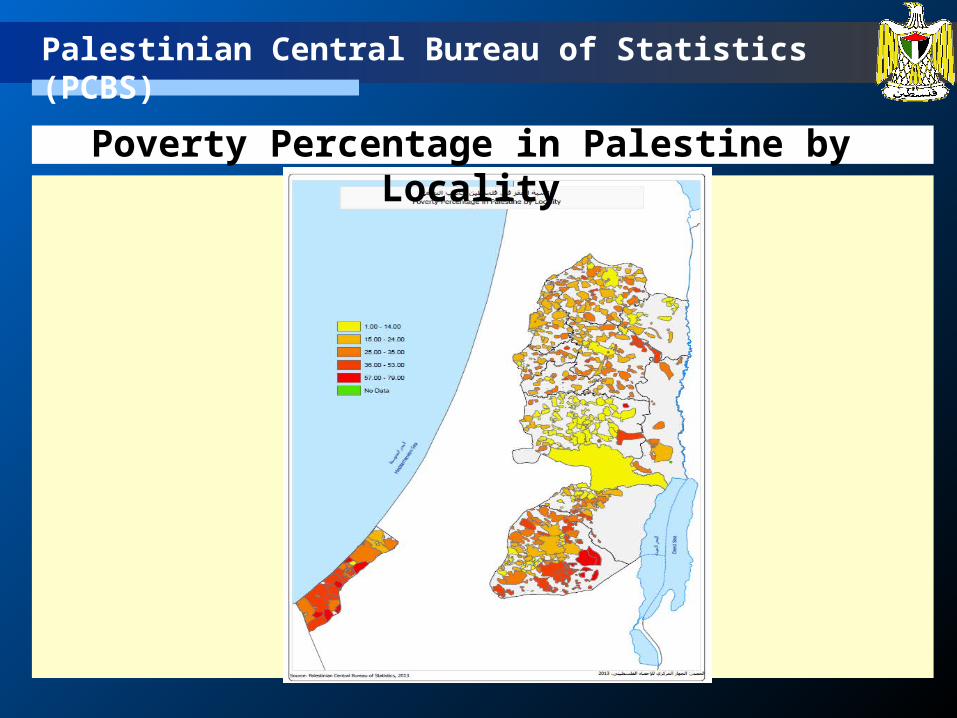
Poverty Percentage in Palestine by Locality
Palestinian Central Bureau of Statistics (PCBS)
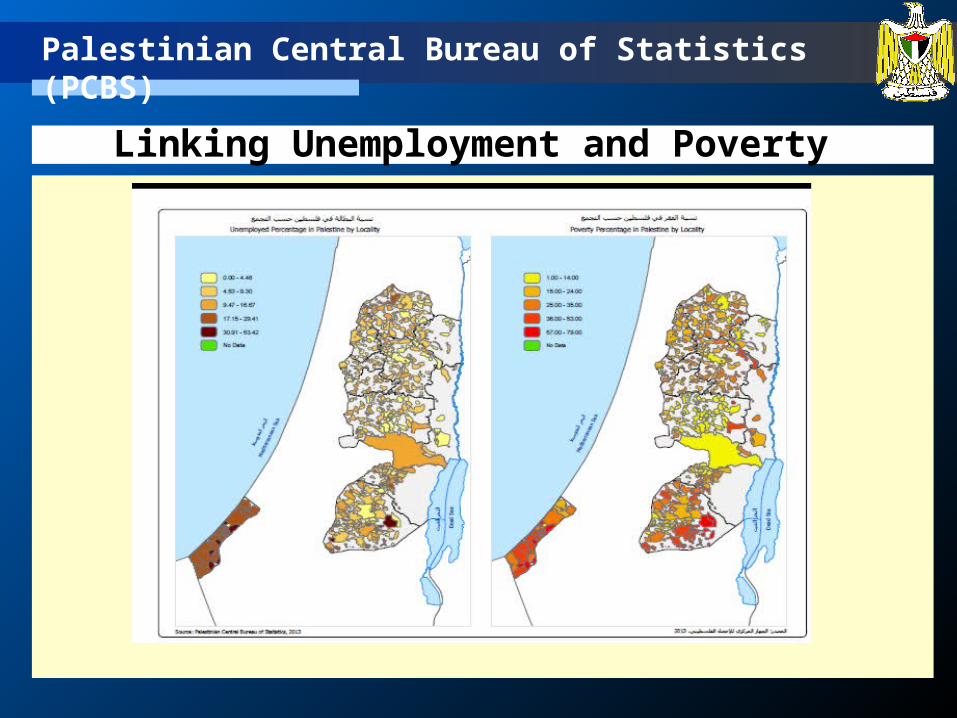
Linking Unemployment and Poverty
Palestinian Central Bureau of Statistics (PCBS)
Thank You,,,Thank You,,,