palestinian small and medium -sized …unctad.org/en/docs/gdsapp20041_en.pdf · palestinian small...
TRANSCRIPT
UNCTAD/GDS/APP/2004/1
UNITED NATIONS CONFERENCE ON TRADE AND DEVELOPMENT
PALESTINIAN SMALL AND MEDIUM-SIZED ENTERPRISES: DYNAMICS AND CONTRIBUTION TO DEVELOPMENT
UNITED NATIONS New York and Geneva, 2004

Distr. GENERAL UNCTAD/GDS/APP/2004/1 6 July 2004 Original: ENGLISH ARABIC, ENGLISH AND FRENCH ONLY
Palestinian small and medium-sized enterprises: Dynamics and contribution to development *
* This study has been prepared by the UNCTAD secretariat. The secretariat is grateful for the cooperation of the Palestinian Central Bureau of Statistics (PCBS) in providing statistical data through a comprehensive statistical field survey jointly designed with UNCTAD and implemented in 2002 by the PCBS, with co-funding from the UNCTAD LDC Trust Fund. The designations employed and the presentation of the material in this document do not imply the expression of any opinion whatsoever on the part of the Secretariat of United Nations concerning the legal status of any country, territory, city or area, or of its authorities, or concerning the delimitation of its frontiers or boundaries.
iii
EXECUTIVE SUMMARY
The development of small and medium-sized enterprises (SMEs) has long been regarded as a seedbed for industrialization and, therefore, crucial for the achievement of broader development objectives. In the case of the future State of Palestine, the importance of these enterprises as an engine of growth is even more crucial, especially in view of the occupation conditions, the economy's weak and distorted supply capacity, and the limited size of local markets. Based on a comprehensive field survey, implemented by the Palestinian Central Bureau of Statistics (PCBS) in cooperation with UNCTAD, this study examines the reasons behind the limited presence of SMEs' in the Palestinian territory by shedding more light on their life cycle and the factors influencing their birth, survival, growth and closure, along with the determinants of these components of change before and after the ongoing crisis. The study focuses on SMEs in the industrial, construction and tourism sectors. The choice of these sectors was based on their large contribution to growth and employment in the Palestinian economy. The study shows that the development prospects of Palestinian SMEs are limited by political instability and the arrangements governing the Palestinian economy's relations with Israel. Although the period 2000-2002 saw the growth of some SME branches, these positive developments have been undermined by the protracted conflict and the lack of concerted efforts targeting these enterprises' growth dynamics. These problems can only be addressed within the context of a cohesive sector- focused development strategy that creates synergies between trade and industrial policy and targets existing growth bottlenecks at the micro, meso and macro leve ls.

iv
CONTENTS
Executive summary………………………………………...…………………………………iii
Introduction................................................................................................................................ 1
Chapters
I. Imperative to develop Palestinian SMEs .............................................................................. 3 The Palestinian economy 1994-2000: Deep-seated structural weaknesses .............................. 3 The Palestinian economy 2000-2002: A cycle of de-development........................................... 4 SMEs’ contribution to industrial, construction and tourism growth in 1999............................ 7
II. Profile of SMEs involved in industrial, tourism and construction activities................... 9 Size……………... ..................................................................................................................... 9 Ownership ................................................................................................................................. 9 Location..................................................................................................................................... 9 Entrepreneurial profile ............................................................................................................ 10 Composition of activities ........................................................................................................ 10 Labour force characteristics and management structures ....................................................... 11 Backward and forward linkages .............................................................................................. 11 Production process .................................................................................................................. 13 Main markets ........................................................................................................................... 14 Profitability.............................................................................................................................. 14
III. Dynamics of Palestinian industrial, construction and tourism SMEs .......................... 16 Net firm creation and mobility................................................................................................ 16 Major external factors influencing SMEs’ growth.................................................................. 17 Major internal factors influencing SMEs’ growth .................................................................. 22 Explaining Palestinian SMEs’ performance record up to 2000 .............................................. 23
IV. Impact of the crisis since 2000 on industrial, construction and tourism SMEs ........... 26 Main performance indictors and contribution to growth ........................................................ 26 Production processes............................................................................................................... 30 SMEs survival dynamics ......................................................................................................... 30 Explaining Palestinian SMEs performance 2001-2002 .......................................................... 32 Development and emergency relief efforts targeting Palestinian SMEs ................................. 32 An assessment of development and emergency relief efforts................................................. 36
V. A policy and assistance frmework for developing Palestinian SMEs............................. 38 A policy framework for guiding development efforts at the micro level................................ 38 A policy framework for guiding development efforts at the macro level............................... 39 Spatial arrangements ............................................................................................................... 42 Policy implications .................................................................................................................. 43

v
List of Tables
1. SMEs’ share in total establishments by sector - RWBGS, 1999 .......................... 51 2. SMEs’ contribution to industrial, construction and tourism growth -
RWBGS, 1999....................................................................................................... 51 3. Industrial SMEs in RWBGS: leading activities, 1999 .......................................... 51 4. Share of small enterprises in industrial, construction and tourism SMEs in RWBGS
by activity, 2002 .................................................................................................... 52 5. Breakdown of SMEs’ uses of finance by ranking - RWBGS, 1999 ..................... 52 6. Relative importance of capital in SMEs’ production processes, labour produc tivity
and capacity utilization - RWBGS, 1999 .............................................................. 52 7. SMEs’ dynamics: New start-ups and closuresby enterprise size and activity -
RWBGS, 1994-1997 ............................................................................................. 53 8. Labour productivity by enterprise size and economic activity RWBGS, 1999 .... 53 9. Impact of the crisis on SMEs’ economic indicators by activity, RWBGS, 2001 . 54 10. Impact of the crisis on the economy and SMEs by sectorRWBGS, 2001 ............ 54 11. Changes in SMEs’ workforce and compensation levels – RWBGS ..................... 55 12. Relative importance of capital in SMEs’ production processes, labour productivity
and capacity utilization - RWBGS, 2001 .............................................................. 55 13. SMEs’ dynamics: New start-ups and closures by activity RWBGS, 2001-2002 . 55 14. SME support system in the occupied Palestinian territory, 2000 ......................... 56 15. Illustrative matrix of technological capabilities.................................................... 57
List of Figures
1. Breakdown of SMEs’ value added by expenditure (1999)………………… ….58 2. Breakdown of SMEs’ expansion plans before the crisis by sector ......................... 58 3. Share of local markets in West Bank-based small enterprises,
June 2001-June 2002 ............................................................................................. 59 4. Share of local markets in the West Bank-based medium enterprises, June 2001-June 2002. ............................................................................................... 59 5. The share of local markets in Gaza-based small enterprises,
June 2001-June 2002. ............................................................................................... 60 6. Share of local markets in Gazabased medium enterprises ...................................... 60

1
Introduction
The contribution and significance of small and medium-sized enterprises (SMEs) as an important engine of growth are receiving increased attention in both developed and developing countries. These enterprises are often regarded as the "backbone" of the economy, serving as major sources of technological development, new jobs and a seedbed for entrepreneurship.1 Such a prominent role is mainly attributed to their flexibility in responding to emerging opportunities and their resilience in the face of adverse conditions. If anything, SMEs are the most competitive sector in a Darwinian sense. They are in a constant state of evolution, with successful enterprises graduating into large firms and new firms emerging to replace the ones that have been forced out of the market. During periods of recession, they constitute "an army of ants" enabling troubled economies to survive the crisis.2
In the case of the occupied Palestinian territory, the development of SMEs ranks high on the Palestinian Authority’s (PA) policy agenda. However, relatively little is known about the dynamics determining their birth, expansion and closure. A solid understanding of these dynamics is extremely important at this critical stage of the development process, when policy makers are struggling to enhance the economy’s resilience in the face of a widespread crisis that started in September 2000 and to set the stage for its sustained recovery. This difficult task is further complicated by a legacy of prolonged occupation, forced attrition and distortion of the economic structure, as well as fierce competition in regional and global markets shaped by innovation, liberalization and organizational restructuring. Enterprises are facing increasing pressures as the criteria that define best practice in production are continually evolving to reflect the constant pace of upgrading in both product and process technologies. They are also continually seeking to adhere to international standards on quality assurance, environmental standards, labour norms and social ethics, all of which are becoming critical determinants of global competitiveness.
This study examines the factors influencing Palestinian private SMEs’ growth, with the aim of shedding light on the patterns of these enterprises’ birth, survival, growth and closure, along with the determinants of these components of change before and after the crisis. In so doing, it focuses on SMEs involved in the industrial, construction and tourism sectors, given their important role in generating growth as measured by their contribution to employment and gross domestic product (GDP). Within the industrial sector, the study focuses mainly on those activities that demonstrate a heavy concentration of SMEs, including mining and quarrying and the manufacture of non-metallic products, food and beverages, wearing apparel, and furniture.
The study is based on a comprehensive field survey that was implemented by the Palestinian Central Bureau of Statistics (PCBS) in cooperation with UNCTAD, covering the period June 2000-June 2002.3 The survey involves a structured sample of 15 per cent of the population frame (3,735 enterprises), with enterprises classified according to the size of their workforce. Enterprises employing 5-19 persons are regarded as small, while those employing 20-50 persons are considered medium-size.4 The survey covers a number of issues related to SMEs' growth and performance, including their productivity, contribution to innovation and technological progress,

2
backward and forward linkages, responsiveness to economic policies, adaptability to shocks and crisis, and their needs.
The findings of the survey were supplemented by structured and open-ended interviews that were conducted in 2001 and 2002 on the present problems and future challenges facing Palestinian SMEs with local and international business support institutions, entrepreneurs, bankers and PA officials. The analysis also benefited from sectoral and other statistics made available by the PCBS on the targeted SMEs’ main performance indicators, including their contribution to GDP and employment in 1999, 2001 and 2002.
The study starts by highlighting the urgent need to develop the Palestinian SMEs, pointing out their critical role in setting the economy on the path of recovery and sustained development. It then provides an overview of SMEs’ contribution to the industrial, construction and tourism sectors, before presenting the static picture that emerges from the survey. A discussion of the major forces influencing their growth comes next, including an examination of the new evidence on the turbulent process of these enterprises’ creation and closure, as well as their expansion. This is followed by an analysis of the enterprises' response to the crisis, and its impact on their salient features and main performance indicators. The present efforts to develop Palestinian SMEs are then introduced and assessed, with a view to drawing on the experiences gained thus far in catering to these enterprises needs. This is followed by a proposed policy framework for guiding future development efforts, leading to specific proposals at the policy, programme and project levels that are also informed by the experiences of other developed and developing countries in the area of SME development.

3
Chapter I
IMPERATIVE TO DEVELOP PALESTINIAN SMES
The Palestinian economy 1994-2000: Deep-seated structural weaknesses
Following the signing of the 1993/1994 peace accords between Israel and the Palestinians and the establishment of the PA, the Palestinian economy enjoyed remarkable growth, especially after 1998, with real GDP growth estimated at 6 per cent in 1999. Real per capita gross national income (GNI) growth was estimated at 3.5 per cent, bringing per capita GDP and per capita GNI to $1,651 and $1,965, respectively. Moreover, the proportion of the population living below the poverty line decreased by 3.5 per cent during the period 1996-1998, from around 27 per cent to 23 per cent.5
However, this growth masked deep-seated structural imbalances and weaknesses inherited from the occupation period, namely an impoverished supply capacity, a high unemployment rate and a growing trade deficit. The economy is still dominated by micro enterprises, employing fewer than five persons. These constituted around 92 per cent of total establishments in 1999, while the shares of small enterprises (employing 5-19 persons) and medium-sized enterprises (employing 20-50 persons) in total registered establishments were 9 per cent and less than 1 per cent respectively. The number of enterprises employing 50-99 persons was 124, and those employing more than 100 persons did not exceed 62.6 Not only do SMEs form a minority, there is also evidence of a missing middle, with small enterprises constituting 91 per cent of total SMEs in 1999.
The enterprises also show underdeveloped structures, with industrial enterprises mainly involved in light industries and the production of basic consumer goods, particularly food and beverages, wearing apparel, non-metallic products, metal products and furniture products. In 1999, these activities generated 77 per cent of employment and 61 per cent of the value added in the industrial sector of the remaining West Bank areas and the Gaza Strip.7 In the services sector, the largest sub-sectors in terms of employment and value-added contribution are education, health and social work, hotels and restaurants, and business activities (excluding research and development, real estate, computer and related activities and renting of machinery). These contributed 84 per cent of the services sector’s GDP and employed 79 per cent of its labour force in 1999.8 Investment remains concentrated in construction activities, especially for residential purposes, continuing a trend that emerged in the 1980s. In 1999, residential construction accounted for 85 per cent of the total new surface area licensed for construction activities.9
Given such an underdeveloped industrial base, the private sector's contribution to job creation remains limited. It accounted for only 45 per cent of total jobs created from 1995 until the third quarter of 2000, with work in Israel and jobs in the PA accounting for the balance (32 per cent and 23 per cent respectively).10 Moreover, jobs created in the Palestinian private sector grew at a low rate of 4 per cent per annum, thereby failing to keep pace with the rate of labour force expansion. Export performance has also been very poor, accounting for only 17 per cent of GDP
4
in 2000. This is due particularly to the high transaction costs facing Palestinian exporters and limited access to cheap sources of supply as a result of the Israeli movement restrictions, recurrent border closures, the absence of a national port or airport, and inadequate physical infrastructures.11
With domestic absorption standing at more than 150 per cent of GDP,12 the Palestinian trade balance has been showing a persistent deficit, growing from $1.658 billion in 1996 to $2.669 billion in 1999. The ratio of trade deficit to GDP has soared, exceeding 50 per cent since 1995, up from 27 per cent in 1990. This deficit has been underscored by a heavy concentration of trade with one partner, Israel, which accounted for around 69 per cent of total Palestinian trade transactions in 1999. The Palestinian trade deficit with Israel stood at $1.644 billion in that year, as compared with $1.388 billion in 1995.13
Under these circumstances, the economy continues to rely on the export of its labour force for income. Israel is the main market, absorbing 21 per cent of the Palestinian labour force in 1999, equivalent to 135,000 workers. The jobs concerned are confined to low-skilled, labour-intensive activities in agriculture, construction and manufacturing. The income of these workers, along with transfers from abroad, was equivalent to 21 per cent of Palestinian GNI in 1999. This has rendered the economy vulnerable to external shocks, especially those emanating from Israel.14
The Palestinian economy 2000-2002: A cycle of de-development15
As shown in previous UNCTAD secretariat reports, the protracted conflict has further aggravated the structural weaknesses of the economy, setting in motion a cycle of de-development.16 Indeed, the Palestinian economy has lost all the growth it achieved in the preceding 15 years, with the estimated real GDP in 2002 below its 1986 level. 17 By the end of 2002, GDP had declined by more than 22 per cent, adding to the 24 per cent loss in 2001. Forgone national income in less than three years has been estimated at $5.4 billion, more than the GNI generated in the whole year of 1999. Consequently, per capita GNI fell to 55 per cent of its 1999 level to reach an estimated $903 in 2002, pushing around 2 million Palestinians below the poverty line of $2 per day. Poverty rates increased to 60 per cent by the end of 2002, while households' median monthly income reached its lowest level since October 2000, registering a 43 per cent decrease by August 2003. Around 71 per cent of households experienced substantive decreases in income levels, with 45 per cent per cent losing more than half of their income. The percentage of households living below the poverty line ($390 per month per household of six) accounted for 62 per cent of Palestinian society in August 2003.
Moreover, the average annual adjusted unemployment rate in 2002 exceeded 40 per cent in the West Bank areas and 50 per cent in the Gaza Strip,18 putting upward pressure on the dependency ratio, which increased by 33 per cent over the period October 2000-August 2003.19 By the end of 2002, Palestinian employment in Israel had declined by 63 per cent in relation to October 2000, while employment in domestic sectors had declined by an average of 23 per cent, equivalent to 95,000 jobs. Palestinian exports had declined by an estimated 61 per cent in relation to October 2000, while the trade deficit was estimated to have reached $1.592 million in 2002. Although the deficit was one-third less than in 2000, its ratio to GDP, at 64 per cent, was around nine points
5
above the average for the period 1995-2000. Meanwhile, Israel's share of total Palestinian trade transactions began increasing again, and was estimated at 71 per cent in 2002.
These losses have been generated mainly by the Israeli closure policy, movement restrictions and round-the-clock curfews. Closures have become a major aspect of the Palestinians' daily lives, preventing the movement of people and goods across the main borders and within the West Bank and Gaza areas. They involve sealing the Palestinian territory's main borders with Israel and the rest of the world (external closure), and a system of roadblocks and checkpoints around Palestinian towns and villages (internal closure). Since October 2000, the Israeli occupation authorities have established 140 checkpoints in the West Bank areas and around 30 in the Gaza Strip, in addition to 200 roadblocks to maintain internal closures. Moreover, the “safe passage” for passengers moving between the West Bank and Gaza has been closed since October 2000. The Israeli Authorities also extended the permit system to the West Bank areas in 2002, and Palestinians wishing to travel within these areas are subject to hard-to-get permit requirements. Similarly, the “back-to-back” system, 20 previously confined to cross-border trade transactions, has been extended to internal Palestinian areas, requiring all non-humanitarian goods to be off-loaded from incoming trucks and reloaded onto local trucks at eight checkpoints near major West Bank cities. During periods of curfew, Palestinians are confined to their homes over extended periods.
Other losses are generated by the destruction of private and public infrastructure, including establishments, equipment and public utilities, estimated to have cost the economy at least $1.1 billion by the end of 2002.21 To this must be added the indirect losses induced by enterprises’ and households' coping strategies, which generate profound changes in the structure and functioning of the economy. Households' consumption dropped by 5 per cent in 2001 and another 12 per cent in 2002, as they reduced expenditure on basic needs and delayed the payment of bills, in addition to selling their assets.22 This forced firms to scale down their production activities, generating a contraction in the average size of Palestinian enterprises and a shift towards subsistence and petty activities.23 By 2003, private investment had declined by 90 per cent, falling from $1.45 billion in 1999 to $150 million, and the number of jobs lost in the private sector was estimated at 11,000 in the West Bank and 14,000 in the Gaza Strip. The share of the paid work force in the total labour force decreased from 68 per cent in 1999 to 59 per cent in 2002, while the participation rate decreased from 42 per cent to 38 per cent. Meanwhile, the proportion of self-employed increased from 19 per cent to 27 per cent during the same period, reflecting a shift towards subsistence activities. These developments depleted the economy's supply capacity, with the manufacturing sector's contribution to the much smaller economy declining from 16 per cent in 1999 to an estimated 14 per cent in 2002. Construction lost half of its share in GDP, down to 6 per cent by 2002. Commerce and tourism contracted at a rate in line with that of the economy and therefore maintained a share around 14 per cent of GDP.
The PA budget deficit soared from 6 per cent of GDP in 1999 to an estimated 26 per cent in 2002, affected by rising expenditures and collapsing revenues. PA expenditures increased from 30 per cent of GDP in 1999 to 36 per cent in 2002, while its revenues declined from 23 per cent to 10 per cent of GDP. This decline was mainly due to Israel’s withholding of the tax revenue it collected on behalf of the PA under the revenue clearance system, estimated at $700 million in 2002. Although the Israeli Government resumed the regular transfer of the tax revenues to the

6
PA in December 2002, the budgetary pressures remain formidable. The PA had accumulated external debt of $855 million by the end of 2002, in addition to payment arrears to private sector suppliers totalling $415 million and debt of $65 million to domestic banks.
Despite these adverse conditions, the Palestinian economy continues to function. This resilience is partly attributed to the increase in disbursements of donor support for budgetary solvency and relief efforts. Budget support accounted for 60 per cent of donor aid in 2002, representing $1,026 million in disbursed funds, after a doubling from the pre-crisis level to $929 million in 2000. The share of public administration and other services increased from 42 per cent to 45 per cent, reflecting the surge in budgetary support, with the PA employing 26 per cent of the West Bank and Gaza work force and accounting for around 40 per cent of all domestic wages in 2002. The increased importance of agriculture as a place of last resort for the unemployed is another important factor, in addition to the informal social safety nets and innovative responses developed by Palestinians to withstand the crisis. By the end of 2002, the agriculture sector's contribution to GDP had grown from 11 per cent in 1999 to an estimated 15 per cent.
However, it would be difficult to maintain that the economy can continue to withstand this widespread economic crisis. Households' coping strategies have been effectively exhausted by soaring unemployment and poverty rates. By the end of August 2003, 79 per cent of Palestinian households were found to be in dire need of assistance, while the percentage of households at the verge of destitution reached approximately 46 per cent.24 Only 18 per cent of households were found to be capable of coping with continued decreases in income for more than one year.
Although agriculture remains an important source of income for the unemployed, its absorption capacity is undermined by the cyclical nature of its production. Indeed, employment in the West Bank agricultural sector decreased from 19 per cent in the second quarter of 2003 to around 15 per cent in the third quarter of the same year. Meanwhile, enterprises that have thus far succeeded in withstanding the crisis are operating below their full capacity. In September 2002, only 7 per cent of these firms were found to be operating at their September 2000 capacity level. Of the rest, 76 per cent were operating at lower capacity and 17 per cent had been forced out of the market.
Moreover, these enterprises are suffering from a serious liquidity crunch, with banks adopting more conservative lending policies. By September 2002, private sector credit had fallen by 24 per cent from its 2000 level, from $242 million to $183 million. Bank credit by sector shows agriculture and industry receiving smaller shares of total credit in 2001-2002 than they had received prior to the crisis. The share of agriculture in total bank credit was 2 per cent in 2002 and those of the services, industrial and construction sectors were 6 per cent, 10 per cent and 11 per cent respectively. In contrast, trade accounted for 27 per cent of total bank credit.25
Meanwhile, the “separation wall” that is being constructed by Israel in the northern parts of the West Bank threatens more Palestinians with extreme poverty. The construction work, which commenced in June 2002, entails the establishment of an eight-meter-high concrete wall along with electric fences, trenches and razor wires that will stretch for 687 kilometers to encircle the West Bank areas. When completed, the wall will create an effective economic border between Israel and the occupied Palestinian territory through which people and goods will be authorized to pass only at certain border checkpoints. Around 15 per cent of the West Bank areas will lie

7
between the wall and the United Nations armistice line, the “Green Line”, including 122 villages and towns with a total population of 274,000 Palestinians. These will be enclosed in enclaves surrounded by barriers, and residents are required to apply for permits that are valid for only six months to maintain their residency rights. Palestinians who are dependent on the enclosed area to earn their living will have to obtain special permits to reach their jobs and farms. According to the United Nations Office for the Coordination of Humanitarian Affairs in the occupied Palestinian territory (OCHA), this category includes more than 400,000 Palestinians who live to the east of the wall.26 The disruption of Palestinian lives and economic transactions aside, the wall will see the confiscation and destruction of some of the West Bank’s most fertile land.27
In the long run, the existing trade regime stands as a major impediment to setting the Palestinian economy on the path of sustained growth, since it generates a huge bilateral trade deficit with the Israeli economy. As shown in a previous report by the UNCTAD secretariat, some 70 per cent of foreign capital inflows (mostly grants in the case of Palestine) go into financing the lopsided bilateral merchandise trade with Israel. The latter was estimated to be equivalent to 45 per cent of the West bank and Gaza GDP in 2002.28
The need to reorient the economy away from its heavy dependence on Israel through regional and global integration is self-evident. However, this should be done within the context of a cohesive development strategy that aims at restructuring the industrial base to allow for increased specialization in products with higher value added. Otherwise, Palestinian exports will remain limited, especially in the light of the deteriorating terms of trade for labour- intensive products. At the same time, the chronic unemployment problem requires industrial policies with a strong focus on job creation. With a labour force growing at a fast rate of 4.5 per cent in 2002, the economy must generate 54,000 jobs annually to absorb new entrants before it can make an impact on the high unemployment rates.29 Striking a balance between these two competing policy objectives is rendered difficult by the protracted conflict, which is further aggravating the structural weaknesses of the economy, while diverting the PA’s and donors' attention away from long-term development objectives.
SMEs’ contribution to industrial, construction and tourism growth in 1999
SMEs are critical for achieving the aforementioned policy objectives. This section shows that, despite their limited share of total establishments, these enterprises have a strong presence in the surveyed sectors and stand as a major source of employment and production growth.
Contribution to industrial growth
SMEs have a marked presence in the industrial sector. In 1999, they constituted 51 per cent of the enterprises involved in mining and quarrying activities, 48 per cent of those involved in the manufacturing of wearing apparel, 39 per cent of the non-metallic product enterprises and 24 per cent of enterprises producing food and beverages (see table 1).

8
Table 2 shows that these enterprises stand as a major source of employment, absorbing 58 per cent of the sector’s work force and generating 67 per cent of total compensation. They also make a significant contribution to production growth, accounting for 40 per cent of the sector's gross fixed capital formation (GFCF),30 56 per cent of the sector's value added, and 62 per cent of total output. Moreover, industrial SMEs have a relatively high remuneration level. This is reflected in their compensation-to-value-added ratio of 35 per cent, exceeding that of the industry as a whole by 5 per cent.
However, these enterprises are more dependent on imported intermediate goods, as reflected by the 43 per cent value-added-to-output ratio, which was 5 per cent below that of the industrial sector. This is especially the case of medium-size enterprises, whose value-added-to-output ratio stands at 39 per cent as compared with 44 per cent for small enterprises.
Within industrial branches, non-metallic manufacturing SMEs are the main contributors to total compensation, value added, output and GFCF, while wearing apparel manufacturing SMEs stand as a major source of employment (see table 3). The latter also stand as the second contributor to value added and GFCF, while food and beverage SMEs are the second- largest contributors to output.
Contribution to construction growth
SMEs accounted for 57 per cent of the construction sector’s total registered establishments in 1999 (see table 1). They produced 73 per cent of the sector's total value added and 69 per cent of its output, in addition to employing 71 per cent of the total workforce and generating 75 per cent of the sector's total compensation (see table 2). However, their share in the sector's GFCF stood at only 24 per cent. Moreover, their remuneration levels were on a par with those of the sector, with their compensation-to-value-added ratio only 1 per cent higher than that of the sector as a whole.
Contribution to tourism growth
The tourism sector stands as the only sector with a limited SME presence – SMEs accounted for 12 per cent of the sector’s total registered establishments in 1999 (see table 1). Nonetheless, these enterprises are a major contributor to the sector’s growth, generating 57 per cent of the sector's total output, 62 per cent of its total value added, 69 percent of total compensation and 44 percent of total employment (see table 2). However, given their limited number, SMEs are not an important contributor to the sector’s GFCF, with their share not exceeding 17 per cent in 1999. Moreover, their remuneration level is almost the same as that of the sector, with a compensation-to-value-added ratio that is only 1 per cent higher than the sector as a whole.
9
CHAPTER II
PROFILE OF SMES INVOLVED IN INDUSTRIAL, TOURISM AND CONSTRUCTION ACTIVITIES
Research to date on Palestinian SMEs has treated these enterprises as a homogenous group sharing common structures and salient features. The results of the PCBS/UNCTAD field survey show that this is the case. However, a closer examination reveals several areas where the two groups (small enterprises and medium-sized enterprises) demonstrate contrasting features. This section highlights these differences using 1999 data, with a view to providing the context for examining the growth determinants of these enterprises before and after the crisis. The next chapter singles out the major forces that influenced SMEs growth before the crisis, while chapter IV examines the impact of the crisis on these enterprises' growth path.
Size
Palestinian SMEs are dominated by small enterprises, which account for 92 per cent of the surveyed enterprises on average. The construction sector is the only sector featuring a stronger presence of medium-size enterprises, which constituted 26 per cent of construction SMEs. Given their dominance, small enterprises drive the SME sector, accounting for 76 per cent of its workforce, 71 per cent of total value added, 69 per cent of total output, 67 per cent of GFCF and 68 per cent of total employment compensation in 1999.
Ownership
The SMEs are dominated by family-owned businesses, which account for around 65 per cent of the surveyed enterprises. However, this type of ownership is mainly a feature of small enterprises, which show a high sole-proprietorship ratio of 67 per cent on average. Medium-size enterprises feature a stronger presence of partnership structures, with sole-proprietorship enterprises accounting for only 37 per cent of total medium-size enterprises. Family-owned medium-size enterprises are mainly involved in the manufacturing of wearing apparel and furniture, showing a sole-proprietorship ratio of more than 50 per cent on average.
Location
Palestinian industrial, construction and tourism SMEs are mainly concentrated in the remaining West Bank areas (excluding Jerusalem), which accommodate 71 per cent of these enterprises.31 These areas host 67 per cent of medium-sized enterprises and the majority of capital- intensive SMEs, including those involved in mining and quarrying activities (100 per cent), food and beverage manufacturing SMEs (86 per cent) and those engaged in tourism activities (78 per cent). In contrast, the Gaza Strip, hosts 46 per cent of wearing apparel SMEs, 44 per cent of construction SMEs and 34 per cent of those engaged in the manufacturing of furniture products.
10
These enterprises also show tendencies towards industrial agglomeration in major towns. Available statistics show that mining and quarrying SMEs are concentrated in Hebron, Qualqilya and Ramallah, while manufacturing enterprises are mainly located in Nablus, Hebron and Gaza. Construction SMEs have a strong presence in Nablus, Ramallah and Gaza, and those involved in tourism activities are mainly located in Nablus, Ramallah, Bethlehem and Gaza.32
However, only 24 per cent of the surveyed SMEs are located in industrial zones. The majority (around 50 per cent) operates from residential areas located on heavily trafficked roads, particularly those involved in the manufacturing of wearing apparel products and construction activities. The remaining enterprises are located in commercial areas, particularly tourism SMEs and small food and beverage manufacturing enterprises.
Entrepreneurial profile
Around 47 per cent of the surveyed SMEs in the remaining West Bank (RWB) areas and Gaza Strip (RWB/GS) are owned by middle-aged entrepreneurs between 36 and 45 years old. Entrepreneurs between 46 and 55 years old own 30 per cent of these enterprises, while the rest belong mainly to older entrepreneurs. This is particularly the case of medium-sized enterprises, of which 24 per cent belong to entrepreneurs who are more than 56 years old. The share of young entrepreneurs between the age of 25 and 35 years old does not exceed 8 per cent of the surveyed enterprises. To be more specific, they own 7.6 per cent of small enterprises and 2.6 per cent of medium-size enterprises.
The majority of entrepreneurs (more than 70 per cent) have prior business experience in areas related to their present activities. However, they lack formal training. This is particularly the case in small enterprises, with 44 per cent of the owners lacking formal training beyond elementary education. In contrast, the percentage of medium-sized enterprises owned by entrepreneurs with only elementary education does not exceed 18 per cent, and 23 per cent of these owners have university degrees.
Composition of activities
The majority of the surveyed enterprises are engaged in the production of final goods. This is particularly the case of Gaza-based SMEs, where 91 per cent of the enterprises produce final products, reflecting a limited industrial base that lacks enterprises specialized in the production of intermediary goods. In the West Bank, 78 per cent of small enterprises and 72 per cent of medium-size enterprises are involved in the production of final goods.
Furthermore, industrial SMEs are heavily concentrated in three sectors, namely the textile sector, non-metallic products and food and beverages. These account for 60 per cent of the SMEs, with 30 per cent of the enterprises involved in the manufacturing of wearing apparel products, 21 per cent in non-metallic products and 11 per cent in the manufacturing of food and beverages.

11
Labour force characteristics and management structures
The surveyed SMEs’ workforce is made up primarily of paid workers, who accounted for 80 per cent of their total work force in 1999. However, 87 per cent of the paid labour force is engaged in operative tasks related to production, with only 9 per cent involved in managerial activities and 4 per cent in marketing, accounting and other managerial activities. This reflects informal management structures, whereby owners undertake most of the managerial and administrative activities. This is particularly the case of enterprises involved in the manufacturing of furniture products, with only 3 per cent of the paid work force engaged in managerial, marketing and other activities.
Backward and forward linkages
Linkages to markets
The market linkages between SME enterprises are limited, with approximately 40 per cent selling directly to final consumers rather than to other firms. Although more than 30 per cent of the SMEs sell to other firms, they deal mainly with one type of market intermediary, namely wholesalers. By and large, SMEs appear to prefer establishing direct contacts with their customers. This is reflected in the significant percentage of SMEs with branches in different parts of the remaining West Bank and Gaza Strip (RWBGS) areas. It is especially the case of medium-sized enterprises involved in the manufacturing of food and beverage products and furniture, as well as small enterprises involved in construction and tourism activities.
SMEs engaged in foreign trade demonstrate a greater tendency to operate through market intermediaries, with only 25 per cent of medium-size enterprises and 28 per cent of small enterprises selling directly to buyers. However, those selling through intermediary channels are more dependent on Israeli agents. The survey shows that only 15 per cent of medium-size enterprises and 3 per cent of small enterprises sell through Palestinian agents. In contrast, 22 per cent of medium-size enterprises and 15 per cent of small enterprises sell through Israeli agents. This is especially the case of SMEs engaged in the wearing apparel industry.
Sources of raw materials and equipment
Palestinian SMEs import a large share of their raw materials and all of their equipment. Israel is the main source of raw materials, especially for SMEs involved in the manufacturing of wearing apparel products, food and beverages, and furniture. It is worth noting that West Bank-based small enterprises appear to be more reliant on local markets for obtaining their inputs, with the exception of those involved in the manufacturing of furniture and wearing apparel products, which are more reliant on Israel. In contrast, Gaza-based enterprises are more reliant on Israel for their inputs of raw materials. However, this does not necessarily mean that West Bank-based

12
enterprises purchase locally produced materials. In fact, it is often the case that locally purchased goods are imported from Israel.
Apart from Israel, Europe is the second main source of SMEs’ raw materials, especially for those operating in the West Bank. Europe is also the major source of equipment, followed by Israel, except for the West Bank-based small enterprises, which are heavily reliant on Israel.
Sources of finance
More than 80 per cent of the surveyed enterprises rely on personal savings to cover their start-up and operating costs. Bank loans do not figure as an important source of finance for SMEs, except for West Bank-based medium-size enterprises. Banks are the second source of finance for 49 per cent of these enterprises. In contrast, only 18 per cent of small enterprises benefit from bank loans, and the percentage of Gaza-based medium-size enterprises accessing bank loans does not exceed 4 per cent.
In the absence of formal land registration, most SMEs fail to meet banks’ collateral requirements, since these are based on real estate mortgages. The PA is yet to complete the registration of the lands under its jurisdiction, making it difficult for many enterprises to legally prove their ownership. Moreover, enterprises find the application procedures “complex” and the interest rates high. Indeed, an examination of the consolidated balance sheets of the commercial banks operating in PA areas shows an outstanding case of credit rationing. Banks’ loan to deposit ratio stood at only 40 per cent in September 2000, equivalent to $1.504 million, of which 27 per cent were loans to PA institutions. This was despite the surge in deposit mobilization over the period from 1996 until September 2000, with the banks’ deposit base growing by 115 per cent from $1,707 million to $3,677 million. 33
Given such obstructed access to bank loans, SMEs rely on other sources, particularly moneylenders, leasing and suppliers’ credit loans. Some enterprises also make use of market finance (equity issues and bonds), but this is organized through informal channels, since they are not listed on the Palestinian stock market. Table 5 shows that small enterprises are more active in purchasing shares and bond issues, with around 30 per cent allocating a significant amount of their financial resources for this purpose. In contrast, less than 18 per cent of the medium-size enterprises employ their resources in this type of finance.
Involvement in e -commerce
The majority of the surveyed SMEs do not make use of the Internet in fostering their backward and forward linkages. Less than 10 per cent of the enterprises have a website, which is mainly used for promotional purposes. Medium-sized tourism enterprises are the exception, with 83 per cent having websites.
13
Only 22 per cent of SMEs are involved in industrial subcontracting arrangements. Israel is the main subcontractor for 55 per cent of these enterprises, continuing a trend that was established during the occupation period. These enterprises are mainly medium-sized ones engaged in construction activities and the manufacturing of food and beverages and wearing
In contrast, small enterprises are mainly involved with local partners that account for 52 per cent of these enterprises’ contracting arrangements. Subcontracting with regional and multinational companies has begun to surface in certain activities, including all (100 per cent) food and beverages manufacturing medium-size enterprises and 76 per cent of wearing apparel small enterprises. By and large, the SMEs' subcontracting arrangements involve labour- intensive tasks and offer the enterprises limited benefits, including advanced payments, on-the-job training, supply inputs, and machines and equipment.
Production process
This section examines the surveyed enterprises' production processes with a view to ascertaining the major forces influencing their productive capacity, as measured by the amount of value added per unit of labour.34 The mainstream argument is that capital- intensive processes, as measured by the capital/labour ratio (i.e. the amount of fixed capital per worker), yield higher productivity levels. The implicit assumption is that enterprises are able to achieve maximum utilization of their production capacity, as measured by the capital/output ratio. Moreover, they are able to readjust their production to respond to consumers' changing preferences.
Palestinian industrial, construction and tourism SMEs are mainly engaged in labour-intensive activities, with the amount of fixed capital per worker averaging $8,331 in 1999. Needless to say, small enterprises are more labour-intensive than medium-size enterprises, with an average amount of fixed capital per worker of $7,261, as compared to $11,667 for medium-size enterprises.
Table 6 shows that these aggregate figures mask variations in the relative importance of the labour factor in the SMEs’ production process. To be more specific, the surveyed SMEs can be grouped into low capital- intensive, medium capital- intensive and high labour- intensive. Those belonging to the first group include the enterprises involved in the manufacturing of wearing apparel and furniture products, with the average amount of fixed capital per worker standing at $1,603 and $4,100 respectively. SMEs involved in the manufacturing of non-metallic products and construction activities represent medium capital- intensive industries, with fixed capital per worker averaging $8,161 and $9,627 respectively. Enterprises belonging to the third group are involved in mining and quarrying activities ($18,839 per worker), food and beverages manufacturing ($16,096 per worker) and the remaining manufacturing activities ($13,130 per worker).
It is worth noting that, except for those involved in tourism activities, SMEs are not more productive than the sectors in which they operate, as measured by labour productivity. 35 Moreover, contrary to observed trends, capital- intensive enterprises do not score the highest

14
labour productivity levels. In 1999, construction SMEs produced the highest value added per labour unit and were more than twice as productive as all surveyed enterprises on average. They yielded $24,746 of value added per labour unit, thereby exceeding the average level of labour productivity for all surveyed enterprises, which stood at $10,482. Mining and quarrying and food and beverages SMEs also showed above-average labour productivity. However, they lagged behind construction enterprises, producing $15,241 and $13,931 of value added per labour unit respectively. Tourism SMEs showed below-average labour productivity ($6,972), while textile and furniture produced the lowest value added per worker ($3,974 and $3407 respectively).
The surveyed enterprises are also operating well below their production capacity, signifying low demand for their products. This is reflected in their high capital-to-output (K/O) ratio, which reached 35 per cent on average in 1999 (see table 6). This partly explains their low productivity levels. Indeed, there appears to be a negative association between K/O ratios and productivity levels, with enterprises showing high K/O ratios scoring low on labour productivity. Textile and furniture manufacturing SMEs show a positive association between the two indicators, signifying that their low productivity is mainly the result of the labour- intensive nature of their production processes.
For an economy that is burdened by an excess supply of labour, the implication for policy-makers is that policies need to promote industries that are able to achieve simultaneous increases in output and employment opportunities. This means that efforts should focus on ensuring an efficient use of capital resources and improving product quality.
Main markets
The surveyed SMEs focus mainly on local markets, with the West Bank-based enterprises’ sales confined to the West Bank areas and those of Gaza confined to the Gaza Strip. Only 42 per cent of enterprises were participating in foreign trade before the crisis, with Israel as their main export market.
In particular, Gaza-based wearing apparel manufacturing medium-size enterprises sell all their produce (100 per cent) to Israel. Israel is also an important market for mining and quarrying SMEs, absorbing 40 per cent of their sales. These enterprises have become increasingly dependent on the Israeli markets since the 1980s, as they have turned away from their traditional markets (Jordan and Lebanon) to respond to the increased Israeli demand for stones and marble.36
Profitability
Given the absence of accurate data on SMEs’ sales, the study uses productive surplus to measure their ability to generate income.37 This indicator measures surplus as a percentage of the amount

15
of total value added after deducting expenditures on compensation, depreciation, taxes and fees and the purchase of assets. As shown in figure 1, SMEs’ productive surplus averaged 46 per cent of total value added in 1999. However, this does not necessarily mean that they reap high profits, especially in view of the low demand for their products. Moreover, more than 40 per cent of the enterprises allocate significant amounts of their financial resources to building up precautionary inventories. Indeed, stockpiling constitutes a prominent feature of the enterprises' business strategies, as a safeguard against distribution problems generated by Israeli movement restrictions and border closure.
Enterprises involved in wearing apparel showed a relatively lower level of productive surplus (18 per cent), while those involved in the manufacturing of furniture generated a negative surplus. This is mainly the result of their relatively high compensation levels, which also reflect lower return on capital. Indeed, compensation took up 66 per cent of the wearing apparel enterprises’ value added and 81 per cent of the value added of enterprises involved in the manufacturing of furniture. However, except for furniture manufacturing SMEs, compensation per paid employee lagged behind labour productivity levels, reflecting low compensation levels.

16
CHAPTER III
DYNAMICS OF PALESTINIAN INDUSTRIAL, CONSTRUCTION AND TOURISM SMES
SMEs are constantly evolving, with new enterprises being created, existing firms expanding or contracting in size, and poor performers exiting the market. However, the significance of most of these changes is overlooked by a limited focus on the aggregate changes in SMEs’ performance indicators over time. For an economy that is dominated by small enterprises, understanding the factors influencing the enterprises’ life cycle is critical for facilitating the entrance of larger enterprises into the market. These factors can be summarized using two concepts, namely net firm creation, which is new starts (births) minus closures (deaths), and “mobility” or net firm expansion, which refers to enterprises’ expansion less firm contraction. This section examines these indicators during the period leading up to the crisis.38 The next chapter will look into the factors influencing these indicators during the crisis.
Net firm creation and mobility
Most of the SMEs created over the period 1994-1997 were concentrated in the construction sector, the wearing apparel manufacturing branch, and mining and quarrying, with their number increasing by 43 per cent, 37 per cent and 24 per cent respectively (see table 7). The majority of new entrants into the wearing apparel manufacturing branch were medium-size enterprises, while small enterprises dominated new entrants into the other two sectors. Although basic metallic manufacturing SMEs and those involved in the production of electrical machinery showed significant growth, the absolute number of new entrants was insignificant. Tourism SMEs faired badly over this period, with their number decreasing by 2 per cent.
The period 1994-1997 witnessed the closure of a significant number of SMEs that were mainly involved in capital- intensive activities, with over half of those involved in the production of medical equipment, vehicles and transport equipment forced to exit the market (see table 7). Most existing enterprises were small. Such enterprises show high death rates during their initial years, with as many as 95 per cent failing to maintain their operations beyond the first two years.39
Available statistics for the period 1997-1999 do not allow for an examination of SMEs' growth at the branch level. Nonetheless, they show that this period witnessed a surge in the number of tourism SMEs, which registered the highest growth rates. The number of construction SMEs grew by 8 per cent, while the number of those involved in manufacturing and mining and quarrying activities increased by 4 per cent and 2 per cent respectively. It is worth noting that growth rates vary significantly according to enterprise size, with medium-size enterprises expanding at higher rates than small enterprises.

17
Nearly 41 per cent of the SMEs involved in the surveyed sectors were poised to expand their activities on the eve of the crisis in 1999. This was particularly the case of SMEs involved in the tourism and construction sectors, with more than 50 per cent of these enterprises forced to postpone or cancel their expansion plans following the outbreak of the protracted conflict. Non-metallic producing enterprises ranked second, with 41 per cent of the enterprises postponing or abandoning their expansion plans. These were followed by mining and quarrying, wearing apparel, and food and beverage SMEs, of which more than 30 per cent postponed or cancelled their plans.
An examination of the expansion plans by sector shows that most were concentrated in the wearing apparel and non-metallic manufacturing sectors (see figure 2). Moreover, small enterprises accounted for 90 per cent of these plans. The construction sector was the only exception, with 38 per cent of the expansion plans generated by medium-sized enterprises.
Major external factors influencing SMEs’ growth
The limited size of their markets aside, the major factors influencing the SMEs' performance stem mainly from these enterprises' own salient features. Other (macro) factors that have a bearing on all enterprises, SMEs included, are discussed below.
Location
The choice of location differs from one enterprise to another, depending on its orientation and the nature of its activities. It is mainly influenced by cost considerations, with some enterprises preferring proximity to main markets and others choosing locations that bring them closer to sources of supply. It is also often the case that the final decision on location is dictated by such positive externa lities as the availability of developed infrastructure and public utilities.40
For the majority of Palestinian SMEs, proximity to local markets and the availability of infrastructure services seem to be the most important factors influencing the decision. As shown earlier, enterprises prefer to locate their operations in urban business centres on heavily used roads. Moreover, proximity to Israel, which is the Palestinian enterprises’ main trading partner and source of supply inputs, does not always seem to be a very important advantage. This is indicated by the location of the regional manufacturing agglomerates, especially those operating in the West Bank. These are heavily concentrated in Nablus, which does not lie close to the border.
This can be explained mainly by the nature of the SMEs’ activities, entailing direct interaction with customers, with production and retail sales often conducted at the same location. It also indicates that scale effects from proximity to local markets outweigh gains from proximity to Israel. However, this situation does not reflect the work of free, unfettered market forces. Rather it reflects the prohibitive transaction costs facing Palestinian traders in view of the restrictive

18
Israeli security measures and the cumbersome customs and overland transport procedures at the main borders.41
This has produced inward-looking enterprises that are less interested in extending their reach beyond local markets. Indeed, 70 per cent of the survey respondents explained their non-participation in foreign trade before the crisis by “lack of interest”. Moreover, 46 per cent of medium-size enterprises and 34 per cent of small enterprises singled out the prohibitive trade-related transaction costs as a major impediment to their increased participation in foreign trade.
Sector
There is a growing consensus that the sector in which enterprises operate is of considerable importance in terms of stimulating their growth. Empirical evidence shows that enterprises belonging to developed sectors are more likely to experience higher rates of growth than those in less developed sectors.42 At the aggregate level, it appears from table 6 that SMEs in the construction, mining and quarrying, food and beverages and non-metallic products sectors experience higher levels of labour productivity than the rest of the SMEs. However, these sectors do not fair better than SMEs in terms of their salient features and structural weakness.43 This suggests that the sectors do not contribute to the SMEs’ development; but rather that these enterprises appear to be driven by external stimuli.
Subcontracting arrangements
Subcontracting arrangements, which are often relied upon to facilitate the transfer of technology to enterprises in developing countries, have generally been detrimental to the growth of Palestinian SMEs. As shown earlier, the majority of Palestinian medium-sized enterprises are engaged in subcontracting arrangements with Israeli enterprises, resulting in the diversion of their backward and forward linkages towards Israel. This is particularly the case of the wearing apparel sector, for which Israeli enterprises are the main source of input supplies, machines and equipment, trade credit and outlets for products.
If anything, Israeli firms have been setting the limits for the development of these enterprises' production capacity and experience in industrial management, restricting their production processes to labour- intensive activities. This has contributed to the impoverishment of the SME sector's industrial base, especially as the medium-size enterprises, which are supposed to spur technological progress, are underdeveloped.
This contrasts with the experience of other developing countries, where subcontracting arrangements have played an important role in improving SMEs performance. In particular, these arrangements have provided enterprises with access to modern production technologies and exposed them to international best practices, in addition to extending their outreach by incorporating them into international networks of producers and traders who form a complete marketing and production cycle for particular products.44

19
Finance
SMEs do not consider the lack of finance to be a major impediment in improving their performance. Enterprises reporting an urgent need for financial support services did not exceed 34 per cent in 1999. However, the surveyed enterprises complain about the paucity of trade finance, with 43 per cent of small enterprises and 27 per cent of medium-size enterprises pointing out that this works against their increased participation in foreign trade.
Market support institutions
Nearly all of the surveyed SMEs are members of semi-governmental business support institutions, including chambers of commerce and agricultural and industrial federations. However, only 34 per cent of these enterprises are members of specialized market support institutions.
Entrepreneurs are not very satisfied with these institutions’ services, with only 2 per cent of respondents rating their services as “excellent”. This is particularly the case of Gaza-based SMEs, with 47 per cent of the enterprises rating services as “moderate”; 50 per cent of the West Bank-based enterprises rated them as “good”. Enterprises that are not members of any market support institution attribute this to the “poor” quality of services offered by these institutions.
Palestinian enterprises also point to the lack of specialized institutions capable of assisting them in complying with Palestinian and international quality standards and industrial specifications. In particular, they stress the need for specialized research institutions and modern laboratories for testing local and imported products.
The legal framework
The SMEs’ limited investments can also be explained by the absence of a comprehensive legal framework regulating economic transactions. Despite the considerable progress made in developing it, the Palestinian legal framework remains weak, lacking the key laws for ensuring a conducive business environment.45 The Palestinian Legislative Council (PLC) is yet to issue such key laws as: Capital Markets Authority Law, Income Tax Law amendments, Chambers of Commerce Law, Insurance and Securities Law, Competition Law, Foreign Trade Act, Intellectual Property Law, and Customs Law.
At present, the legal framework for economic activity consists of a combination of different legal codes, including Israeli military orders, in addition to outdated Ottoman, British, Jordanian and Egyptian laws. Moreover, the PA has yet to institutionalize the separation of executive and judicial powers and develop its court system, which lacks experienced judges.
20
Economic policies
Thus far, the Palestinian Development Plan (PDP) for 1999 to 2003 constitutes the only initial framework for the development of the Palestinian economy. It sought to foster broad-based growth, better targeting of resources, increased participation in foreign trade, human resource development, and institutional capacity and infrastructure building. The PDP attaches great importance to private sector development as a requisite for achieving the set objectives, and it gives priority to export-oriented industries.
In this context, the Palestine Liberation Organization (PLO) has signed several trade agreements with the rest of the world for the benefit of the PA, in order to facilitate the economy's integration with regional and international markets. These agreements provide Palestinian exports with duty-free access to a number of countries, including the United States of America, the European Union (EU), the European Free Trade Association (EFTA), the Arab Free Trade Area (AFTA), Jordan, Egypt and Saudi Arabia.
The PA has also introduced several reform agendas since its assumption of power in 1995. Most notable is the “Economic Policy Framework” (EPF) initiative of 2000, developed in collaboration with the International Monetary Fund (IMF). This initiative involved the consolidation of all public revenues under one account and the modernization of tax collection and customs procedures to adhere to international standards.
However, as indicated by the proliferation of the economy’s structural weaknesses and the expanding trade deficit, Palestinian enterprises are not responding to the PA’s development efforts, nor are they exploiting the aforementioned trade agreements. This is mainly because the existing trade regime, as defined under the terms of the Israeli-Palestinian protocol (the Paris Protocol), is geared to serving the commercial and economic interests of the much stronger Israeli economy. As explained in the secretariat's previous reports, the protocol maintains the asymmetrical arrangements that governed the two sides' trade relations during the occupation period, promoting the free movement of goods and labours between the two territories within the context of non-reciprocal restrictions.46 Palestinian imports from the rest of the world are subjected to a floor of Israeli tariff rates, except for a limited group of products imported from Egypt and Jordan in specific quantities. Moreover, the protocol maintains the range of subsidies, indirect taxes on certain imports and non-tariff barriers applied by Israel to protect its industries, while depriving the Palestinians of the required policy tools to manage their economy. In addition to lacking control over its borders, the PA has no national currency and, therefore, cannot use monetary and exchange rate policies to offset macroeconomic disequilibria. This also partly explains the banking sector’s conservative lending policies, because the Palestinian Monetary Authority cannot intervene to compensate their deposit base in case of insolvency.
This has circumscribed prospects for sustainable development of the Palestinian economy, aggravating the long-standing dependence of the smaller, less advanced Palestinian economy on its neighbour. Moreover, by virtue of its association with the Israeli trade regime, the Palestinian economy has to bear all the costs of trade liberalization inherent in World Trade Organization (WTO) membership, while having access to few of the benefits of liberalization and WTO

21
accession. Indeed, Palestinian entrepreneurs regularly complain that the local markets are “flooded” with cheaper products. Moreover, these products are often of low quality, thereby fueling price-based competition among local enterprises, particularly small enterprises.47
At the same time, the PA is yet to design a national development strategy that goes beyond a generic commitment to private-sector- led development and export promotion. Thus fa r, development plans have taken the form of financial statements focusing mainly on the costs associated with infrastructure building projects, with little attention paid to operationalizing stated development objectives through specific policy measures.
Donor-funded private sector development projects
Over the period from 1994 to June 2000, the occupied Palestinian territory received foreign aid amounting to $3 billion, equivalent to around 14 per cent of GNI per annum. At the outset, donor assistance was mainly channelled to budget support, which accounted for 31 per cent of total disbursements over the period 1994-1995, mainly to support the newly established PA government institutions. By mid 2000, the share of budget support had been reduced dramatically to less than 4 per cent, reflecting a shift in donors’ focus towards long-term development projects.
However, private sector development projects accounted for around 10 per cent of total disbursements only, as donors' assistance was mainly focused on infrastructure development and institution-building projects, in addition to social development.48
At the same time, the impact of private sector support projects was undermined by a lack of coordination among donors. Donors have been poor at sharing information, have dealt with a limited number of experts and institutions that were not necessarily familiar with the private sector’s needs, and have taken too long in project preparation and implementation. The point has been also made that most of the projects were geared more to serving the commercial interests of donors than to addressing the private sector’s pressing problems.49 Thus far, the private sector has not been involved in designing technical assistance projects, nor has it been provided with the opportunity to communicate its interests to donors.
The impact of donor-funded private sector development projects was further undermined by the absence of coordination among Palestinian market support institutions, as they often competed to tap the same resources. Most of the institutions also lack qualified staff capable of formulating long-term strategies for assisting the private sector, thus rendering them more vulnerable to donors’ agendas and priorities.50
At the government level, little effort has been made to ensure the complementarily of services, reflecting a deficiency within the PA institutions. Despite 10 years of institution building efforts, most of the PA institutions dealing with private sector development still lack the required expertise. Exploring the reasons behind this problem is beyond the focus of this paper and requires separate research work. It suffices to point to the need to reconsider present approaches to institutional development.
22
Natural resources
The scarcity of natural resources available to the Palestinians under the Oslo agreements stands as a major impediment to industrial development. At present, the PA's jurisdiction is restricted to 80 per cent of the Gaza Strip, the town of Jericho and 3 per cent of the rest of West Bank areas, excluding Jerusalem. These areas are characterized by geographic discontinuity, with the Gaza Strip totally isolated from the West Bank areas by Israeli control of routes.
Water resources available to the Palestinians during the interim period have been limited, notwithstanding a transitional agreement to increase water quotas allocated to Palestinian areas. This is due in particular to the fact that Israel has not fulfilled its commitment to allocate 28.6 million cubic meters of water per year to the Palestinians during the interim period, though the occupied Palestinian territory's water needs are estimated at 70-80 million cubic meters per year. In the Gaza Strip, excessive tapping of the aquifers has led to seawater leakage, rendering the water brackish. Meanwhile, the process of desalination, which stands as the only option for solving water shortages, is prohibitively expensive for most, if not all, enterprises.
Moreover, the occupied Palestinian territory is not endowed with natural gas, despite the recent discovery of commercially viable gas fields in the Gaza Strip, and it has yet to develop an electrical grid of its own. It is therefore heavily dependent on neighbouring countries, particularly Israel, to satisfy local demand. This has increased production costs for industries that also lack three-phase electric power, which is important for the use of heavy electrical equipment.51
Major internal factors influencing SMEs growth
Size
The results of the survey reveal that the size of enterprises is an important determinant of their productivity. Table 8 shows a positive relationship between labour productivity and the number of workers per establishment. However, the small enterprises' disappointing performance cannot be attributed to their size per se. Rather, the problem lies in these enterprises' meager financial resources and underdeveloped production processes, which have been hampering their growth and setting limits on their graduation into the category of larger enterprises.
Entrepreneurial skills and management structure
The profile of the surveyed entrepreneurs suggests that previous working experience is a significant determinant of an enterprise’s decision to start new businesses, and not formal training. Entrepreneurs have proven their willingness to assume the risks associated with new ventures, despite adverse market conditions. In so doing, they have demonstrated a remarkable

23
capacity to harness their personal qualities (talents, education and previous experience) and available resources to exploit emerging business opportunities. However, there seems to be an overall scarcity of entrepreneurs in the Schumpeterian sense. Enterprises' underdeveloped production processes and the economy's limited industrial base mean that entrepreneurs are unwilling to invest in long-term projects. Moreover, their ability to improve their performance is undermined by poor managerial skills.
Ownership
Perhaps the most fundamental source of strength of Palestinian SMEs lies in the fact that they are dominated by family-owned enterprises. This prominence is dictated not by tradition as much as by the adverse conditions that have made the family a vital support mechanism, providing its members with a sense of security, solidarity and social status.52 Palestinian families’ ability to provide critical capital and human resources remains an important determinant of the development of the industrial base. Meanwhile, the owners’ commitment and devotion to their businesses drive these enterprises, enabling them to persist and succeed despite adversity.
Production processes
The survey reveals that SMEs’ underdeveloped production processes are the major impediment to improving their performance. The majority (over 50 per cent) of firms expressed an urgent need of technical assistance in the area of product development. Furthermore, over half of SMEs attributed their inability to increase their participation in foreign trade to the poor quality of their products and the lack of skilled labour, in addition to the lack of trade finance.
More than 60 per cent of industrial and construction SMEs operate with old equipment and machinery. They are also unable to cover the depreciation costs of their machines and equipment, exhibiting an investment gap that ranged from $746,7000 (in the case of furniture manufacturing enterprises) to $13 million on average (in the case of non-metallic manufacturing enterprises).53 This is despite the fact that the majority of enterprises allocate significant amounts of their financial resources to acquiring new equipment. Indeed, 55 per cent of the surveyed enterprises indicated that a major chunk of their resources goes into the purchase of new equipment.
Explaining Palestinian SMEs’ performance record up to 2000
Analysis shows that Palestinian SMEs are faced with a harsh environment, shaped by the developments in the peace process and the arrangements governing the Palestinian economy's relations with Israel, which are implemented without a cohesive national development strategy.

24
New entrants
The combined effects of political instability, the small size of the Palestinian economy, the lack of natural resources and the weak legal framework have set limits upon the size of the new enterprises entering the market, causing business opportunities to be highly unpredictable. The prohibitive transaction costs associated with foreign trade activities are another factor discouraging the creation of export-oriented enterprises that could otherwise have expanded the medium-sized enterprises' category. The proliferation of subcontracting arrangements introduced by Israeli enterprises to govern their commercial relations with Palestinian enterprises has also been a significant determinant of the size of new entrants. As shown earlier, these arrangements assign limited, labour- intensive tasks to Palestinian enterprises, thereby obstructing the creation of larger enterprises. To this must be added the existing trade regime that has fostered Israel's position as the Palestinians' main and dominant trade partner, thereby limiting business opportunities to developments emanating from the Israeli economy.
Indeed, the surge in the number of wearing apparel manufacturing SMEs and those involved in mining and quarrying activities over the period 1994-1997 can be explained mainly by increased Israeli demand for their products. However, the situation shifted for mining and quarrying enterprises during the mid-1990s in view of the heavy influx of cheaper Jordanian, Turkish and other products into the Israeli market. This is reflected in the limited number of new entrants into the market over the period 1997-1999. The developments in Israeli markets have also impacted negatively on existing enterprises' performance, forcing them to reduce their marginal profits well below production costs. As a result, these enterprises are no longer able to invest in upgrading the quality of their products and have shifted to price-based competition. This in turn has discouraged the entry of new firms, especially given the prohib itive initial capital requirements, in particular to cover the high land prices that are the result of the limited territorial areas made available to the Palestinians under the Oslo accords.54
In contrast, the growth of tourism and construction SMEs over the period 1994-1997 was mainly stimulated by increased optimism over the future of the Palestinian economy following the establishment of the PA. The findings of the survey also suggest that, for high-return activities, initial capital requirements and the experience of entrepreneurs already in the industry, as well as the level of regulation, all of which are barriers to entry, are all inversely related to new start rates.
Existing enterprises
As for existing SMEs, analysis shows that it is variables such as location and size of establishment that significantly influence performance, and not the evolution of the sector in which they operate. This should not be surprising, since the economy is dominated by micro-enterprises that are mainly involved in subsistence activities.
At the micro level, managements tend to be small and multi- functional, with entrepreneurs running the businesses single-handedly and taking all key decisions. Moreover, SMEs' outdated

25
machines and lack of skilled labour have been undermining their ability to improve the quality of their products. This problem can be attributed mainly to their shaky economics and subcontracting arrangements with Israeli enterprises. If anything, the analysis shows that Palestinian SMEs' expansion have become dependent mainly on their ability to forge commercial relations with their Israeli counterparts, rather than on their production and innovative capacity. This has discouraged Palestinian enterprises from upgrading their production processes.
There can be no doubt that political instability and the high degree of uncertainty with regard to future economic arrangements with Israel and the rest of the world are also very much responsible for such a disappointing performance record. However, a closer examination of the survey's results reveals a multitude of other forces that need to be taken into consideration. Most notable is the existing policy and legal environment, which has resulted in local markets being flooded with cheaper low-quality products, thus leaving existing enterprises with no incentive to upgrade their production processes. At the same time, the SMEs’ lack of information on markets and technologies reflects a genuine deficiency in their immediate environment.
If anything, the above-mentioned factors have shoved the Palestinian SMEs into a “low productivity trap”, whereby their disappointing productivity is working against the improvement of their products’ quality, which in turn has been putting downward pressure on sales and capacity utilisation. 55 This has reduced productivity levels further through insufficient retained earnings, thereby obstructing capital formation. Capital formation is further hampered by the enterprises' obstructed access to bank credit and the high degree of uncertainty generated by their adverse environment. This has limited enterprises' focus on adapting to survive, with managers occupied mainly with short-term problems and needs rather than long-term improvement opportunities. This is reflected in the fact that the majority of the surveyed enterprises do not consider lack of finance as a major impediment to growth. It would be fair to argue that Palestinian entrepreneurs are only willing to assume risks associated with short-term investments, and are risk-averse when it comes to long-term investments that do not yield revenue at the start of operations.
Creating a larger, professional management is certainly desirable in improving SMEs' performance. However, it is difficult to create any great division of labour until certain economies of scale have been achieved. At the same time, it would be difficult to stress capital accumulation as a way of boosting industries’ productivity, since available statistics do not show a positive relationship between average capital-to- labour ratio and labour productivity. This means that additional capital resources will not produce proportional increases in labour productivity as expected. Rather, breaking the productivity trap requires expanding the size of the SMEs’ market, especially through increased participation in international trade, in addition to developing their production processes. Only then will additional capital help raise these enterprises' productivity levels.

26
Chapter IV
IMPACT OF THE CRISIS SINCE 2000 ON INDUSTRIAL, CONSTRUCTION AND TOURISM SMES
Main performance indictors and contribution to growth
The crisis has generated a massive scaling down in the surveyed SMEs' production activities as the SMEs concerned struggled to maintain their operations. By 2001, their total value added and output had been cut by 39 per cent and 24 per cent respectively in relation to 1999. This means that the value added component in their output declined by 15 per cent during that period. The enterprises have also witnessed the erosion of their capital base, with the value of their GFCF declining by 23 per cent. This came despite the 14 per cent increase in the book value of their average assets, reflecting their chronic inability to cover the deprecation costs of their machines and equipment. Moreover, these enterprises have lost 63 per cent of their productive surplus, despite laying off 6 per cent of their paid workforce and reducing compensation levels by 39 per cent on average.
A closer examination of these aggregate figures reveals significant differences in enterprises' responses to the crisis at the sectoral level. As shown below, SMEs involved in tourism activities have been harder hit, and the majority of enterprises are facing the threat of being wiped out. Construction enterprises registered a less steep decline in 2002 in relation to 2001, but remain in a critical condition. Thus far, the industrial SMEs have proven to be the most resilient, acting as a shock absorber for the troubled economy. However, the proliferation of the crisis is undermining their ability to maintain such a role.
The SMEs’ responses have also varied by region, with the West Bank-based enterprises showing less resilience in the face of the crisis compared to their Gaza-based counterparts. West Bank enterprises laid off 27 per cent of their paid workforce in June 2002 in relation to June 2001, and reduced their compensation levels by 31 per cent. In contrast, the size of the Gaza-based SMEs’ paid work force contracted by 13 per cent only, and compensation by 21 per cent. This regional disparity is strongly pronounced in the case of West Bank wearing apparel and construction SMEs, which were forced to lay off 38 per cent and 27 per cent of their paid labour force respectively. In contrast, Gaza-based wearing apparel enterprises laid off 12 per cent of their paid workforce and reduced compensation by 25 per cent, while construction enterprises maintained the pre-crisis level of paid employment and reduced compensation levels by only 9 per cent.
27
Tourism SMEs
By 2001, SMEs involved in tourism activities had lost around 76 per cent of their value added in relation to 1999 and 58 per cent of their output, in addition to laying off 53 per cent of their paid labour force and cutting back on their compensation costs by 66 per cent. They also saw an erosion of 95 per cent of their productive surplus, 45 per cent of the book value of their average assets and 89 per cent of their GFCF (see table 9).
The SMEs’ contraction was steeper than that of the tourism sector as a whole, thereby undermining their contribution to growth (see table 10). The share of SMEs in the tourism sector's workforce in 2002 decreased by 21 per cent in relation to 1999, while their share in total value added and output declined by 34 per cent and 17 per cent respectively. In contrast, the share of these enterprises in tourism GFCF more than doubled. However, this does not reflect increased investments as much as the erosion of the sector's GFCF as a whole, which fell from $1.210 billion to $135 million in 2001.
Available statistics on tourism SMEs do not allow for a comparison between 2002 and 2001, but the survey reveals that they managed to maintain the size of their workforce over the period June 2001-2002, while reducing compensation costs by 8 per cent in relation to the previous period (see table 11). Compared to the 12-month period of the year 1999, the compensation level of these enterprises declined by 27 per cent and the paid labour force by 44 per cent.
Construction SMEs
Construction SMEs did not fair any better, with their value added and output in 2001 declining by 60 per cent and 55 per cent respectively compared to 1999. These enterprises also reduced their compensation levels by 54 per cent, in addition to loosing 63 per cent of their productive surplus/profit and 82 per cent of their GFCF (see table 9). Moreover, construction SMEs cut back their paid labor force by 23 per cent, and witnessed the erosion of 45 per cent of the book value of their average assets. Nonetheless, the SMEs' contraction was not steeper than the entire sector, and that allowed them to maintain their pre-crisis share in the sector's employment, value added, output and compensation, albeit with slight changes (see table 10). These enterprises increased their contribution to sectoral GFCF, with their share growing from 24 per cent to 80 per cent, owing to the steep contraction in the sector’s GFCF, which lost 98 per cent of its value in relation to 1999.
In 2002, construction SMEs were forced to reduce their compensation costs by another 14 per cent in relation to 2001 but were able to maintain the size of their paid labour force. This came despite their marked scaling down of the paid workforce and compensation over the period June 2001-June 2002 (see table 11), reflecting the emergence of new opportunities for resuming production activities during the second half of 2002. Nonetheless, these enterprises lost 23 per cent of their paid labour force in 2002 compared to 1999 and 60 per cent of their compensation levels.
28
Industrial SMEs
In 2001, the industrial SMEs managed to maintain their pre-crisis employment level of 1999 but were forced to cut back on compensation expenditures, value added and output, which decreased by 15 per cent, 33 per cent and 17 per cent respectively(see table 10). These enterprises also witnessed the depletion of their productive surplus by 62 per cent and of their GFCF by 15 per cent. This came despite the 28 per cent increase in the book value of their average assets, reflecting their inability to cover the depreciation costs of their machines and equipment.
As in the case of construction SMEs, these enterprises maintained their pre-crisis share in the industrial sector's employment, value added, output and compensation, albeit with slight changes. They increased their share in the sector’s GFCF from 40 per cent in 1999 to 79 per cent (see table 10). However, this was mainly due to the steep contraction in the sector’s GFCF, which lost 52 per cent of its value in relation to 1999.
The industrial sector’s resilience can be attributed to the marked expansion in manufacturing enterprises' activities, namely those engaged in the production of food and beverages, mining and quarrying activities and the manufacturing of furniture, whose paid labour force grew by 84 per cent, 71 per cent and 29 per cent respectively in 2001 in relation to 1999. This growth was accompanied by a surge in total value added and compensation levels, which increased by 42 per cent and 61 per cent respectively in the case of food and beverage manufacturing enterprises; 86 per cent and 22 per cent in the case of furniture manufacturing enterprises; and 9 per cent and 62 per cent in the case of mining and quarrying activities.
The remaining manufacturing SMEs increased the size of their paid labour force by 9 per cent, while maintaining their pre-crisis compensation levels. The wearing apparel manufacturing enterprises stand as an exception, laying off 16 per cent of their paid labour force but increasing their compensation level by 36 per cent. Moreover, except for furniture manufacturing enterprises, all manufacturing activities demonstrated a marked increase in the book value of their average assets, which grew by as much as much as 189 per cent in the case of mining and quarrying.
However, except for those involved in the manufacturing of food and beverages, industrial SMEs witnessed significant declines in their output and lost more than 63 per cent of their productive surplus on average. Furniture manufacturing enterprises were the exception, with their productive surplus reaching $4.5 million in 2001 after registering a deficit of $95,000 in 1999. This can be explained by the marked increase in their total value added and the relatively limited increase in compensation levels.
The expansion in SMEs’ production activities was mainly generated by small enterprises, with those involved in manufacturing food and beverages doubling their workforce from 2,637 in 1999 to 5,599 employees in 2001. Total employment in small enterprises involved in mining and quarrying and furniture increased by 77 per cent and 22 per cent respectively. In contrast, the workforce of the medium-size enterprises' involved in manufacturing food and beverages increased by 11 per cent only, while that of mining and quarrying and furniture manufacturing medium-size enterprises' shrank by 57 per cent and 39 per cent respectively.
29
These developments generated changes in the relative importance of some of the manufacturing enterprises. In particular, the food and beverage manufacturing SMEs increased their contribution to the industrial sector's growth. The share of these enterprises in total value added and output increased to 24 per cent and 32 per cent respectively, making them the major contributor to the SME's industrial value added and output. These enterprises also increased their share in the SMEs’ industrial labour force to 15 per cent in 2000. However, they continued to rank fourth in terms of their contribution to job creation. The wearing apparel manufacturing SMEs remained the major source of employment, though their share in the industrial SMEs' workforce decreased by 5 per cent to 36 per cent in 2001.
The proliferation of the crisis forced the industrial SMEs to take tougher austerity measures in 2002, particularly those involved in manufacturing food and beverages and furniture products. These cut back their paid labour force by 44 per cent and 30 per cent respectively in relation to 2001 and reduced their compensation costs by 56 per cent and 49 per cent. Indeed, the survey reveals that food and beverage enterprises scaled down their paid labour force and compensation levels by 31 per cent and 35 per cent respectively over period June 2001-June 2002 compared to the previous period (see table 11). Furniture enterprises reduced their paid labour force and compensation levels by 18 per cent and 30 per cent over the same period. Nonetheless, food and beverage enterprises managed to maintain their pre-crisis employment level of 1999 but lost 29 per cent of their compensation level, while furniture enterprises lost 10 per cent of their paid labour and 37 per cent of their pre-crisis compensation level.
The wearing apparel manufacturing enterprises were also affected, laying off 18 per cent of their paid workforce and reducing compensation by 34 per cent compared to 2001. By 2002, the size of these enterprises’ paid workforce and compensation levels were 30 per cent and 55 per cent below the pre-crisis levels of 1999. In contrast, non-metallic manufacturing enterprises registered some expansion in their activities in 2002, with the size of their paid workforce growing by 23 per cent compared to 2001. This allowed them to maintain their pre-crisis level of paid employment in 1999. However, they were forced to cut their compensation level by 4 per cent in relation to 2001, thereby loosing 45 per cent of their 1999 level.
Available statistics from the PCBS also show that by 2002, the food and beverages, wearing apparel, furniture and construction SMEs had lost more than 30 per cent of their 1999 value added and output levels. They had also seen an erosion of more than 25 per cent of the book value of their average assets in relation to 1999. The furniture manufacturing SMEs stood as an exception, registering an 18 per cent increase in total value added in 2002 compared to 1999 and increasing the book value of their average assets by 35 per cent. However, these enterprises lost 41 per cent of their 1999 output level.
The remaining manufacturing activities la id off 22 per cent of their paid employees over the period June 2001-2002 in relation to the previous period, and reduced compensation by 26 per cent. Compared to the 12-month period of 1999, these enterprises lost 45 per cent of their paid employees and 51 per cent of their compensation level. The mining and quarrying SMEs did not fair better, registering 18 per cent and 28 per cent declines in the number of paid employees and compensation over the period June 2001-2002. By June 2002, these enterprises had lost 13 per cent of their paid employees and 33 per cent of their compensation level as compared to 1999.

30
Production processes
As mentioned earlier, the crisis has generated increased demand for the products of certain enterprises, thereby encouraging them to hire more workers and/or purchase new assets. Table 11 shows that, except for the construction SMEs, this has rendered these enterprises more capital-intensive, as reflected in their increased K/L ratios. However, in the case of wearing apparel and non-metallic products, the increased investment in fixed assets was accompanied by a marked contraction in the size of the labour force. Moreover, these enterprises witnessed a significant increase in their excess capacity. The K/O ratio of wearing apparel SMEs grew from 25 per cent in 1999 to 44 per cent in 2001, while that of non-metallic producing SMEs increased from 28 per cent to 83 per cent (see table 12). This means that these industries may not be as capital- intensive as they appear to be. Other enterprises appear to have become more capital- intensive when in fact they are not. This is particularly the case of tourism enterprises, which reduced the size of their labour force by 53 per cent, lost 45 per cent of the book value of their average assets, and saw their K/O ratio soar from 116 per cent to 150 per cent. In contrast, food and beverage and furniture SMEs were able to increase the book value of their average assets at a faster rate than their workforce. Moreover, their K/O ratio grew less steeply than the rest of the enterprises, reflecting an improvement in their capital intensity.
This continuing increase in SMEs’ unutilized capacity is creating downward pressure on their already low productivity levels, with value added per labour unit decreasing by 37 per cent on average in 2001 in relation to 1999 (see table 12). Moreover, productivity declined at a steeper rate than compensation levels, thereby aggravating the SMEs’ financial burden. This was particularly the case of construction and tourism SMEs, which demonstrated the steepest declines (50 per cent) in their labour productivity. Consequently, by the end of 2001 the share of compensation in the enterprises’ dwindling value added had increased from 35 per cent to 44 per cent, reflecting lower returns on capital. Tourism SMEs showed the highest increase in their compensation-to-value-added ratio, from 45 per cent in 1999 to 65 per cent in 2001.
If anything, this reflects the SMEs’ commitment to fulfilling social obligations towards their employees, despite the continued deterioration in the latters’ performance. Available statistics for 2002 show that construction SMEs lost 60 per cent of their value added per labour unit in relation to 1999, while non-metallic, food and beverage and wearing apparel manufacturing SMEs lost more than half of their labour productivity. Furniture enterprises stood as an exception, registering a 45 per cent increase in labour productivity.
SMEs’ survival dynamics
New SME start-ups, expansion and closures
Most SME start-ups over the period 1999-2001 involved enterprises engaged in food and beverages and furniture. The birth rate varies significantly by location and size, with West Bank-based small enterprises constituting the majority of new enterprises. The number of small mining and quarrying enterprises, which are mainly located in the West Bank, also registered a 60 per

31
cent increase. In 2002, West Bank-based small enterprises involved in the construction sector registered a significant birth rate, with their number increasing by 34per cent in relation to 2001 (see table 13).
Moreover, and as shown earlier, SMEs involved in the manufacturing of food and beverages and furniture products registered the highest expansion rates in 2001 in relation to 1999, in addition to those involved in mining and quarrying activities. However, the proliferation of the crisis has generated a massive contraction across the surveyed sectors, bringing the employment level of most SMEs below that of 1999.
SMEs involved in tourism activities registered the highest death rate in 2001 in relation to 1999. The number of Gaza-based SMEs involved in furniture activities decreased significantly over the same period, particularly medium-size enterprises, which were wiped out, while the number of West Bank-based enterprises decreased by 10 per cent. SMEs involved in the production of non-metallic products as well as those involved in construction were also particularly affected, while wearing and appeal enterprises appeared to be the most resilient. This masks the varied impact of the crisis on the SMEs by locality. The number of West Bank-based SMEs declined at a faster rate than those operating in Gaza. The year 2002 witnessed a higher death rate compared to 2001, with the number of SMEs involved in most of the surveyed activities registering a significant decline (see table 13).
SMEs’ coping strategies
Apart from scaling down their production activities, SMEs resorted to several measures to cope with the crisis. These included postponing the payment of taxes and fees by 42 per cent on average and reducing maintenance activities by 7 per cent. Moreover, enterprises showed increased reliance on internal financing and informal markets to cover their expenses. West Bank-based small enterprises showed a particular preference for bond issues as their main source of funds, while medium-size enterprises showed increased reliance on informal profit-sharing loans. In contrast, Gaza-based SMEs showed increased reliance on retained earnings, and small enterprises showed increased preference for informal profit-sharing loans. This took place in the context of the commercial banks’ tightened lending policies, with total loans registering a 33 per cent decrease by December 2002 in relation to September 2000.56
SMEs have also resorted to a range of erosive coping strategies, with devastating consequences for their supply capacity. According to UNSCO, the closure has forced enterprises to replace skilled workers with less skilled workers, build up their precautionary inventories and use Israeli companies to transport their imported inputs from Israeli ports. Some enterprises have also rented apartments for their workers and additional storage facilities to avoid disruptions in their production and distribution activities. Moreover, enterprises are losing connections with their non-Israeli suppliers, as they are becoming more reliant on Israeli suppliers to avoid delays at ports.57

32
Explaining Palestinian SMEs’ performance 2001-2002
The results of the survey show medium-size enterprises cutting back on their employment, and a large percentage of new jobs resulting from labour- intensive small enterprises being started. This suggests that, for such activities, the rate of new starts is inversely related to the aggregate level of economic activity, reflecting the importance of the push factor in firm creation. 58
The findings also highlight the urgent need to reconsider the pace and extent of trade liberalization. If anything, the growth of the food and beverages SME branch that occurred in 2001 is mainly attributable to the increased demand for local products resulting from the Israeli closure policy and movement restrictions. These measures have culminated in a de facto import substitution mechanism as they limit merchandise imports into the Palestinian territory, including those originating in Israel. Indeed, Palestinian imports from Israel decreased by 21 per cent in 2002 in relation to 2001. Food and beverage imports were particularly affected, registering an 11 per cent decrease during the same period.59 Consequently, food and beverage manufacturing SMEs maintained their pre-crisis share of local markets in total sales, and in some cases the local market share increased (see figures 3-6).
Where there has been a decrease in the share of local markets in SME sales, the loss was offset by increased exports to Israel. This has been particularly the case of West Bank-based enterprises involved in wearing apparel (both small and medium-size enterprises) and furniture manufacturing (medium-size enterprises), which witnessed an increase in Israel’s share in their total sales. In contrast, Gaza-based SMEs witnessed an increase in the share of local markets in their total sales, while maintaining their pre-crisis level of sales to Israel.
Development and emergency relief efforts targeting Palestinian SMEs
Renewed policy-making efforts
The PA is in the process of designing a new strategy to guide its development efforts within the context of the donor-funded “Economic Policy Programme” (EPP), which involves assisting the PA in clarifying and shaping trade policy options and strengthening its capacity to negotiate with current and potential trade partners.60 The programme will entail the preparation of several policy papers and draft laws, including: a legal draft for a future trade agreement with Israel, which may be eventually be employed under a free trade agreement (FTA) or a less than full- fledged FTA with Israel; draft legislation on external trade regulation (Foreign Trade Act) compatible with WTO law; updated documentation for a formal application for WTO observer status; and draft legislation on competition and intellectual property rights.
The PA also initiated a new reform agenda, “the 100 Days Plan for government action”, in 2002 with a view to streamlining the civil service and modernizing line ministries, enforcing full fiscal accountability, and creating a predictable and transparent legal environment. Progress to date has
33
entailed the merging of the Ministries of Economy and Trade, Industry and Supply into one ministry, the Ministry of the National Economy (MNE), and the introduction of new measures to restructure the management of the PA’s finances.
Industrial estates and municipal complexes
Prior to the 2000 crisis, the PA had initiated an “integrated industrial estates and free zones programme” with a view to creating competitive advantages for the Palestinian economy through clustering. The programme entails the establishment of nine export-oriented estates, six near the West Bank cities of Jenin, Nablus, Tarkumya, Tulkarem, Jericho and Qualqilya, and three near the Gaza Strip towns of Gaza, Rafah and Deir-Balah. The estates are intended to be mainly located on the border with Israel in order to provide Palestinian labourers seeking jobs in Israel with sustainable employment opportunities that are not affected by the Israeli movement restrictions and closure policy. In this context, agreements were reached with the Israeli authorities that the industrial estates could be exempted from closures and, in the longer term, from the thorough security checks imposed on all imported and exported goods.
The project implies huge investments in modern infrastructure for industrial activity (water, electric power, telecommunications and access roads), in addition to factory buildings, open lots, administration buildings and on-site infrastructure services, and environmental management systems. The programme also entails a package of incentives, including tax holidays, fixed asset and export exemptions, full capital repatriation and risk insurance investment guarantees.
By and large, no specific industry mix has been identified other than in terms of general criteria for guiding tenant selection, namely high- labour-density, low-resource-consuming and low-pollution industries. The industrial estates in Rafah and Toulkarem stand as an exception, with work initiated prior to 2000 to establish a science and information technology park on a 20 hectare site, namely the Khadoury Information Technology Estate (KITE) in Tulkarem. The KITE is meant to provide a platform for the development the Palestinian information and communication technology sector. The estate will include an applied research centre, training facilities, business incubator units, a business park to accommodate software engineering and related services, and business support services such as banks, postal services, and customs clearance and transport services. Rafah Industrial Estate (RIE) will be established on a 150 hectare site to accommodate technology-intensive industries, and it will include an enterprise development centre with incubators and training facilities, in addition to business support services.61
The integrated industrial estates and free zones programme is managed by the Palestinian Industrial Estates and Free Zones Authority (PIFZA), which will own and be responsible for all donor-financed off-site infrastructures. Its mandated tasks, as stipulated in the Industrial Estates and Industrial Free Zones Law (1998), include the preparation of plans and proposals for developing the industrial estates, establishing the required public facilities, contracting site developers, and overseeing the review and approval of tenant applications. In processing these applications, PIEFZA will operate as a one-stop shop to minimize bureaucratic requirements. The fees charged for these services are determined in consultation with relevant authorities, and

34
the proceeds are used to cover the costs of operation and maintenance contracts, as well as loan repayment.
Progress to date has entailed the establishment of the Gaza Industrial Estate (GIE), which started operations in 1999 with funding from the World Bank, the EU and PADICO.62 The estate, which is located on 458,000 square meters at the eastern edge of the Gaza strip, some 5 km from Gaza port, 15 km from Ashdod port and 25 km from Gaza International Airport and the Egyptian border. It is planned to accommodate 300 enterprises and create some 50,000 job opportunities, including 20,000 direct, on-site jobs and 30,000 indirect jobs as a result of private sector investment outside the estate. The site development is undertaken by a sister company of PADICO, the Palestinian Industrial Estate Development and Management Company (PIECO), which is responsible for developing, marketing and managing the site under the supervision of PIEFZA.
By September 2000, the number of enterprises with established operations in GIE had reached 58.63 More than half of these enterprises, i.e. 65 per cent, are engaged in garment or textile manufacturing. Electrical assembly, shoes and leather comprise the balance of industries. This number had declined to 18 by the end of 2002, and the labour force employed by these enterprises consisted of 900 workers. This downscaling of activities has negatively affected the enterprises' total profits, which declined by 50 per cent over the period 2000-2001 from $30 million to $15 million. Moreover, PIECO postponed significant marketing efforts until the security situation stabilizes and arrangements for the movement of goods and access of people are clearly defined.
The PA is also planning to establish six industrial complexes outside the municipal boundaries of major towns, with a view to relocating medium-size enterprises away from residential areas. These estates mainly target existing and new companies catering for local markets, providing them with the required land and services to improve their performance. The estates will be built in two stages, and preparations were under way in 2000 to establish the first of these estates, "Zaatara estate", under the direct supervision of the Municipality of Nablus, Nablus Chamber of Commerce, Industry and Agriculture and PADICO.64 However, the crisis resulted in the suspension of implementation activities.
Donor-funded private sector development projects
The crisis has generated a surge in donors' commitments, which increased by 57 per cent over the period September 2000-2002. However, the funds were allocated mainly to emergency assistance projects, with commitments for infrastructure and capacity-building work with a medium-term focus declining. In 2000, the ratio between the two types of aid, in commitment terms, was approximately 7:1 in favor of development assistance. By 2002, the ratio had shifted to almost 5:1 in favor of emergency assistance, and development assistance declined by 70 per cent (while emergency assistance increased by a factor of 10). Technical assistance programmes targeting the private sector are also focused on responding to enterprises’ emergency needs. These are mainly concerned with enhancing enterprises’ resilience in the face of the economic crisis, particularly through financial support in the form of credit.

35
Market support institutions
The pattern of institutional assistance to Palestinian SMEs is similar to that found in other developing countries. As shown in table 14, the SME support system focuses on training activities, particularly in the area of strategic management, trade promotion and finance. Most institutions provide more than one service, with some hosting donor-funded programmes. However, as mentioned earlier, these programmes are not well coordinated, thereby resulting in the duplication of efforts and undermining their effectiveness.
Moreover, except for the chambers of commerce, most of these institutions are heavily reliant on donors' support for developing their services. Those with internal financing mechanisms operate within limited resources, since the fees generated from their services do not cover their expenses. Problems such as inadequate facilities and equipment and unqualified staff are particularly acute for chambers of commerce and industry. The crisis has aggravated these institutions’ financial constraints, thus further undermining their ability to service enterprises.
Nonetheless, the majority of these institutions are actively seeking to participate in economic policy-making processes within the context of the National Economic Dialogue project (NTDP), which is administered by PECDAR and the World Bank, with the Palestine Trade Centre (Paltrade) as the executive body. This project has created the required institutional mechanisms for enhancing a progressive dialogue between the private sector and the PA. It involves a phased process, whereby the private sector institutions arrive at a consensus with regard to key policy issues that should receive priority treatment from the PA and formulate research-based “white papers” with specific policy recommendations on these issues. These papers are then discussed with representatives of the PA line ministries during workshops, before being published for public dissemination.
Thus far, two workshops have been conducted, one in 2000 and one in 2003, during which the private sector formulated a preliminary priority list covering four policy areas, namely: (i) the impact of Israeli restrictive policy measures on the development of the Palestinian economy; (ii) the impact of government practices and policies on economic growth; (iii) enhancing the private sector's confidence in the economy; and (iv) development challenges stemming from globalization and economic liberalization. The private sector raised several issues, including the need for comprehensive reform of PA institutions; the need to re-orient trade relations with Israel to better address the present and future private sector’s needs and facilitate the economy’s integration with regional markets; the urgent need to develop the legal framework to bring it up to international standards, particularly those promoted by the World Trade Organization (WTO); the importance of acceding to the World Trade Organization (WTO) so as to benefit from membership benefits; and the need to enhance public/private partnership.
Private sector institutions expressed their satisfaction with this project, which helped them set in place a formal process for voicing their needs to policy-makers. However, they were less satisfied with the project’s impact on the economic policy-making process, pointing out that the majority of the suggestions proposed during the first workshop have not been incorporated into the adopted policies.65

36
An assessment of development and emergency relief efforts
While the proliferation of the protracted conflict and the enterprises’ impoverished resources necessitate a comprehensive package of emergency assistance programmes, such a limited focus risks further aggravating the economy’s structural weaknesses, breeding long-term dependencies on foreign aid. This is particularly the case given the erosion of the economy’s supply capacity, resulting from the forced systematic contraction of the medium-sized enterprise category.
The survey clearly shows that the crisis has taken a mounting toll on the surveyed SMEs. Although some enterprises have expanded the size of their labour force and asset base, they have been unable to achieve simultaneous increases in their value added, labour productivity and output in view of closures. They are also seeing the erosion of their capital base, as their investments fall short of what is required to replace their ailing machines and equipment. Moreover, the majority show dwindling productive surplus/return on capital and are on the brink of exhausting their coping strategies. The SMEs’ structural weaknesses are further aggravated by the growth of the small enterprise category.
This shows the need for immediate efforts to address the economy’s long-term development. However, the programmes that seek to target the economy’s long-term needs are being implemented in the absence of a cohesive development strategy. This is particularly the case with the industrial estates and free zones project, which also lacks a framework for creating spillover effects for the economy and establishing dynamic interactions with othe r sectors. The programme has been conceived in isolation from the existing industrial regions, and it is not linked with municipal complexes, nor does it address the structural weaknesses of existing enterprises. Actually, the enterprises operating in the industrial estates and free zones may become competitors for local industries. A case in point concerns the garment enterprises in the GIE, which are highly dependent on Israel and do not have many linkages with other enterprises within and outside the estate.66
Moreover, through emphasizing proximity to Israel, the project is mortgaging its success on the influx of investment from Israel. If anything, the sustainability of the estates is questionable, given the recent trend whereby Israeli industries are relocating to cheaper venues in the region. This trend is likely to continue in the future, especially in view of the proliferation of industrial estates in the region. Indeed, Jordanian industrial estates were found to be superior to their Palestinian counterparts in terms of the availability of serviced land, factory buildings and transportation facilities, the cost of utilities and labour, and the economic and political environment.67
Meanwhile, present efforts to formulate a development strategy tend to pay little attention to the long-term impact of the protracted conflict, particularly the profound changes that have taken place in the structure and functioning of the economy. Much importance is attached to accelerating regional integration by developing the legal framework and complying with the multilateral trading system’s rules and regulations. Important as these issues may be, alone they are insufficient to kick-start economic growth. Actually, they could be counter-productive if they are not designed to address the economy's structural weaknesses and support the achievement of strategic development objectives and a Palestinian economic vision. The analysis clearly shows

37
that such efforts have been consistently defeated by enterprises’ limited capacity to respond to external stimuli.
Hence the need for a broader policy framework that takes into account the economy’s structural weaknesses and the new economic realities generated by the protracted conflict, and above all the economic vision of the future Palestinian State. Such a framework should also be cohesive, elaborating specific orientations to guide industrial development and create synergies between trade and industrial policy. In so doing, it should serve as a reference framework to assist policy makers in linking emergency relief efforts with long-term development objectives.
At this stage, it should be stated that the survey on which the previous analysis is based did not cover the impact of the “separation wall” presently being constructed by the Israeli authorities, as the wall did not exist when the survey was designed and conducted. Accordingly, this study is not in a position to provide an accurate impact of the “wall” on Palestinian SMEs. However, as indicated in chapter II, the “wall” will directly raise the level of poverty to unprecedented levels, and it will also produce further deterioration in the competitive positions of many of the surviving SMEs, as they will be separated from their markets and sources of raw materials and therefore face substantial increases in transaction costs. It is also very possible that some of the existing SMEs will not be able to survive the impact of the “wall” if it is completed. Addressing this issue requires the collaboration of the international community and is beyond the scope of this study.

38
Chapter V
A POLICY AND ASSISTANCE FRMEWORK FOR DEVELOPING PALESTINIAN SMES
The analysis in the previous two chapters shows that Palestinian industrial, construction and tourism SMEs are dominated by small enterprises with mainly labour- intensive technologies. These sectors managed to evade most of the impact of the ongoing crisis (beginning in late 2000), which effectively resulted in the erosion of the supply capacity of most other enterprises. Food and beverage enterprises as well as furniture enterprises registered significant growth. However, their future development prospects are threatened by a multitude of constraints.
At the macro level, their development is obstructed by Israeli restrictive measures, distorting trade policy, fierce competition in local markets, the paucity of long-term finance and the lack of skilled labour. These factors have set the limits to the size and nature of activities of new start-ups, leaving entrepreneurs with no incentive to invest in upgrading their production processes or enter into long-term ventures. At the micro-level, existing enterprises are crippled by their outdated machines and equipment, weak managerial structures and poor financial resources. Meanwhile, market support institutions are not able to assume their role properly and to assist enterprises in improving their performance, owing to their weak institutional capacities and limited financial resources.
The results of the survey suggest that the starting point for developing Palestinian SMEs is to enable them to raise their productivity. This is a rather difficult task, given the adverse environment facing these enterprises. It requires a cohesive policy framework that addresses the multitude of factors influenc ing enterprises’ performance at the macro, meso (institutional environment) and micro levels. The results also indicate that this framework needs to be conceived within the context of a bottom-up approach to development, whereby efforts at different levels are aligned to target the economy’s structural weaknesses at the micro level, rather than macro-economic disequilibria. This approach should also be consistent with the PA’s development vision, in which the private sector should play a crucial role.
There is little by way of theory and empirical evidence that brings together in a cohesive framework all the factors influencing enterprises’ productivity. Nonetheless, it is possible to discern a number of frameworks to guide industrial and trade policy in such a way as to create synergies and align development efforts around the objective of enhancing SME productivity.
A policy framework for guiding development efforts at the micro level68
Efforts to improve productivity at the enterprise level should go beyond the promotion of business management and technology transfers. Training in the areas of marketing and

39
production does not necessarily enable entrepreneurs to make the right decisions on their production processes. Moreover, mere access to foreign technology, whether in the form of machinery or blueprints, does not imply mastery. Indeed, tacit skills associated with new knowledge, and the fact that foreign technologies are not necessarily geared to addressing specific local needs and conditions, could work as barriers to effective application of imported technologies.
The experience of many other developing countries shows that successful incorporation of new technologies is only possible in countries with sufficient local skills capable of adapting imported technologies to local needs and assimilating more complex technologies through product development. Simply put, gaining mastery of a new technology requires technological skills, efforts and investment by the receiving firm, and the degree of mastery achieved varies by firm according to these inputs. Efforts should therefore seek to develop these “technological capabilities”. In particular, efforts should aim at identifying enterprises’ ability and scope for efficient specialization in technological activities, for extending and deepening these activities/technologies, and for drawing selectively on other technologies to complement existing capabilities.
This requires fostering entrepreneurs’ skills in three specific areas. The first relates to investment decisions, and involves developing entrepreneurs’ ability to identify and obtain the required technology, equipment and human resources. These determine the capital costs of the project, the appropriateness of the scale, product mix, technology and equipment, and the technology understanding gained by the operating firms. The second area concerns production processes and ranges from basic skills such as quality control, operation and maintenance to more advanced ones such as adaptation, improvement or equipment “stretching”, and further to the most demanding ones of research, design, and innovation. The third area involves enterprises’ ability to transmit skills and technology to, and receive them from, component or raw material suppliers, subcontractors, service firms and technology institutions.
As shown in table 15, fostering an enterprise’s technological capability entails a lengthy process, whereby the enterprise graduates to higher levels by mastering core skills and functions at each stage of its development. These range from simple functions, whereby an enterprise is mainly engaged in adapting new technologies to local needs, to more sophisticated ones involving continuous upgrading of product quality and design, diffusing new technologies within the economy, and exporting them through licensing agreements and turnkey projects.
The survey shows that Palestinian SMEs are still at the very early stages of technological development, with enterprises engaged in simple routine activities based on rules of thumb as opposed to research and scientific knowledge. Industrial policy should therefore seek to assist enterprises to graduate to higher levels of technological capability.
A policy framework for guiding development efforts at the macro level69
The economy’s supply capacity is not simply the sum of thousands of individual firm-level capabilities developed in isolation. The extent of mastery achieved by a firm depends not only on its skills, effort and investment but also on the incentives generated by the economy. These affect

40
the pace of accumulation of capital and skills, the types of capital purchased, the kinds of skills learnt and the extent to which existing endowments are exploited in production.
The destructive impact of occupation on the development of SMEs aside, the economy’s limited ability to generate sufficient incentives is among the main reasons behind SMEs’ under-investment in their own technological development. Hence the need for appropriate policies that seek to create incentives for increased production and investments. By and large, technological capabilities are affected by three sets of incentives that should form the focus of industrial and trade policies: (i) macro-economic incentives, which relate to economic growth, price levels, interest rates, exchange rates, credit and foreign exchange availability, as well as political stability and international terms of trade; (ii) incentives from competition, determined by the size of the industrial sector, its level of development and diversification, regulatory measures on firm entry, exit and expansion, and international competition from imports; and (iii) incentives from factor markets, particularly the availability of long-term financing for risky projects involving new technologies, the availability of requisite skills, market information, testing facilities and basic research.
These incentives should be created not in the abstract but within the context of a sector-based development strategy that prioritizes and targets specific industries. This is so because the nature of technological effort and the extent of mastery achieved vary by industry, thus requiring tailor-made policy packages that address the particularities and growth dynamics of priority sectors. Moreover, such a focus generates tangible impact, since it helps target efforts around a critical mass of interrelated enterprises, however rudimentary, that outside assistance can “hook into”.70
The choice of the specific sectors that would form the target of development efforts is rather complex. The massive unemployment and underemployment requires employment-oriented industrial policies that seek to promote labour- intensive activities. At the same time, the declining terms of trade facing such activities require a restructuring of the economy to allow for greater specialization in capital and technology intensive products. This imperative also derives from the need to create a nexus for developing local technological capabilities.
Countries that do not have a local capital- intensive industrial sector tend to lack the base of skills, knowledge, facilities and organization upon which further technological progress so largely depends. They have to rely on outside sources, with adverse consequences for industrial development and economic growth, since the nature of the technology supply and the direction of technological change will be dictated by outside forces and not by local needs. Moreover, local technological progress is obstructed by the lack of local capability to repair, maintain and reproduce imported technologies and adapt them to local requirements. In the case of the occupied Palestinian territory, such capability is important to reproduce alternative technologies suited to the needs of labour-intensive activities, the manufacture of which is no longer profitable in the advanced countries
There is thus a need for a balanced approach combining two sets of industrial policies that seek to expand priority capital- intensive sectors as well as targeted labour- intensive industries. The first set of policies can focus on industries that are more research-intensive than other sectors to allow for the assimilation and diffusion of new technologies, in addition to those that entail huge capital investments. These may include machinery and equipment and transport equipment that
41
enter into capital formation, in addition to information and communications technology that is more research-based. The second set can focus on those labour- intensive industries such as food and beverages that can achieve a simultaneous increase in employment and output to generate employment without sacrificing productivity.
It is worth noting that the production of capital- intensive products does not necessarily require modern plants and mass production. Indeed, the majority of capital goods firms are SMEs, including in developed countries like Germany and the United Kingdom (UK). Production of such goods in SMEs is viable and profitable for a number of reasons, particularly because economies of scale do not play a major role in such industries. This is especially the case of relatively simple capital goods such as basic machine tools and agricultural equipment. The importance of SMEs in expanding these sectors is reinforced by the growing tendency of big firms towards fragmentation through outsourcing, strategic partnerships and other types of networking.
Another important policy issue with direct bearing on the development prospects of the economy’s supply capacity is the pace and extent of economic liberalization. Adopting a sector-focused development policy requires targeted intervention in trade, industry and supporting institutions to promote industrial growth. As explained earlier, technological learning is a lengthy process, thus requiring some temporary protection until local producers reach a reasonable level of mastery. The need for such interventionist policy measures is rather critical in view of the forced erosion of the economy's supply capacity caused by over three years of protracted conflict as well as the existing distorting trade regime.
The protection of infant industries has thus far been the most effective approach for targeting selective intervention. However, this approach runs the risk of “diluting” the incentive to invest in capacity development, the very process it is meant to foster. The experience of other countries, particularly the newly industrialized economies, suggests that it is useful to adopt a dynamic trade policy that protects certain industries, while providing tailor-made incentive packages (e.g. investment and labour upgrading programmes) to promote those specific export-oriented industries with potential in regional and global markets. Moreover, such measures should be temporary, and phased out gradually based on clear performance indicators and requirements. This approach may include enforcing early entry into export markets while maintaining domestic protection in order to stimulate enterprises to invest in upgrading their production processes. Protection should also be limited to those instances where there is a clear market failure arising from enterprises' poor investment capability, rather than from forces stemming from the immediate environment. This means that, unless supported by efficient and well functioning factor markets and support institutions that are capable of servicing the targeted sectors, protection will breed more under-developed enterprises.
There is also a need to consider the extent of foreign direct investment (FDI) flows into the economy. The occupied Palestinian territory undoubtedly needs to import technology in order to expose the SMEs to modern production technologies. However, an uncontrolled influx of FDI risks breeding dependencies on imported technologies that may become a substitute for domestic effort at the advanced levels. If anything, FDI is an efficient means to transfer the results of innovation rather than the innovation process itself. Drawing on Japan's experience, an
42
alternative strategy would be selective curtailment of FDI entry, at least at certain stages of the development process.
Spatial arrangements
The industrial estates and free zones project and the municipal complexes have an important role to play in supporting a sector-focused development strategy. However, as explained earlier, these need to be backed up by additional measures to create spillover effects in the economy. This can be done by drawing on the different approaches to spatial arrangements, namely clustering, networking and strategic alliances. These provide complementary frameworks for generating industrial growth by targeting agglomeration dynamics, as well as inter- firm collaboration.
The clustering approach focuses on creating the required dynamics for developing industrial agglomerates. The first set of dynamics relates to increasing inter-firm coordination through “flexible specialization”, whereby the production process is decentralized through subcontracting arrangements to allow member enterprises to specialize on specific phases of the production chain. Such an approach to industrial organization provides enterprises with the opportunity to take advantage of different economies of scale afforded at different stages of production, focus on product characteristics (instead of price), and achieve economies of scope though adaptive machinery and broader participation by multi-skilled employees so that the relationships between firms become organic and promote innovation. 71
The second set of dynamics relates to fostering inter-firm collaboration by creating the required institutions to facilitate enterprises’ joint action. In so doing, it differentiates between passive externalities that accrue to firms by virtue of being part of a cluster and those that materialize as a result of purposeful joint actions – “collective efficiency”. The derived benefits depend on the number of participants and the direction of joint action, which can be horizontal and/or vertical. Horizontal cooperation entails partnerships between companies operating at the same (or similar) stage in the production chain, while vertical cooperation comprises any type of contractual or informal arrangement between final producers and their input suppliers (backward cooperation), in addition to the exchange of market information between buyers and producers (forward cooperation).72
While inter-firm collaboration is critical for industrial agglomerates to flourish, growth may not follow unless the collaboration is supported by efforts to integrate SME agglomerates into global and regional value chains. This can be done by creating regional and global networks bringing together local firms and international enterprises that together form a complete production chain. Such networks may entail: (i) horizontal collaboration, such as sharing the costs of expensive equipment or R&D; (ii) vertical collaboration through facilitating the decentralization of the production process; and/or (iii) both, allowing member enterprises to form information networks to exchange technology or pool their resources to solve a common problem. 73
Indeed, agglomerates that are isolated from these chains are more likely to follow the “low-road” growth path, whereby enterprises focus mainly on squeezing production costs to maintain their
43
market shares. In contrast, SME clusters well connected to global markets are more likely to follow the high-road path and experience evolutionary growth based on the continuous upgrading of products and processes.74
For capital and technology intensive activities, efforts should seek to assist companies to form strategic partnerships with their international counterparts. These partnerships differ from traditional ones in that they provide the basis for forging two-way relationships focused on joint knowledge production and sharing, as opposed to a one-way transfer of technology. They usually involve formal contractual arrangements and equity participation, and are based on a long-term vision rather than short-term considerations, such as quick profit.
Policy implications
Policies and incentives targeting SMEs
The Palestinian Authority’s role should support the creation of an enabling environment that fosters SME development within the context of the above-mentioned policy framework. In particular, policy measures need to be designed in such a way as not to discriminate against SMEs. They should support SMEs, particularly in priority sectors. They should include simplifying and streamlining licensing requirements, providing SMEs with a fixed proportion of government procurement, investment incentive programmes, employment skill upgrading programmes,75 and reconsidering existing investment laws so as to enable SMEs to benefit from tax holidays. In addition, the PA can establish a special inter-ministerial body to monitor SMEs’ performance and ensure that their development interests are incorporated into trade and industrial policy, in accordance with the overall sectoral focus of the development strategy.
The PA may also consider seeking the donor community's assistance in establishing a special fund for fostering SME development. The fund can provide support for market support institutions; technological innovation; linking SMEs with foreign enterprises; and enterprise training activities, loan and exchange of research personnel, and internship programmes. Other policy measures may include research and development (R&D) tax breaks and state-subsidized R&D programmes,
Spatial arrangements
The PA needs to consider rationalizing the number of industrial estates, free zones and internal estates. It is more appropriate to establish a few specialized industrial estates capable of withstanding the fierce competition from neighboring estates, rather than spreading too thin. It is also more cost-effective to foster existing agglomerations rather than creating estates from scratch. The occupied Palestinian territory has little to start with: there are significant frictions in

44
physical and transaction costs that may hamper the relocation of enterprises into planned and existing estates, especially enterprises enjoying significant shares in local markets. Furthermore, there is a dearth of supporting industries, factors of production, and capable market support institutions.
Moreover, PIEFZA and PIEDCO can consider promoting programmes to integrate enterprises with regional and international companies through subcontracting arrangements and strategic partnerships. In particular, such programmes need to encourage foreign companies to source some parts, components, indirect materials and services from Palestinian enterprises, as well as outsourcing the distribution of brand-name products to Palestinian enterprises.
Sector-specific incubators
Perhaps the most effective approach to developing SMEs, and towards achieving the sectoral objectives of the development strategy, would be to establish sector-specific business incubators. This would allow policy makers to catalyze the process of starting and developing companies, providing entrepreneurs with the expertise, networks and tools they need to make their ventures successful. The incubators could be hosted by industrial estates or by universities, depending on the nature of their services. However, they should be based on feasibility studies and need to be assessed to ensure that they cater to SMEs’ needs within a development strategy. Moreover, they should be equipped with professional staff and linked with local and international market support institutions and universities in order to capitalize on and contribute to the development of existing resources and services targeting SMEs.76
Capacity building for market support institutions
The need to foster the Palestinian market support institution capacity cannot be over-emphasized. However, this should be done within the context of a needs assessment and with a view to enabling these institutions to assume an active role in supporting the PA's development efforts. There is also a need to create institutions that directly affect industrial capabilities, including test laboratories and technology institutions, especially institutions that promote learning and innovation in targeted industries. In particular, efforts should focus on developing these industries’ basic capability not only in technology but also in the basics of conducting business. Issues such as quality, simple manufacturing strategy and use of IT are areas where many SMEs need help. In addition, there is a need to promote research information and services to link companies with capabilities in universities and research institutes and to offer technology transfer programmes.
45
SMEs' access to long-term finance
Analysis shows that the Palestinian banking sector’s poor contribution to economic growth is a symptom of the economy’s structural weaknesses. The problem lies in the forced and systematic occupation-related economic distortion and in the financially risky environment that it creates for many Palestinian SMEs. This financing constraint can only be solved by promoting semi-formal financial institutions that are willing to provide risky loans to the industries concerned, as well as government loan guarantees for qualified SMEs in priority sectors. These measures could also be complemented by employment upgrading/generation schemes.
Institutions of the kind envisaged could tap the banking system’s deposit base to finance their credit lines. This could be done by establishing a special guarantee/insurance fund that would allow these institutions to act as intermediaries between potential borrowers and the banks. The institutions would screen borrowers, monitor their performance and assume responsibility vis-à-vis the banks in case of default. The PA could also consider the establishment of a separate guarantee fund to finance SMEs’ trade activities.
46
Notes
1 See Acs, Z.J., "Small business economics: a global perspective", Challenge, Vol. 35 (6), 1992; and Liargovas, P.,
"The white paper on growth, competitiveness and employment and Greek SMEs”, Small Business Economics, Vol.
11 (3), 1998. 2 Chu, Wan Wen, "Industrial growth and small and medium-sized enterprises: The case of Taiwan", paper presented
at the Conference on Transitional Societies in Comparison: Central East Europe Versus Taiwan, Prague, 27-29 May
1999. 3 Palestinian Central Bureau of Statistics (PCBS), Small and Medium Enterprises Survey, 2000 – Main results,
Ramallah, May 2003. 4 This is consistent with the PCBS approach, which classifies enterprises in accordance with the size of their
workforce. The PCBS establishment census divides enterprises into the following five categories: (i) enterprises
employing less than 4 persons; (ii) enterprises employing 5-9 persons; (iii) enterprises employing 10-19 persons; (iv)
enterprises employing 50-99 persons; and (v) enterprises employing more than 100 persons. See PCBS, Population,
Housing and Establishment Census – The Establishment Report – 1997 , Ramallah, December 1998. 5 PCBS, National Accounts, 1994-1999; and Palestinian National Authority, Ministry of Health, Poverty in
Palestine: January-December 1998, Palestine, 1998. 6 PCBS, The Establishment Report – Update – 1999, website: http://www.pcbs.org. 7 PCBS, The Industrial Survey – 1999 , Ramallah, November 2000. 8 PCBS, The Services Survey – 1999, Ramallah, December 2000. 9The surface area licensed for construction activities is the main indicator used for measuring investment activities in
the Palestinian areas. See United Nations Special Coordinator Office in the Occupied Territories (UNSCO), Report
on the Palestinian economy , a quarterly report, East Jerusalem, Spring 2000. 10 World Bank, Twenty-seven months – Intifada, closures and Palestinian economic crisis: An assessment, West
Bank and Gaza Strip Resident Mission, May 2003. 11 UNCTAD, "Transit and maritime transport facilitation for the rehabilitation and development of the Palestinian
economy", UNCTAD/GDS/APP/2003/1, New York and Geneva, 2004. 12 Domestic absorption is total domestic (as opposed to aggregate) demand: the sum of private and public
consumption and investment. A ratio of domestic absorption to GDP larger than one means the economy's
productive capacity is unable to satisfy domestic demand and the gap is satisfied by imports. 13 UNCTAD, "Report on UNCTAD's assistance to the Palestinian people", prepared by the UNCTAD secretariat for
the Trade and Development Board, fiftieth session, Geneva, 6-17 October 2003. 14 Ibid. 15 This section draws on Palestinian Central Bureau of Statistics (PCBS), Impact of the Israeli measures on the
economic conditions of Palestinian households – 6th round: July-August 2003, Ramallah, 2003; PCBS, Basic
47
changes in labour force indicators 1995-2003, accessed at http://www.pcbs.org; World Bank, Two years of Intifada,
closures and Palestinian crisis: an assessment, West Bank and Gaza Resident Mission, March, 2003; World Bank,
Twenty seven months …"; International Monetary Fund (IMF), Economic performance and reform under conflict
conditions, West Bank and Gaza Strip, September 2003; UNCTAD "Report on UNCTAD's assistance...". 16 See UNCTAD, "Report on UNCTAD's assistance to the Palestinian people", prepared by the UNCTAD secretariat
for the Trade and Development Board, forty-ninth session, Geneva, 7-18 October 2002. 17 Based on the UNCTAD Palestinian integrated database, estimated real GDP in 2002 expressed in 1997 US dollars
was $2,514 million, while that of 1986 was $2,930 million. UNCTAD, "Report on UNCTAD's assistance...", 2003. 18 According to the more restrictive International Labour Organization (ILO) definition of unemployment, which
excludes those no longer seeking work, the annual average rate for the West Bank and Gaza in 2002 was around 31
per cent, which was also a new peak. 19 This ratio measures the portion of dependents (individuals who are too young or too old to work) in the population
as a whole. The dependency ratio is equal to the number of individuals aged below 15 or above 64 divided by the
number of individuals aged 15 to 64. 20 For a detailed description of this system, see UNCTAD, "Transit and maritime …". 21 Palestinian National Information Centre, website: http://www.pnic.gov.ps. The World Bank has reported physical
damage for the period October 2000-August 2002 of US$ 728 million. World Bank, Two years of Intifada…. 22 For a more detailed discussion of these measures, see UNCTAD, ""Report on UNCTAD's assistance...", 2003 23 Federation of Palestinian Chambers of Commerce, Industry and Agriculture (FPCCIA), Role of small businesses
in the Palestinian economy and impact of recent Israeli economic sanctions and measures, Jerusalem, December
2001. 24 This includes households unable to withstand the crisis for another four months and those lacking the means to
survive. 25 Palestinian Monetary Authority (PMA), Statistical Bulletin, different issues, Ramallah. 26 United Nations Office for the Coordination of Humanitarian Affairs in the Occupied Palestinian Territory
(OCHA), New wall projections, special report, East Jerusalem, 9 November 2003. 27 By December 2002, some 83,000 olive and other fruit trees had been uprooted and around 615 dunums of irrigated
land had been destroyed, along with 37 kilometers of water networks and 15 kilometers of agricultural roads.
UNSCO, The impact of Israel’s separation barrier on affected West Bank communities, report of the mission to the
Humanitarian and Emergency Policy Group (HEPG) of the Local Aid Coordination Committee (LACC), occupied
Palestinian territory, April 2003. 28 For more details on recent Palestinian economic trends and trade with Israel, see UNCTAD, "Report on
UNCTAD's assistance to the Palestinian people", prepared by the UNCTAD secretariat for the Trade and
Development Board, fiftieth session, Geneva, 6-17 October 2003.

48
29 PCBS, Palestinian labour force: reality and prospects, website:
http://www.mol.gov.ps/English/IE/papers/khalifeh.htm 30 GFCF is measured by value of acquisitions less disposals of new or existing fixed assets. 31 This is only to be expected given the small size of the Gaza Strip. The West Bank has an area of 5,800 square
kilometres, while the Gaza Strip covers 365 square kilometres. 32 PCBS, The Establishment …. 33 See PMA, Statistical …. 34 Total factor productivity (TFP) is a better measure of enterprises' productive capacity than labour productivity.
However, in the case of the Palestinian areas, using TFP is not feasible owing to the lack of accurate figures on
capital. 35 In 1999, industrial SMEs’ average labour productivity stood at $9,740, while that of construction and tourism
SMEs was $24,746 and $6,972 respectively. Comparable figures for the entire economy were $10,086, $24,028 and
$ 4,967, respectively. See, PCBS, different economic surveys. 36 As reported during conversations with Palestinian businessmen. 37 Productive surplus is a proxy for return on capital, since it measures the value added left for the owners after
deducting expenditures on compensation, fees and taxes, and depreciation. 38 This approach to examining the dynamics of SMEs was advanced by Liedholm and Mead in the course of their
work on SMEs in developing countries. See Liedholm, C., Small firm dynamics: evidence from Africa and Latin
America, Washington: World Bank Institute, 2001; and Liedhom, C. and D. Mead, Small Enterprises and Economic
Development: The Dynamic Role of Micro and Small Enterprises, London: Routledge, 1999. 39 See Julia Hawkins, “Incubating micro enterprise: Virtual or reality?”, Palestine Economic Pulse, May-June 1997,
accessed at http://www.palecon.org/pulsedir/may97/private.html. 40 Krugman, P., Geography and Trade, Cambridge: MIT, 1991. 41 For a detailed discussion of this issue, see UNCTAD " Transit and maritime transport…" 42 See Liedholm, C., Small firm dynamics…. 43 See Nasr, M., Opportunities and Prospects for Palestinian Industrialization , Palestine Economic Policy Research
Institute-MAS, Ramallah, 1997. 44Knorringa, P. and H. Weijland, "Subcontracting: the Incorporation of Small Producers in Dynamic Industrial
Networks". In: I.S.A. Baud and G.A. de Bruijne (eds.), Gender, Small-Scale Industry and Development Policy,
London: Intermediate Technology Publications, 1993. 45 The following laws with a direct bearing on economic and trade activity have been published in the Official
Gazette: Public Works and Bidding Law, Public Procurement Law, Natural Resources Law, Amendment of Money
Changers Law, Supervision and Stamp of Gold and Precious Metals Law, Industrial Zones Law, Labour Law,
Encouragement of Investment Law, Environment Law, Palestinian Monetary Authority Law, Law for the Formation
of the Insurance and Pensions Fund, Commercial Agency Law, Law for the Establishment of the Palestinian Energy

49
Authority, Apartments Condominiums and Stores Ownership Law, Law for the Establishment of the Palestinian
Water Authority, Communication and Telecommunication Law, Animal Husbandry Law, Public Budget and
Financial Affairs Law. 46 See for example UNCTAD, "Cooperation between the Palestinian Authority, Egypt and Jordan on trade-related
services" (UNCTAD/GDS/SEU/3), Geneva, 2000. 47 As reported in conversations with Palestinian businessmen. 48 Ministry of Planning and International Cooperation (MOPIC). 49 As reported in conversations with Palestinian businessmen and representatives of market support institutions. 50 As reported in conversations with representatives of Palestinian market support institutions. 51 UNCTAD, "Information note on the economy of the Occupied Palestinian territory (West Bank and Gaza)",
prepared by the Palestine National Authority for the Third United Nations Conference on the Least Developed
Countries, Brussels, 14-20 May 2001. 52 Radi, L., L'élite Palestinienne : Stratégies de Survie et Modes D'influence (1967-1997), Paris, 1998. 53 The term investment gap refers to the size of investments required to cover maintenance costs. 54 As reported in conversation with Palestinian businessmen. 55 Pro kopenko, J., Productivity Management: A Practical Handbook , ILO, Geneva, 1992. 56 See PMA, Statistical… . 57 UNSCO, The impact of closure and other mobility restrictions on Palestinian productive activities-1 January
2002-30 June 2002, October 2002. 58 This corresponds to the findings of similar studies on other developing countries. See Liedholm, C., Small firm
dynamics…. 59 PCBS, "Preliminary results of Palestinian foreign trade – 2002", press release, October 2003. 60 This project was initiated in 1996, and its third phase was due to be completed by the end of 2003. It is
coordinated by the London School of Economics (LSE), with funding from the EU (phase I) and UK's DFID (phases
II and III). 61 As reported in conversations with an official from PIEFZA. 62 The total cost is estimated at $65 million – $40 million from PADICO and the rest from the PA through donor
support (European Investment Bank, World Bank and USAID) in the form of loans. The land has been leased to
PIECO by the PA under a 49-year nominal ($1) lease agreement. 63 USAID (2002), Update on the Gaza Industrial Estate, The occupied Palestinian territory, October. Accessed at:
www.usaid.gov/wbg/headline_66.htm 64 Makhool, B., The industrial estates and their expected role in employment, An-Najah National University, Nablus,
1997. 65 As reported in conversations with representatives of Palestinian market support institutions. 66 Vinterhav, E., Industry in Palestine, Palestine, 2000.
50
67 Achievement of Market-Friendly Initiatives and Results Program (AMIR Program), The Jordanian Industrial
Estates Corporation market demand study for serviced industrial estates, Jordan, April 2002. 68 This section is based on the evolutionary theories developed by Nelson and Winter, 1982. See Nelson, R.R. and
S.G. Winter, An Evolutionary Theory of Economic Change, Cambridge Mass: The Belknap Press, 1982. The section
also draws on the Lall, S. "Technological capabilities and industrialization", World Development, Vol. 20, 1992;
Caniels, M. and Henry, R. SME clusters, acquisition of technological capabilities and development: Concepts,
practice and policy lessons, Open University of Netherlands, Netherlands, 2002. 69 This section draws on Schmitz, H. and K. Nadvi, "Clustering and industrialization: Introduction", World
Development, Vol. 27, 1999; Schmitz, H., "Collective Efficiency: Growth Part for Small-scale Industry", Journal of
Development Studies, Vol. 31, 1995; and Lall, S. "Selective industrial and trade policies in developing countries:
Theoretical and empirical issues", Working Paper Number 48, Oxford, Queen Elizabeth House, August 2000. 70 Schmitz, H. and K. Nadvi, "Clustering and industrialization …" 71 Piore, M. and C. Sabel, The Second Industrial Divide: Possibilities for Prosperity, NY: Basic Books, 1984. 72 Schmitz, H., " Collective Efficiency: Growth Part for Small-scale Industry", Journal of Development Studies, Vol.
31, 1995; and Schmitz, H., "Collective Efficiency and Increasing Returns", IDS Working Paper 50, Institute of
Development Studies, University of Sussex, Brighton, 1997. 73 UNCTAD, Development Strategies and Support Services for SMEs: Proceedings of Four Intergovernmental
Expert Meetings, United Nations: New York and Geneva, 2000. 74 Sengenberger, W. and Pyke, F., "Small Firm Industrial Districts and Local Economy Regeneration: Research and
Policy Issues", Labour and Society, Vol. 16, 1991. 75 Employment upgrading programmes are still in the pilot phase. Following the outbreak of the protracted conflict,
local market support institutions, with donor support, have launched two programmes that have met with success.
See the Palestinian Trade Center (Paltrade) and Palestinian Information Technology Association (PIPA) at the
following Websites: http://www.paltrade.org, and http://www.pita-palestine.org. 76 In 1994, two pilot incubators were designed to support Palestinian enterprises, in An-Najah University in Nablus
and in Gaza. The first incubator was meant to stimulate technological entrepreneurship and commercialize the
results of scientific research, while the Gaza-based facility focused on fostering innovative products and services,
particularly in agribusiness, computer software, garments and artisan products, in addition to construction. However,
the two projects have not been implemented for various reasons, particularly the lack of competent staff. See Julia
Hawkins, “Incubating micro enterprise…".

51
List of tables
Table 1 – SMEs’ share in total establishments by sector - RWBGS1, 1999
Table 2 - SMEs contribution to industrial, construction and tourism
Growth - RWBGS, 1999 (Percentages)
Performance indicator Contribution to industrial growth
Contribution to construction growth
Contribution to tourism growth
Share of total employment 58 71 44 Share of total VA 56 73 62 Share of total output 62 69 57 Share of GFCF 40 24 17 Share of total compensation 67 75 69
Table 3 - Industrial SMEs in RWBGS: leading activities, 1999
(In percentages)
Economic activity Share in
industrial employment
Share in industrial
output
Share in industrial
value added
Share in industrial
GFCF
Share in industrial
compensation Manufacture of food & beverages
8 14 11 9 8
Manufacture of wearing apparel 36 10 15 18 28
Non-metallic products 26 34 34 27 33 Manufacture of furniture 5 4 2 1 4 Mining & quarrying 3 4 5 22 4 Remaining manufacturing activities 21 33 33 23 23
1 Remaining West Bank and Gaza Strip.
Economic activity No. of total establishments
No. of SMEs SMEs’ share in total establishments
Food & beverages 1782 427 24% Manufacture of wearing apparel 2231 1082 48% Non-metallic products 1982 772 39% Manufacture of furniture 1773 156 9% Mining & quarrying 274 140 51% Remaining manufacturing activities 6249 640 10% Electricity and water supply Industrial sector Construction Hotels & restaurants Total
364 14655
356 2589
17600
6 3223 204 308
3735
2% 22% 57% 12% 21%
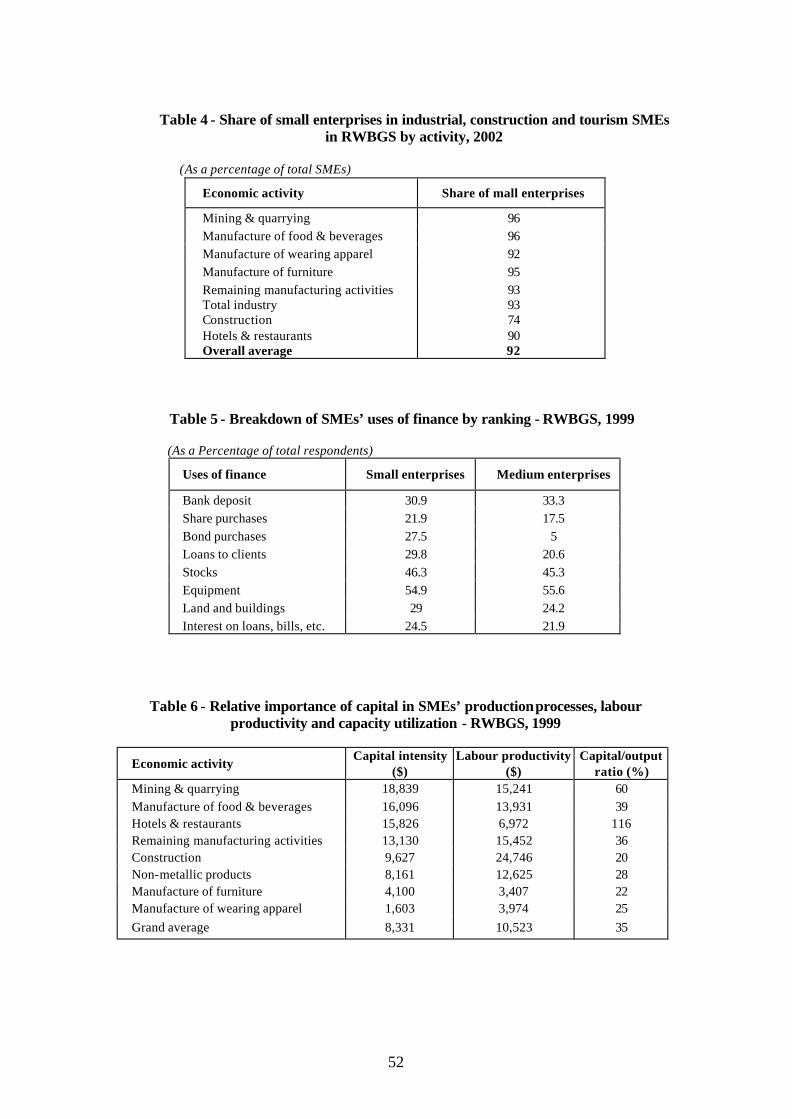
52
Table 4 - Share of small enterprises in industrial, construction and tourism SMEs
in RWBGS by activity, 2002
(As a percentage of total SMEs)
Economic activity Share of mall enterprises
Mining & quarrying 96 Manufacture of food & beverages 96 Manufacture of wearing apparel 92 Manufacture of furniture 95 Remaining manufacturing activities Total industry Construction Hotels & restaurants Overall average
93 93 74 90 92
Table 5 - Breakdown of SMEs’ uses of finance by ranking - RWBGS, 1999
(As a Percentage of total respondents)
Uses of finance Small enterprises Medium enterprises
Bank deposit 30.9 33.3 Share purchases 21.9 17.5 Bond purchases 27.5 5 Loans to clients 29.8 20.6 Stocks 46.3 45.3 Equipment 54.9 55.6 Land and buildings 29 24.2 Interest on loans, bills, etc. 24.5 21.9
Table 6 - Relative importance of capital in SMEs’ production processes, labour productivity and capacity utilization - RWBGS, 1999
Economic activity Capital intensity
($) Labour productivity
($) Capital/output
ratio (%) Mining & quarrying 18,839 15,241 60 Manufacture of food & beverages 16,096 13,931 39 Hotels & restaurants 15,826 6,972 116 Remaining manufacturing activities 13,130 15,452 36 Construction 9,627 24,746 20 Non-metallic products 8,161 12,625 28 Manufacture of furniture 4,100 3,407 22 Manufacture of wearing apparel 1,603 3,974 25 Grand average 8,331 10,523 35

53
Table 7 – SMEs’ dynamics: New start-ups and closures by enterprise size and activity - RWBGS, 1994-1997
(In prcentages)
Economic activity Small enterprises Medium enterprises
Mining & quarrying 28 -33 Manufacture of food and beverages -9 -28 Manufacture of tobacco products 0 -- Manufacture of textiles -23 0 Manufacture of wearing apparel 35 48 Tanning of leather; manufacture of bags -3 70 Manufacture of wood and its products -27 -67 Manufacture of paper and its products -15 300 Publishing, printing and reproduction -33 -50 Manufacture of chemicals & its products 7 0 Manufacture of rubber and plastic 12 -9 Manufacture of non-metallic products 8 7 Manufacture of basic metals 50 -100 Manufacture of metal products -7 14 Manufacture of machinery and equipment -2 0 Manufacture of electrical machinery 45 -- Manufacture of medical, optical equipment -56 -- Manufacture of motor vehicles, trailers -55 -50 Manufacture of other transport equipment -50 -- Manufacture of furniture 2 80 Manufacturing 7 19 Construction 48 23 Hotels & restaurants -1 -9
Source: PCBS,Establishment Census-1997, Ramallah, 1998. New start-ups refers to the increase in the number of enterprises, and the closures reflect the decrease in the number of enterprises. -- : No SMEs in this sector.
Table 8 - Labour productivity by enterprise size and economic activity RWBGS, 1999*
(In $ Dollars)
Economic activity Small enterprises Medium enterprises
Manufacture of food & beverages 13,614 15,408 Manufacture of wearing apparel 3,785 4,369 Non-metallic products 10,986 22,484 Manufacture of furniture 3,210 4,396 Construction 26,920 22,621 Hotels & restaurants 6,081 12,079 Mining & quarrying 13,057 35,196 Remaining manufacturing activities 15,522 15,235
Grand average 9,918 12,405
*Labour productivity = total value added /total No. of workers
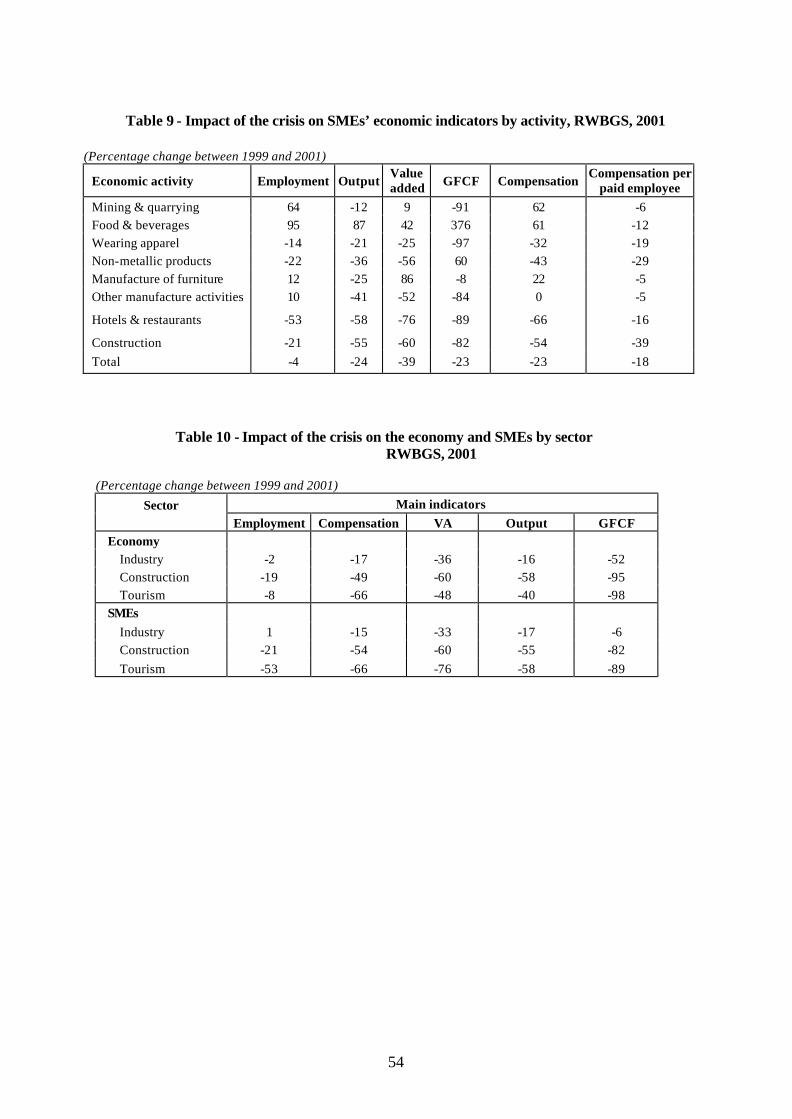
54
Table 9 - Impact of the crisis on SMEs’ economic indicators by activity, RWBGS, 2001
(Percentage change between 1999 and 2001)
Economic activity Employment Output Value added GFCF Compensation
Compensation per paid employee
Mining & quarrying 64 -12 9 -91 62 -6 Food & beverages 95 87 42 376 61 -12 Wearing apparel -14 -21 -25 -97 -32 -19 Non-metallic products -22 -36 -56 60 -43 -29 Manufacture of furniture 12 -25 86 -8 22 -5 Other manufacture activities 10 -41 -52 -84 0 -5
Hotels & restaurants -53 -58 -76 -89 -66 -16
Construction -21 -55 -60 -82 -54 -39 Total -4 -24 -39 -23 -23 -18
Table 10 - Impact of the crisis on the economy and SMEs by sector RWBGS, 2001
(Percentage change between 1999 and 2001)
Main indicators Sector Employment Compensation VA Output GFCF
Economy Industry -2 -17 -36 -16 -52 Construction -19 -49 -60 -58 -95 Tourism -8 -66 -48 -40 -98
SMEs Industry 1 -15 -33 -17 -6 Construction -21 -54 -60 -55 -82 Tourism -53 -66 -76 -58 -89

55
Table 11 - Changes in SMEs’ workforce and compensation levels – RWBGS (Percentage change between June 2000 and June 2002)
Economic activity Total paid Total unpaid Compensation
Mining & quarrying -18 0 -28 Manufacture of food & beverages -31 -8 -35 Manufacture of wearing apparel -28 -2 -38 Manufacture of furniture -18 -12 -30 Remaining manufacturing activities -22 3 -26 Total industry -25 -1 -31 Construction -15 1 -25 Hotels & restaurants 0 0 -8 Grand average -24 -1 -29
Table 12 - Relative importance of capital in SMEs’ production processes, labour productivity and capacity utilization - RWBGS, 2001
Economic activity Capital intensity ($) Productivity ($) Capital/output ratio
(%) Mining & quarrying 21,289 10,133 126 Manufacture of food & beverages 18,460 10,184 47 Hotels & restaurants 18,401 3,488 150 Remaining manufacturing activities 10,103 6,716 51 Construction 6,675 12,460 25 Non-metallic products 19,827 7,081 83 Manufacture of furniture 4,203 5,647 33 Manufacture of wearing apparel 2,522 3,463 44 Grand average 11,731 6,644 62
Table 13 – SMEs’ dynamics: New start-ups and closures by activity RWBGS, 2001-2002
(Percentages)
Economic activity RWB Gaza
Food and beverages -60 27 Wearing apparel -29 -22 Non-metallic products 12 -7 Furniture -53 17 Construction -5 34

56
Table 14 - SME support system in the occupied Palestinian territory, 2000
Agency Core services
PA institutions Ministry of National Economy
Articulation of industrial and trade development strategies; trade negotiations; dissemination of trade information; and coordination of donor-funded private sector development projects, including the mobilization of the required financial resources.
Ministry of Finance General Directorate of Customs and Excise
Implementation of customs policy, including: collection of tax and customs revenues and customs clearance. The directorate is in the process of automating customs administration procedures within the context of the ASYCUDA project.
Palestinian Standards Institute
Standards, quality assurance and technical services for enterprises.
Market support institutions Chambers of Commerce, Industry and Agriculture
Certificates of origin; dissemination of trade information; training services in the area of business management; organization of trade fairs abroad and local exhibitions; organization of thematic and sectoral workshops, in addition to facilitating the exchange of trade delegations.
Federation of Palestinian Chambers of Commerce, Industry and Agriculture
Technical assistance for chambers of commerce; networking the chambers with their international counterparts within the context of the Euro-Med project; point of reference for donor-funded projects extended to the chambers of commerce; networking Diaspora Palestinians with local enterprises; vocational training; and policy advocacy.
Palestinian Federation of Industries; Industrial Union; business associations
Policy advocacy, inter-firm linkages.
Palestine Trade Center (Paltrade)
Trade promotion and market development; trade facilitation and economic policy development; and capacity building and market information services.
Palestinian Information Technology Association (PITA)
Exhibitions, business development and training services and policy advocacy.
Consulting firms Tailor made advisory services in the area of business management JETRO Trade promotion services Palestinian Banking Cooperation (PBC)
Corporate finance (syndicated loans and profit sharing loans); trade finance; advisory services in the area of financial management; and training services in the area of entrepreneurship (Empretec Palestine project).
Commercial banks Credit facilities for SM Es through guarantee funds. World Bank/MIGA Guarantee fund for private investment USAID - Market Access Programme (MAP), launched in 1999.
- Emergency assistance projects: Palestinian Enterprise Revitalization Programme (ENASH); Repair and Replacement Initiative; Intern Assistance Programme; Financial Restructuring Programme; Emergency Loan Programme.
GTZ Small Enterprise Development Project: “coaching and referral services” to assist the enterprises in developing their management and production processes.

57
Table 15 - Illustrative matrix of technological capabilities
Source: Lall, S., "Technological capabilities and industrialization", World Development, Vol. 20, 1992.
Functional
Investment Production Degree
of complexity
Pre-investment
Project execution
Process engineering
Product engineering
Industrial engineering
Linkages within
economy
Basic
Simple, routine (experience based)
Prefeasibilitiy and feasibility studies, site selection, scheduling of investment
Civil construction, ancillary services, equipment erection, commissioning
Debugging, balancing, quality control, preventive maintenance, assimilation of process technology
Assimilation of product design, minor adaptation to market needs
Work flow, scheduling, time-motion studies, inventory control
Local procurement of goods and services, information exchange with suppliers
Intermediate
Adaptive/ duplicative (search based)
Search for technology source, negotiation of contracts, bargaining suitable terms, info systems
Equipment procurement, detailed engineering, training and recruitment of skilled personnel
Equipment stretching, process adaptation and cost saving, licensing new technology
Product quality improvement, licensing and assimilating new imported product technology
Monitoring productivity, improved coordination
Technology transfer of local suppliers, coordinated design, S&T links
Advanced
Innovative/risky (research-based)
Basic process design, equipment design and supply
In-house process innovation, basic research
In-house product innovation, basic research
Turnkey capability, cooperative R&D, licensing own technology to others
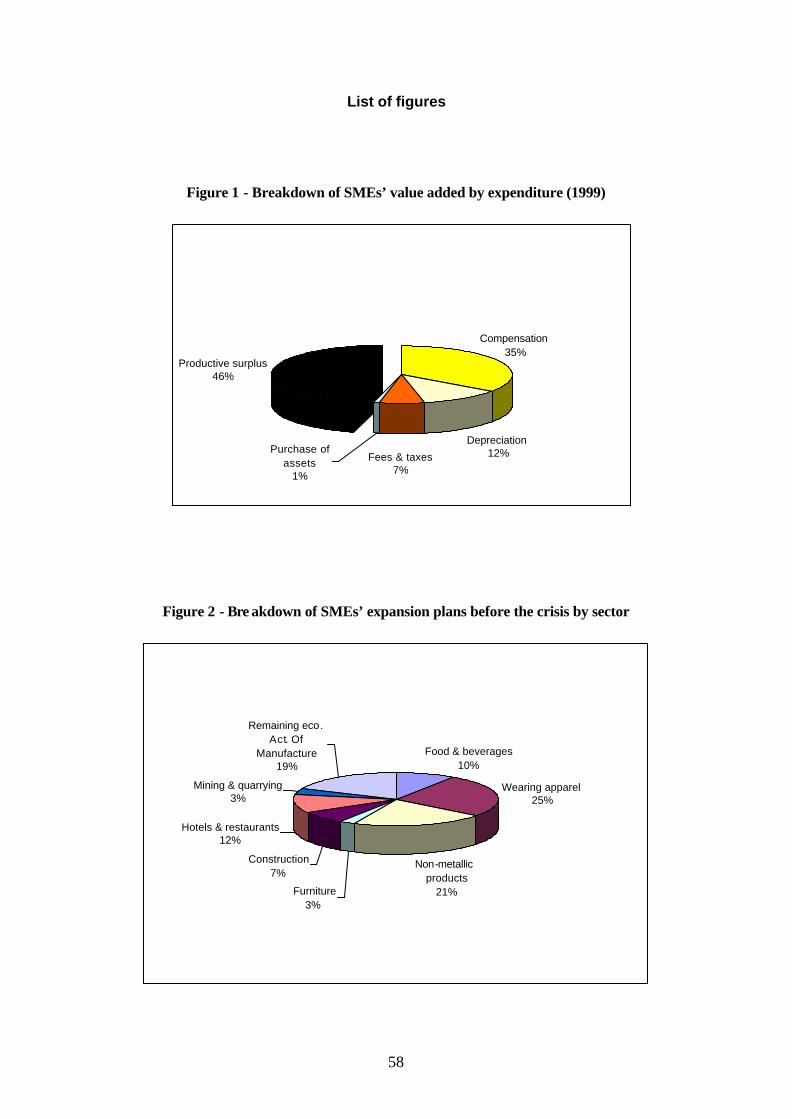
58
List of figures
Figure 1 - Breakdown of SMEs’ value added by expenditure (1999)
Depreciation 12%
Productive surplus46%
Compensation 35%
Purchase of assets
1%
Fees & taxes 7%
Figure 2 - Bre akdown of SMEs’ expansion plans before the crisis by sector
Food & beverages10%
Wearing apparel 25%
Non-metallic products
21% Furniture3%
Construction7%
Hotels & restaurants12%
Mining & quarrying3%
Remaining eco. Act. Of
Manufacture 19%

59
Figure 3 - Share of local markets in West Bank-based small enterprises (%), June 2001 - June 2002
0
20
4060
80
100
120
Min
ing
&qu
arry
ing
Foo
d &
beve
rage
s
Wea
ring
appa
rel
Fur
nitu
re
Rem
aini
ngm
anuf
actu
re
Con
stru
ctio
n
Hot
els
&re
stau
rant
s
June 2000-June 2001
June 2001-June 2002
Figure 4 - Share of local markets in the West Bank-based medium enterprises (%), June 2001 - June 2002.
020406080
100120
Min
ing
&qu
arry
ing
Foo
d &
beve
rage
s
Wea
ring
appa
rel
Furn
iture
Rem
aini
ngm
anuf
actu
re
Con
stru
ctio
n
Hot
els
&re
stau
rant
s
June 2000-2001
June 2001-June 2002

60
Figure 5 - The share of local markets in Gaza-based small enterprises (%), June 2001 - June 2002.
Figure 6- Share of local markets in Gaza-based medium enterprises (%)
0204060
80100120
Foo
d &
beve
rage
s
Fur
nitu
re
Rem
aini
ngm
anuf
actu
re
Con
stru
ctio
n
Hot
els
&re
stau
rant
s
June 2000-June 2001
June 2001-June 2002
020406080
100120
Foo
d &
beve
rage
s
Wea
ring
appa
rel
Fur
nitu
re
Rem
aini
ngm
anuf
actu
re
Con
stru
ctio
n
Hot
els
&re
stau
rant
s
June 2000-June 2001
June 2001-June 2002