palomar and table mountain observations of 9p/tempel · pdf filepalomar and table mountain...
TRANSCRIPT

Icarus 187 (2007) 296–305www.elsevier.com/locate/icarus
Palomar and Table Mountain observations of 9P/Tempel 1 duringthe Deep Impact encounter: First results
James M. Bauer a,∗, Paul R. Weissman a, Young-Jun Choi a, Mitchell Troy a, James W. Young a,Carey M. Lisse b, Richard Dekany c, Martha S. Hanner d, Bonnie J. Buratti a
a Jet Propulsion Laboratory, California Institute of Technology, 4800 Oak Grove Drive, Mailstop 183-501, Pasadena, CA 91109, USAb Johns Hopkins University, Applied Physics Laboratory, SD/SRE, MP3-W155, 7707 Montpelier Road, Laurel, MD 20723, USA
c Department of Astronomy, California Institute of Technology, 1200 E. California Blvd., Mail code 105-24, Pasadena, CA 91125, USAd University of Massachusetts, Department of Astronomy, 619 Lederle Graduate Research Center, Amherst, MA 01003, USA
Received 7 April 2006; revised 12 September 2006
Available online 16 January 2007
Abstract
We present the first results of the Palomar Adaptive Optics observations taken during the Deep Impact encounter with 9P/Tempel 1 in July 2005.We have combined the Palomar near-IR imaging data with our visual wavelength images obtained simultaneously at JPL’s Table MountainObservatory to cover the total wavelength range from 0.4 to 2.3 µm in the B, V, R, I, J, H, and K filter bands, spanning the dates from 2005 July 03–07. We also include in our overall analysis images taken on the pre-encounter dates of June 1 and June 15, 2005. The broad wavelength range of ourobservations, along with high temporal resolution, near-IR sensitivity, and spatial resolution of our imaging, have enabled us to place constraints onthe temperature of the impact flash and incandescent plume of >700 K, and to provide mean dust velocities of order 197 ± 16 m/s approximately1.25 h after impact derived from our 1.64 µm observations. Our ejected dust mass estimates, as derived from our near-IR observations, are anorder of magnitude less than those previously reported for visual wavelength observations.© 2006 Elsevier Inc. All rights reserved.
Keywords: Comet Tempel-1; Adaptive optics; Comets, dust
1. Introduction
Comets provide a critical part of our understanding of theformation and evolution of the Solar System. They serve astracers of its primordial material (cf. Meech and Svøren, 2004)because they are comprised of the primitive materials from thelocations where they formed in the early outer-planetary sys-tem. In the current broad understanding of cometary origins,many of these volatile-rich bodies were ejected from their for-mation regions. The accepted explanation is that a majority ofthese bodies originated at heliocentric distances of 5–35 AU,and were transported outward into the scattered disk and even-tually the nether regions of the Solar System, the Oort cloud(cf. Dones et al., 2004) by perturbations with the giant planets.In contrast, the Kuiper Belt objects, beyond 35 AU, formed in
* Corresponding author.E-mail address: [email protected] (J.M. Bauer).
0019-1035/$ – see front matter © 2006 Elsevier Inc. All rights reserved.doi:10.1016/j.icarus.2006.10.035
situ (e.g., Levison and Morbidelli, 2003). Recent evidence sug-gests that the overall picture of comet evolution is not simple,though, in that the source regions of comets, such as the KuiperBelt have evolved dynamically and physically (Morbidelli andBrown, 2004). Even the long period comets, with the major-ity of their lifetimes spent far from the Sun, undergo rapidcollisional evolution (Dones et al., 2004) during the ejectionprocess. Such evolution also includes depletion of volatiles andlikely surface-mantling brought on by exposure to galactic cos-mic rays, as well as brief periods of exposure to relativelymore intense solar radiation during their perihelion approaches(Jewitt, 2002). Hence, all cometary surfaces undergo some de-gree of processing and evolution. As heliocentric distance isthe dominant factor in terms of surface temperature, sublima-tion rates, and exposure to radiation from the solar wind, it iscertain that the Jupiter-family comets (JFCs) like 9P/Tempel 1have undergone a larger amount of processing owing to theircomparative proximity to the Sun. However, the rates of the sur-

A first look at Palomar AO observations of Deep Impact 297
face evolution processes, like mantling, are also closely tied tothe nature of the surface materials, the surface composition, andthe surface and sub-surface volatile content (Jewitt, 2004). Thedensity, size, compaction, and conductivity of any dust layeron the nucleus surface influence the rubble mantling rate. Thesurface composition and volatile content also influence the rateand effectiveness of irradiation mantling as well as the rate ofsurface darkening by interaction with the solar wind (Moroz etal., 2004). The rate of surface darkening may in turn affect thesublimation rate via the albedo’s relation to surface tempera-ture.
The Deep Impact mission was designed to provide planetaryscience with insights to core questions involving the study ofcometary bodies, including their composition, origins, and evo-lution. The observations of the Deep Impact experiment weredesigned to yield constraints on the factors, such as the strengthof the surface layers and their respective depths, that influencevarious evolutionary processes, such as mantling or collision-induced resurfacing. The experiment yielded these constraintsby impacting the surface with a ∼370 kg mostly-copper pro-jectile, with a velocity relative to the nucleus of 10.3 km/s,and excavating a quantity of material from the cometary nu-cleus interior (A’Hearn et al., 2005a). Spectra, taken prior toand during the impact event, contained compositional informa-tion for surface constituents and ejecta (A’Hearn et al., 2005a;Sunshine et al., 2006). The quantity of ejected dust provides di-rect constraints for the surface strength and the depth of thesurface-layers deposited from historic activity. This quantityis best characterized and monitored from an Earth-based dis-tance, and most practically from a number of ground-basedobservatories (Meech et al., 2005a), as the quantity of scatter-ing dust per unit viewing solid angle is greater and thereforegenerates a more easily detectable signal. The field of viewcontains a much larger percentage of the dust emitted by theimpact. The effects of solar radiation and the coma color distri-bution, which provide constraints on the nature of the dust, areapparent over the entire coma in observations taken at Earth–comet distances. Additionally, because spacecraft observationsare limited in temporal range and resolution, viewing geometry,and often wavelength range, key observations come from thecontribution of ground-based telescopes. Palomar Observatorywas a major observing site in this ground-based network, andprovided adaptive optics data in the J (with central wavelength,λc = 1.25 µm, and bandwidth δλ = 0.16 µm), H (λc = 1.64 µm,δλ = 0.30 µm), and K (λc = 2.15 µm, δλ = 0.31 µm) filterbands, with its high spatial and temporal resolution over anessential wavelength range. These standard near-IR filter bandpasses were readily comparable with other cometary coma ob-servations in the literature.
As part of the global effort by ground-based observatories tomonitor the Deep Impact encounter with Comet 9P/Tempel 1,our observing team at Palomar and Table Mountain (TMO) Ob-servatories covered the impact one night prior through threenights following the event. The Palomar 200-inch telescopeplayed a crucial role in this campaign, in that it was the largestground-based telescope to provide imaging in the near-infraredduring the time of impact, offering temporal resolution on rel-
atively short (approximately 11.4 s, including 9.9 s integrationtime and 1.5 s readout) time scales. Simultaneous visual-bandobservations were taken from TMO in the R-band during theimpact event, and in the B, V, R, and I bands at times sur-rounding the event. We observed the comet with the Palomar200-inch telescope using the PALAO system in adaptive opticsmode at near-infrared wavelengths (Troy et al., 2000). Palo-mar’s distinct AO system enabled us to obtain a near-IR data setwith uniquely high spatial resolution, on average ∼0.8 arcsecseeing, FWHM, and at times down to 0.4 arcsec. The resolutionafforded us the opportunity to better characterize other sourcecontributions to the coma, differentiating between the ambientactivity and that generated by the impact event. The AO dataalso allowed us to track changes in the coma and dust grainsclose-in to the nucleus during the impact, when ejecta werefreshest. The changes that occurred in the dust coma on timescales of minutes to hours during the Deep Impact encountercan be best studied, at near-IR wavelengths, with an imagingdata set such as this one. We present here preliminary resultsfrom our encounter observations during the night of the impactexperiment, and briefly examine the ambient state of the cometfrom our monitoring campaign prior to the encounter as it per-tains to these observations.
2. Observations and reduction
Table 1 lists a summary of our observations relating to theDeep Impact encounter. All nights reported here were pho-tometric. Visual-band pre-impact observations were made onJune 1 and June 15, 2005 at TMO prior to the DI encounter.During the encounter, TMO’s 0.6-meter telescope also servedas our visual-wavelength imaging site. Observations were madeat TMO using a Bessel B, V, R, and I filter set in combina-tion with the facility Photometric 1024×1024 CCD camera.The images have a plate-scale of 0.523 arcsec per pixel, andwere flattened and bias-corrected in the usual manner (cf. Baueret al., 2004) using the Image Reduction and Analysis Facilitysoftware package (IRAF; Tody, 1986). For each night’s data, atleast 9 bias frame zero-second exposures were averaged, with a3-sigma pixel rejection algorithm. At least 5 sky-flat exposuresper filter, taken at twilight, were median-combined to form asingle flat for each band-pass. Bias frames were subtracted fromeach exposure, and each image was divided by the correspond-ing filter’s flat frame. Calibrations were accomplished usingLandolt equatorial standards (Landolt, 1992) to obtain zero-point, extinction, and color corrections. In order to guaranteecoverage at the exact time-of-impact, we observed the cometthrough the R-band filter in drift-scan mode around the time ofimpact from 05:51:15 to 06:23:21 UT. We chose guiding ratesof 15,000 arcsec per hour along each axis so that the cometdrifted from the lower left (SE) corner of the CCD image to theupper right (NW) corner in two minutes, the length of our ex-posures. For all other times except the night of the impact, wetracked the comet at its predicted rate of motion across the sky,using values listed in an ephemeris obtained from JPL’s Hori-zons service (http://ssd.jpl.nasa.gov). During the encounter run,we observed 9P/Tempel 1 to airmass values of ∼4 from TMO,

298 J.M. Bauer et al. / Icarus 187 (2007) 296–305
Table 19P/Tempel 1 observing runs at Palomar and Table Mountain Observatories
Dates (UT) JD-2450000 Filter-bands Seeinga PA�b PAvel.b 〈r〉c 〈�〉d Conditions
Jun 01 3522.6–3522.9 VRI ∼2.4 (TMO) 118 299 1.545 0.757 PhotometricJun 15 3536.6–3536.9 K & VRI 1.0/1.8 114 302 1.519 0.807 PhotometricJul 03 3554.6–3554.8 JHK & BVRI 0.48/2 112 304 1.506 0.889 PhotometricJul 04 3555.6–3555.8 HK & BVRI 0.6/2 111 304 1.506 0.894 PhotometricJul 05 3556.6–3556.8 HK & BVRI 0.7/2 111 305 1.506 0.899 PhotometricJul 06 3557.6–3557.8 JHK & BVRI 0.7/2 111 305 1.506 0.904 PhotometricJul 07 3558.6–3558.8 JHK & BVRI 0.6/2 111 305 1.506 0.910 Photometric
a Approximate FWHM in arcsecs for images (Palomar Obs./TMO, unless otherwise indicated).b Position angles on the observer’s sky plane of the Sun ⇒ comet radius vector (PA�), and the negative of the comet’s heliocentric velocity vector (PAvel.) in
degrees N through E as obtained from JPL’s Horizons ephemeris service.c Mean heliocentric distance (AU).d Mean target–observer distance (AU).
and found a pre-impact R-band magnitude of ∼14.6, using a5-arcsec aperture. The seeing degraded from our nominal valueof 2 arcsec to ∼4 arcsec over this time. However, using relativephotometry, we were able to correct for the seeing degradationto first order even when our object reached these low altitudeangles.
We observed from Palomar using the near-IR PHARO cam-era in combination with the facility adaptive optics system(Hayward et al., 2001). The system utilizes a Shack–Hartmannhigh-order wave-front sensor (WFS) to guide and correct onbright objects, down to ∼13th (V-band) magnitude. The cam-era used a 1024 × 1024 Hawaii array, with a pixel scale of0.04 arcsec for the configuration used. Pre-encounter estimatesof 9P/Tempel 1’s brightness were several magnitudes higherthan the actual value during the 2005 perihelion approach, andso we were unable to effectively use the standard WFS, exceptwhen the comet appulsed a nearby bright star within ∼30 arc-sec. The use of the WFS allows for correction of higher orderoptical distortion terms (cf. Hampton et al., 2003), and so ismore desirable than the correction afforded by other wave-frontsensors available at Palomar (see below). It should be noted,however, that the effectiveness of the WFS correction is depen-dent on the brightness of the WFS guide star, as well as theproximity of the guide star to the target, the intrinsic seeing, andthe airmass of the target (Hayward et al., 2001). The correctionmay only be slightly better than for lower order terms alone, butwe found that, during a bright guide star appulse, the correctionwas always better and more stable using the WFS. These ap-pulse events occurred on the nights of July 3, 5, and 7 UT, butnot on the night of the impact; it was during the appulse onJuly 3 that we achieved the best FWHM of 0.4 arcsec. We alsoobtained K-band exposures on June 15 at Palomar Observatoryusing the AO system’s PHARO camera. We were unable to lockthe AO correction loop on the faint comet, so the decision wasmade subsequent to the June 15 observations to hasten the im-plementation of a low-order wave-front sensor (LOWFS), thatwould allow guiding at fainter magnitudes, including those ofthe comet, while maintaining a lower degree atmospheric cor-rection. As June 15 was an engineering night, no calibration starexposures were obtained, and so we only provide crude mag-nitude estimates for June 15 based upon the calibration dataobtained during our Deep Impact encounter run.
For the encounter observations, the LOWFS worked on thefirst night it was tried, on July 3, achieving down to 0.5 arcsecresolution, and was used in all instances where a nearby brightstar was not available for full AO correction, including the nightof the Deep Impact encounter. Because the comet set below 4airmasses at approximately 7 UT, we were allocated time foronly the first half of the night, during which time we also had toobtain calibration star frames, twilight flats, and darks. Infraredstandards were selected before the observing run from the lit-erature (Persson et al., 1998; photometric standard Stars 9150,9155, and 9178), and were observed at low and high airmassto correct for extinction, zero-point offset, and color terms. Be-cause the coma was extended, sky frames 7 arcmin to the northof the comet’s field of view (FOV) were taken within 20 min ofany object exposure. This was seen as an adequate trade-off be-tween tracking the changes in sky brightness and coverage ofthe event. Observations were restricted to H and K band filtersduring the night of the impact and the following night, July 5, asa balance between wavelength and temporal coverage. Individ-ual frames were prepared using Palomar’s AO IDL reductionsoftware (AORED; https://s383.jpl.nasa.gov/~mtroy/AOred/),which rescales, median filters, and divides out flat frames, me-dian filters and subtracts darks and sky frames, and rescales theobject images to per-second signal values.
3. Analysis
3.1. Pre-impact observations
Prior to the encounter, TMO observations yielded magni-tudes and Afρ values in V-, R-, and I-band filters for Comet9P/Tempel 1 (Table 2). Measurements in an additional B-bandfilter were obtained in our July data. Our visual-band color dataare rather typical of comets (cf. Tholen et al., 1981). The col-ors are similar to or slightly redder than solar colors, and do notvary much among the pre or post impact observations (Tables 3and 4). Previous encounters averaged brightness values (totalmagnitude) near mR = 10 when scaled to similar distances(Meech et al., 2005b; Belton et al., 2005) and log(Afρ) [cm]values near 2.5 approximately 20 days prior to perihelion (Lisseet al., 2005), corresponding to our June 15 observations. Actualobservations, however, yielded R-band Afρ values (A’Hearn

A first look at Palomar AO observations of Deep Impact 299
Table 29P/Tempel 1 visual pre-encounter magnitudes
Dates (UT) mVa mR mI ρ [km] Afρ [log cm]
V R I
June 01 15.395 ± 0.028 14.995 ± 0.048 14.589 ± 0.065 1.09×10³ 2.192 ± 0.011 2.208 ± 0.019 2.258 ± 0.02614.233 ± 0.006 13.775 ± 0.013 13.325 ± 0.023 2.76×10³ 2.254 ± 0.003 2.293 ± 0.005 2.361 ± 0.00913.467 ± 0.022 12.999 ± 0.002 12.521 ± 0.011 5.49×10³ 2.262 ± 0.009 2.305 ± 0.003 2.384 ± 0.00412.701 ± 0.006 12.303 ± 0.001 11.799 ± 0.001 1.10×10⁴ 2.267 ± 0.003 2.282 ± 0.003 2.371 ± 0.003
June 15 15.250 ± 0.010 14.765 ± 0.014 14.240 ± 0.015 1.16×10³ 2.263 ± 0.004 2.313 ± 0.006 2.411 ± 0.00614.090 ± 0.008 13.639 ± 0.014 13.140 ± 0.014 2.94×10³ 2.324 ± 0.004 2.361 ± 0.006 2.448 ± 0.00613.330 ± 0.008 12.904 ± 0.013 12.410 ± 0.014 5.84×10³ 2.330 ± 0.004 2.356 ± 0.005 2.442 ± 0.00612.590 ± 0.008 12.220 ± 0.013 11.710 ± 0.014 1.17×10⁴ 2.325 ± 0.004 2.329 ± 0.005 2.421 ± 0.006
a Corresponding to 2, 5, 10 and 20 arcsec radius apertures. Test data taken the night of June 15 at Palomar yielded a 2-arcsec aperture (radius) K-band mag. of13.22 ± 0.11 and a 5-arcsec aperture mag. of 12.36 ± 0.11 corresponding to a log(Afρ [cm]) value of 2.42 ± 0.04.
Table 3Deep Impact event B–K colors (5 arcsec aperture)
Date (UT) B–Va V–R V–I mV J–H H–K H–K (2”) mH V–H
050703 0.83(±0.04) 0.34(±0.04) 0.87(±0.05) 14.58(±0.03) 0.43(±0.07) 0.32(±0.22) 0.31(±0.16) 12.51(±0.04) 2.07(±0.05)
050704Pre-impact 0.74(±0.03) 0.48(±0.03) 0.93(±0.03) 14.64(±0.03) – 0.34(±0.04) 0.34(±0.05) 12.50(±0.06) 2.14(±0.07)
Impact + 7m – 0.42(±0.11) 0.29(±0.05) 12.14(±0.05)
Impact + 30m – 0.31(±0.06) 0.21(±0.05) 11.56(±0.03)
Impact + 65m – 0.31(±0.05) 0.21(±0.05) 11.42(±0.03)
Impact + 75m – 0.29(±0.07) 0.21(±0.05) 11.45(±0.02)
050705 0.84(±0.03) 0.36(±0.03) 0.90(±0.03) 14.25(±0.03) – 0.53(±0.10) 0.29(±0.03) 12.33(±0.04) 1.92(±0.05)
050706 0.76(±0.03) 0.40(±0.03) 0.88(±0.03) 14.36(±0.03) 0.45(±0.07) 0.38(±0.15) 0.25(±0.10) 12.34(±0.04) 2.02(±0.05)
050707 0.79(±0.03) 0.43(±0.03) 0.90(±0.03) 14.48(±0.03) – 0.42(±0.16) 0.29(±0.15) 12.46(±0.05) 2.02(±0.06)
a Approximate solar colors: B–V = 0.65, V–R = 0.36, V–I = 0.65 (Drilling and Landolt, 2000), J–H = 0.31, H–K = 0.06, V–H = 1.43 (Tokunaga, 2000).
Table 4Deep Impact event V- and H-band magnitudes, Afρ values, and H–K colors
Date (UT) mVa mH
a AfρH AfρH V–H H–Kb V–K
050615 14.09(±0.03) 2.32 ± 0.01050703 14.58(±0.03) 12.51(±0.04) 2.17 ± 0.01 2.42 ± 0.02 2.07(±0.05) 0.31(±0.16) 2.39(±0.17)
050704Pre-impact 14.64(±0.03) 12.50(±0.06) 2.15 ± 0.01 2.43 ± 0.02 2.14(±0.07) 0.34(±0.05) 2.48(±0.08)
Impact + 7m 12.14(±0.05) 2.57 ± 0.02 0.29(±0.05)
Impact + 30m 11.56(±0.03) 2.80 ± 0.01 0.21(±0.05)
Impact + 65m 11.42(±0.03) 2.86 ± 0.01 0.21(±0.05)
Impact + 75m 11.45(±0.02) 2.85 ± 0.01 0.21(±0.05)
050705 14.25(±0.03) 12.33(±0.04) 2.31 ± 0.01 2.50 ± 0.02 1.92(±0.05) 0.29(±0.03) 2.45(±0.11)
050706 14.36(±0.03) 12.34(±0.04) 2.26 ± 0.01 2.50 ± 0.02 2.02(±0.05) 0.25(±0.10) 2.40(±0.16)
050707 14.48(±0.03) 12.46(±0.05) 2.22 ± 0.01 2.45 ± 0.02 2.02(±0.06) 0.29(±0.15) 2.44(±0.17)
a 5-arcsec aperture radii.b 2-arcsec aperture radii.
et al., 1984a) of 2.31 on June 1, and 2.35 on June 15, lowerthan were expected (Table 2). These values were derived from5-arcsec aperture radius R-band magnitudes and include thesignal of the nucleus. K-band magnitudes were obtained on thenight of June 15th as well, yielding redder than solar V–K colors(V–K for the Sun is ∼1.49, while on June 15, the 9P/Tempel 1V–K color was 1.73 ± 0.11). These redder colors at near-IRwavelengths were a persistent feature of the ambient comet, al-though the V–K colors were typically redder still (V–K ∼2.4;see Tables 3 and 4) during the encounter than on June 15. Thismay have been caused in part by large particles being injected
into the coma by an outburst of 9P/Tempel 1, which was re-ported for the preceding night (A’Hearn et al., 2005a).
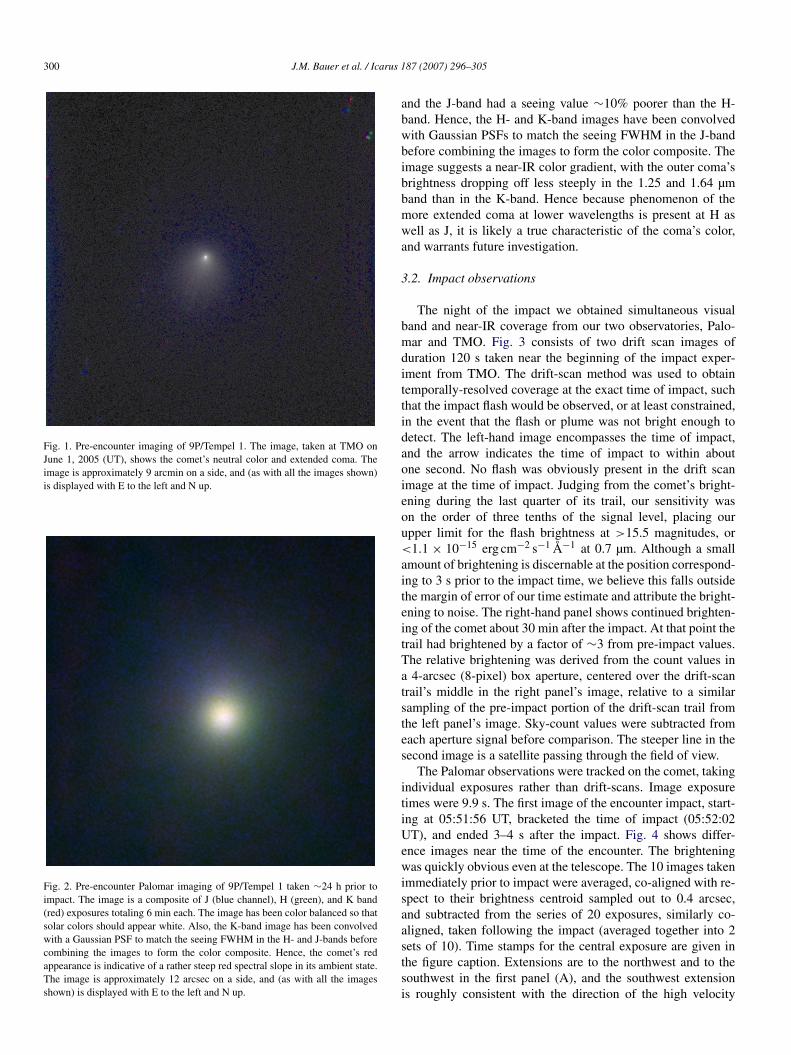
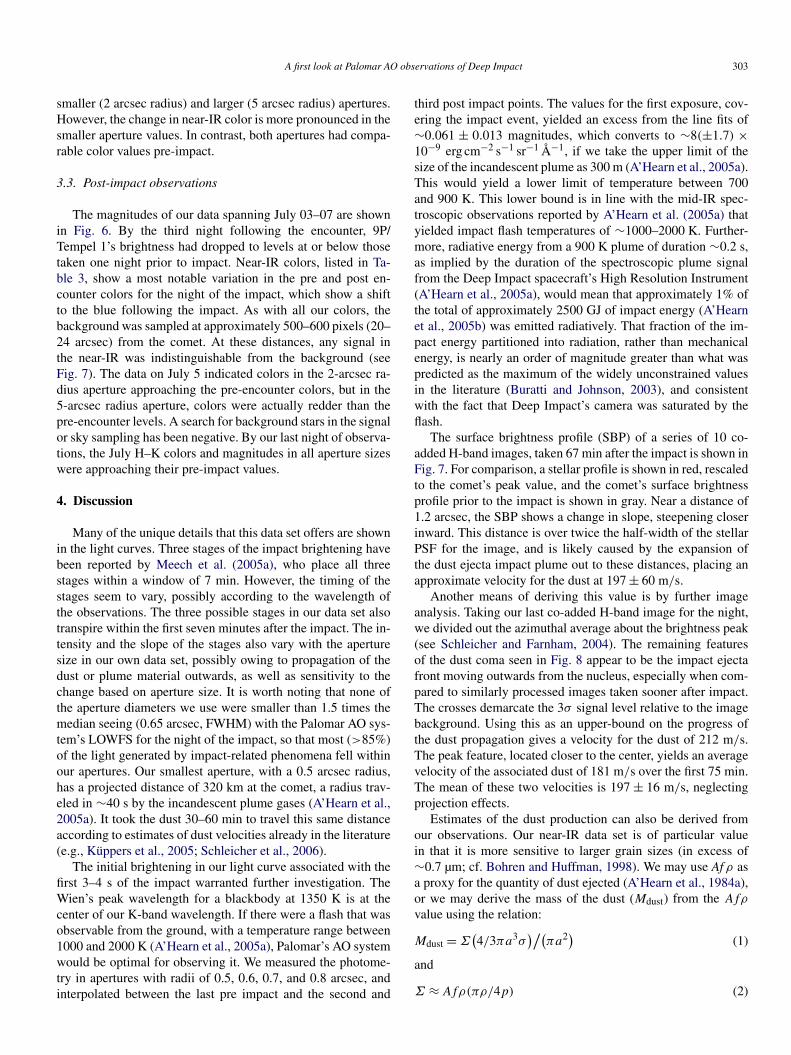
A three-color VRI-band composite image from June 1 isshown in Fig. 1. The coma is almost neutral (slightly red, ac-cording to the colors in Table 2) in color at visual wavelengths.Fig. 2 shows a color-composite at near-IR wavelengths takenon the night prior to impact, 21 h after the last reported out-burst and before the impact experiment (A’Hearn et al., 2005a).J is mapped to blue, H to green, and K to red. The H-bandAO-corrected seeing was only about ∼10% poorer than theK-band, comparing the FWHM values of on-frame bright stars,
300 J.M. Bauer et al. / Icarus 187 (2007) 296–305
Fig. 1. Pre-encounter imaging of 9P/Tempel 1. The image, taken at TMO onJune 1, 2005 (UT), shows the comet’s neutral color and extended coma. Theimage is approximately 9 arcmin on a side, and (as with all the images shown)is displayed with E to the left and N up.
Fig. 2. Pre-encounter Palomar imaging of 9P/Tempel 1 taken ∼24 h prior toimpact. The image is a composite of J (blue channel), H (green), and K band(red) exposures totaling 6 min each. The image has been color balanced so thatsolar colors should appear white. Also, the K-band image has been convolvedwith a Gaussian PSF to match the seeing FWHM in the H- and J-bands beforecombining the images to form the color composite. Hence, the comet’s redappearance is indicative of a rather steep red spectral slope in its ambient state.The image is approximately 12 arcsec on a side, and (as with all the imagesshown) is displayed with E to the left and N up.
and the J-band had a seeing value ∼10% poorer than the H-band. Hence, the H- and K-band images have been convolvedwith Gaussian PSFs to match the seeing FWHM in the J-bandbefore combining the images to form the color composite. Theimage suggests a near-IR color gradient, with the outer coma’sbrightness dropping off less steeply in the 1.25 and 1.64 µmband than in the K-band. Hence because phenomenon of themore extended coma at lower wavelengths is present at H aswell as J, it is likely a true characteristic of the coma’s color,and warrants future investigation.
3.2. Impact observations
The night of the impact we obtained simultaneous visualband and near-IR coverage from our two observatories, Palo-mar and TMO. Fig. 3 consists of two drift scan images ofduration 120 s taken near the beginning of the impact exper-iment from TMO. The drift-scan method was used to obtaintemporally-resolved coverage at the exact time of impact, suchthat the impact flash would be observed, or at least constrained,in the event that the flash or plume was not bright enough todetect. The left-hand image encompasses the time of impact,and the arrow indicates the time of impact to within aboutone second. No flash was obviously present in the drift scanimage at the time of impact. Judging from the comet’s bright-ening during the last quarter of its trail, our sensitivity wason the order of three tenths of the signal level, placing ourupper limit for the flash brightness at >15.5 magnitudes, or<1.1 × 10⁻¹⁵ erg cm−2 s−1 Å−1 at 0.7 µm. Although a smallamount of brightening is discernable at the position correspond-ing to 3 s prior to the impact time, we believe this falls outsidethe margin of error of our time estimate and attribute the bright-ening to noise. The right-hand panel shows continued brighten-ing of the comet about 30 min after the impact. At that point thetrail had brightened by a factor of ∼3 from pre-impact values.The relative brightening was derived from the count values ina 4-arcsec (8-pixel) box aperture, centered over the drift-scantrail’s middle in the right panel’s image, relative to a similarsampling of the pre-impact portion of the drift-scan trail fromthe left panel’s image. Sky-count values were subtracted fromeach aperture signal before comparison. The steeper line in thesecond image is a satellite passing through the field of view.
The Palomar observations were tracked on the comet, takingindividual exposures rather than drift-scans. Image exposuretimes were 9.9 s. The first image of the encounter impact, start-ing at 05:51:56 UT, bracketed the time of impact (05:52:02UT), and ended 3–4 s after the impact. Fig. 4 shows differ-ence images near the time of the encounter. The brighteningwas quickly obvious even at the telescope. The 10 images takenimmediately prior to impact were averaged, co-aligned with re-spect to their brightness centroid sampled out to 0.4 arcsec,and subtracted from the series of 20 exposures, similarly co-aligned, taken following the impact (averaged together into 2sets of 10). Time stamps for the central exposure are given inthe figure caption. Extensions are to the northwest and to thesouthwest in the first panel (A), and the southwest extensionis roughly consistent with the direction of the high velocity

A first look at Palomar AO observations of Deep Impact 301
Fig. 3. Drift scan images of Comet 9P/Tempel 1 during the Deep Impact encounter. Left: 120 s R-band exposure begun at 05:51:15 on July 4 (UT). Comet drift isfrom lower left to upper right. The time of impact, 05:52:01.8 ± 0.4, is indicated by the arrow. No significant brightening of the trail is observed. Right: Similar driftscan image, 120 s in duration, begun at 06:21:21 UT, about 29 min after impact. The comet trail has brightened by about a factor of three. The steeper diagonal lineat right is an Earth-orbiting satellite that passed through the field-of-view.
Fig. 4. The K-band image of the impact (right; 05:50:47–05:52:42 UT) and theimage immediately following (left; 05:52:45–05:54:43 UT). Both images arethe result of 10 co-added frames, with the co-added image taken immediatelyprior to the impact subtracted. The blue circle indicates the mean seeing disksize for the night’s data, ∼0.7 arcsec in diameter, and the field of view of eachimage is 7 × 7 arcsec. The center of the brightness peak prior to subtraction isindicated by the blue cross-hairs.
ejecta, though it is unexpected that such features would be re-solved so soon after the impact. Estimated ejection velocitiesof ∼10 km/s for the luminous plume would only extend to atmost 400 km, neglecting projection effects, over the 40 s pastimpact that the first co-added image covers, while the south-west extension is >500 km. However, a similar extension to thesouth and west (position angle 225◦, north through east, andalso about an arcsec in length) was reported by other observersat mid-IR wavelengths (Meech et al., 2005a). Panel B showsthe brightening within 2 min after impact (note the relativeprominence of the constant background noise levels in the twopanels). The brightening concentrated at the unresolved corehas already swamped most lower-intensity features, though thebrightening seems subtly to extend to the south and west.
The Palomar light curve for the night of the encounter isshown in Fig. 5. Panel A shows our data covering the nightof the event and panel B shows the light curve a few minutespreceding and following the impact event. The magnitudes in
panels A and B are plotted with respect to the integration mid-times, and K-band photometry for aperture radii of 0.5, 0.8,and 2.0 arcsec are shown along with H-band photometry for a2-arcsec radius photometry aperture. The background was sam-pled at approximately 500–600 pixels (20–24 arcsec) from thecomet. The first K-band data point following the dashed lineindicating time-of-impact (corrected for light-travel time) actu-ally contains the signal at the moment of impact near its centertime. All apertures show two trends in the light curve within thefirst minute after the impact: an initial rapid increase, followedby a marked decrease in the rate of brightening approximately50 s following the impact. A third trend seems possible at ap-proximately 7 min in the form of a renewed increase in thebrightening, but at a lower rate of increase than the initial rapidbrightening. However, upon analysis of fitted line slopes to the1 to 6 min and 7 to 20 min post-impact samples of the lightcurve points, the increase after 7 min is not significantly differ-ent than the rate observed after 50 s in the 0.5 and 2.0 arcsecapertures. The 0.8-arcsec aperture shows a difference in therates before and after 7 min at the 2σ level. The times-of-changein the post-impact brightening rate are indicated by a verticaldot-dashed line in Fig. 5B. Signal from any impact flash is notreadily apparent in the 2-arcsec aperture radius signal, and the9.9-s integration following shows only a modest brightening inthe largest of the apertures. The rate of brightening begins todecrease past 23 min, post-impact, and its decline is sharpestin the smallest aperture. The intervals of coverage of the TMOR-band visible data, shown in Fig. 4, are indicated for the corre-sponding exposure time spans by the cyan dashed lines in Fig. 5(panels A and B).
Our preliminary color data from Palomar and TMO are givenin Table 3. The near-IR colors show more variation than those ofthe visual bands. Photometry was obtained for the near-IR datausing 2 and 5 arcsec aperture radii to compare with our visualdata sets. The Palomar seeing varied between FWHM valuesof 0.5 and 1 arcsec. The TMO data set during the DI encounter

302 J.M. Bauer et al. / Icarus 187 (2007) 296–305
Fig. 5. The Palomar light curve of Comet 9P/Tempel 1 during the night ofthe Deep Impact experiment. The top panel (A) shows the entire data set forthe impact night. The red points represent the 2.15 µm (K-band) magnitude ofthe comet within a 2 arcsec aperture radius from the brightness peak. 0.8 and0.5 arcsec aperture signals for the K-band data are shown in blue and magenta,respectively. The 1.64 µm (H-band) data is shown in green. The K-band 2.0,0.8, and 0.5 arcsec aperture signals are shown in detail at the time surround-ing impact in the bottom panel (B). The time of impact is shown by the verticaldashed line. The approximate times of transition between the three stages ofpost-impact brightening, as indicated by the light curves, are shown by thedot-dashed lines. Note, however, the times of onset of the changes in the bright-ening rates may differ between individual aperture data sets, and while the rateof post-impact brightening may change at the farthest dot-dashed line on theright, the evidence of this is significant at the 2σ level only in the 0.8 arcsecaperture signal. The cyan dotted line at the bottom of the graph corresponds tothe time interval of the first drift scan in Fig. 3.
had seeing of between 2 and 4 arcsec, and so we compared onlythe 5-arcsec aperture values for our exposures taken during theencounter. Our H-band observations were taken within 6 minof our K observations. We took image following the sequence:5 K-band observations, 10 H-band observations, 5 K-band ob-servations. The 10 K-band observations, and the 10 H-band
Fig. 6. The H- and K-band magnitudes over the five nights of coverage of thePalomar data set. By the night of July 7 (UT), the H- and K-band signals hadreturned to their pre-encounter levels.
Fig. 7. The surface brightness profile of 9P/Tempel 1 immediately before and67 min following impact at 1.65 µm. The values are plotted in units of H-bandmagnitudes on a log-angular-distance scale as black points with error bars. Thered curve indicates the mean stellar profile provided by an average of back-ground stars in the field at and near the time of the exposures, and re-scaled tothe peak signal to show the extent of the coma. The lower dashed curve is thecomet’s profile taken approximately 15 min before the impact.
observations were then co-added, respectively, and H–K colorscalculated. The changes in near-IR color roughly track thosereported by Mori et al. (2006), although our average H–K col-ors appear somewhat larger by 0.05 to 0.1 magnitudes. In ei-ther case, the colors are slightly redder than may be expectedfrom average active comet colors (cf. Veeder and Hanner, 1981;A’Hearn et al., 1981, 1984b; Campins et al., 1982; these yield acollected mean H–K color from 6 comets of ∼0.22 ± 0.15, and0.41±0.10 for the J–H mean), possibly owing to a thermal con-tribution from the grains at 2.15 µm (Hanner et al., 1984). Theoverall trends during the impact indicate bluer colors at near-IR wavelengths immediately following the impact, relative topre-impact colors. This is true of the colors sampled in both the
A first look at Palomar AO observations of Deep Impact 303
smaller (2 arcsec radius) and larger (5 arcsec radius) apertures.However, the change in near-IR color is more pronounced in thesmaller aperture values. In contrast, both apertures had compa-rable color values pre-impact.
3.3. Post-impact observations
The magnitudes of our data spanning July 03–07 are shownin Fig. 6. By the third night following the encounter, 9P/Tempel 1’s brightness had dropped to levels at or below thosetaken one night prior to impact. Near-IR colors, listed in Ta-ble 3, show a most notable variation in the pre and post en-counter colors for the night of the impact, which show a shiftto the blue following the impact. As with all our colors, thebackground was sampled at approximately 500–600 pixels (20–24 arcsec) from the comet. At these distances, any signal inthe near-IR was indistinguishable from the background (seeFig. 7). The data on July 5 indicated colors in the 2-arcsec ra-dius aperture approaching the pre-encounter colors, but in the5-arcsec radius aperture, colors were actually redder than thepre-encounter levels. A search for background stars in the signalor sky sampling has been negative. By our last night of observa-tions, the July H–K colors and magnitudes in all aperture sizeswere approaching their pre-impact values.
4. Discussion
Many of the unique details that this data set offers are shownin the light curves. Three stages of the impact brightening havebeen reported by Meech et al. (2005a), who place all threestages within a window of 7 min. However, the timing of thestages seem to vary, possibly according to the wavelength ofthe observations. The three possible stages in our data set alsotranspire within the first seven minutes after the impact. The in-tensity and the slope of the stages also vary with the aperturesize in our own data set, possibly owing to propagation of thedust or plume material outwards, as well as sensitivity to thechange based on aperture size. It is worth noting that none ofthe aperture diameters we use were smaller than 1.5 times themedian seeing (0.65 arcsec, FWHM) with the Palomar AO sys-tem’s LOWFS for the night of the impact, so that most (>85%)of the light generated by impact-related phenomena fell withinour apertures. Our smallest aperture, with a 0.5 arcsec radius,has a projected distance of 320 km at the comet, a radius trav-eled in ∼40 s by the incandescent plume gases (A’Hearn et al.,2005a). It took the dust 30–60 min to travel this same distanceaccording to estimates of dust velocities already in the literature(e.g., Küppers et al., 2005; Schleicher et al., 2006).
The initial brightening in our light curve associated with thefirst 3–4 s of the impact warranted further investigation. TheWien’s peak wavelength for a blackbody at 1350 K is at thecenter of our K-band wavelength. If there were a flash that wasobservable from the ground, with a temperature range between1000 and 2000 K (A’Hearn et al., 2005a), Palomar’s AO systemwould be optimal for observing it. We measured the photome-try in apertures with radii of 0.5, 0.6, 0.7, and 0.8 arcsec, andinterpolated between the last pre impact and the second and
third post impact points. The values for the first exposure, cov-ering the impact event, yielded an excess from the line fits of∼0.061 ± 0.013 magnitudes, which converts to ∼8(±1.7) ×10−9 erg cm−2 s−1 sr−1 Å−1, if we take the upper limit of thesize of the incandescent plume as 300 m (A’Hearn et al., 2005a).This would yield a lower limit of temperature between 700and 900 K. This lower bound is in line with the mid-IR spec-troscopic observations reported by A’Hearn et al. (2005a) thatyielded impact flash temperatures of ∼1000–2000 K. Further-more, radiative energy from a 900 K plume of duration ∼0.2 s,as implied by the duration of the spectroscopic plume signalfrom the Deep Impact spacecraft’s High Resolution Instrument(A’Hearn et al., 2005a), would mean that approximately 1% ofthe total of approximately 2500 GJ of impact energy (A’Hearnet al., 2005b) was emitted radiatively. That fraction of the im-pact energy partitioned into radiation, rather than mechanicalenergy, is nearly an order of magnitude greater than what waspredicted as the maximum of the widely unconstrained valuesin the literature (Buratti and Johnson, 2003), and consistentwith the fact that Deep Impact’s camera was saturated by theflash.
The surface brightness profile (SBP) of a series of 10 co-added H-band images, taken 67 min after the impact is shown inFig. 7. For comparison, a stellar profile is shown in red, rescaledto the comet’s peak value, and the comet’s surface brightnessprofile prior to the impact is shown in gray. Near a distance of1.2 arcsec, the SBP shows a change in slope, steepening closerinward. This distance is over twice the half-width of the stellarPSF for the image, and is likely caused by the expansion ofthe dust ejecta impact plume out to these distances, placing anapproximate velocity for the dust at 197 ± 60 m/s.
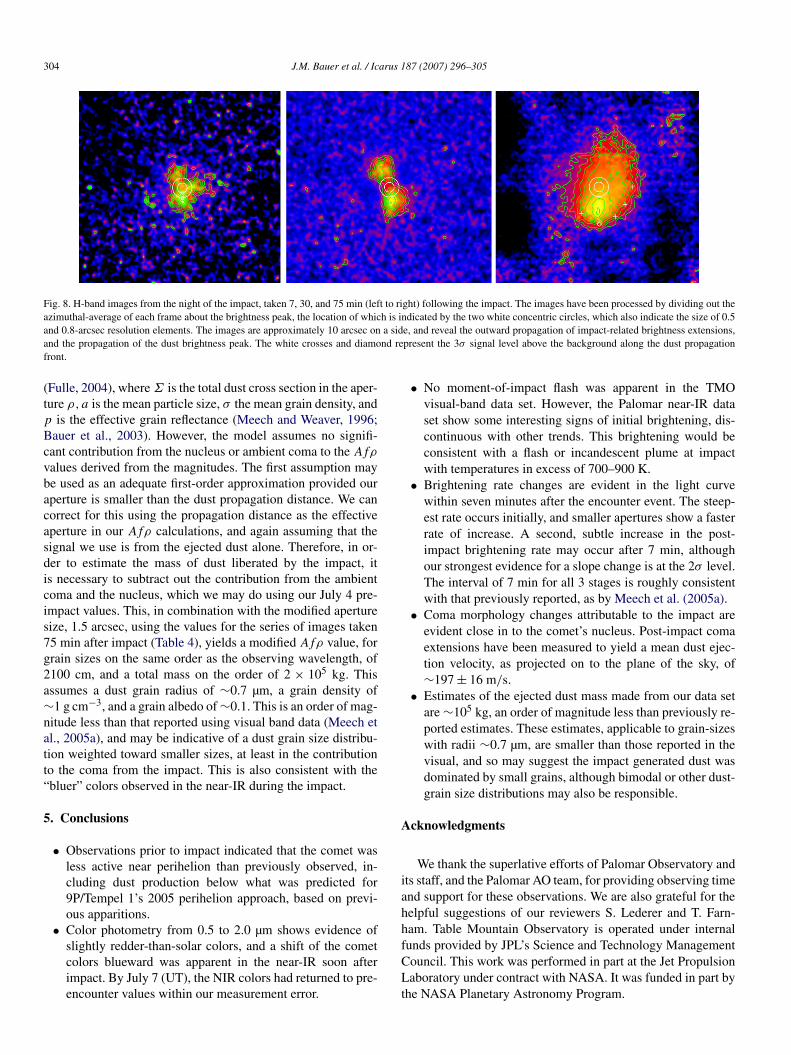
Another means of deriving this value is by further imageanalysis. Taking our last co-added H-band image for the night,we divided out the azimuthal average about the brightness peak(see Schleicher and Farnham, 2004). The remaining featuresof the dust coma seen in Fig. 8 appear to be the impact ejectafront moving outwards from the nucleus, especially when com-pared to similarly processed images taken sooner after impact.The crosses demarcate the 3σ signal level relative to the imagebackground. Using this as an upper-bound on the progress ofthe dust propagation gives a velocity for the dust of 212 m/s.The peak feature, located closer to the center, yields an averagevelocity of the associated dust of 181 m/s over the first 75 min.The mean of these two velocities is 197 ± 16 m/s, neglectingprojection effects.
Estimates of the dust production can also be derived fromour observations. Our near-IR data set is of particular valuein that it is more sensitive to larger grain sizes (in excess of∼0.7 µm; cf. Bohren and Huffman, 1998). We may use Af ρ asa proxy for the quantity of dust ejected (A’Hearn et al., 1984a),or we may derive the mass of the dust (Mdust) from the Afρ
value using the relation:
(1)Mdust = Σ(4/3πa3σ
)/(πa2)
and
(2)Σ ≈ Afρ(πρ/4p)
304 J.M. Bauer et al. / Icarus 187 (2007) 296–305
Fig. 8. H-band images from the night of the impact, taken 7, 30, and 75 min (left to right) following the impact. The images have been processed by dividing out theazimuthal-average of each frame about the brightness peak, the location of which is indicated by the two white concentric circles, which also indicate the size of 0.5and 0.8-arcsec resolution elements. The images are approximately 10 arcsec on a side, and reveal the outward propagation of impact-related brightness extensions,and the propagation of the dust brightness peak. The white crosses and diamond represent the 3σ signal level above the background along the dust propagationfront.
(Fulle, 2004), where Σ is the total dust cross section in the aper-ture ρ,a is the mean particle size, σ the mean grain density, andp is the effective grain reflectance (Meech and Weaver, 1996;Bauer et al., 2003). However, the model assumes no signifi-cant contribution from the nucleus or ambient coma to the Afρ
values derived from the magnitudes. The first assumption maybe used as an adequate first-order approximation provided ouraperture is smaller than the dust propagation distance. We cancorrect for this using the propagation distance as the effectiveaperture in our Afρ calculations, and again assuming that thesignal we use is from the ejected dust alone. Therefore, in or-der to estimate the mass of dust liberated by the impact, itis necessary to subtract out the contribution from the ambientcoma and the nucleus, which we may do using our July 4 pre-impact values. This, in combination with the modified aperturesize, 1.5 arcsec, using the values for the series of images taken75 min after impact (Table 4), yields a modified Afρ value, forgrain sizes on the same order as the observing wavelength, of2100 cm, and a total mass on the order of 2 × 10⁵ kg. Thisassumes a dust grain radius of ∼0.7 µm, a grain density of∼1 g cm−3, and a grain albedo of ∼0.1. This is an order of mag-nitude less than that reported using visual band data (Meech etal., 2005a), and may be indicative of a dust grain size distribu-tion weighted toward smaller sizes, at least in the contributionto the coma from the impact. This is also consistent with the“bluer” colors observed in the near-IR during the impact.
5. Conclusions
• Observations prior to impact indicated that the comet wasless active near perihelion than previously observed, in-cluding dust production below what was predicted for9P/Tempel 1’s 2005 perihelion approach, based on previ-ous apparitions.
• Color photometry from 0.5 to 2.0 µm shows evidence ofslightly redder-than-solar colors, and a shift of the cometcolors blueward was apparent in the near-IR soon afterimpact. By July 7 (UT), the NIR colors had returned to pre-encounter values within our measurement error.
• No moment-of-impact flash was apparent in the TMOvisual-band data set. However, the Palomar near-IR dataset show some interesting signs of initial brightening, dis-continuous with other trends. This brightening would beconsistent with a flash or incandescent plume at impactwith temperatures in excess of 700–900 K.
• Brightening rate changes are evident in the light curvewithin seven minutes after the encounter event. The steep-est rate occurs initially, and smaller apertures show a fasterrate of increase. A second, subtle increase in the post-impact brightening rate may occur after 7 min, althoughour strongest evidence for a slope change is at the 2σ level.The interval of 7 min for all 3 stages is roughly consistentwith that previously reported, as by Meech et al. (2005a).
• Coma morphology changes attributable to the impact areevident close in to the comet’s nucleus. Post-impact comaextensions have been measured to yield a mean dust ejec-tion velocity, as projected on to the plane of the sky, of∼197 ± 16 m/s.
• Estimates of the ejected dust mass made from our data setare ∼105 kg, an order of magnitude less than previously re-ported estimates. These estimates, applicable to grain-sizeswith radii ∼0.7 µm, are smaller than those reported in thevisual, and so may suggest the impact generated dust wasdominated by small grains, although bimodal or other dust-grain size distributions may also be responsible.
Acknowledgments
We thank the superlative efforts of Palomar Observatory andits staff, and the Palomar AO team, for providing observing timeand support for these observations. We are also grateful for thehelpful suggestions of our reviewers S. Lederer and T. Farn-ham. Table Mountain Observatory is operated under internalfunds provided by JPL’s Science and Technology ManagementCouncil. This work was performed in part at the Jet PropulsionLaboratory under contract with NASA. It was funded in part bythe NASA Planetary Astronomy Program.

A first look at Palomar AO observations of Deep Impact 305
References
A’Hearn, M.F., Schleicher, D.G., Millis, R.L., Feldman, P.D., Thompson, D.T.,1984a. Comet Bowell 1980b. Astron. J. 89, 579–591.
A’Hearn, M.F., Dwek, E., Tokunaga, A.T., 1984b. Infrared photometry ofComet Bowell and other comets. Astrophys. J. 282, 803–806.
A’Hearn, M.F., Dwek, E., Tokunaga, A.T., 1981. Where is the ice in comets.Astrophys. J. 248, L147–L151.
A’Hearn, M.F., and 32 colleagues, 2005a. Deep Impact: Excavating CometTempel 1. Science 310, 258–264.
A’Hearn, M.F., Belton, M.J.S., Delamere, A., Blume, W.H., 2005b. Deep Im-pact: A large-scale active experiment on a cometary nucleus. Space Sci.Rev. 117, 1–3.
Bauer, J.M., Fernández, Y.R., Meech, K.J., 2003. An optical survey of the activeCentaur C/NEAT (2001 T4). Publ. Astron. Soc. Pacific 115, 981–989.
Bauer, J.M., Buratti, B.J., Simonelli, D.P., Owen, W.M., 2004. Recovering therotational light curve of Phoebe. Astrophys. J. 610, L57–L60.
Belton, M.J.S., and 15 colleagues, 2005. Deep Impact: Working properties forthe target nucleus Comet 9P/Tempel 1. Space Sci. Rev. 117, 137–160.
Bohren, C.F., Huffman, D.R., 1998. Absorption and Scattering of Light bySmall Particles. Wiley, New York.
Buratti, B.J., Johnson, L.L., 2003. Identification of the lunar flash of 1953 witha fresh crater on the Moon’s surface. Icarus 161, 192–197.
Campins, H., Rieke, G.H., Lebofsky, M.J., 1982. Infrared photometry of peri-odic Comets Encke, Chernykh, Kearns–Kwee, Stephan–Oterma, and Tuttle.Icarus 51, 461–465.
Drilling, J.S., Landolt, A.U., 2000. Normal stars. In: Cox, A.N. (Ed.), Allen’sAstrophysical Quantities. Springer-Verlag, New York, pp. 339–375.
Dones, L., Weissman, P.R., Levison, H.F., Duncan, M.J., 2004. Oort cloud for-mation and dynamics. In: Festou, M.C., Keller, H.U., Weaver, H. (Eds.),Comets II. Univ. of Arizona Press, Tucson, pp. 153–174.
Fulle, M., 2004. Motion of cometary dust. In: Festou, M.C., Keller, H.U.,Weaver, H. (Eds.), Comets II. Univ. of Arizona Press, Tucson, pp. 565–575.
Hayward, T.L., Brandl, B., Pirger, B., Blacken, C., Gull, G.E., Schoenwald,J., Houck, J.R., 2001. PHARO: A near-infrared camera for the PalomarAdaptive Optics system. Publ. Astron. Soc. Pacific 113, 105–118.
Hampton, P., Veran, J., Bradley, C., Hilton, A., Agathoklis, P., 2003. Adaptiveoptics control system development. In: Tyson, R.K., Lloyd-Hart, M. (Eds.),Astronomical Adaptive Optics Systems and Applications. In: Proc. SPIE,vol. 5169. SPIE, Bellingham, WA, pp. 321–330.
Hanner, M.S., Tokunaga, A.T., Veeder, G.J., Ahearn, M.F., 1984. Infrared pho-tometry of the dust in comets. Astron. J. 89, 162–169.
Jewitt, D.C., 2002. From Kuiper Belt object to cometary nucleus: The missingultrared matter. Astron. J. 123, 1039–1049.
Jewitt, D.C., 2004. From cradle to grave: The rise and demise of the comets. In:Festou, M.C., Keller, H.U., Weaver, H. (Eds.), Comets II. Univ. of ArizonaPress, Tucson, pp. 659–676.
Küppers, M., and 40 colleagues, 2005. A large dust/ice ratio in the nucleus ofComet 9P/Tempel 1. Nature 437, 987–990.
Landolt, A.U., 1992. UBVRI photometric standard stars in the magnitude range11.5–16.0 around the celestial equator. Astron. J. 104, 340–371.
Levison, H.F., Morbidelli, A., 2003. The formation of the Kuiper Belt by the
outward transport of bodies during Neptune’s migration. Nature 426, 419–421.
Lisse, C.M., and 17 colleagues, 2005. Spitzer and Chandra observations ofthe Deep Impact encounter with Comet 9P/Tempel 1. Bull. Am. Astron.Soc. 37. 1484.
Meech, K.J., Svøren, J., 2004. Using cometary activity to trace the physicaland chemical evolution of cometary nuclei. In: Festou, M.C., Keller, H.U.,Weaver, H. (Eds.), Comets II. Univ. of Arizona Press, Tucson, pp. 317–335.
Meech, K.J., Weaver, H.A., 1996. Unusual comets (?) as observed from theHubble Space Telescope. Earth Moon Planets 72, 119–132.
Meech, K.J., and 208 colleagues, 2005a. Deep Impact: Observations from aworldwide Earth-based campaign. Science 310, 265–269.
Meech, K.J., A’Hearn, M.F., Fernández, Y.R., Lisse, C.M., Weaver, H.A.,Biver, N., Woodney, L.M., 2005b. The Deep Impact Earth-based campaign.Space Sci. Rev. 117, 297–334.
Morbidelli, A., Brown, M.E., 2004. The Kuiper Belt and primordial evolu-tion of the Solar System. In: Festou, M.C., Keller, H.U., Weaver, H. (Eds.),Comets II. Univ. of Arizona Press, Tucson, pp. 175–192.
Mori, Y., Sekiguchi, T., Sugita, S., Matsunaga, N., Fukushi, H., Kaneyasu, N.,Kawadu, T., Kandori, R., Nakajima, Y., Tamura, M., 2006. Near-IR mon-itoring observation of Comet 9P/Tempel 1. Lunar Planet. Sci. 37. Abstract2458.
Moroz, L., Baratta, G., Strazzulla, G., Starukhina, L., Dotto, E., Barucci, M.A.,Arnold, G., Distefano, E., 2004. Optical alteration of complex organics in-duced by ion irradiation. 1. Laboratory experiments suggest unusual spaceweathering trend. Icarus 170, 214–228.
Persson, S.E., Murohy, D.C., Krzeminsky, W., Roth, M., Rieke, M.J., 1998.A new system of faint near-infrared standard stars. Astron. J. 116,2475–2488.
Schleicher, D.G., Farnham, T., 2004. Photometry and imaging of the comawith narrowband filters. In: Festou, M.C., Keller, H.U., Weaver, H. (Eds.),Comets II. Univ. of Arizona Press, Tucson, pp. 449–469.
Schleicher, D.G., Barnes, K.L., Baugh, N.F., 2006. Photometry and imagingresults for Comet 9P/Tempel 1 and Deep Impact: Gas production rates,postimpact light curves, and ejecta plume morphology. Astron. J. 131,1130–1137.
Sunshine, J.M., and 22 colleagues, 2006. Exposed water ice deposits on thesurface of Comet 9P/Tempel 1. Science 311, 1453–1455.
Tholen, D.J., Tedesco, E.F., Larson, S.M., 1981. Broad-band spectrophotome-try of cemetary comae. Bull. Am. Astron. Soc. 13, 707.
Tokunaga, A.T., 2000. Infrared astronomy. In: Cox, A.N. (Ed.), Allen’sAstrophysical Quantities. Springer-Verlag, New York, pp. 143–164.
Tody, D., 1986. The IRAF data reduction and analysis system. In: Instrumenta-tion in Astronomy VI. Part 2. In: Proc. SPIE. SPIE, Bellingham, WA, p. 733.
Troy, M., Dekany, R.G., Brack, G., Oppenheimer, B.R., Bloemhof, E.E., Trinh,T., Dekens, F.G., Shi, F., Hayward, T.L., Brandl, B., 2000. Palomar adap-tive optics project: Status and performance. In: Wizinowich, P.L. (Ed.),Adaptive Optical Systems Technology. In: Proc. SPIE, vol. 4007. SPIE,Bellingham, WA, pp. 31–40.
Veeder, G.J., Hanner, M.S., 1981. Infrared photometry of Comets Bowell andP/Stephan–Oterma. Icarus 47, 381–387.