pam4 analysis software user manual - tektronix€¦ · pam4 analysis software user manual...
TRANSCRIPT

PAM4 AnalysisSoftwareUser Manual
*P077120707*077-1207-07


PAM4 AnalysisSoftwareUser Manual
www.tek.com077-1207-07
Supports PAM4 Analysis software V10.6.0 and above

Copyright © Tektronix. All rights reserved. Licensed software products are owned by Tektronix or its subsidiariesor suppliers, and are protected by national copyright laws and international treaty provisions. Tektronix productsare covered by U.S. and foreign patents, issued and pending. Information in this publication supersedes that in allpreviously published material. Specifications and price change privileges reserved.
TEKTRONIX and TEK are registered trademarks of Tektronix, Inc.Contacting TektronixTektronix, Inc.14150 SW Karl Braun DriveP.O. Box 500Beaverton, OR 97077USA
For product information, sales, service, and technical support:
■ In North America, call 1-800-833-9200.
■ Worldwide, visit www.tek.com to find contacts in your area.

Table of ContentsWelcome .............................................................................................................................................. v
Getting startedGetting started with PAM4 Analysis software ............................................................................... 1Starting-Closing the application ..................................................................................................... 2
Using the softwareMain controls .................................................................................................................................. 5
Config: Save .............................................................................................................................. 5Config: Recall ............................................................................................................................ 5Config: Default .......................................................................................................................... 5Clear .......................................................................................................................................... 5Recalc ........................................................................................................................................ 5Single ......................................................................................................................................... 6Run ............................................................................................................................................ 6Stop ............................................................................................................................................ 6Show Plots ................................................................................................................................. 6Status Bar .................................................................................................................................. 6Help ........................................................................................................................................... 6Version ...................................................................................................................................... 7
Tabs ................................................................................................................................................ 7Setup .......................................................................................................................................... 7Select ......................................................................................................................................... 7Full waveform ........................................................................................................................... 7Averaged waveform .................................................................................................................. 7Rise fall ...................................................................................................................................... 7Reports ....................................................................................................................................... 8Log ............................................................................................................................................. 8Prefs ........................................................................................................................................... 8
Setting up analysis parameters ....................................................................................................... 8Processing flow ......................................................................................................................... 9Main setup ............................................................................................................................... 10Clock recovery ........................................................................................................................ 11Threshold setup ....................................................................................................................... 11Waveform filter ....................................................................................................................... 11Bessel-Thomson filter ............................................................................................................. 12
PAM4 Analysis i
CTLE, FFE and DFE .............................................................................................................. 13Selecting and configuring measurements ..................................................................................... 16
Noise analysis .......................................................................................................................... 17BER targets for jitter analysis ................................................................................................. 18Measurement of SNDR (Signal to Noise and Distortion Ratio) ............................................. 19
Running an analysis ...................................................................................................................... 21Viewing the results ....................................................................................................................... 22
Full waveform ......................................................................................................................... 22Correlated waveform ............................................................................................................... 23Rise and fall times ................................................................................................................... 23
PAM4 Plots window ..................................................................................................................... 25Accumulated eye plot annotations .......................................................................................... 26
Error Navigator window ............................................................................................................... 27OIF-CEI jitter measurements: UUGJ, UBHPJ and Even-Odd Jitter ........................................... 30IEEE electrical measurements: Jrms, J4u, J3u, Even-Odd Jitter, Rise/Fall Time and SNRISI . . . 31Optical measurements ................................................................................................................... 32IEEE optical measurements .......................................................................................................... 32Saving results in a report .............................................................................................................. 35Using the event log ....................................................................................................................... 39Preferences .................................................................................................................................... 41
Population control ................................................................................................................... 42Halt on closed center eye ......................................................................................................... 42Error Navigator ........................................................................................................................ 42Measurement logging .............................................................................................................. 43Display units ............................................................................................................................ 44Scope noise compensation ....................................................................................................... 44
Scope noise characterization ........................................................................................................ 44Measuring scope noise for electrical signals ........................................................................... 45Measuring scope noise for optical signals ............................................................................... 49
MeasurementsGeneral full waveform measurements .......................................................................................... 53Measurements per level in the PAM4 eye .................................................................................... 58Measurements per eye opening (upper, middle, lower) in the PAM4 eye ................................... 58Measurements for the correlated waveform ................................................................................ 59Measurements per level in the correlated PAM4 eye ................................................................... 61Measurements for rise times and fall times .................................................................................. 61
Table of Contents
ii PAM4 Analysis
GPIB command referenceHandshaking protocol ................................................................................................................... 63Best practice when programming using GPIB commands ........................................................... 64GPIB commands ........................................................................................................................... 64Sample GPIB script (Python 3.5) ................................................................................................. 93
Glossary
Table of Contents
PAM4 Analysis iii

Table of Contents
iv PAM4 Analysis
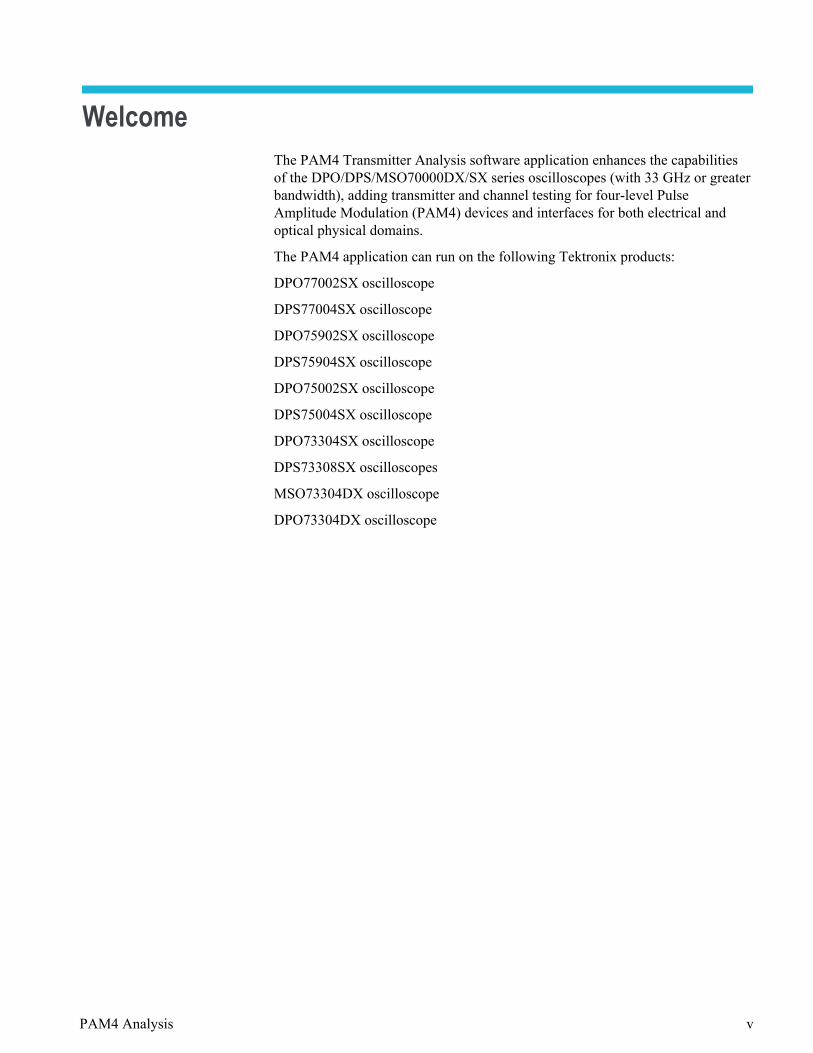
WelcomeThe PAM4 Transmitter Analysis software application enhances the capabilitiesof the DPO/DPS/MSO70000DX/SX series oscilloscopes (with 33 GHz or greaterbandwidth), adding transmitter and channel testing for four-level PulseAmplitude Modulation (PAM4) devices and interfaces for both electrical andoptical physical domains.
The PAM4 application can run on the following Tektronix products:
DPO77002SX oscilloscope
DPS77004SX oscilloscope
DPO75902SX oscilloscope
DPS75904SX oscilloscope
DPO75002SX oscilloscope
DPS75004SX oscilloscope
DPO73304SX oscilloscope
DPS73308SX oscilloscopes
MSO73304DX oscilloscope
DPO73304DX oscilloscope
PAM4 Analysis v

Welcome
vi PAM4 Analysis

Getting started
Getting started with PAM4 Analysis softwareThe PAM4 Analysis software application runs on the Tektronix performanceoscilloscopes listed in the Preface. The application enables transmitter andchannel testing for four-level Pulse Amplitude Modulation (PAM4) devices andinterfaces, for both electrical and optical physical domains.
Optical testing is typically performed using the Tektronix DPO7OE1 orDPO7OE2 optical probe, although 3rd-party O/E converters may also be used.The electrical and optical capabilities are separately licensed, so some featuresdescribed in this manual may be disabled depending on which licenses you haveavailable. Trial licenses are separately available for the electrical and opticalfeatures.
Using filter files produced by the Serial Data Link Analysis (SDLA) application,the PAM4 Analysis application allows you to de-embed probes or fixtures andembed a channel model. If your oscilloscope is equipped with the SDLAapplication, PAM4 Analysis also allows you to apply several types ofequalization from directly within the PAM4 application.
After any waveform processing is complete, PAM4 Analysis uses the DPOJETapplication and additional resources to perform voltage and timing measurementsand render eye diagrams on the target waveform. If the waveform contains arepeating pattern, the application additionally calculates the CorrelatedWaveform (which removes uncorrelated behavior such as random and periodicjitter/noise) and provides additional measurements on this waveform.
PAM4 Analysis 1

The key features of the PAM4 application are:
■ Channel embedding and fixture de-embedding by way of .flt files
■ Equalization (CTLE, FFE, and DFE, either individually or together)
■ Configurable clock recovery
■ Jitter measurements per eye for repeating patterns
■ Eye diagrams for performance visualization
■ BER eye contours for each eye along with IEEE and OIF-CEI-compliant eyemeasurements such as EW and EH
■ IEEE and OIF-CEI-compliant jitter measurements such as J4u, Jrms, UUGJ,UBHPJ and even-odd jitter
■ Symbol error detection and navigation plus SER and BER measurements
■ Transmitter characterization measurements: such as Signal to Noise andDistortion Ratio (SNDR) and TDECQ measurements
■ Correlated waveform computation
■ HTML-style report generation for presentation, sharing or archiving
■ Programmable interface for test automation
■ Automatic or manual voltage reference thresholds
■ Measurement logging to .csv files
Starting-Closing the applicationAfter you install the PAM4 software on your oscilloscope, start your oscilloscopeapplication and wait for it to initialize. To launch the PAM4 application, selectAnalyze > PAM4 Analysis from the oscilloscope menu, as shown in thefollowing figure.
The first time that the application is started after installation, it may take up totwo minutes to appear. This is normal, and is due to one-time initialization.
Getting started
2 PAM4 Analysis

To close the PAM4 application, click the red square in the upper right corner ofthe application window and then click "Yes" in the verification dialog.
Getting started
PAM4 Analysis 3

Getting started
4 PAM4 Analysis

Using the softwareThis section describes the basic operation of the PAM4 Analysis application.
Main controlsThe following controls are on the main application panel and are accessibleregardless of which tab is currently selected.
Config: Save Select this button to display a dialog that allows you to save the current PAM4Analysis configuration in a proprietary binary file with the .psf extension.
Config: Recall Select this button to recall a saved configuration file.
Config: Default Select this button to restore all configuration settings to the values present whenthe application is first launched.
Clear Selecting this button clears all accumulated measurement results. The results arealso cleared when you change any configuration parameter.
Recalc Selecting this button causes the application to perform a processing cycle on thewaveform already present in scope memory. This allows you to changeconfiguration parameters such as clock recovery or threshold and then re-run theanalysis on the same waveform. For reference waveforms, Single and Recalcbehave the same way.
Some measurements cannot produce a result until multiple waveforms have beenprocessed, due to the sample size requirements of the measurement. Since Recalccan only re-analyze the waveform already in the oscilloscope memory, it cannotbe used to re-compute these population-intensive measurements.
PAM4 Analysis 5
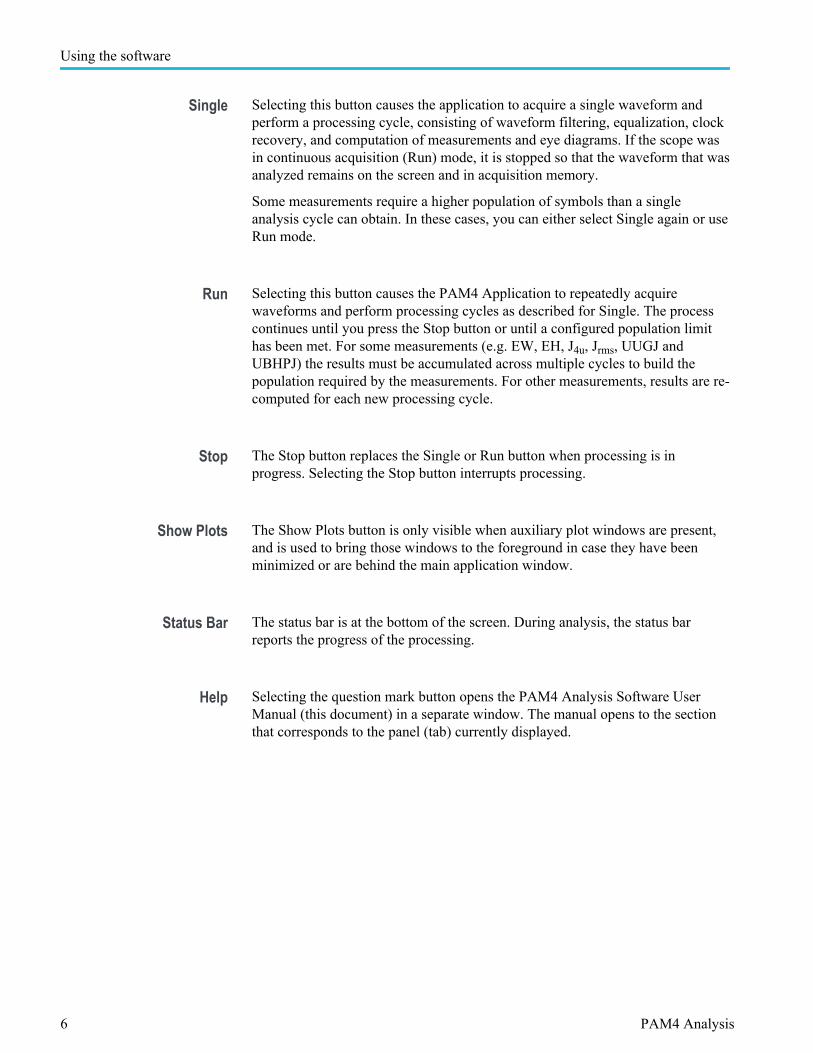
Single Selecting this button causes the application to acquire a single waveform andperform a processing cycle, consisting of waveform filtering, equalization, clockrecovery, and computation of measurements and eye diagrams. If the scope wasin continuous acquisition (Run) mode, it is stopped so that the waveform that wasanalyzed remains on the screen and in acquisition memory.
Some measurements require a higher population of symbols than a singleanalysis cycle can obtain. In these cases, you can either select Single again or useRun mode.
Run Selecting this button causes the PAM4 Application to repeatedly acquirewaveforms and perform processing cycles as described for Single. The processcontinues until you press the Stop button or until a configured population limithas been met. For some measurements (e.g. EW, EH, J4u, Jrms, UUGJ andUBHPJ) the results must be accumulated across multiple cycles to build thepopulation required by the measurements. For other measurements, results are re-computed for each new processing cycle.
Stop The Stop button replaces the Single or Run button when processing is inprogress. Selecting the Stop button interrupts processing.
Show Plots The Show Plots button is only visible when auxiliary plot windows are present,and is used to bring those windows to the foreground in case they have beenminimized or are behind the main application window.
Status Bar The status bar is at the bottom of the screen. During analysis, the status barreports the progress of the processing.
Help Selecting the question mark button opens the PAM4 Analysis Software UserManual (this document) in a separate window. The manual opens to the sectionthat corresponds to the panel (tab) currently displayed.
Using the software
6 PAM4 Analysis
Version Click the Tektronix logo in the status bar to display the software version of theapplication.
This is the same information that appears briefly when the application launches.
The version also appears in any HTML-style reports that are generated.
Tabs
Setup Selecting the Setup tab opens the Setup screen, which allows you to set up themost commonly used analysis parameters, including which type of equalizer touse. See Setting up analysis parameters on page 8.
Select Clicking the Select tab opens a screen where you can choose the measurementcategory (Electrical vs. Optical) and select specific measurements. It also allowsyou to configure the measurements.
See Selecting and configuring measurements on page 16.
Full waveform Selecting the Full Wfm tab opens the Results for Full Waveform screen. Thisscreen displays the measurement results for the full waveform. See Viewing theresults on page 22.
Averaged waveform Selecting the Avg. Wfm tab opens the Results for Correlated Waveform screen.This screen displays the measurement results for the correlated waveform. See Viewing the results on page 22.
Rise fall Selecting the Rise/Fall tab opens the Rise Times and Fall Times screen. Themaximum, minimum, and mean rise and fall times are displayed for alltransitions in the correlated waveform, along with the number of times eachtransition type occurs. See Viewing the results on page 22.
Using the software
PAM4 Analysis 7
Reports Selecting the Reports tab opens the Reports screen. This screen allows you toselect a file name and save the analysis report.
Log Selecting the Log tab provides a view of the activity log, which showsinformation such as when the analysis started and stopped, how many UI havebeen accumulated, and when data was saved. The log also captures warnings,error messages and other auxiliary information. See Using the event log onpage 39.
Prefs Selecting the Prefs tab allows you to adjust user preferences and someinfrequently-used configuration items. See Preferences on page 41.
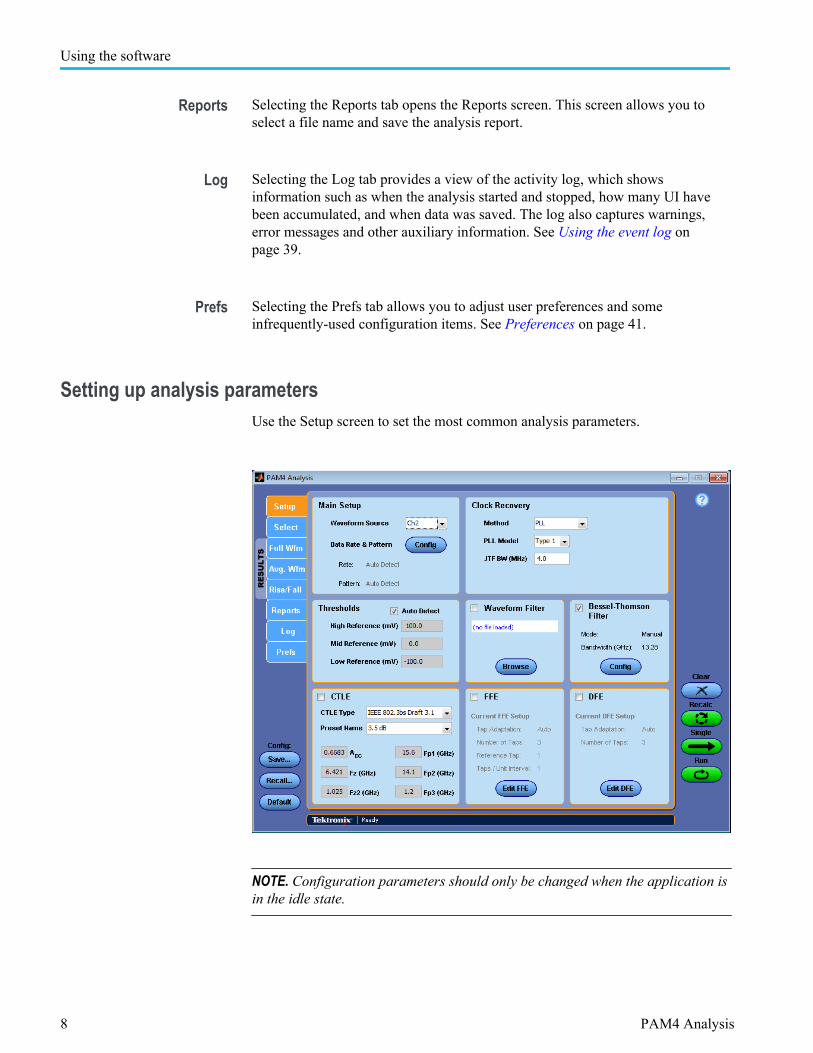
Setting up analysis parametersUse the Setup screen to set the most common analysis parameters.
NOTE. Configuration parameters should only be changed when the application isin the idle state.
Using the software
8 PAM4 Analysis

Processing flow In broad terms, the individual boxes on the Setup Panel represent processingblocks through which a chosen input signal flows prior to being measured. Thatprocessing flow can be better understood by reference to the following figure:
The blue blocks in the flow diagram correspond to the blue boxes on the Setuppanel, and all except the Clock Recovery block may be enabled or disabled.When you first launch the application, all the processing blocks are disabled sothat the input signal, after clock recovery, goes directly to the measurements andplots.
The green blocks in the flow diagram correspond to measurements. Like theprocessing blocks, most of them can be enabled or disabled. The plots,represented by purple blocks, cannot be individually enabled but are tied to themeasurements. (Some special-purpose plots are not shown in the diagram.)
NOTE. The Correlated Eye and associated measurements, as well as the SNDRmeasurements, are always done prior to the FFE and DFE equalizers. For thisreason, the Accumulated and Correlated eye diagrams may have a different scaleor visual character when FFE or DFE equalization is enabled. Similarly, theTDECQ measurement includes its own FFE, so the TDECQ eye may have adifferent visual appearance.
Using the software
PAM4 Analysis 9
Main setup Choose the PAM4 waveform source that you wish to analyze. The availablesources are Ch1 - Ch4, Math1 and Ref1. Some or all of the remaining Math andRef sources may be used by the PAM4 application (depending on which featuresand options are being used), and may be overwritten by the PAM4 applicationwithout warning.
There are two modes for controlling data rate and pattern, Auto Detect and User-guided. In the default Auto Detect mode, the PAM4 application willautomatically detect the data rate during analysis, in most cases. The detected ratealways appears in the measurement results on the Full Wfm panel but it alsoappears in the Main Setup panel when Auto Detect is enabled, after clockrecovery has finished.
In the User-guided mode, you enter an approximate data to guide the detectionprocess in either giga-symbols per second (GBaud) or GBits per second.Remember that since PAM4 signaling carries 2 bits per symbol, the symbol rateor baud rate is one half of the bit rate. For example, a bit rate of 51.2 Gbpscorresponds to a symbol rate of 25.6 GBaud.
User-guided mode is particularly useful when the input waveform lacks cuesabout its true rate. For example, the PAM4 Linearity pattern consists of16 consecutive repeats of each of 10 symbols. If it is running at 25 GBd, thewaveform only has transitions every 640 ps even though one unit interval is40 ps. This makes the signal appear to be a 10-symbol pattern at a symbol rate of25 GBd/16, or 1.5625 GBd. Using User-guided mode and entering a symbol rateof 25 GBd will cause it to be correctly interpreted as a 160-symbol pattern. If theentered rate is within about 5% of the actual rate, the clock will be recovered andthe actual rate will be displayed on the Full Wfm panel.
Like the symbol rate, the data pattern can either be auto-detected (default) oruser-directed. When it is user-directed the known symbol stream is imported bymeans of an ASCII text file. The file may contain symbols from any set of fournumerical values that are equally spaced. Some common examples of symbol setsare:■ {0, 1, 2, 3}■ {1, 2, 3, 4}■ {-1, -0.33, +0.33, +1}If only two numerical values are represented in the text file, they will taken tomatch the two outer PAM4 symbols. A PRBS13Q text file is installed by defaultand you can use this as a model to create other pattern files as needed.
If user-guided symbol rate is used, the application will still perform automaticsymbol detection. It will then auto-correlate the recovered symbols with thespecified ones to determine the most likely pattern phase (timing offset). Duringthis process it will also check whether the algebraic inverse of the given patternprovides a better fit to the waveform.
In addition to importing a pattern to control analysis, you can export theautomatically-detected pattern as an ASCII text file. This is not possible in thegraphical user interface, but you can export the pattern using the programmableinterface ("GPIB"). See the exportpattern command in the GPIB CommandReference portion of this manual.
Using the software
10 PAM4 Analysis
You can also export an ASCII file that shows all deviations from the expectedpattern (whether that pattern was auto-detected or user-provided). See theexporterrors command in the GPIB Command Reference portion of this manualfor more details.
Clock recovery Clock recovery is performed using a noise-tolerant software model of a phaselocked loop (PLL). You can choose a Type 1 or Type 2 loop (which in mostcontexts are equivalent to 1st and 2nd order loops, respectively). You can enter thebandwidth in Megahertz, and for Type 2 loops, the loop damping.
The bandwidth entered is the Jitter Transfer Function (JTF) bandwidth, which isthe bandwidth of the high-pass filter function defining which jitter is NOTtracked by the clock recovery. For Type 1 loops, the JTF bandwidth is the sameas the loop bandwidth. For Type 2 loops, the JTF and loop bandwidth are slightlydifferent (by a factor that depends on the damping factor). For most standards, itis the JTF bandwidth that is specified.
If you have enabled one or both equalizers, the clock recovery is applied after theCTLE and jointly with the FFE/DFE processing.
Threshold setup The three thresholds nominally correspond to the centers, in the verticaldimension, of the three eyes in the PAM4 eye diagram. By default (Auto Detect),appropriate thresholds are picked based on analysis of symbol levels in the sourcewaveform, and displayed both on the Config tab and on the Full Wfm resultsscreen. To designate specific thresholds, unselect the Auto Detect checkbox anddirectly enter the desired thresholds using units of millivolts (electrical) ormicrowatts (optical).
Waveform filter The Waveform Filter feature allows you to modify the source waveform byapplying a FIR filter, using the oscilloscope Math system. Click the WaveformFilter checkbox to enable the feature and use the Browse button to select thedesired filter file, which will have a .flt extension. See your oscilloscopedocumentation for more information on filter files.
One common use for waveform filters is to de-embed a probe or fixture, or toembed a reference channel. The SDLA application can be used to create orcombine filters that can be applied using this feature.
Using the software
PAM4 Analysis 11

Bessel-Thomson filter When the Bessel-Thomson filter checkbox is enabled, a Bessel-Thomson filter isapplied to the source waveform after any waveform filter and prior to CTLE.This filter is required for a number of compliance measurements.
NOTE. Be careful not to apply the BT filter twice. For example, when using anoptical probe, the probe often includes an Optical Reference Receiver (ORR),which has a Bessel-Thomson response. Be sure to disable the ORR in the probe.When working with Tektronix optical probes (e.g. DPO7OE1), the PAM4application automatically sets the probe response to "Flat to maximumbandwidth" if the BT filter is enabled and the measurement category is set to"Optical".
The filter's selection mode and -3 dB bandwidth are displayed in the filter's setuppanel when the filter configuration menu is closed. To adjust these parameters,press the Config button under the bandwidth to open the Bessel-Thomson Filterconfiguration window.
In Auto Bandwidth mode, the PAM4 application automatically sets the filter's-3 dB bandwidth to 0.5 of the actual symbol rate. In Manual Bandwidth mode,you can specify the precise -3 dB bandwidth.
For every processing cycle during which the Bessel-Thomson filter is enabled,the PAM4 application automatically exports the created filter in the format ofa .flt file ("BesselThomson.flt") to C:\Users\<username>\Tektronix\TekApplications\PAM4\Filters. One common use for this feature is to apply thefilter file in scope MATH or other analysis packages to emulate the Bessel-Thomson filter.
Using the software
12 PAM4 Analysis

CTLE, FFE and DFE Depending on the characteristics of the transmitter and signal channel, the PAM4eye might be closed at the channel output. An equalizer can be used to open theeye back up. By checking the associated boxes in the Setup screen, one canmodel one or multiple of the following types of equalizers:
■ Continuous-time linear equalizer (CTLE)
■ Feed-forward equalizer (FFE)
■ Decision-feedback equalizer (DFE)
Set the equalizer parameters as desired for modeling the effects of the equalizeron your signal. Change the parameters and run the analysis again to see theeffects of various settings.
The CTLE model offers two types of operation. The first is Custom design, inwhich you can directly control individual poles and zeros. You can choosebetween a design with one zero and two poles (typical of first-generationstandards) or a design with two zeros and three poles. Once the design is chosen,you can directly adjust each available parameter.
The other type of CTLE is one based on selectable aggregations of parameters,called Presets, which are usually specified by the standards bodies, and usuallyidentified by the amount of de-emphasis such as '1 dB' or '3.5 dB'. For a givenpreset, you cannot change individual CTLE parameters but you can view the poleand zero frequencies that are in effect. First use the CTLE Type control to choosea collection of presets, and then use the Preset Name control to select a specificpreset. The collections available at this time are:
■ OIF-CEI Gen I: 2-pole/1-zero design per oif2014.230.06.pdf (Feb 2015)
■ OIF-CEI Gen II: 3-pole/2-zero design per oif2014.230.10.pdf (Feb 2017)
■ IEEE 802.3bs Draft 3.3: 3-pole/2-zero design with 17 presets (Jul 2017)
■ IEEE 802.3bs Draft 3.5 (final): 3-pole/2-zero design with 17 presets (Oct2017)
Don't forget to enable the checkbox at the top of the CTLE block; otherwise theCTLE model will not take effect. Similar to Bessel-Thomson filter, for everyprocessing cycle during which the CTLE is enabled, the PAM4 applicationautomatically exports the created filter. The filter is exported in the format ofa .flt file ("CTLE.flt") to C:\Users\<username>\Tektronix\TekApplications\PAM4\Filters.
NOTE. Although the CTLE poles are designated using numerical suffixes (e.g.Fp1 and Fp2), the order is not important (and is not consistent across the variousstandards that use them). The equalizer operates exactly the same way regardlessof the order in which the pole frequencies appear. Likewise, a CTLE with twozeros will behave exactly the same way independent of the order in which the twozero frequencies appear.
As with CTLE, FFE and DFE can be individually enabled or disabled by usingtheir respective checkboxes.
Using the software
PAM4 Analysis 13
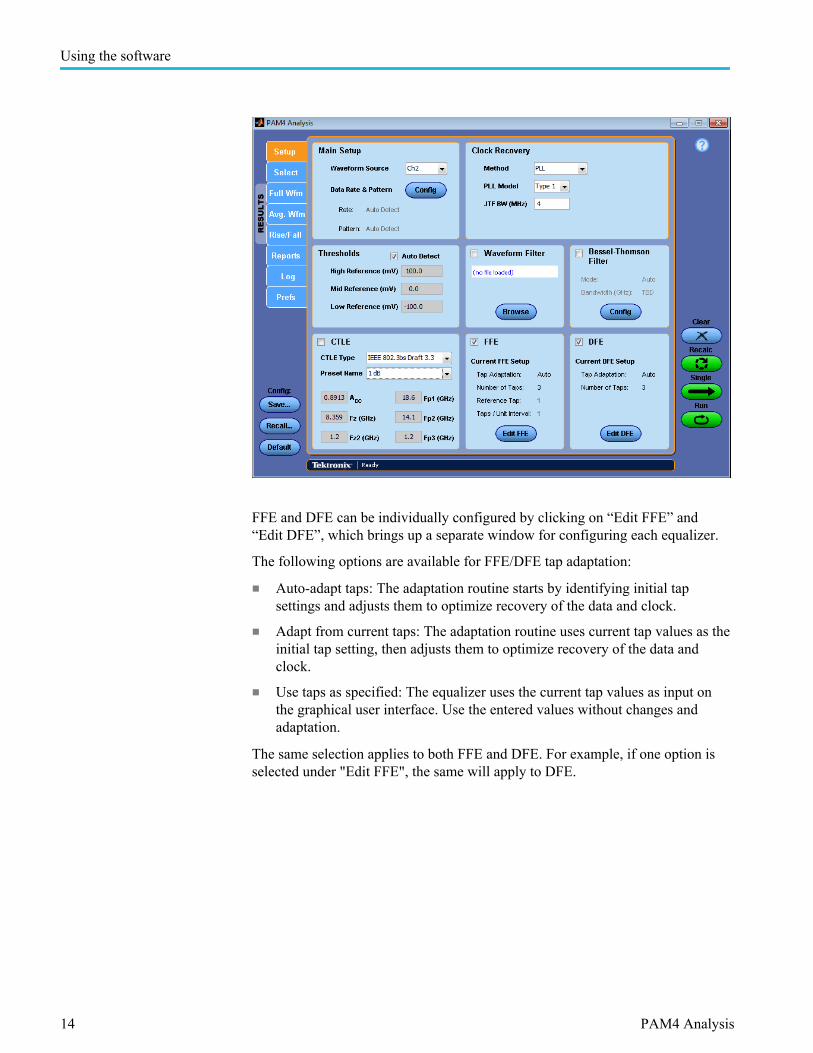
FFE and DFE can be individually configured by clicking on “Edit FFE” and“Edit DFE”, which brings up a separate window for configuring each equalizer.
The following options are available for FFE/DFE tap adaptation:
■ Auto-adapt taps: The adaptation routine starts by identifying initial tapsettings and adjusts them to optimize recovery of the data and clock.
■ Adapt from current taps: The adaptation routine uses current tap values as theinitial tap setting, then adjusts them to optimize recovery of the data andclock.
■ Use taps as specified: The equalizer uses the current tap values as input onthe graphical user interface. Use the entered values without changes andadaptation.
The same selection applies to both FFE and DFE. For example, if one option isselected under "Edit FFE", the same will apply to DFE.
Using the software
14 PAM4 Analysis

Using the software
PAM4 Analysis 15

Parameter name Parameter value limitFFE Number of taps [0, 25]
Reference tap position 1. Cannot exceed number oftaps
2. (Ref tap - 1) /Taps per UImust be an integer
Number of taps per UI 1. [1, 10]
2. Cannot exceed number oftaps
DFE Number of taps [0, 10]
Selecting and configuring measurementsThe Select screen allows you to:
■ Choose either the Electrical or Optical domain
■ Select which specific measurements to perform
■ Configure any necessary measurement options
The Measurement Category radio buttons let you choose whether to performelectrical or optical measurements. These categories are separately licensed, soyou may find that one category has been pre-selected.
Using the software
16 PAM4 Analysis
Below the radio buttons, a hierarchical selection tree allows you to choosemeasurements either individually or by groups. Selecting only the measurementsyou need can speed processing, and can also reduce clutter in the results screensand reports that you save.
To select an individual measurement, click the checkbox to the left of themeasurement name. To select an entire group, click the corresponding group'sbox. If the group already contains a mix of selected and unselectedmeasurements, a first click will de-select all, and the second will select all.
When you select or de-select a measurement or click directly on the measurementname, a new panel will appear to the right of the selection tree showing anyconfiguration parameters for the highlighted measurement. If that measurementhas no specific parameters, the right side of the screen will be blank. In manycases a configuration panel will be applicable to an entire group, in which case itonly needs to be set for one measurement and will apply across the group.
For descriptions of the individual measurements, see Measurements onpage 53. For descriptions of configuration panels that apply to specificmeasurement groups, see Noise analysis on page 17, BER targets for jitteranalysis on page 18, and Measurement of SNDR (Signal to Noise andDistortion Ratio) on page 19.
Noise analysis Several PAM4 standards employ eye analysis that monitors both horizontal andvertical eye closure on a prescribed population of symbols. Since PAM4interfaces typically have low noise margin and use coding (such as Forward ErrorCorrection or FEC) to attain higher reliability, the performance goal for thephysical layer bit error rate (BER) is usually 1e-5 to 1e-6. The applicablestandards rely on direct acquisition of sufficient population for directmeasurement rather than extrapolating eye closure from a smaller population.Example measurements based on this technique are EW6, EH6 and VEC, and thestandards also define intermediate values (Hupp, Vupp, Hmid, Vmid, Hlow,Vlow) that are used to calculate the prescribed measurements. An analyticalbenefit of this approach is that BER eye contours are available that can giveinsight into eye closure at all timing phases and reference levels simultaneously.
Enable Noise Analysis : This checkbox turns the noise analysis feature on(default) or off. The measurement system behaves slightly differently dependingon whether the feature is on, as defined here:■ Noise Analysis Off: All eye diagrams are rendered by the DPOJET
application and automatically imported into the PAM4 Analysis application.On the Full Wfm results panel, the last two columns in the eye measurementtable display Eye Width and Eye Height. The EW6, EH6 and VECmeasurements are displayed as N/A.
■ Noise Analysis On: A second plot window, titled PAM4 Plots, is created asanalysis proceeds, and is used to accumulate annotated eye diagrams thatshow the noise measurement locations. In this mode, the eye diagrams arerendered directly by the PAM4 application rather than being imported fromDPOJET. On the Full Wfm results panel, the last two columns in the eyemeasurement table change to H_eye and V_eye. The EW6, EH6 and VEC
Using the software
PAM4 Analysis 17

measurements as well as the H_eye and V_eye measurements are only shownif an adequate symbol population has been accumulated; otherwise a footnoteto the tables indicates that more population is needed. The table below showshow the H_eye and V_eye results shown in the eye measurement table mapto the values {Hupp - Vlow} prescribed by CEI-56G-VSR-PAM4(oif2014.230 draft 7, dated 10-June-2016):
Row H_eye V_eyeUpper Hupp VuppMiddle Hmid VmidLower Hlow Vlow
Noise Analysis BER Target: This statistical level determines what BER contourline will be drawn in the three PAM4 eyes. The contour lines are, in turn, used todetermine the EW, EH and VEC measurement values. For OIF-CEI compliance,the target must be 1e-6. If it is changed to a different value (say, 1e-5) then theEW6 and EH6 measurements on the Full Wfm panel change correspondingly (inthis example, to EW5 and EH5). Since these measurements rely on directmeasurement rather than extrapolation, changing the BER target will also changethe population of symbols that must be acquired in order to make themeasurement. The required population is 4 * 1/(BER Target), so for the defaulttarget of 1e-6, a population of 4e6 (or 1e6 in each of the four symbol levels) isneeded. (The application will actually make the measurement if at least 95% ofthis population is acquired.)
BER targets for jitteranalysis
These three BER Target values correspond to the three TJ@BER columns in thecentral results table on the Full Wfm panel. For example, when a value of -12 isentered on the Prefs panel (corresponding to a BER target value of 1e-12 or oneexpected error for every 1 x 1012 bits), the corresponding column heading in theresults table changes to TJ@-12. This shorthand for the more conventionalTJ@1E-12 is due to space constraints.
These targets are used for conventional jitter analysis and eye widthextrapolation, and should not be confused with the Noise Analysis BER Target.
Using the software
18 PAM4 Analysis

Measurement of SNDR(Signal to Noise and
Distortion Ratio)
Signal to Noise and Distortion Ratio is defined as the ratio in dB between thesquare of the linear fit pulse peak and the sum of squares of linear fit error ( σ e )and vertical noise ( σ n ).
For standards compliance it should be measured on the pattern prescribed by theapplicable standard, although other repeating patterns are acceptable if the patternlength is no longer than 8192.
In addition to reporting the SNDR value in dB, the component values pmax, σeand σn are also provided. All measurement values appear in the upper left(scrollable) table on the Full Wfm results tab.
Enable SNDR: This checkbox turns the SNDR measurements, composed of{SNDR, Pmax, σe, σn}, on or off. The measurements are turned off by default.
Samples per Symbol (M): This determines the granularity with which theindividual symbols in the waveform are analyzed. It has no connection with thenumber of oscilloscope samples per symbol. The valid range is 32 ≤ M ≤ 200.
Linear Pulse Length (Np): This determines the number of symbols included inthe linear fit analysis, and should be long enough to capture most of the energy inthe pulse response. The valid range is 2 ≤ Np ≤ 100, with a default value of 14.
Linear Pulse Delay (Dp): This determines the duration, in symbols, of the partof the pulse response that is assumed to occur prior to the main pulse. Its typicalvalue is 2, to allow for some pre-shoot, but the valid range is 2 ≤ Dp ≤ Np-2.
Show Detail Plots: When this checkbox is enabled, the following auxiliary plotsare created in a separate plot window, for additional insight into non-essentialaspects of the measurement:
■ Linear fit error, overlaid with one cycle of the averaged waveform.
■ High and low symbol positions at which the noise measurements are takenwithin the averaged waveform.
(These plots are not saved in Report files.)
Whenever the SNDR measurement is enabled, the linear fit pulse response isshown graphically in the main PAM4 Plots window, similar to the followingimage:
Using the software
PAM4 Analysis 19

The optional detail plots, when enabled, typically appear as follows:
Using the software
20 PAM4 Analysis

Running an analysis1. Set the signal path parameters on the Setup screen and verify that the options
on the Prefs screen are as desired.
2. Click the Run, Single, or Recalc button to perform the analysis.
3. If the mode is Run or Single and the source directly or indirectly uses livechannels (Ch1 - Ch4), a new waveform is acquired into the oscilloscopewaveform memory. Initially the application uses the trigger settings that havebeen configured on the scope, but if no trigger occurs within about10 seconds, the application changes to an edge trigger on the chosen sourcewaveform.
If the waveform filter is enabled, the PAM4 application applies the filter andplaces the result in Math 4 on the oscilloscope. If one or more of the threeforms of equalization is enabled, the output of the equalizer(s) is placed inRef4. A synthesized clock waveform representing the recovered clock isplaced in Ref3. If the Statistical Eye Analysis feature is enabled, the PAM4application renders an eye diagram of the complete waveform at highresolution, accumulating the diagram with prior acquisitions to buildpopulation. If the waveform contains at least three full cycles of a repeatingpattern, the PAM4 application calculates one repeat of the correlatedwaveform and places it in Ref2. Finally, the PAM4 application sets up theappropriate measurements in DPOJET using either Math4, Ref4 or theoriginal source waveform as the measurement source.
4. If correlated waveform analysis is possible, the PAM4 application runs aDPOJET analysis cycle to capture the correlated waveform eye diagram andmeasurement values.
5. The PAM4 application finishes the current cycle by performing selectedmeasurements based on the Select tab. For example, some jitter (RJ/DJ/TJ)measurements require DPOJET sequencing. When that is the case, themeasurements and plots are imported from DPOJET for display in the PAM4user interface. If the Statistical Eye Analysis feature is disabled, DPOJET isalso used to render the eye diagram.
6. If the mode is Run, steps 3 through 5 are repeated, until any population limitshave been satisfied. A closed center eye may optionally be configured to haltRun mode.
7. The PAM4 application turns off the recovered clock waveform (Ref3) whenprocessing completes, to avoid obscuring other waveforms on theoscilloscope screen. You can turn it back on from the oscilloscope File menu,if you want to view the recovered clock.
Using the software
PAM4 Analysis 21

Viewing the resultsTo view measurement results open the following tabs.
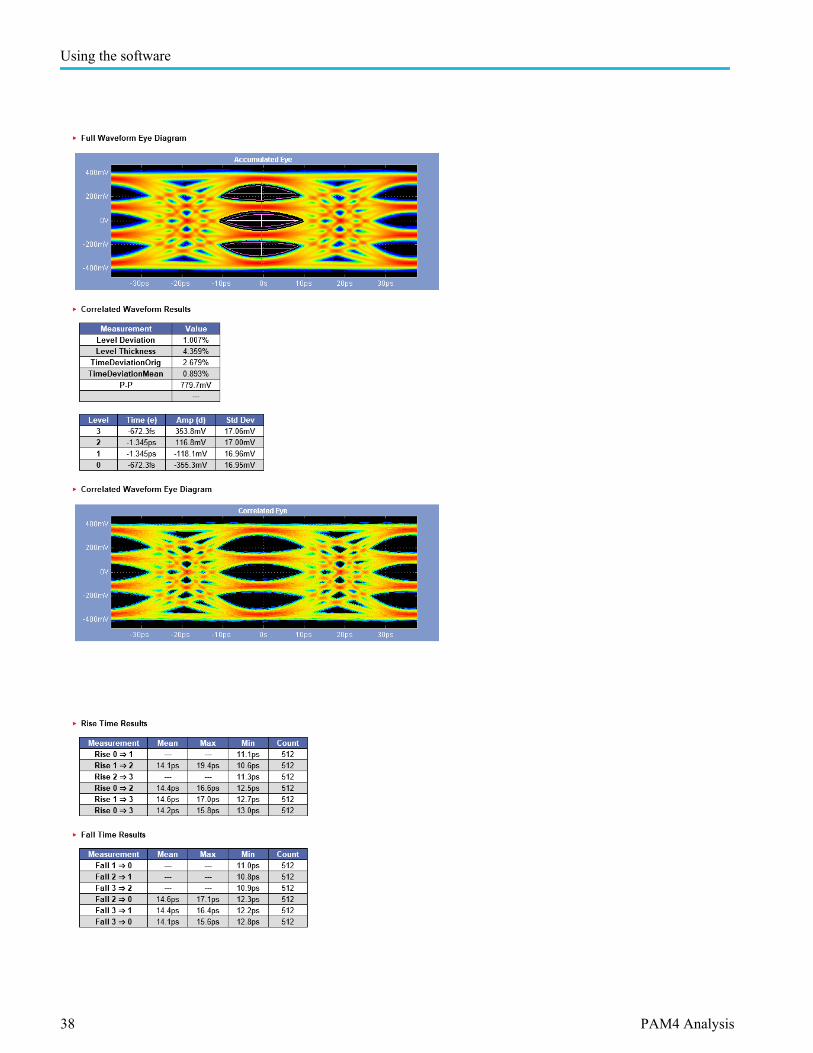
Full waveform Selecting the Full Wfm tab displays the Results for Full Waveform screen,which includes the Accumulated Eye diagram. Values for selected measurementsare displayed above the eye diagram.
NOTE. Many measurements appear in the upper left table, and can be viewed byusing that table's scroll bar.
The eye diagram is updated at the completion of each acquisition cycle.
Using the software
22 PAM4 Analysis
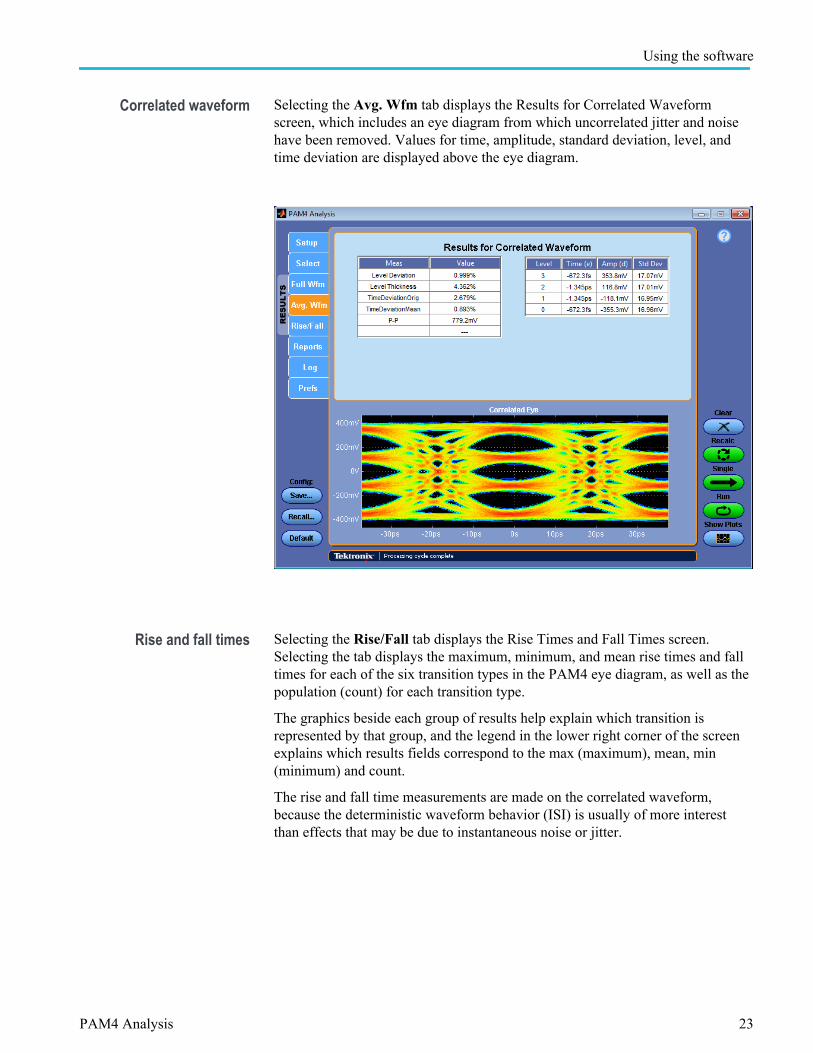
Correlated waveform Selecting the Avg. Wfm tab displays the Results for Correlated Waveformscreen, which includes an eye diagram from which uncorrelated jitter and noisehave been removed. Values for time, amplitude, standard deviation, level, andtime deviation are displayed above the eye diagram.
Rise and fall times Selecting the Rise/Fall tab displays the Rise Times and Fall Times screen.Selecting the tab displays the maximum, minimum, and mean rise times and falltimes for each of the six transition types in the PAM4 eye diagram, as well as thepopulation (count) for each transition type.
The graphics beside each group of results help explain which transition isrepresented by that group, and the legend in the lower right corner of the screenexplains which results fields correspond to the max (maximum), mean, min(minimum) and count.
The rise and fall time measurements are made on the correlated waveform,because the deterministic waveform behavior (ISI) is usually of more interestthan effects that may be due to instantaneous noise or jitter.
Using the software
PAM4 Analysis 23
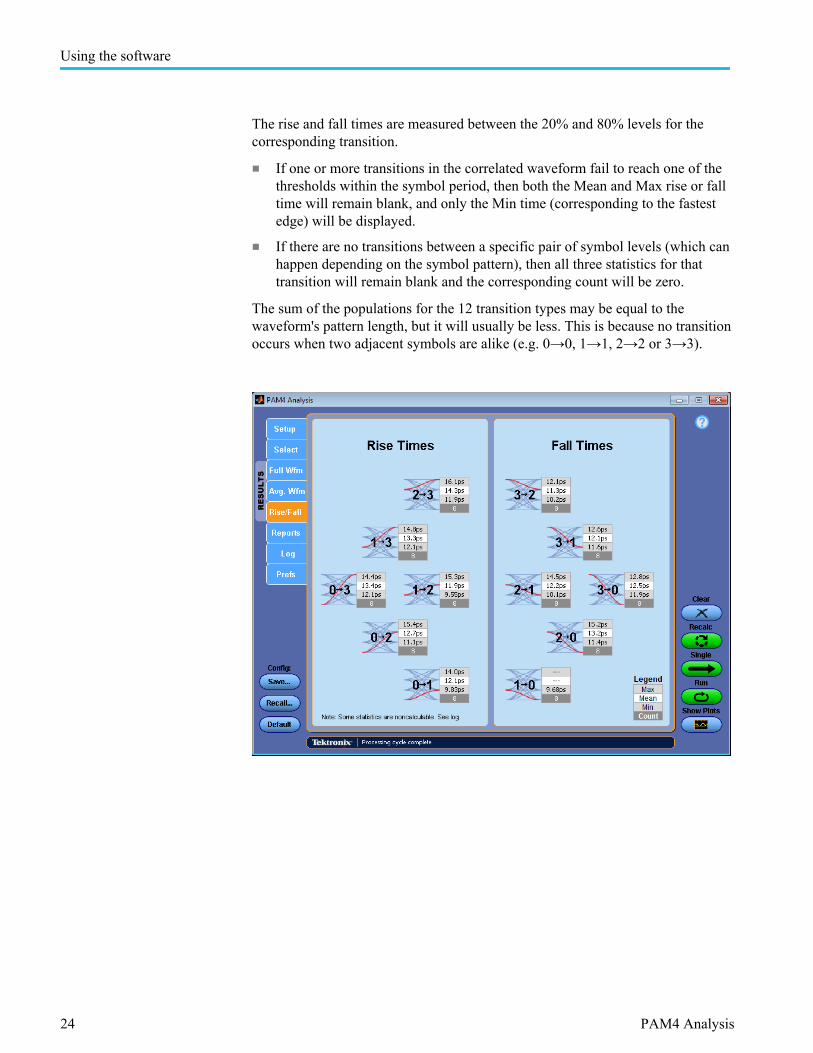
The rise and fall times are measured between the 20% and 80% levels for thecorresponding transition.
■ If one or more transitions in the correlated waveform fail to reach one of thethresholds within the symbol period, then both the Mean and Max rise or falltime will remain blank, and only the Min time (corresponding to the fastestedge) will be displayed.
■ If there are no transitions between a specific pair of symbol levels (which canhappen depending on the symbol pattern), then all three statistics for thattransition will remain blank and the corresponding count will be zero.
The sum of the populations for the 12 transition types may be equal to thewaveform's pattern length, but it will usually be less. This is because no transitionoccurs when two adjacent symbols are alike (e.g. 0→0, 1→1, 2→2 or 3→3).
Using the software
24 PAM4 Analysis

PAM4 Plots windowIf any measurements from the Jitter, Statistical Eye Analysis, SNDR or IEEE-specific (Optical option only) groups are enabled, a dedicated PAM4 Plotswindow will appear whenever measurement results are available in the PAM4Analysis application. If the Jitter or Statistical Eye Analysis measurements areenabled, the window will include the accumulated eye and correlated eye. IfSNDR measurements are enabled, the window will include the linear fit pulseresponse. If the TDECQ measurement is enabled, the TDECQ Eye will bedisplayed.
The window offers plot selection, resizing, additional zoom controls, horizontaland vertical cursors and plot image or data export. If the PAM4 Plots window isminimized or is behind another window, it can be brought to the foreground byselecting the Show Plots button on the main user interface window. Below is anexample of the PAM4 Plots window:
NOTE. The Show Plots button will be absent if there are no measurement results,for example after you click the Clear button.
Using the software
PAM4 Analysis 25
The toolbar functions in the PAM4 Plots window are similar to those used in theDPOJET application, and can be easily learned by direct exploration or byreferring to the Toolbar functions in plot windows topic in the DPOJET manual.Note that before using some of the toolbar buttons, you must select one of theplots by clicking on it. A plot that has been selected will have an orange border.
The following specific plots may appear in the window:
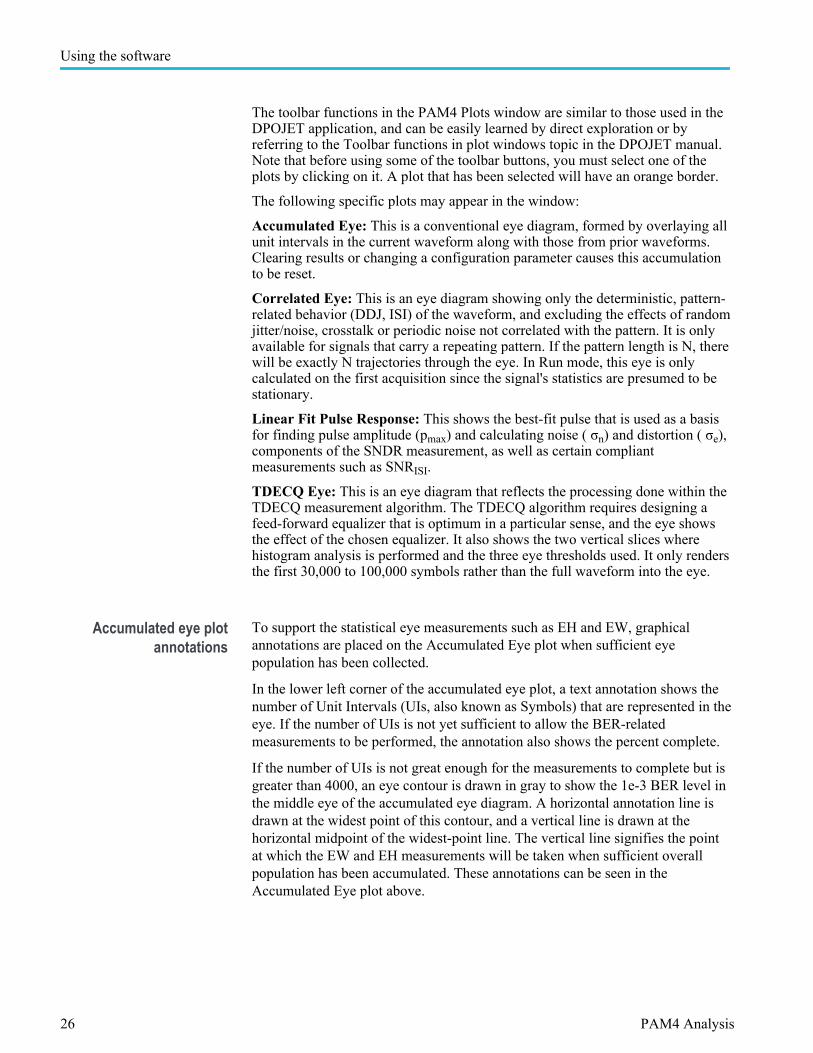
Accumulated Eye: This is a conventional eye diagram, formed by overlaying allunit intervals in the current waveform along with those from prior waveforms.Clearing results or changing a configuration parameter causes this accumulationto be reset.
Correlated Eye: This is an eye diagram showing only the deterministic, pattern-related behavior (DDJ, ISI) of the waveform, and excluding the effects of randomjitter/noise, crosstalk or periodic noise not correlated with the pattern. It is onlyavailable for signals that carry a repeating pattern. If the pattern length is N, therewill be exactly N trajectories through the eye. In Run mode, this eye is onlycalculated on the first acquisition since the signal's statistics are presumed to bestationary.
Linear Fit Pulse Response: This shows the best-fit pulse that is used as a basisfor finding pulse amplitude (pmax) and calculating noise ( σn) and distortion ( σe),components of the SNDR measurement, as well as certain compliantmeasurements such as SNRISI.
TDECQ Eye: This is an eye diagram that reflects the processing done within theTDECQ measurement algorithm. The TDECQ algorithm requires designing afeed-forward equalizer that is optimum in a particular sense, and the eye showsthe effect of the chosen equalizer. It also shows the two vertical slices wherehistogram analysis is performed and the three eye thresholds used. It only rendersthe first 30,000 to 100,000 symbols rather than the full waveform into the eye.
Accumulated eye plotannotations
To support the statistical eye measurements such as EH and EW, graphicalannotations are placed on the Accumulated Eye plot when sufficient eyepopulation has been collected.
In the lower left corner of the accumulated eye plot, a text annotation shows thenumber of Unit Intervals (UIs, also known as Symbols) that are represented in theeye. If the number of UIs is not yet sufficient to allow the BER-relatedmeasurements to be performed, the annotation also shows the percent complete.
If the number of UIs is not great enough for the measurements to complete but isgreater than 4000, an eye contour is drawn in gray to show the 1e-3 BER level inthe middle eye of the accumulated eye diagram. A horizontal annotation line isdrawn at the widest point of this contour, and a vertical line is drawn at thehorizontal midpoint of the widest-point line. The vertical line signifies the pointat which the EW and EH measurements will be taken when sufficient overallpopulation has been accumulated. These annotations can be seen in theAccumulated Eye plot above.
Using the software
26 PAM4 Analysis
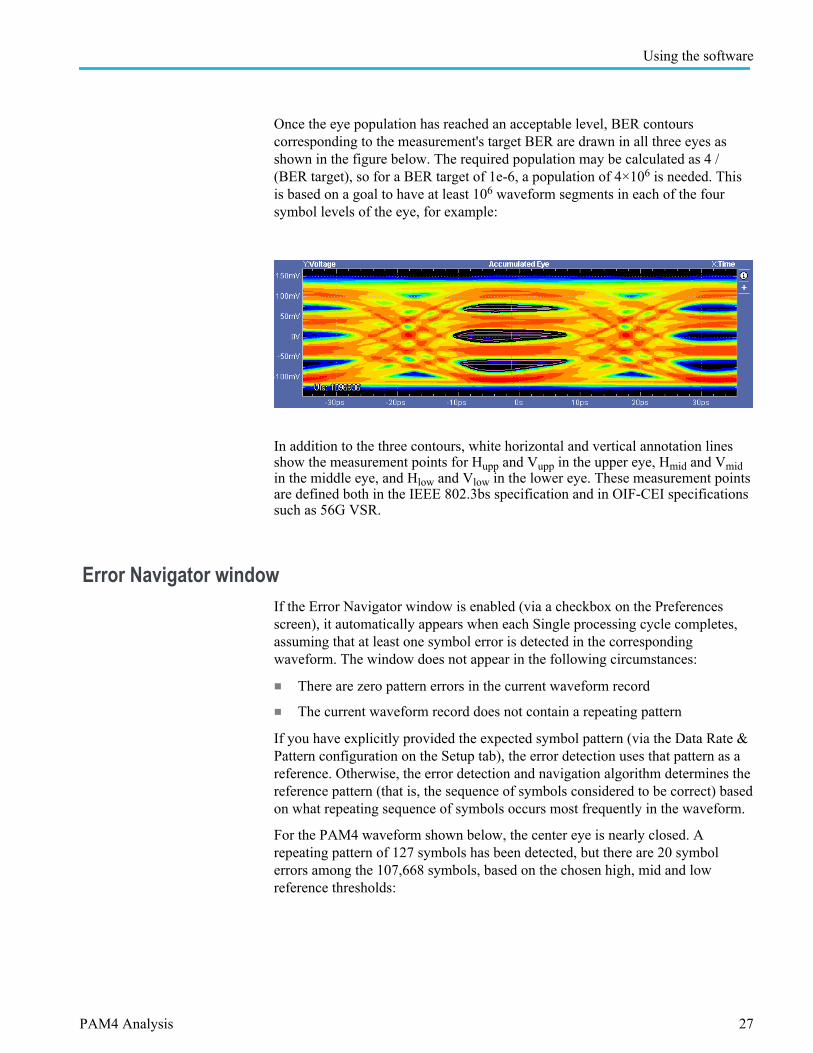
Once the eye population has reached an acceptable level, BER contourscorresponding to the measurement's target BER are drawn in all three eyes asshown in the figure below. The required population may be calculated as 4 /(BER target), so for a BER target of 1e-6, a population of 4×10⁶ is needed. Thisis based on a goal to have at least 106 waveform segments in each of the foursymbol levels of the eye, for example:
In addition to the three contours, white horizontal and vertical annotation linesshow the measurement points for Hupp and Vupp in the upper eye, Hmid and Vmidin the middle eye, and Hlow and Vlow in the lower eye. These measurement pointsare defined both in the IEEE 802.3bs specification and in OIF-CEI specificationssuch as 56G VSR.
Error Navigator windowIf the Error Navigator window is enabled (via a checkbox on the Preferencesscreen), it automatically appears when each Single processing cycle completes,assuming that at least one symbol error is detected in the correspondingwaveform. The window does not appear in the following circumstances:
■ There are zero pattern errors in the current waveform record
■ The current waveform record does not contain a repeating pattern
If you have explicitly provided the expected symbol pattern (via the Data Rate &Pattern configuration on the Setup tab), the error detection uses that pattern as areference. Otherwise, the error detection and navigation algorithm determines thereference pattern (that is, the sequence of symbols considered to be correct) basedon what repeating sequence of symbols occurs most frequently in the waveform.
For the PAM4 waveform shown below, the center eye is nearly closed. Arepeating pattern of 127 symbols has been detected, but there are 20 symbolerrors among the 107,668 symbols, based on the chosen high, mid and lowreference thresholds:
Using the software
PAM4 Analysis 27
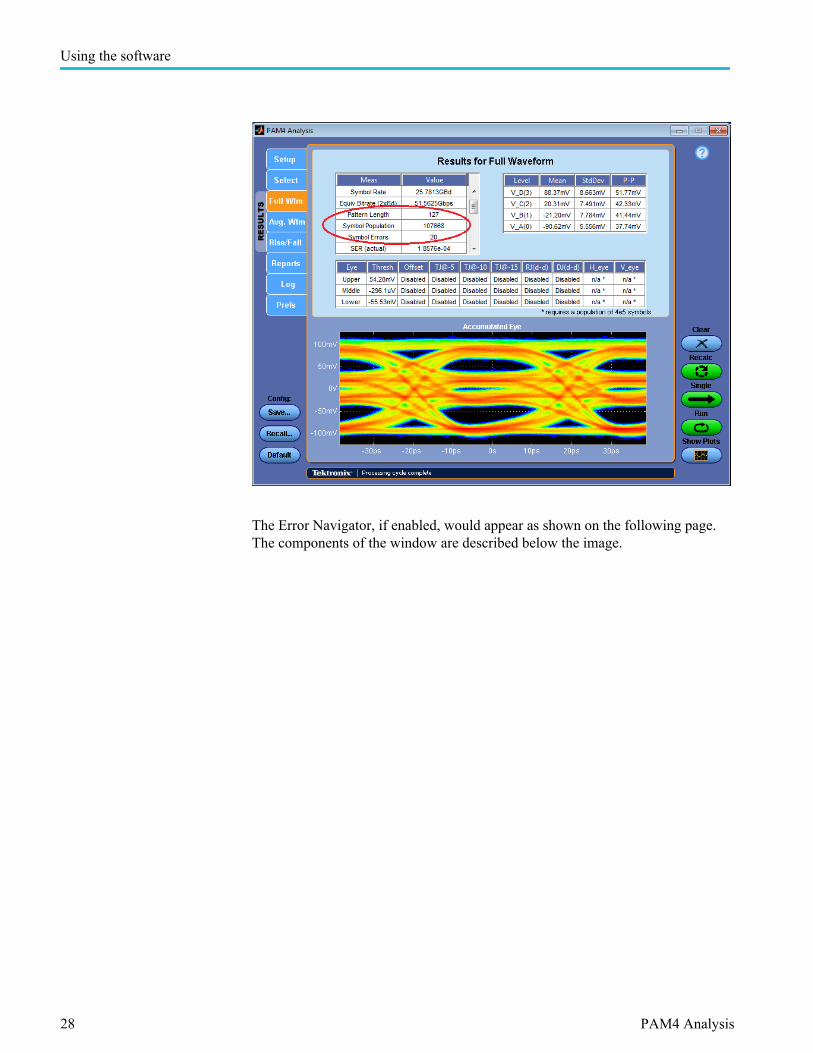
The Error Navigator, if enabled, would appear as shown on the following page.The components of the window are described below the image.
Using the software
28 PAM4 Analysis
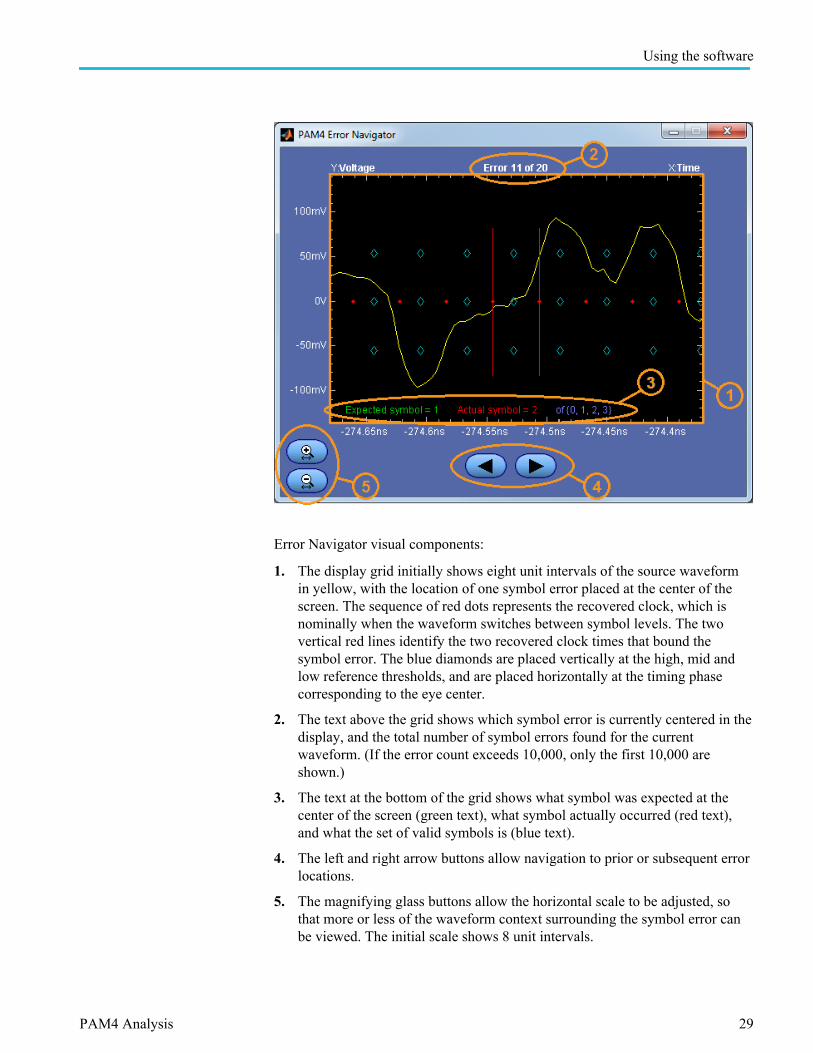
Error Navigator visual components:
1. The display grid initially shows eight unit intervals of the source waveformin yellow, with the location of one symbol error placed at the center of thescreen. The sequence of red dots represents the recovered clock, which isnominally when the waveform switches between symbol levels. The twovertical red lines identify the two recovered clock times that bound thesymbol error. The blue diamonds are placed vertically at the high, mid andlow reference thresholds, and are placed horizontally at the timing phasecorresponding to the eye center.
2. The text above the grid shows which symbol error is currently centered in thedisplay, and the total number of symbol errors found for the currentwaveform. (If the error count exceeds 10,000, only the first 10,000 areshown.)
3. The text at the bottom of the grid shows what symbol was expected at thecenter of the screen (green text), what symbol actually occurred (red text),and what the set of valid symbols is (blue text).
4. The left and right arrow buttons allow navigation to prior or subsequent errorlocations.
5. The magnifying glass buttons allow the horizontal scale to be adjusted, sothat more or less of the waveform context surrounding the symbol error canbe viewed. The initial scale shows 8 unit intervals.
Using the software
PAM4 Analysis 29
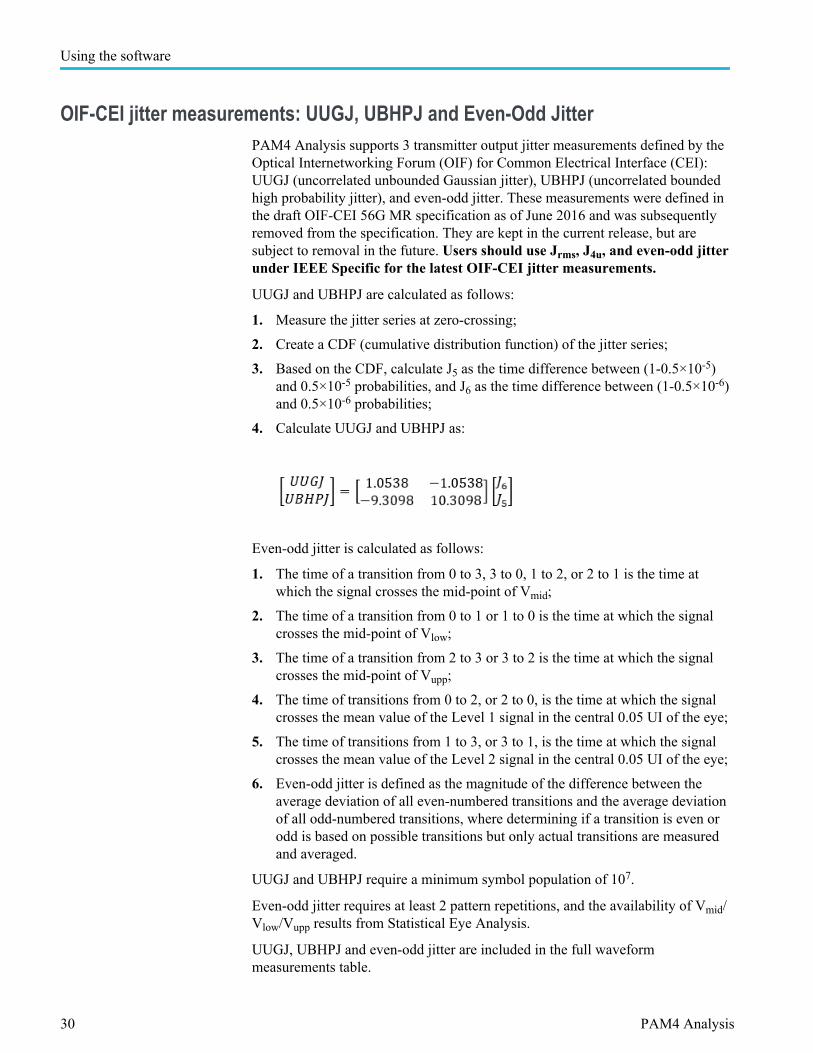
OIF-CEI jitter measurements: UUGJ, UBHPJ and Even-Odd JitterPAM4 Analysis supports 3 transmitter output jitter measurements defined by theOptical Internetworking Forum (OIF) for Common Electrical Interface (CEI):UUGJ (uncorrelated unbounded Gaussian jitter), UBHPJ (uncorrelated boundedhigh probability jitter), and even-odd jitter. These measurements were defined inthe draft OIF-CEI 56G MR specification as of June 2016 and was subsequentlyremoved from the specification. They are kept in the current release, but aresubject to removal in the future. Users should use Jrms, J4u, and even-odd jitterunder IEEE Specific for the latest OIF-CEI jitter measurements.
UUGJ and UBHPJ are calculated as follows:
1. Measure the jitter series at zero-crossing;
2. Create a CDF (cumulative distribution function) of the jitter series;
3. Based on the CDF, calculate J5 as the time difference between (1-0.5×10⁻⁵)and 0.5×10⁻⁵ probabilities, and J6 as the time difference between (1-0.5×10⁻⁶)and 0.5×10⁻⁶ probabilities;
4. Calculate UUGJ and UBHPJ as:
Even-odd jitter is calculated as follows:
1. The time of a transition from 0 to 3, 3 to 0, 1 to 2, or 2 to 1 is the time atwhich the signal crosses the mid-point of Vmid;
2. The time of a transition from 0 to 1 or 1 to 0 is the time at which the signalcrosses the mid-point of Vlow;
3. The time of a transition from 2 to 3 or 3 to 2 is the time at which the signalcrosses the mid-point of Vupp;
4. The time of transitions from 0 to 2, or 2 to 0, is the time at which the signalcrosses the mean value of the Level 1 signal in the central 0.05 UI of the eye;
5. The time of transitions from 1 to 3, or 3 to 1, is the time at which the signalcrosses the mean value of the Level 2 signal in the central 0.05 UI of the eye;
6. Even-odd jitter is defined as the magnitude of the difference between theaverage deviation of all even-numbered transitions and the average deviationof all odd-numbered transitions, where determining if a transition is even orodd is based on possible transitions but only actual transitions are measuredand averaged.
UUGJ and UBHPJ require a minimum symbol population of 107.
Even-odd jitter requires at least 2 pattern repetitions, and the availability of Vmid/Vlow/Vupp results from Statistical Eye Analysis.
UUGJ, UBHPJ and even-odd jitter are included in the full waveformmeasurements table.
Using the software
30 PAM4 Analysis

IEEE electrical measurements: Jrms, J4u, J3u, Even-Odd Jitter, Rise/Fall Time andSNRISI
PAM4 Analysis supports five transmitter electrical characterizationmeasurements defined by IEEE 802.3bs: Jrms, J4u, J3u, even-odd jitter, rise/falltime and SNRISI. As of August 2017, Jrms, J4u, and even-odd jitter are alsodefined in OIF-CEI 56G spec, replacing the removed UUGJ, UBHPJ and even-odd jitter definitions. Definitions of Jrms, J4u, even-odd jitter, rise/fall time andSNRISI can be found in Annex 120D of IEEE 802.3bs spec, Draft 3.3 (as of July2017). Due to their complexity, users are encouraged to refer to the latest specdraft for measurement definitions.
Jrms, J4u, even-odd jitter, and rise/fall time are only available on PRBS13Qpattern per spec definition. They are not computed on non-compliant patterns.
As of this release, initial estimates of Jrms and J4u require a minimum symbolpopulation of 2.4x10⁶, and are recalculated with better precision as morepopulations are accumulated. This is subject to change per future spec revision.
Even-odd jitter requires at least two pattern repetitions.
SNRISI requires SNDR analysis to compute, as it is directly derived from thelinear fit pulse response.
If selected, Jrms, J4u, J3u, even-odd jitter, rise/fall time and SNRISI, are included inthe full waveform measurements table.
For further reading:
On the Tektronix website, navigate to Support > Learning Center and search forthe White paper titled: "A Fast, Stable Algorithm for Measuring Jrms, J4u andJ3u on Real Time Oscilloscopes"
Using the software
PAM4 Analysis 31
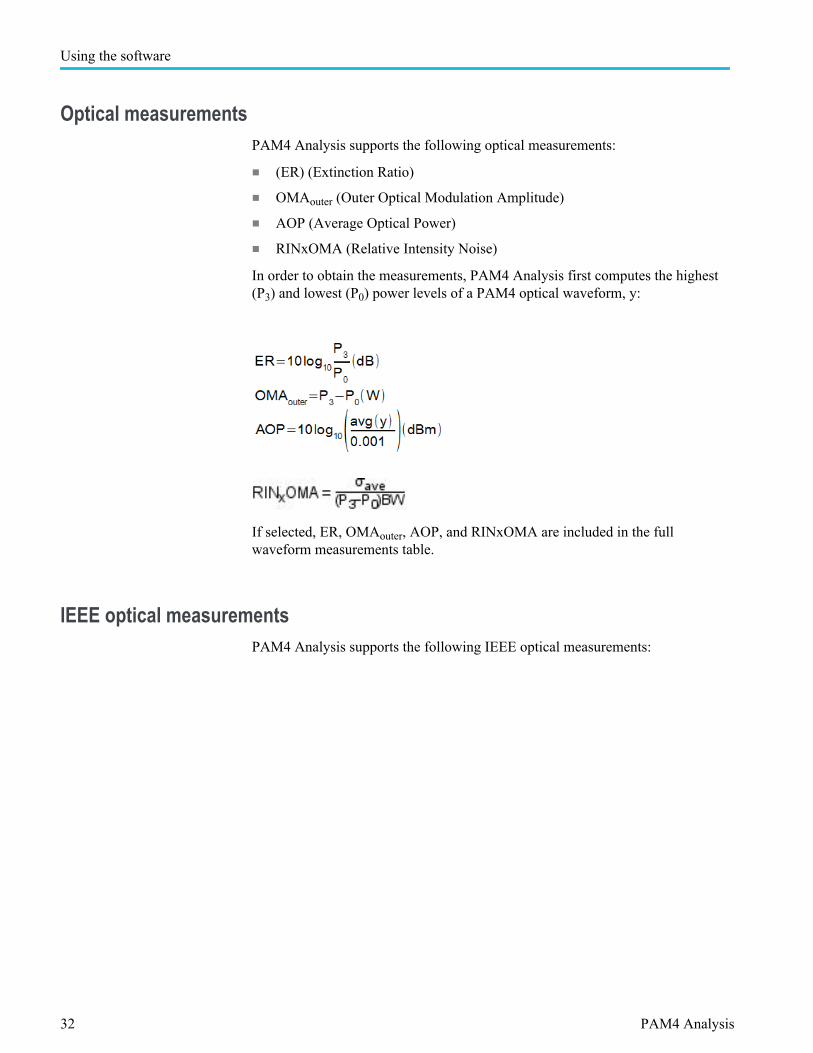
Optical measurementsPAM4 Analysis supports the following optical measurements:
■ (ER) (Extinction Ratio)
■ OMAouter (Outer Optical Modulation Amplitude)
■ AOP (Average Optical Power)
■ RINxOMA (Relative Intensity Noise)
In order to obtain the measurements, PAM4 Analysis first computes the highest(P3) and lowest (P0) power levels of a PAM4 optical waveform, y:
If selected, ER, OMAouter, AOP, and RINxOMA are included in the fullwaveform measurements table.
IEEE optical measurementsPAM4 Analysis supports the following IEEE optical measurements:
Using the software
32 PAM4 Analysis

Measurement DescriptionTDECQdefined by IEEE 802.3bs and 802.3cd
The definition for TDECQ can be found in 121.8.5.3 ofIEEE 802.3bs spec, Draft 3.5 (as of October 2017).TDECQ analysis finds the largest noise that can becombined with the signal by an ideal optical referencereceiver when optimally equalized by a referenceequalizer. The optimal equalizer tap coefficients aredependent on the amount of noise added to the signal, sofinding the noise that can be added and the opticalequalizer setting is an iterative process.
TDECQ should be measured with an optical referencereceiver (ORR) and reference equalizer as defined by thespec. As of 802.3bs Draft 3.5:
■ The ORR is a 4th-order Bessel-Thomson filter with anoptical bandwidth of 13.28125 GHz for 26.5625 GBddata rate. This can be achieved by enabling theBessel-Thomson Filter on the Setup tab. Be carefulnot to duplicate ORR as optical probes may alsocome with their own ORR compensation.
■ The reference equalizer is a 5-tap, T-spaced, feedforward equalizer (FFE). In PAM4 Analysis, thereference equalizer is included in TDECQconfiguration and different from the stand-alone FFEon the Setup tab.
Ceq Equalizer noise enhancement coefficient.OMAOUTER-TDECQ The OMAouter measurement made after the TDECQ FFE.
Using the software
PAM4 Analysis 33

Four configuration parameters require user input:
■ Number of FFE Taps, FFE Taps/UI, and FFE Max Pre-Cursors: Referenceequalizer parameters. For IEEE compliance, use a 5-tap, T-spaced FFE with amax pre-cursor of 2.
■ Waveform Samples/UI: Prior to TDECQ analysis, the input waveform needsto be up-sampled to provide sufficient accuracy for the eye diagram. It isrecommended to use 10 and above.
■ Scope Noise (μWrms): σS, standard deviation of the noise of the opticalprobe and oscilloscope combined. It is calibrated with no optical input signaland the same settings used to capture the optical signal.
■ Extended Search: When enabled, the algorithms perform an extended searchfor the optimal FFE taps to minimize the TDECQ value (but increases thetime to complete). When disabled, the FFE taps are adapted faster but may beless optimal.
■ Vertical Threshold Adjust: When enabled, the sub-eye threshold levels areallowed to adjust by ±1% of the OMAouter. IEEE 802.3cd allows this optionto be selected for TDECQ measurements. When disabled, the sub-eyethreshold levels are determined by the OMAouter and the average opticalpower.
■ Autoset FFE Tap Values: When enabled, PAM4 Analysis automaticallydetermines the optimal FFE tap values and applies it to compute TDECQ.When disabled, the current tap values entered on the graphical user interfaceare used to compute TDECQ.
If selected, the measurement is included in the full waveform measurementstable.
Using the software
34 PAM4 Analysis
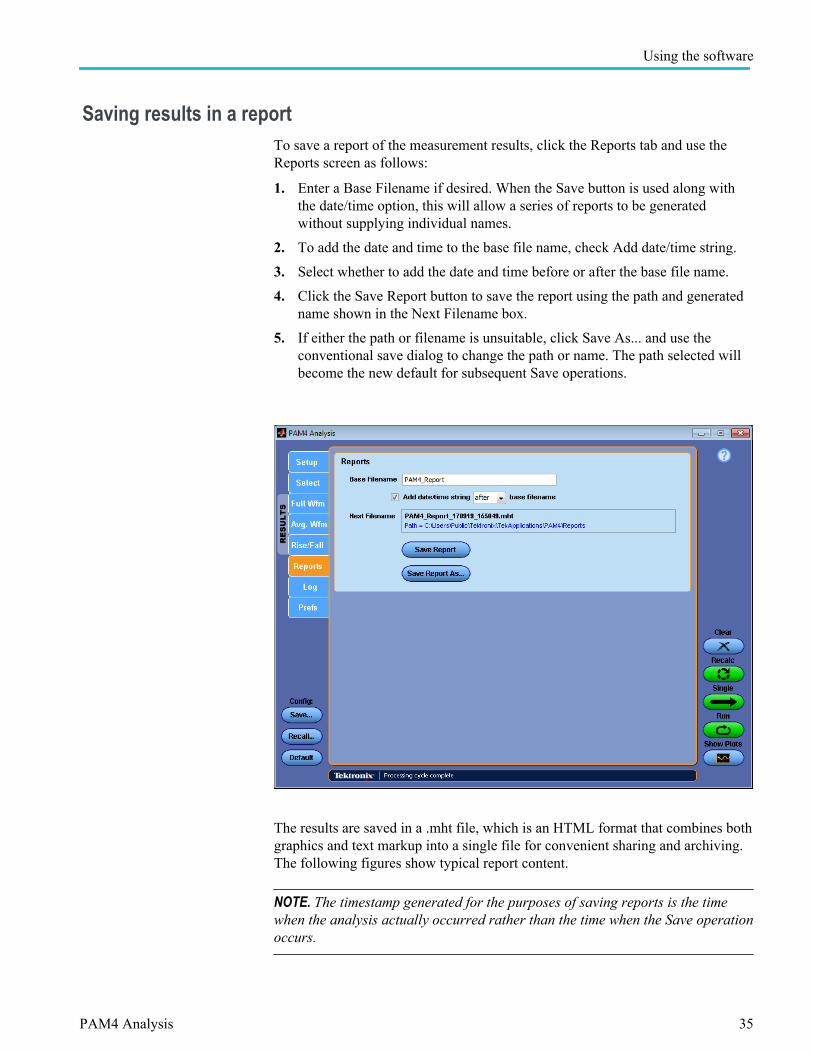
Saving results in a reportTo save a report of the measurement results, click the Reports tab and use theReports screen as follows:
1. Enter a Base Filename if desired. When the Save button is used along withthe date/time option, this will allow a series of reports to be generatedwithout supplying individual names.
2. To add the date and time to the base file name, check Add date/time string.
3. Select whether to add the date and time before or after the base file name.
4. Click the Save Report button to save the report using the path and generatedname shown in the Next Filename box.
5. If either the path or filename is unsuitable, click Save As... and use theconventional save dialog to change the path or name. The path selected willbecome the new default for subsequent Save operations.
The results are saved in a .mht file, which is an HTML format that combines bothgraphics and text markup into a single file for convenient sharing and archiving.The following figures show typical report content.
NOTE. The timestamp generated for the purposes of saving reports is the timewhen the analysis actually occurred rather than the time when the Save operationoccurs.
Using the software
PAM4 Analysis 35

Using the software
36 PAM4 Analysis
Using the software
PAM4 Analysis 37
Using the software
38 PAM4 Analysis

Using the event logSelecting the Log tab displays information about events, such as when the resultswere last cleared, when the analysis started and stopped, how many unit intervalswere accumulated, and any error or warning conditions. The event log should notbe confused with the measurement log (streaming export of measurement resultsto a .csv file), which is controlled in the Prefs panel.
Using the software
PAM4 Analysis 39
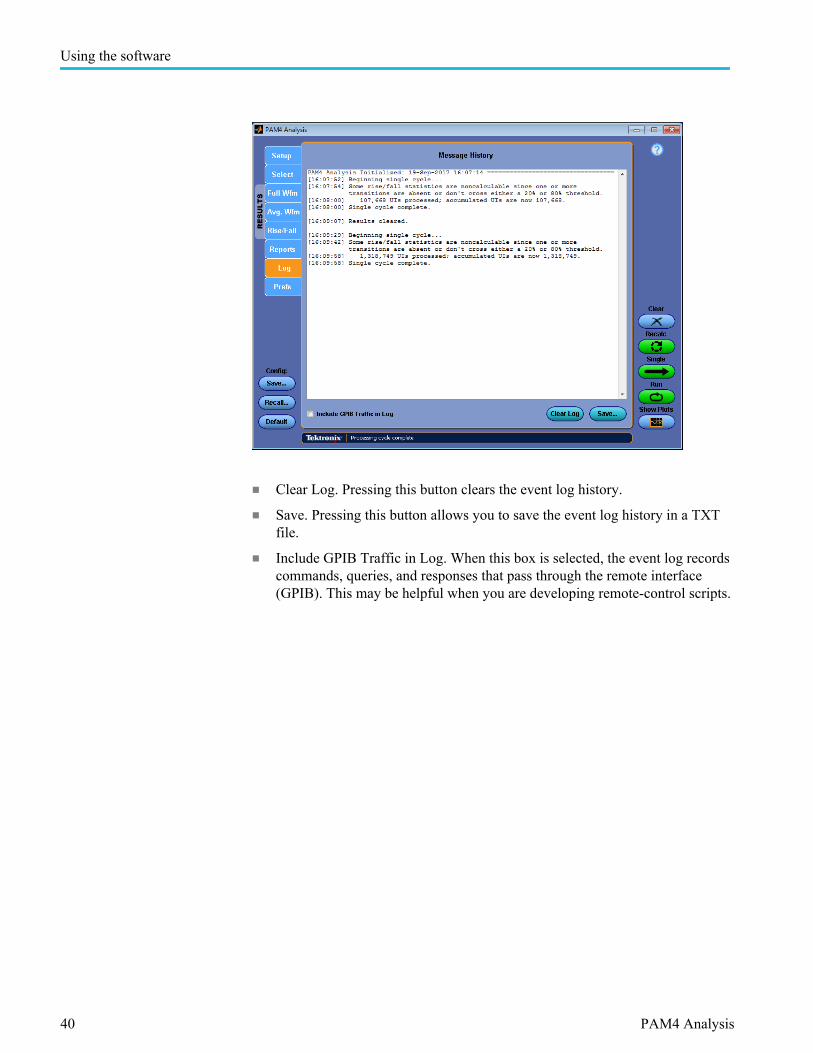
■ Clear Log. Pressing this button clears the event log history.
■ Save. Pressing this button allows you to save the event log history in a TXTfile.
■ Include GPIB Traffic in Log. When this box is selected, the event log recordscommands, queries, and responses that pass through the remote interface(GPIB). This may be helpful when you are developing remote-control scripts.
Using the software
40 PAM4 Analysis

PreferencesSelecting the Prefs tab displays user preferences and some less-frequently-usedconfiguration options, in five categories:
■ Population control
■ Termination of Eye Analysis due to eye closure
■ Error Navigator (for Symbol Error Analysis)
■ Measurement logging
■ Display units (Relative vs. Absolute)
■ Scope Noise Compensation (mVrms or μWrms)
NOTE. Scope Noise Compensation Setting the Scope Noise Compensationincreases the measurement accuracy of the PAM4 measurements listed in thedialog screen. Scope Noise units and affected measurements is dependent onthe Measurement Category selected in the Select tab. The default values are-1 mVrms (electrical measurements) or 13.73 μWrms (opticalmeasurements). See Measuring scope noise for electrical signals onpage 45 to measure the noise value using the live signal under test.
Using the software
PAM4 Analysis 41
Population control The population control feature allows you to designate a target measurementpopulation, either by the number of symbols or the number of waveformacquisitions (processing cycles). This is typically useful with the Run mode sothat a population greater than is practical to obtain in a single cycle can becaptured automatically. It is primarily designed to support some measurementsdefined by the OIF-CEI/IEEE standards that require a minimum symbolpopulation. In many cases this is impractical to capture with a single waveform.
Limit Method: This control, in its default state of No Limit, disables thepopulation limit feature and allows unconstrained sequencing. To enablepopulation limits, select one of the other choices, either Number of Symbols orNumber of Acquisitions.
Number of Symbols: When this method is selected via the Limit Method control,you can enter the target symbol population. If you subsequently select Run, theapplication will sequence until at least the designated population has beenattained. (The application always acquires and processes full waveforms, so thetotal population when the application halts will generally be slightly greater thanthe target.)
Number of Acquisitions: When this method is selected via the Limit Methodcontrol, you can enter the number of waveform acquisitions (processing cycles)desired.
While the Population Control feature is mainly to support Run mode, you canalso use Single to step toward the configured limit.
Halt on closed center eye When the checkbox is selected, the Statistical Eye Analysis feature will ceasetrying to accumulate more population if the center eye is closed before the targetBER has been achieved. The EW, EH and VEC measurements require that theeyes are still open at that population.
Error Navigator The Error Navigator, when enabled, allows individual symbol errors in thecurrent source waveform to be identified and viewed in a dedicated plot window.The Error Navigator window itself is described in Error Navigator window onpage 27.
Using the software
42 PAM4 Analysis

Whenever the PAM4 Analysis application processes a waveform, it extracts theactual symbol sequence from the waveform as a part of the clock recoveryprocess. The symbol sequence is analyzed to see if it contains a repeating pattern.
■ Error-Free Pattern: In some cases the recovered symbol sequence willreflect a perfect repeating pattern, in which case the Error Navigator figurewill not appear (since there are no errors to display).
■ Pattern with Errors: In other cases, a few or many symbols will deviatefrom the pattern established by most of the waveform. In this case, the ErrorNavigator will appear when the processing cycle completes, allowing you touse forward and backward arrow buttons to browse through the locatederrors.
■ No Pattern Detected: If no pattern can be discerned that would have fewerthan 10% of the symbols in error (1e-1 SER), the waveform is identified asnot having a pattern and the Error Navigator is not shown.
■ User-Determined Pattern: If you use the Date Rate & Pattern controlfeature to specify an expected pattern via a text file, that pattern will takeprecedence over any auto-detection. Autocorrelation will be used to identifythe most likely pattern starting point to match the specified pattern with therecovered symbols. Any deviations will be shown in the Error Navigator.
The Error Navigator figure is further described at Error Navigator window onpage 27.
Measurement logging Selecting the Enable Measurement Logging (.csv) checkbox causes all of thePAM4 measurement values from every processing cycle to be written to a file incomma-separated value (csv) format. This format can be opened by manyspreadsheet applications such as Excel®, for example to allow post-processing.The output file is C:\Users\<username>\Tektronix\TekApplications\PAM4\Log\PAM4_Results.csv, and cannot be changed. The initial row in the file is a headerrow consisting of measurement names, and each processing cycle adds a row ofvalues. Clearing results or changing any configuration parameter causes a blankline and a new header row to be written prior to the next measurement resultsrow. The checkbox may be selected and de-selected during a measurementsession to enable or disable logging, and the log file will remain after theapplication is closed. However, the log file is always cleared when the PAM4Analysis application is started, so be sure to copy or rename any results that youwant to save before re-launching the application.
An example log, as viewed in a spreadsheet, is shown below. In this example, theapplication was cycled three times, cleared, and cycled once more.
Using the software
PAM4 Analysis 43

Display units For measurements of time parameters, the display unit can be switched between"Relative" and "Absolute". "Relative" displays time in unit intervals (UI), while"Absolute" displays time in seconds. Plots are not affected by this setting.
The default is "Absolute" display units.
Scope noisecompensation
To ensure accurate measurement results, set the Scope Noise Compensation tothe value measured in the procedure provided. See Measuring scope noise forelectrical signals on page 45.
The noise compensation value is set in either mV or μW, depending on theMeasurement Category selection (Electrical or Optical respectively, as set in theSelect tab).
Scope noise characterizationScope noise, σs is defined as the standard deviation of the noise of the probe andoscilloscope combined. Many of the optical and electrical measurements requirethat the scope noise be measured and then entered into the Prefs tab.
This section provides instructions on how to characterize the scope noise foreither electrical or optical signals. The measured value is then entered into theScope Noise Compensation field.
Using the software
44 PAM4 Analysis

Measuring scope noise forelectrical signals
The following electrical measurements require the scope noise (σ s) compensationvalue (entered in the Prefs tab) for accurate results.
Characterization steps:1. Connect the live signal to one of the available channels.2. Adjust the vertical scale such that the signal occupies the full vertical range.3. If Bessel-Thomson filter is used, then this filter needs to be applied to the live
signal using Math->Arbflt.
Let the output of this filter be Math1.
(If the user has run PAM4 Analysis with its Bessel-Thomson filter enabled,the created filter file can be found in the path specified. Refer to the Bessel-Thomson filter on page 12 section for more information.
4. If cable embedding/de-embedding is used: This filter needs to be appliedsimilarly as in Step 3. ”
Let the output of this filter be Math2.
Using the software
PAM4 Analysis 45
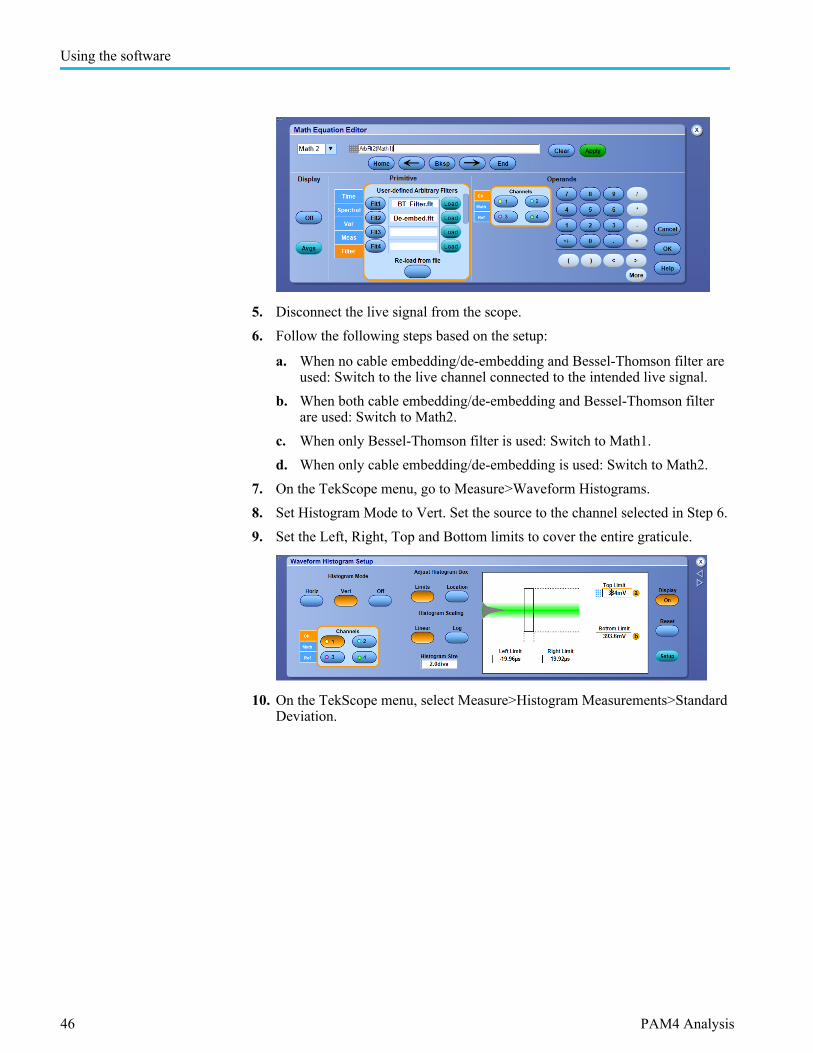
5. Disconnect the live signal from the scope.6. Follow the following steps based on the setup:
a. When no cable embedding/de-embedding and Bessel-Thomson filter areused: Switch to the live channel connected to the intended live signal.
b. When both cable embedding/de-embedding and Bessel-Thomson filterare used: Switch to Math2.
c. When only Bessel-Thomson filter is used: Switch to Math1.d. When only cable embedding/de-embedding is used: Switch to Math2.
7. On the TekScope menu, go to Measure>Waveform Histograms.8. Set Histogram Mode to Vert. Set the source to the channel selected in Step 6.9. Set the Left, Right, Top and Bottom limits to cover the entire graticule.
10. On the TekScope menu, select Measure>Histogram Measurements>StandardDeviation.
Using the software
46 PAM4 Analysis
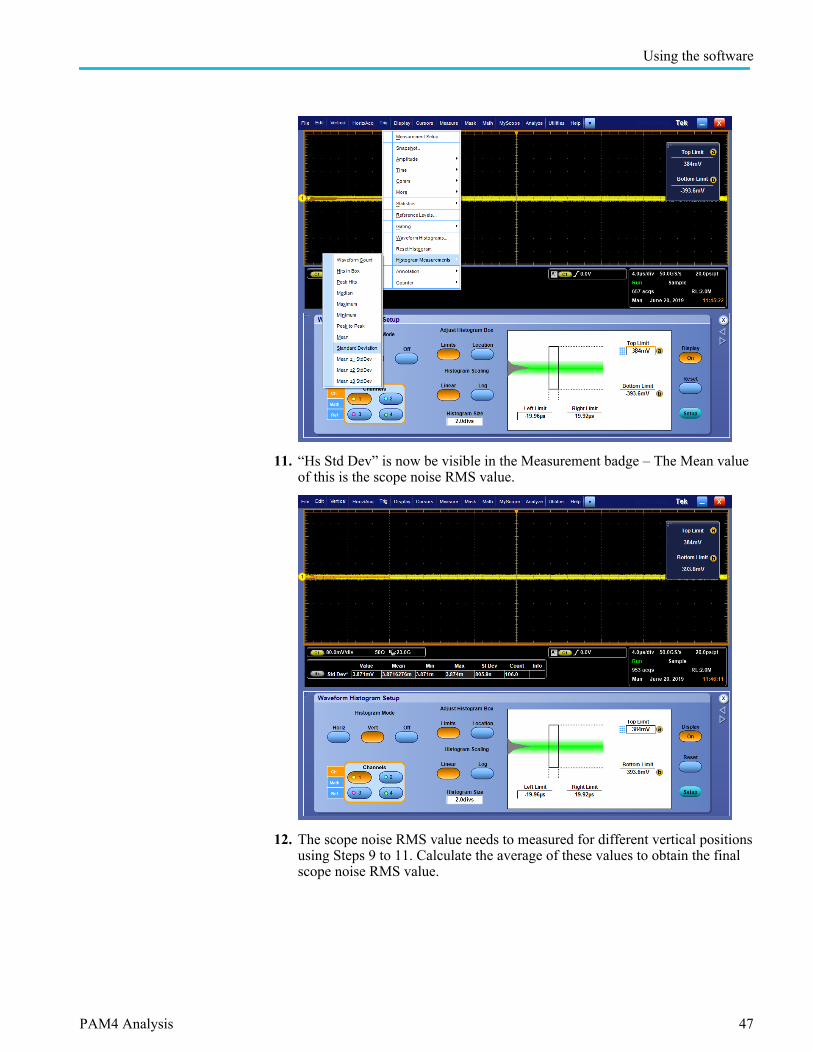
11. “Hs Std Dev” is now be visible in the Measurement badge – The Mean valueof this is the scope noise RMS value.
12. The scope noise RMS value needs to measured for different vertical positionsusing Steps 9 to 11. Calculate the average of these values to obtain the finalscope noise RMS value.
Using the software
PAM4 Analysis 47

Following the following steps based on the setup:
a. Single-ended input:
a. On the TekScope menu, go to Vertical menu for the live channelconnected to the intended live signal.
b. Set the Position control to several different values across the screen,e.g., -3 div, 0 div and +3 div.
c. Measure the noise RMS value for each position using steps 9 to 11.d. Calculate the average of the different readings as the final scope
noise RMS value.b. Differential inputs:
a. Suppose Ch1 and Ch3 are used, and are combined using a Mathexpression (possibly combined with de-embedding). Go to Verticalmenu for Ch1 and set the Position to a value, e.g., as +3 div. Go toCh3 and set the position to the inverse value (-3 div in this example).
b. Now measure the scope noise RMS using Steps 9 to 11 on thecorresponding Math channel.
c. Repeat Steps 12.b.i and 12.b.ii with similar combinations, e.g.,{-3 div, +3 div}, {0 div, 0 div}, etc.
d. Calculate the average of the different readings as the final scopenoise RMS value.
Using the software
48 PAM4 Analysis
Measuring scope noise foroptical signals
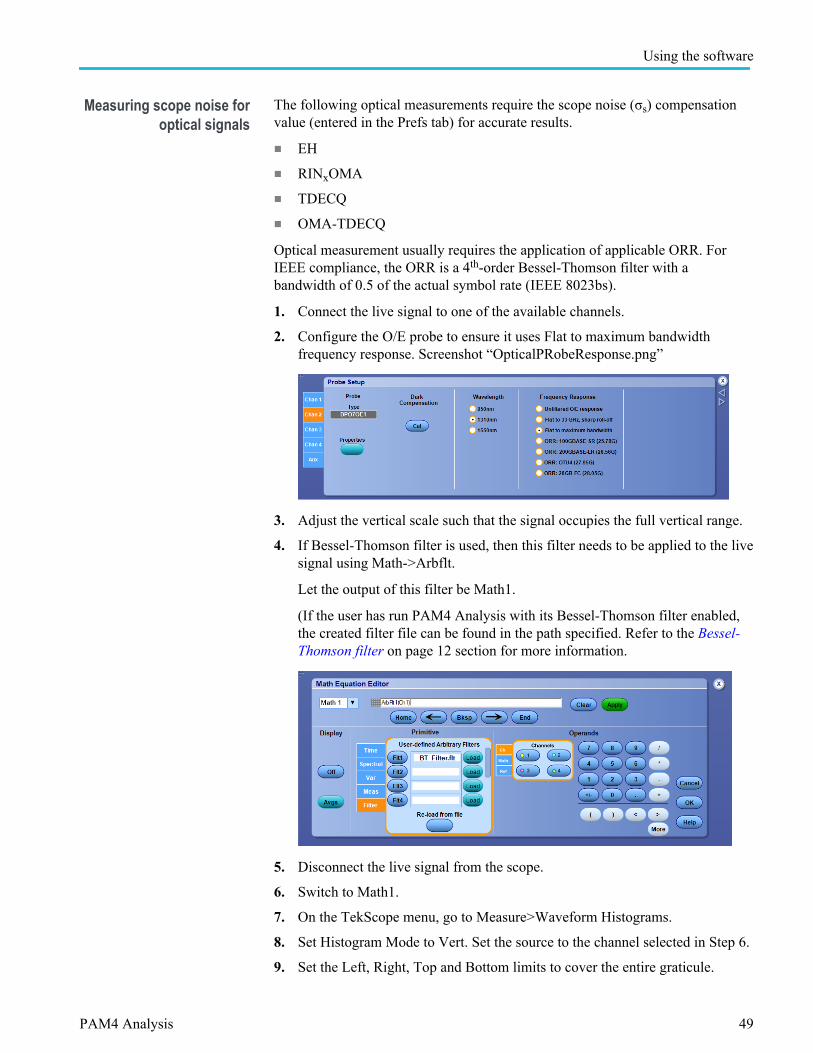
The following optical measurements require the scope noise (σs) compensationvalue (entered in the Prefs tab) for accurate results.
■ EH■ RINxOMA■ TDECQ■ OMA-TDECQ
Optical measurement usually requires the application of applicable ORR. ForIEEE compliance, the ORR is a 4th-order Bessel-Thomson filter with abandwidth of 0.5 of the actual symbol rate (IEEE 8023bs).
1. Connect the live signal to one of the available channels.
2. Configure the O/E probe to ensure it uses Flat to maximum bandwidthfrequency response. Screenshot “OpticalPRobeResponse.png”
3. Adjust the vertical scale such that the signal occupies the full vertical range.
4. If Bessel-Thomson filter is used, then this filter needs to be applied to the livesignal using Math->Arbflt.
Let the output of this filter be Math1.
(If the user has run PAM4 Analysis with its Bessel-Thomson filter enabled,the created filter file can be found in the path specified. Refer to the Bessel-Thomson filter on page 12 section for more information.
5. Disconnect the live signal from the scope.
6. Switch to Math1.
7. On the TekScope menu, go to Measure>Waveform Histograms.
8. Set Histogram Mode to Vert. Set the source to the channel selected in Step 6.
9. Set the Left, Right, Top and Bottom limits to cover the entire graticule.
Using the software
PAM4 Analysis 49

10. On the TekScope menu, select Measure>Histogram Measurements>StandardDeviation.
11. “Hs Std Dev” is now be visible in the Measurement badge – The Mean valueof this is the scope noise RMS value.
Using the software
50 PAM4 Analysis

12. The scope noise RMS value needs to measured for different vertical positionsusing Steps 9 to 11. Calculate the average of these values to obtain the finalscope noise RMS value.
Following the following steps based on the setup:
a. Single-ended input:
a. On the TekScope menu, go to Vertical menu for the live channelconnected to the intended live signal.
b. Set the Position control to several different values across the screen,e.g., -3 div, 0 div and +3 div.
Using the software
PAM4 Analysis 51
c. Measure the noise RMS value for each position using steps 9 to 11.
d. Calculate the average of the different readings as the final scopenoise RMS value.
b. Differential inputs:
a. Suppose Ch1 and Ch3 are used, and are combined using a Mathexpression (possibly combined with de-embedding). Go to Verticalmenu for Ch1 and set the Position to a value, e.g., as +3 div. Go toCh3 and set the position to the inverse value (-3 div in this example).
b. Now measure the scope noise RMS using Steps 9 to 11 on thecorresponding Math channel.
c. Repeat Steps 12.b.i and 12.b.ii with similar combinations, e.g.,{-3 div, +3 div}, {0 div, 0 div}, etc.
d. Calculate the average of the different readings as the final scopenoise RMS value.
Using the software
52 PAM4 Analysis
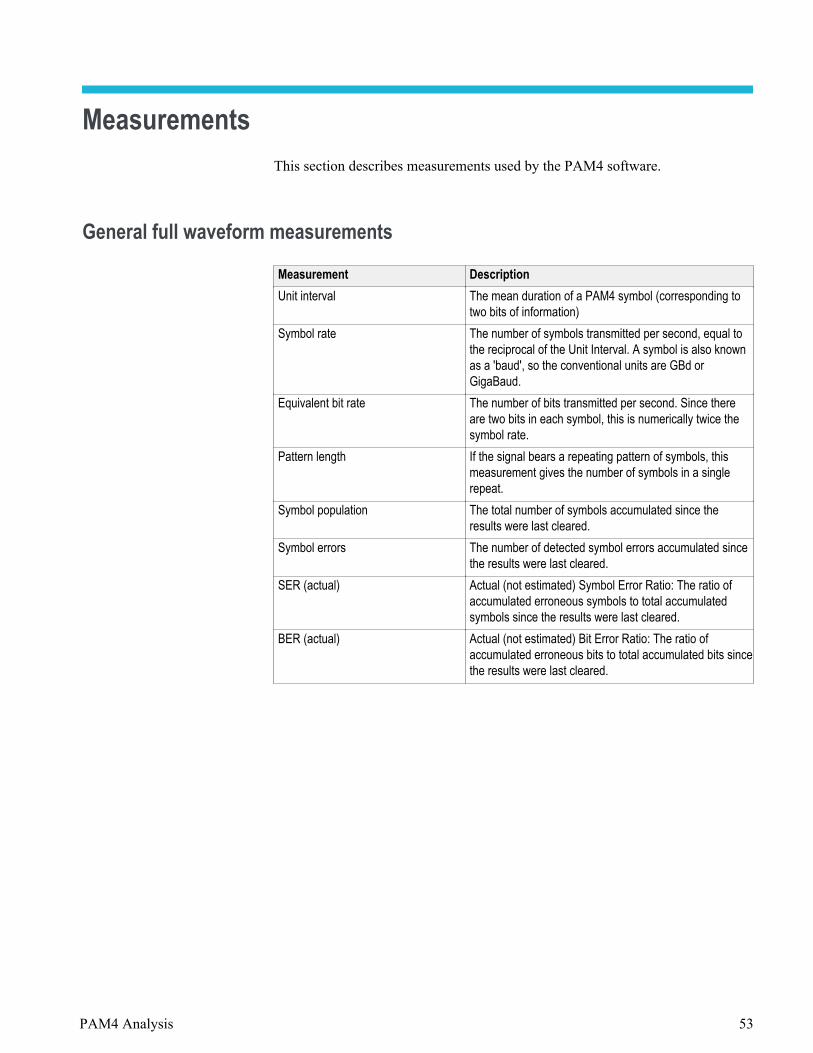
MeasurementsThis section describes measurements used by the PAM4 software.
General full waveform measurements
Measurement DescriptionUnit interval The mean duration of a PAM4 symbol (corresponding to
two bits of information)Symbol rate The number of symbols transmitted per second, equal to
the reciprocal of the Unit Interval. A symbol is also knownas a 'baud', so the conventional units are GBd orGigaBaud.
Equivalent bit rate The number of bits transmitted per second. Since thereare two bits in each symbol, this is numerically twice thesymbol rate.
Pattern length If the signal bears a repeating pattern of symbols, thismeasurement gives the number of symbols in a singlerepeat.
Symbol population The total number of symbols accumulated since theresults were last cleared.
Symbol errors The number of detected symbol errors accumulated sincethe results were last cleared.
SER (actual) Actual (not estimated) Symbol Error Ratio: The ratio ofaccumulated erroneous symbols to total accumulatedsymbols since the results were last cleared.
BER (actual) Actual (not estimated) Bit Error Ratio: The ratio ofaccumulated erroneous bits to total accumulated bits sincethe results were last cleared.
PAM4 Analysis 53
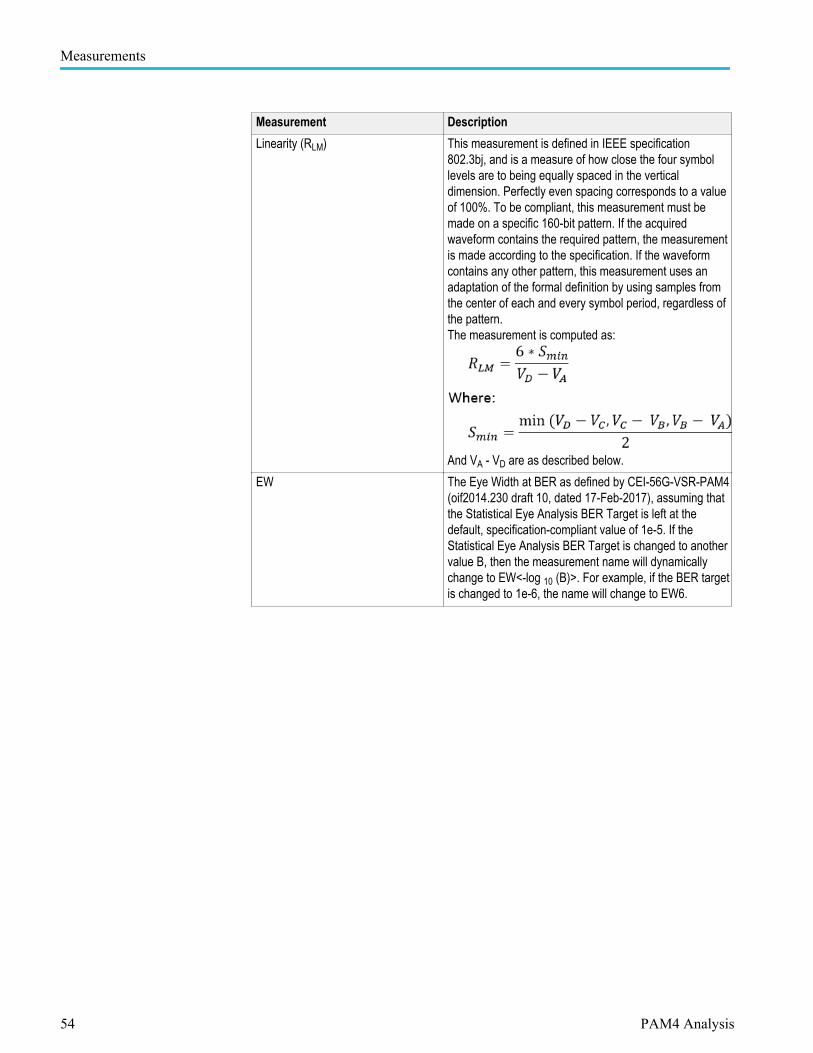
Measurement DescriptionLinearity (RLM) This measurement is defined in IEEE specification
802.3bj, and is a measure of how close the four symbollevels are to being equally spaced in the verticaldimension. Perfectly even spacing corresponds to a valueof 100%. To be compliant, this measurement must bemade on a specific 160-bit pattern. If the acquiredwaveform contains the required pattern, the measurementis made according to the specification. If the waveformcontains any other pattern, this measurement uses anadaptation of the formal definition by using samples fromthe center of each and every symbol period, regardless ofthe pattern.The measurement is computed as:
And VA - VD are as described below.EW The Eye Width at BER as defined by CEI-56G-VSR-PAM4
(oif2014.230 draft 10, dated 17-Feb-2017), assuming thatthe Statistical Eye Analysis BER Target is left at thedefault, specification-compliant value of 1e-5. If theStatistical Eye Analysis BER Target is changed to anothervalue B, then the measurement name will dynamicallychange to EW<-log 10 (B)>. For example, if the BER targetis changed to 1e-6, the name will change to EW6.
Measurements
54 PAM4 Analysis

Measurement DescriptionEH The Eye Height at BER, after compensation for scope
noise (see note). If you configure the BER to 1e-6, themeasurement corresponds to EH6 as defined by CEI-56G-VSRPAM4 (oif2014.230 draft 10, dated 17-Feb-2017). SeeEW, above, for a description of how the measurement’sname automatically adapts as the Statistical Eye AnalysisBER target is changed.
NOTE. Scope noise compensation is performed by post-processing the set of amplitude samples formed by takingthe horizontal center of each symbol, using these steps:
■ remove deterministic data-dependent noise fromeach sample
■ use a spectral approach to identify and removeperiodic amplitude components not correlated to thepattern
■ use a qscale-based approach to separate anynonperiodic bounded noise that may be presen
■ quantify the sigma value for the remaining Gaussiannoise
■ subtract from this sigma the scope noise sigma(using root-sum-squares subtraction)
■ resynthesize the full vertical pdf at the eye center andextract the statistical eye height at the prescribedBER
VEC The Vertical Eye Closure as defined by CEI-56G-VSR-PAM4 (oif2014.230 draft 10, dated 17-Feb-2017). Thevalue is only compliant if the Statistical Eye Analysis BERTarget is 1e-5, which is the default value.
SNDR Signal-to-noise-and-distortion ratio, defined by:
p max Peak amplitude of the linear fit pulse response.σ e Linear fit error, computed as RMS error between
measured signal and linear fit.σ n Vertical noise, computed as an average of RMS deviation
from mean voltage at a fixed point in a run of 8 ones and8 zeroes.
UUGJ Uncorrelated unbounded Gaussian jitter as defined byCEI-56G-MR-PAM4 (OIF2014.245 draft 7, dated 27-June-2016). Requires a minimal symbol population of 107.This measurement is accumulated until the results arecleared.For more details, read OIF-CEI jitter measurements:UUGJ, UBHPJ and Even-Odd Jitter on page 30.
Measurements
PAM4 Analysis 55
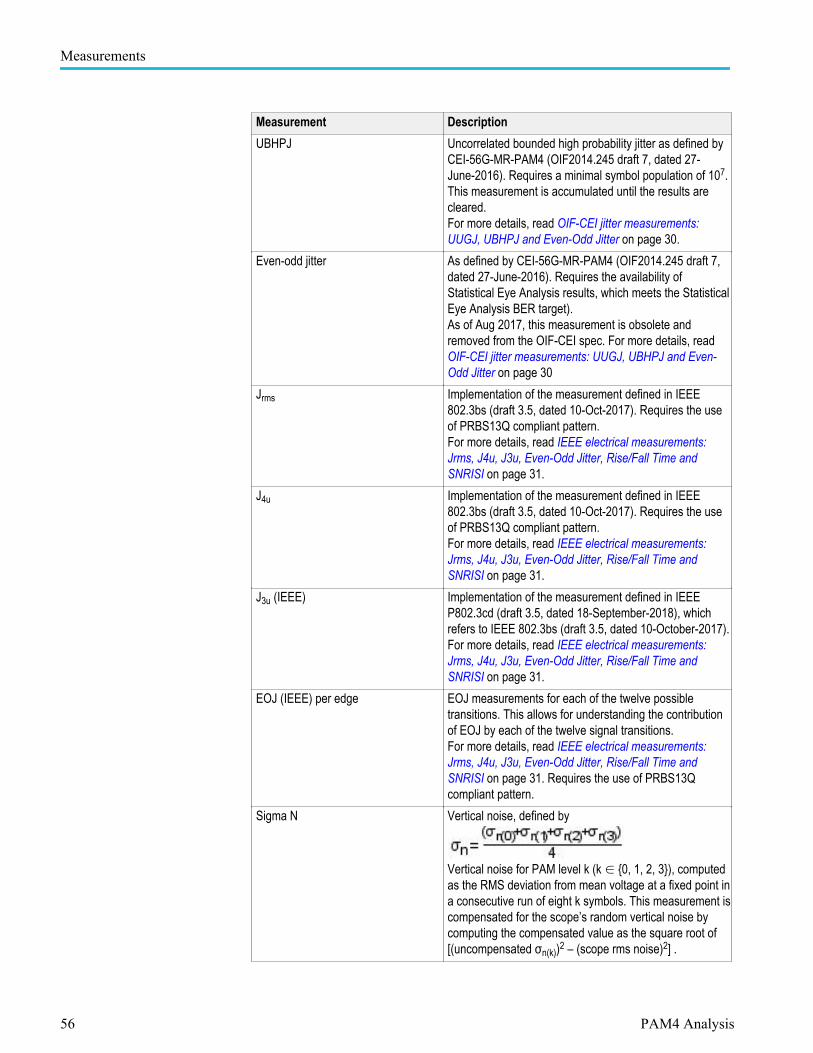
Measurement DescriptionUBHPJ Uncorrelated bounded high probability jitter as defined by
CEI-56G-MR-PAM4 (OIF2014.245 draft 7, dated 27-June-2016). Requires a minimal symbol population of 107.This measurement is accumulated until the results arecleared.For more details, read OIF-CEI jitter measurements:UUGJ, UBHPJ and Even-Odd Jitter on page 30.
Even-odd jitter As defined by CEI-56G-MR-PAM4 (OIF2014.245 draft 7,dated 27-June-2016). Requires the availability ofStatistical Eye Analysis results, which meets the StatisticalEye Analysis BER target).As of Aug 2017, this measurement is obsolete andremoved from the OIF-CEI spec. For more details, read OIF-CEI jitter measurements: UUGJ, UBHPJ and Even-Odd Jitter on page 30
Jrms Implementation of the measurement defined in IEEE802.3bs (draft 3.5, dated 10-Oct-2017). Requires the useof PRBS13Q compliant pattern.For more details, read IEEE electrical measurements:Jrms, J4u, J3u, Even-Odd Jitter, Rise/Fall Time andSNRISI on page 31.
J4u Implementation of the measurement defined in IEEE802.3bs (draft 3.5, dated 10-Oct-2017). Requires the useof PRBS13Q compliant pattern.For more details, read IEEE electrical measurements:Jrms, J4u, J3u, Even-Odd Jitter, Rise/Fall Time andSNRISI on page 31.
J3u (IEEE) Implementation of the measurement defined in IEEEP802.3cd (draft 3.5, dated 18-September-2018), whichrefers to IEEE 802.3bs (draft 3.5, dated 10-October-2017).For more details, read IEEE electrical measurements:Jrms, J4u, J3u, Even-Odd Jitter, Rise/Fall Time andSNRISI on page 31.
EOJ (IEEE) per edge EOJ measurements for each of the twelve possibletransitions. This allows for understanding the contributionof EOJ by each of the twelve signal transitions.For more details, read IEEE electrical measurements:Jrms, J4u, J3u, Even-Odd Jitter, Rise/Fall Time andSNRISI on page 31. Requires the use of PRBS13Qcompliant pattern.
Sigma N Vertical noise, defined by
Vertical noise for PAM level k (k ∈ {0, 1, 2, 3}), computedas the RMS deviation from mean voltage at a fixed point ina consecutive run of eight k symbols. This measurement iscompensated for the scope’s random vertical noise bycomputing the compensated value as the square root of[(uncompensated σn(k))2 – (scope rms noise)2] .
Measurements
56 PAM4 Analysis

Measurement DescriptionEven-odd jitter (IEEE) As defined by IEEE 802.3bs (draft 3.3, dated 28-
July-2017). Requires the use of PRBS13Q compliantpattern.For more details, read IEEE electrical measurements:Jrms, J4u, J3u, Even-Odd Jitter, Rise/Fall Time andSNRISI on page 31.
Rise/Fall time As defined by IEEE 802.3bs (draft 3.3, dated 28-July-2017). Requires the use of PRBS13Q compliantpattern.For more details, read IEEE electrical measurements:Jrms, J4u, J3u, Even-Odd Jitter, Rise/Fall Time andSNRISI on page 31.
SNRISI As defined by IEEE 802.3bs (draft 3.3, dated 28-July-2017). Requires the availability of SNDR results.For more details, read IEEE electrical measurements:Jrms, J4u, J3u, Even-Odd Jitter, Rise/Fall Time andSNRISI on page 31.
ER The ratio of the highest and lowest optical power levels ofa PAM4 optical signal, reported in dB.For more details, read Optical measurements on page 32.
OMAouter The difference between the highest and lowest opticalpower levels of a PAM4 optical signal, reported in W.For more details, read Optical measurements on page 32.
AOP The average power of a PAM4 optical signal, reported indBm.For more details, read Optical measurements on page 32.
TDECQ As defined by IEEE 802.3bs (draft 3.5, dated 10-October-2017).For more details, read IEEE optical measurements onpage 32.
Measurements
PAM4 Analysis 57

Measurements per level in the PAM4 eye
Measurement DescriptionV_D(3) For the top symbol level, this is the voltage at the center of the unit interval
across all instances of that symbol in the complete waveform. The mean,standard deviation and peak-to-peak range are shown. Only the mean value isused in the computation of R LM .
V_C(2) Same as V_D(3), except for the second level from the top.V_B(1) Same as V_D(3), except for the second level from the bottom.V_A(0) Same as V_D(3), except for the bottom level.
Measurements per eye opening (upper, middle, lower) in the PAM4 eye
Measurement DescriptionThreshold The reference voltage level at which the TJ, RJ, and DJ
measurements for that level are made. It may be a valuecalculated automatically by the PAM4 application or amanually-entered value.
Offset The horizontal offset, in time, from the center of the PAM4eye (calculated as ½ of a symbol interval from therecovered clock edges) to the measured center of the eyeas rendered, at the corresponding reference voltage.
TJ@-N The total jitter at a selected Bit Error Rate (BER). Thismeasurement is typically signified as TJ@BER orTJ@1E-12 (for example), but due to space constraints is itshown as TJ@-12 in the graphical user interface's resultstable. There are three TJ columns, and although the BERexponents default to -5, -10 and -15, these values areconfigurable to any value between -1 and -18 on the userpreferences tab. The measurements are made at thereference voltage for the corresponding level.
RJ(d-d) The random jitter, according to the dual-dirac jitter model,at the corresponding reference voltage.
DJ(d-d) The deterministic jitter, according to the dual-dirac jittermodel, at the corresponding reference voltage.
Width The actual eye width of the rendered eye, at thecorresponding reference voltage. This column is onlydisplayed if the Noise Analysis feature (Prefs tab) isdisabled.
Height The actual eye height of the rendered eye at the center ofthe unit interval, for the corresponding (upper, middle orlower) eye. This column is only displayed if the NoiseAnalysis feature (Prefs tab) is disabled.
Measurements
58 PAM4 Analysis
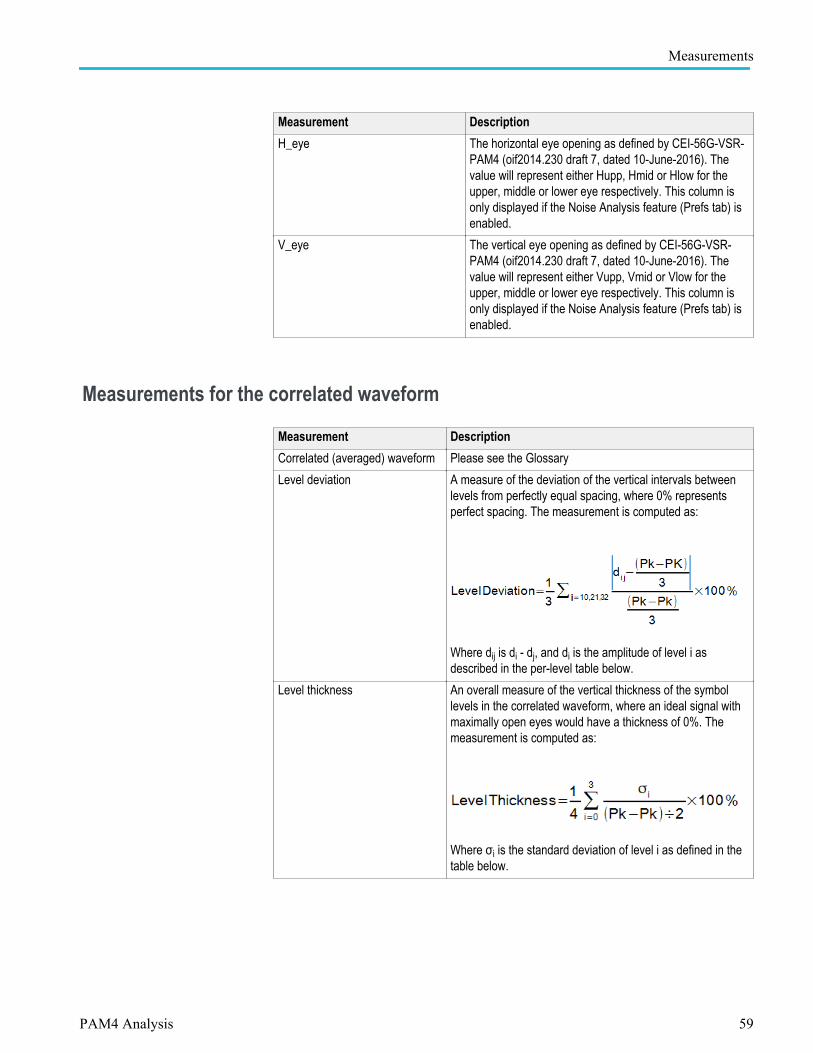
Measurement DescriptionH_eye The horizontal eye opening as defined by CEI-56G-VSR-
PAM4 (oif2014.230 draft 7, dated 10-June-2016). Thevalue will represent either Hupp, Hmid or Hlow for theupper, middle or lower eye respectively. This column isonly displayed if the Noise Analysis feature (Prefs tab) isenabled.
V_eye The vertical eye opening as defined by CEI-56G-VSR-PAM4 (oif2014.230 draft 7, dated 10-June-2016). Thevalue will represent either Vupp, Vmid or Vlow for theupper, middle or lower eye respectively. This column isonly displayed if the Noise Analysis feature (Prefs tab) isenabled.
Measurements for the correlated waveform
Measurement DescriptionCorrelated (averaged) waveform Please see the GlossaryLevel deviation A measure of the deviation of the vertical intervals between
levels from perfectly equal spacing, where 0% representsperfect spacing. The measurement is computed as:
Where dij is di - dj, and di is the amplitude of level i asdescribed in the per-level table below.
Level thickness An overall measure of the vertical thickness of the symbollevels in the correlated waveform, where an ideal signal withmaximally open eyes would have a thickness of 0%. Themeasurement is computed as:
Where σi is the standard deviation of level i as defined in thetable below.
Measurements
PAM4 Analysis 59
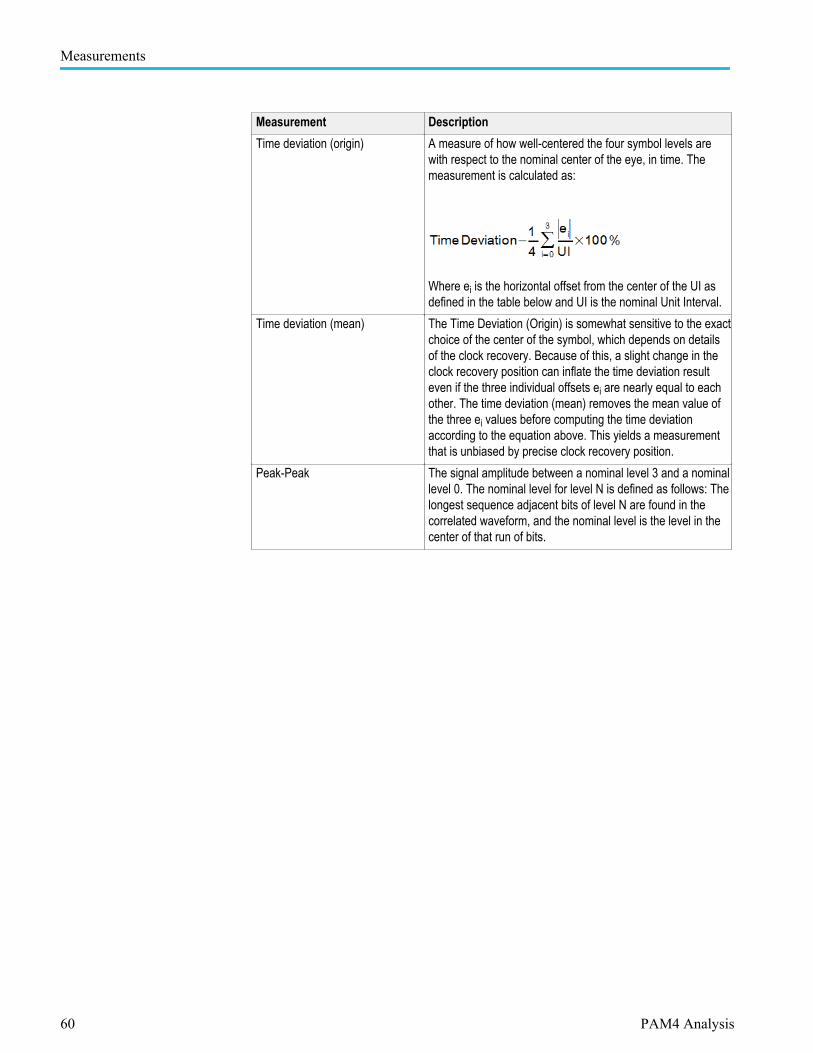
Measurement DescriptionTime deviation (origin) A measure of how well-centered the four symbol levels are
with respect to the nominal center of the eye, in time. Themeasurement is calculated as:
Where ei is the horizontal offset from the center of the UI asdefined in the table below and UI is the nominal Unit Interval.
Time deviation (mean) The Time Deviation (Origin) is somewhat sensitive to the exactchoice of the center of the symbol, which depends on detailsof the clock recovery. Because of this, a slight change in theclock recovery position can inflate the time deviation resulteven if the three individual offsets ei are nearly equal to eachother. The time deviation (mean) removes the mean value ofthe three ei values before computing the time deviationaccording to the equation above. This yields a measurementthat is unbiased by precise clock recovery position.
Peak-Peak The signal amplitude between a nominal level 3 and a nominallevel 0. The nominal level for level N is defined as follows: Thelongest sequence adjacent bits of level N are found in thecorrelated waveform, and the nominal level is the level in thecenter of that run of bits.
Measurements
60 PAM4 Analysis

Measurements per level in the correlated PAM4 eye
Measurement DescriptionMinimum ISI point For each level (0 - 3) in the correlated eye, there exists a
horizontal position across the unit interval where thestandard deviation of the waveform voltage is minimized,so that the level is thinnest at this point. (In theory theremay be more than one point for each level that matchesthis description, but in practice that is seldom a problem.)
Time (e) For each level, the horizontal offset from the Minimum ISIPoint to the nominal center of the eye.
Amplitude (d) For each level, the mean voltage at the Minimum ISI PointStandard deviation (σ) For each level, the standard deviation at the Minimum ISI
Point
Measurements for rise times and fall times
Measurement Description0->3 A set of three measurements of the rise time of the
correlated waveform, from the 0 (lowest) level to the3 (highest) level. From top to bottom the threemeasurements within the set are Maximum, Mean, andMinimum. The measurements are from the 20% to the80% point of the nominal symbol levels shown in the Amp(d) column of the right-hand table on the Results forCorrelated Waveform tab. The other five possible risingtransitions within the PAM4 eye are similarly named. Forexample, the group labeled 1->2 measures the rise timesfrom the 1 level to the 2 level.
3->0 A set of three measurements of the fall time of thecorrelated waveform, from the 3 (highest) level to the0 (lowest) level. The measurements are from the 80% tothe 20% level. See the 0->3 measurement for additionaldetails.
Minimum For a typical test pattern, there are several or manytransitions in each pattern-repeat that make a giventransition type, such as 0->3. The minimum rise or fall timerepresents the fastest such event. If a given transition typeis not represented in the repeating pattern, the minimum isshown as a series of dashes, "---".
Maximum The maximum value for a given transition type is theslowest rise or fall time across all the transitions of thistype. In cases of marginal signal quality, there may besome transitions of a given type that never reach the 20%or 80% value. In this case, the maximum is consideredundefined and the value is displayed as three dashes,"---".
Measurements
PAM4 Analysis 61

Measurement DescriptionMean The Mean value for a given transition type is the average
rise or fall time across all the transitions of this type. If oneor more transitions of a given type never reach the 20% or80% value, it is not possible to calculate a mean valueacross the population. In this case the mean value isdisplayed as three dashes, "---".
Count For a given transition type, such as 0->3, the count is thenumber of times that transition appears in one repetition ofthe pattern. If a transition type doesn't appear at all in apattern, the count is 0. The sum of the counts from the12 transition types may be equal to the pattern length, butit is frequently less. This occurs because wherever thepattern has two or more adjacent symbols of the samevalue, there is no transition.
Measurements
62 PAM4 Analysis

GPIB command referenceYou can use GPIB commands to control the application remotely, and to monitorthe application activity using the application menus. The GPIB commands listedare separate from, and handled differently than, the DPO70000 SeriesOscilloscope GPIB commands. (Note that a TekScope command,APPLICATION:ACTIVATE “PAM4 Analysis”, is used to start the application.)Press here to see the set of available commands (GPIB command reference onpage 63).
Handshaking protocolThe application handles GPIB communications through its own protocolhandshaking.
The requirements for GPIB communications with a controller are as follows:
1. Once the application has started, it writes an “OK” status to the applicationhandshake variable. This tells the controller that it may now write a validcommands into the “pam4” variable.
2. The GPIB controller polls the handshake variable (VARIABLE:VALUE?“pam4”) until it detects the OK status.
3. The GPIB controller writes a command string into the application handshakevariable. For example, sending the command ‘VARIABLE:VALUE “pam4”,“single”’ writes the string “single” into the variable “pam4”.
4. The application GPIB function polls the handshake variable, reads thecommand string and interprets it as a command. If the command is notunderstood, it writes an ERROR handshake value to the variable.
5. A good command is parsed and executed. On successful execution, theapplication writes an OK to the handshake variable. When the GPIBcontroller reads the OK status, it may send a new command string.
PAM4 Analysis 63

Best practice when programming using GPIB commandsTo help users get started with using GPIB commands to operate PAM4 Analysis,an example of automatic testing script written in Python 3.5 is included at the endof this chapter. Although Python is selected here for its readiness to supportinstrument control, most programming languages can be used.
To establish sufficient timing for PAM4 Analysis and TekVISA to correctlytransmit, receive and process GPIB commands, it is recommended to insert 0.5 to1 second delay between consecutive commands during scripting.
You are also advised to routinely query PAM4 status before executing additionalcommands, especially while running time-consuming tasks, such as performing asingle processing cycle. Delay or loss of commands can happen if one is sentwhile PAM4 Analysis is busy executing a previous command.
GPIB commands
APPLICATION:ACTIVATE "PAM4Analysis"
This command instructs the oscilloscope to start the PAM4 application. It is a set-only parameter.(Note that this is a TekScope command, not a PAM4 command, and that the format andcapitalization of the quoted string must be exactly as shown).
Syntax APPLICATION:ACTIVATE "PAM4 Analysis"
Returns None
VARIABLE:VALUE"pam4","version?"
Instructs the PAM4 application to report its version number in response to a subsequent"VARIABLE:VALUE? "pam4"" query.
Syntax VARIABLE:VALUE "pam4","version?" followed by query
VARIABLE:VALUE? "pam4"
Returns Version number of the currently installer PAM4 Analysis. E.g., "OK:10.0.1.1".
VARIABLE:VALUE "pam4","exit" Closes the PAM4 application. The current state of the application is not saved.
Syntax VARIABLE:VALUE "pam4","exit"
Arguments "exit" forces the application to close.
VARIABLE:VALUE? "pam4" Reads the value of the PAM4 handshake variable. If the handshake variable begins with "OK" or"ERROR", the PAM4 application is ready to receive another command. Any other value means thatPAM4 has not finished processing a prior command.
Syntax VARIABLE:VALUE? "pam4"
Arguments None
Returns OK[:<message>] The PAM4 application is ready for a command.
ERROR[:<message>] The PAM4 application encountered a problem with the prior command but isready to accept a new command.
VARIABLE:VALUE "pam4","clear" Clears all measurement result values from prior analysis.
GPIB command reference
64 PAM4 Analysis

Syntax VARIABLE:VALUE "pam4","clear"
VARIABLE:VALUE"pam4","datasource [ch1|ch2|ch3|ch4|math1|ref1]"
Sets the data source (waveform source) to the one designated by the command. May be issuedwith a question mark, in which case a subsequent query of the PAM4 handshake variable willreturn "OK:<source>".
Syntax 1 VARIABLE:VALUE "pam4","datasource [ch1|ch2|ch3|ch4|math1|ref1]"
Syntax 2 VARIABLE:VALUE "pam4","datasource?" followed by query VARIABLE:VALUE? "pam4"
Example 1 VARIABLE:VALUE "pam4", "datasource ch2"
Example 2 VARIABLE:VALUE "pam4", "datasource?"
VARIABLE:VALUE? "pam4" (query returns "OK:CH2")
VARIABLE:VALUE"pam4","default"
Instructs the PAM4 application to recall a factory-default setup file.
Syntax VARIABLE:VALUE "pam4","default"
VARIABLE:VALUE"pam4","lasterror?"
Instructs the PAM4 application to export the latest encountered error.
Syntax VARIABLE:VALUE "pam4","lasterror?"
Example VARIABLE:VALUE "pam4","lasterror?" VARIABLE:VALUE? "pam4" (query returns "OK:Exception:Out of memory")
VARIABLE:VALUE "pam4","probetype [electrical|optical]"
Sets the measurement category to Electrical or Optical from the Select panel. The applicationshows the electrical measurement tree in electrical mode and shows the optical tree when opticalmode is selected.
Syntax 1 VARIABLE:VALUE "pam4", "probetype [electrical|optical]"
Syntax 2 VARIABLE:VALUE "pam4", "probetype?" followed by query
VARIABLE:VALUE? "pam4"
Example 1 VARIABLE:VALUE "pam4", "probetype electrical"
Example 2 VARIABLE:VALUE "pam4", "probetype?"
VARIABLE:VALUE? "pam4" (query returns "OK:Electrical")
VARIABLE:VALUE "pam4","recalc" Instructs the PAM4 application to analyze a single waveform which is already present in the scopememory. Until the processing cycle is complete, the only additional commands that will beprocessed are "state?", "stop" and "exit". All other commands will report an error.
Syntax VARIABLE:VALUE "pam4","recalc"
VARIABLE:VALUE "pam4","recall<filename>"
Instructs the PAM4 application to recall a previously-saved setup file, thereby restoring the priorconfiguration. If the filename does not have a ".psf" extension, one will be appended before recall isattempted. Note that the scope configuration is not affected by this operation.
Syntax VARIABLE:VALUE "pam4","recall <filename>"
Example VARIABLE:VALUE "pam4","recall C:\Users\<username>\p4setups\r1_noEq.psf"
GPIB commands (cont.) GPIB command reference
PAM4 Analysis 65
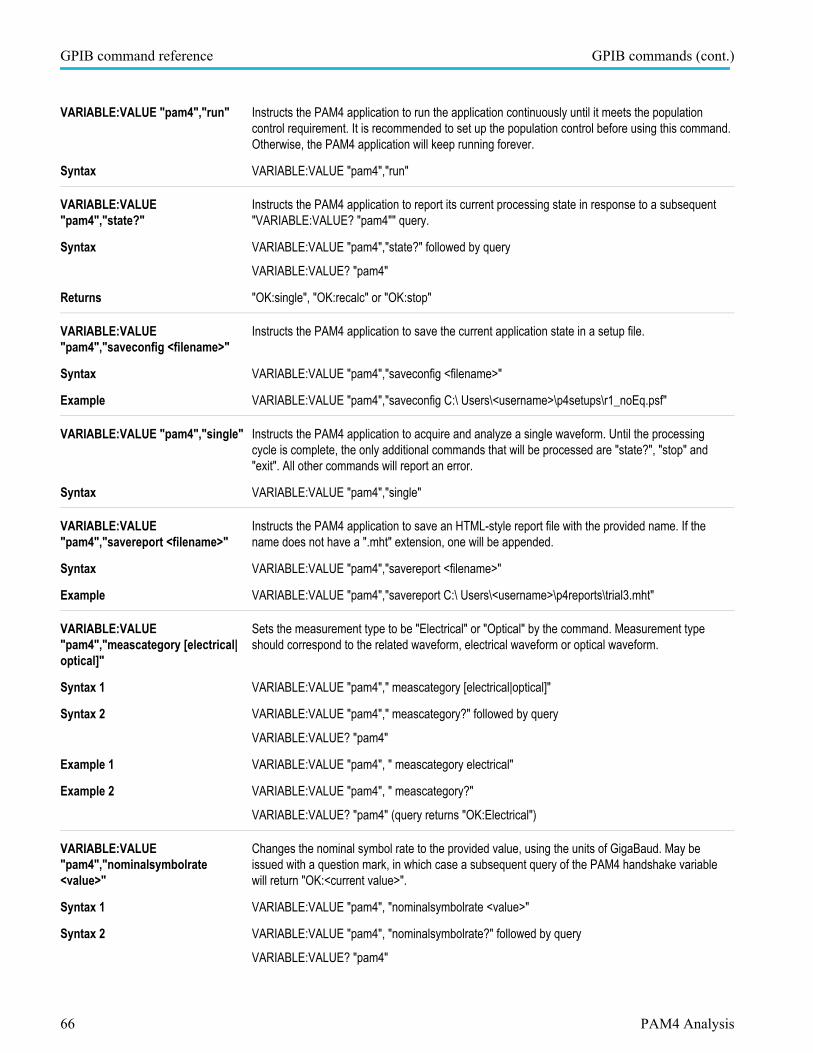
VARIABLE:VALUE "pam4","run" Instructs the PAM4 application to run the application continuously until it meets the populationcontrol requirement. It is recommended to set up the population control before using this command.Otherwise, the PAM4 application will keep running forever.
Syntax VARIABLE:VALUE "pam4","run"
VARIABLE:VALUE"pam4","state?"
Instructs the PAM4 application to report its current processing state in response to a subsequent"VARIABLE:VALUE? "pam4"" query.
Syntax VARIABLE:VALUE "pam4","state?" followed by query
VARIABLE:VALUE? "pam4"
Returns "OK:single", "OK:recalc" or "OK:stop"
VARIABLE:VALUE"pam4","saveconfig <filename>"
Instructs the PAM4 application to save the current application state in a setup file.
Syntax VARIABLE:VALUE "pam4","saveconfig <filename>"
Example VARIABLE:VALUE "pam4","saveconfig C:\ Users\<username>\p4setups\r1_noEq.psf"
VARIABLE:VALUE "pam4","single" Instructs the PAM4 application to acquire and analyze a single waveform. Until the processingcycle is complete, the only additional commands that will be processed are "state?", "stop" and"exit". All other commands will report an error.
Syntax VARIABLE:VALUE "pam4","single"
VARIABLE:VALUE"pam4","savereport <filename>"
Instructs the PAM4 application to save an HTML-style report file with the provided name. If thename does not have a ".mht" extension, one will be appended.
Syntax VARIABLE:VALUE "pam4","savereport <filename>"
Example VARIABLE:VALUE "pam4","savereport C:\ Users\<username>\p4reports\trial3.mht"
VARIABLE:VALUE"pam4","meascategory [electrical|optical]"
Sets the measurement type to be "Electrical" or "Optical" by the command. Measurement typeshould correspond to the related waveform, electrical waveform or optical waveform.
Syntax 1 VARIABLE:VALUE "pam4"," meascategory [electrical|optical]"
Syntax 2 VARIABLE:VALUE "pam4"," meascategory?" followed by query
VARIABLE:VALUE? "pam4"
Example 1 VARIABLE:VALUE "pam4", " meascategory electrical"
Example 2 VARIABLE:VALUE "pam4", " meascategory?"
VARIABLE:VALUE? "pam4" (query returns "OK:Electrical")
VARIABLE:VALUE"pam4","nominalsymbolrate<value>"
Changes the nominal symbol rate to the provided value, using the units of GigaBaud. May beissued with a question mark, in which case a subsequent query of the PAM4 handshake variablewill return "OK:<current value>".
Syntax 1 VARIABLE:VALUE "pam4", "nominalsymbolrate <value>"
Syntax 2 VARIABLE:VALUE "pam4", "nominalsymbolrate?" followed by query
VARIABLE:VALUE? "pam4"
GPIB command reference GPIB commands (cont.)
66 PAM4 Analysis

Example 1 VARIABLE:VALUE "pam4", "nominalsymbolrate 25.0"
Example 2 VARIABLE:VALUE "pam4", "nominalsymbolrate?"
VARIABLE:VALUE? "pam4" (query returns "OK:25000000000")
VARIABLE:VALUE"pam4","nominalbitrate <value>"
Changes the bit rate to the provided value using the units, Gigabit. It refers to the "User Guided"(Gbps) under “Data Rate” in the UI, as shown the figure below. It may be issued with a questionmark, in which case a subsequent query of the PAM4 handshake variable will return "OK:<currentvalue>". Symbolrate will be automatically updated to be half the value of nominalbitrate.
Syntax 1 VARIABLE:VALUE "pam4", "nominalbitrate <value>"
Syntax 2 VARIABLE:VALUE "pam4", "nominalbitrate?" followed by query
VARIABLE:VALUE? "pam4"
Example 1 VARIABLE:VALUE "pam4", "nominalbitrate 50.0"
Example 2 VARIABLE:VALUE "pam4", "nominalbitrate?"
VARIABLE:VALUE? "pam4" (query returns "OK:50000000000")
Figure 1: Data rate mapping of PI command
VARIABLE:VALUE "pam4","thresholdauto <value>"
Sets the thresholds to be automatically or manually adjusted. The values are [0 1]. One meansthresh hold auto adjust is on, zero means it is off.
Syntax 1 VARIABLE:VALUE "pam4", "thresholdauto <value>"
Syntax 2 VARIABLE:VALUE "pam4", "thresholdauto?" followed by query
VARIABLE:VALUE? "pam4"
Example 1 VARIABLE:VALUE "pam4", "thresholdauto 0"
Example 2 VARIABLE:VALUE "pam4", "thresholdauto?"
VARIABLE:VALUE? "pam4" (query returns "OK:0")
VARIABLE:VALUE "pam4","thresholdhigh <value>"
Sets the thresholds high reference in mV.
Syntax 1 VARIABLE:VALUE "pam4", "thresholdhigh <value>"
Syntax 2 VARIABLE:VALUE "pam4", "thresholdhigh?" followed by query
VARIABLE:VALUE? "pam4"
Example 1 VARIABLE:VALUE "pam4", "thresholdhigh 78"
GPIB commands (cont.) GPIB command reference
PAM4 Analysis 67
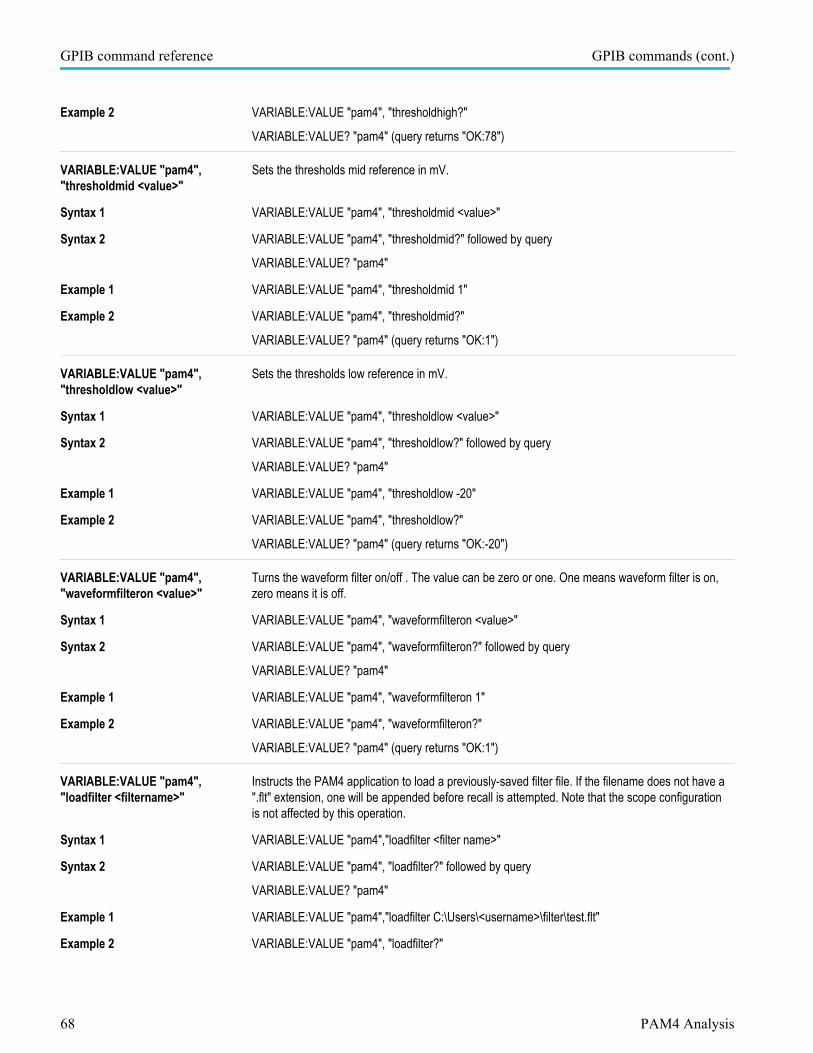
Example 2 VARIABLE:VALUE "pam4", "thresholdhigh?"
VARIABLE:VALUE? "pam4" (query returns "OK:78")
VARIABLE:VALUE "pam4","thresholdmid <value>"
Sets the thresholds mid reference in mV.
Syntax 1 VARIABLE:VALUE "pam4", "thresholdmid <value>"
Syntax 2 VARIABLE:VALUE "pam4", "thresholdmid?" followed by query
VARIABLE:VALUE? "pam4"
Example 1 VARIABLE:VALUE "pam4", "thresholdmid 1"
Example 2 VARIABLE:VALUE "pam4", "thresholdmid?"
VARIABLE:VALUE? "pam4" (query returns "OK:1")
VARIABLE:VALUE "pam4","thresholdlow <value>"
Sets the thresholds low reference in mV.
Syntax 1 VARIABLE:VALUE "pam4", "thresholdlow <value>"
Syntax 2 VARIABLE:VALUE "pam4", "thresholdlow?" followed by query
VARIABLE:VALUE? "pam4"
Example 1 VARIABLE:VALUE "pam4", "thresholdlow -20"
Example 2 VARIABLE:VALUE "pam4", "thresholdlow?"
VARIABLE:VALUE? "pam4" (query returns "OK:-20")
VARIABLE:VALUE "pam4","waveformfilteron <value>"
Turns the waveform filter on/off . The value can be zero or one. One means waveform filter is on,zero means it is off.
Syntax 1 VARIABLE:VALUE "pam4", "waveformfilteron <value>"
Syntax 2 VARIABLE:VALUE "pam4", "waveformfilteron?" followed by query
VARIABLE:VALUE? "pam4"
Example 1 VARIABLE:VALUE "pam4", "waveformfilteron 1"
Example 2 VARIABLE:VALUE "pam4", "waveformfilteron?"
VARIABLE:VALUE? "pam4" (query returns "OK:1")
VARIABLE:VALUE "pam4","loadfilter <filtername>"
Instructs the PAM4 application to load a previously-saved filter file. If the filename does not have a".flt" extension, one will be appended before recall is attempted. Note that the scope configurationis not affected by this operation.
Syntax 1 VARIABLE:VALUE "pam4","loadfilter <filter name>"
Syntax 2 VARIABLE:VALUE "pam4", "loadfilter?" followed by query
VARIABLE:VALUE? "pam4"
Example 1 VARIABLE:VALUE "pam4","loadfilter C:\Users\<username>\filter\test.flt"
Example 2 VARIABLE:VALUE "pam4", "loadfilter?"
GPIB command reference GPIB commands (cont.)
68 PAM4 Analysis

VARIABLE:VALUE? "pam4" (query returns "OK: C:\Users\<username>\filter\test.flt")
VARIABLE:VALUE "pam4", "ctleon<value>"
Turns CTLE on/off . The value can be zero or one. One means CTLE is on, zero means it is off.
Syntax 1 VARIABLE:VALUE "pam4", "ctleon [1|0]"
Syntax 2 VARIABLE:VALUE "pam4", "ctleon?" followed by query
VARIABLE:VALUE? "pam4"
Example 1 VARIABLE:VALUE "pam4", "ctleon 1"
Example 2 VARIABLE:VALUE "pam4", "ctleon?"
VARIABLE:VALUE? "pam4" (query returns "OK:1")
VARIABLE:VALUE "pam4","ctletype <value>"
Sets the type of CTLE you wish to use. The normally available types are [Custom, OIF-CEI Gen I,OIF-CEI Gen II, IEEE 802.3bs Draft 3.1], which have the following characteristics:
■ Custom: Allows free access to individual CTLE parameters
■ OIF-CEI Gen I: Offers preset parameter sets for 2-pole, 1-zero CTLE designs published by theearly OIF-CEI standards
■ OIF-CEI Gen II: Offers preset parameter sets for 3-pole, 2-zero CTLE designs published inOIF-CEI drafts as of March 2017
■ IEEE 802.3bs Draft 3.1: Offers preset parameter sets for 3-pole, 2-zero CTLE designspublished in IEEE 802.3bs Draft 3.1
Groups of CTLE presets are controlled by xml files, so more types may be added periodically. Ifadditional entries appear in the CTLE Type field in the graphical user interface when you run theapplication, you can select any of those types by using the same string in the ctletype remotecommand.
Syntax 1 VARIABLE:VALUE "pam4", "ctletype [Custom|OIF-CEI Gen I|OIF-CEI Gen II|IEEE 802.3bs Draft3.1]"
Syntax 2 VARIABLE:VALUE "pam4", "ctletype?" followed by query
VARIABLE:VALUE? "pam4"
Example 1 VARIABLE:VALUE "pam4", "ctletype OIF-CEI Gen II"
Example 2 VARIABLE:VALUE "pam4", "ctletype?"
VARIABLE:VALUE? "pam4" (query returns "OK:OIF-CEI Gen II")
VARIABLE:VALUE "pam4","ctledesign <value>"
If the CTLE Type is Custom, sets whether the CTLE offers 2 poles and 1 zero (generally used byearly versions of both OIF-CEI and IEEE spec) or 3 poles and 2 zeros (used by later specversions). The values can be [3 Poles + 2 Zeros, 2 Poles + 1 Zero].
If the CTLE Type is other than "Custom", the choice of CTLE Design can still be set or queried, butwill not be active until the Type is changed to "Custom".
Syntax 1 VARIABLE:VALUE "pam4", "ctledesign [3 Poles + 2 Zeros|2 Poles + 1 Zero]"
Syntax 2 VARIABLE:VALUE "pam4", "ctledesign?" followed by query
VARIABLE:VALUE? "pam4"
Example 1 VARIABLE:VALUE "pam4", "ctledesign 2 Poles + 1 Zero"
GPIB commands (cont.) GPIB command reference
PAM4 Analysis 69
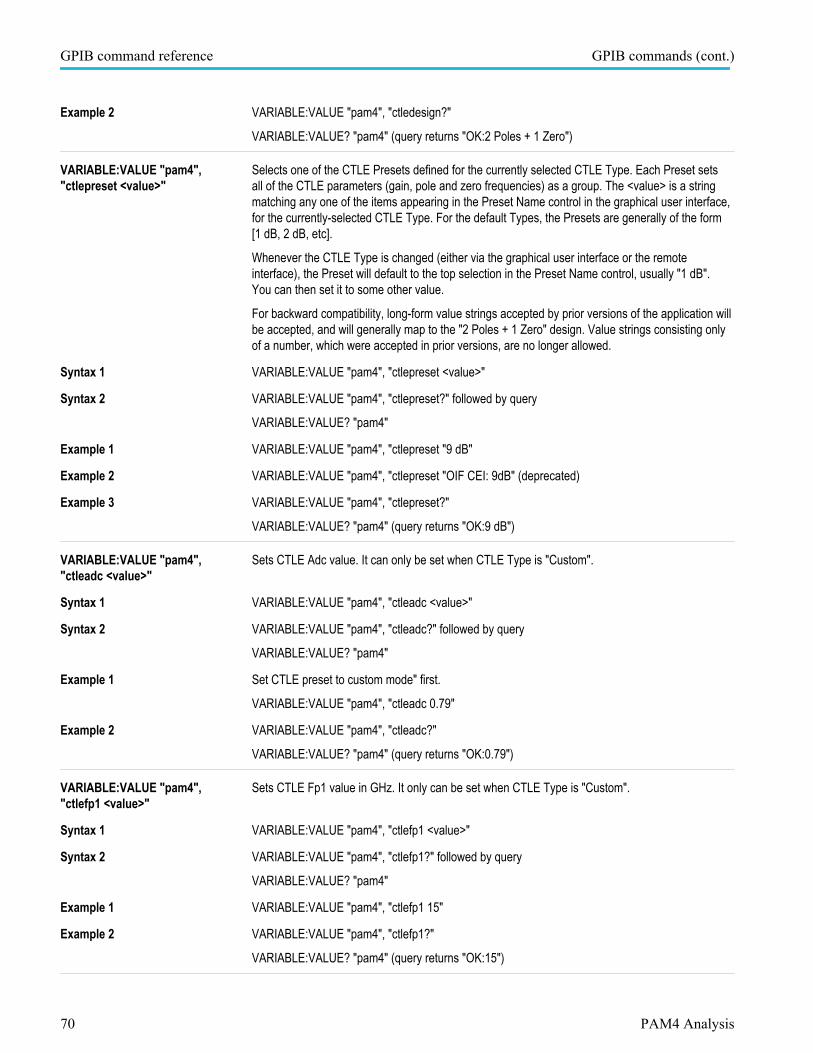
Example 2 VARIABLE:VALUE "pam4", "ctledesign?"
VARIABLE:VALUE? "pam4" (query returns "OK:2 Poles + 1 Zero")
VARIABLE:VALUE "pam4","ctlepreset <value>"
Selects one of the CTLE Presets defined for the currently selected CTLE Type. Each Preset setsall of the CTLE parameters (gain, pole and zero frequencies) as a group. The <value> is a stringmatching any one of the items appearing in the Preset Name control in the graphical user interface,for the currently-selected CTLE Type. For the default Types, the Presets are generally of the form[1 dB, 2 dB, etc].
Whenever the CTLE Type is changed (either via the graphical user interface or the remoteinterface), the Preset will default to the top selection in the Preset Name control, usually "1 dB".You can then set it to some other value.
For backward compatibility, long-form value strings accepted by prior versions of the application willbe accepted, and will generally map to the "2 Poles + 1 Zero" design. Value strings consisting onlyof a number, which were accepted in prior versions, are no longer allowed.
Syntax 1 VARIABLE:VALUE "pam4", "ctlepreset <value>"
Syntax 2 VARIABLE:VALUE "pam4", "ctlepreset?" followed by query
VARIABLE:VALUE? "pam4"
Example 1 VARIABLE:VALUE "pam4", "ctlepreset "9 dB"
Example 2 VARIABLE:VALUE "pam4", "ctlepreset "OIF CEI: 9dB" (deprecated)
Example 3 VARIABLE:VALUE "pam4", "ctlepreset?"
VARIABLE:VALUE? "pam4" (query returns "OK:9 dB")
VARIABLE:VALUE "pam4","ctleadc <value>"
Sets CTLE Adc value. It can only be set when CTLE Type is "Custom".
Syntax 1 VARIABLE:VALUE "pam4", "ctleadc <value>"
Syntax 2 VARIABLE:VALUE "pam4", "ctleadc?" followed by query
VARIABLE:VALUE? "pam4"
Example 1 Set CTLE preset to custom mode" first.
VARIABLE:VALUE "pam4", "ctleadc 0.79"
Example 2 VARIABLE:VALUE "pam4", "ctleadc?"
VARIABLE:VALUE? "pam4" (query returns "OK:0.79")
VARIABLE:VALUE "pam4","ctlefp1 <value>"
Sets CTLE Fp1 value in GHz. It only can be set when CTLE Type is "Custom".
Syntax 1 VARIABLE:VALUE "pam4", "ctlefp1 <value>"
Syntax 2 VARIABLE:VALUE "pam4", "ctlefp1?" followed by query
VARIABLE:VALUE? "pam4"
Example 1 VARIABLE:VALUE "pam4", "ctlefp1 15"
Example 2 VARIABLE:VALUE "pam4", "ctlefp1?"
VARIABLE:VALUE? "pam4" (query returns "OK:15")
GPIB command reference GPIB commands (cont.)
70 PAM4 Analysis

VARIABLE:VALUE "pam4","ctlefp2 <value>"
Sets CTLE Fp2 value in GHz. It only can be set when CTLE Type is "Custom".
Syntax 1 VARIABLE:VALUE "pam4", "ctlefp2 <value>"
Syntax 2 VARIABLE:VALUE "pam4", "ctlefp2?" followed by query
VARIABLE:VALUE? "pam4"
Example 1 VARIABLE:VALUE "pam4", "ctlefp2 20"
Example 2 VARIABLE:VALUE "pam4", "ctlefp2?"
VARIABLE:VALUE? "pam4" (query returns "OK:20")
VARIABLE:VALUE "pam4","ctlefp3 <value>"
Sets CTLE Fp3 value in GHz. It only can be set when CTLE Type is "Custom" and CTLE Design is"3 Poles + 2 Zeros".
Syntax 1 VARIABLE:VALUE "pam4", "ctlefp3 <value>"
Syntax 2 VARIABLE:VALUE "pam4", "ctlefp3?" followed by query
VARIABLE:VALUE? "pam4"
Example 1 VARIABLE:VALUE "pam4", "ctlefp3 1.2"
Example 2 VARIABLE:VALUE "pam4", "ctlefp3?"
VARIABLE:VALUE? "pam4" (query returns "OK:1.2")
VARIABLE:VALUE "pam4", "ctlefz<value>"
Sets CTLE Fz value in GHz. It only can be set when CTLE Type is "Custom".
Syntax 1 VARIABLE:VALUE "pam4", "ctlefz <value>"
Syntax 2 VARIABLE:VALUE "pam4", "ctlefz?" followed by query
VARIABLE:VALUE? "pam4"
Example 1 VARIABLE:VALUE "pam4", "ctlefz 7.55"
Example 2 VARIABLE:VALUE "pam4", "ctlefz?"
VARIABLE:VALUE? "pam4" (query returns "OK:7.55")
VARIABLE:VALUE "pam4", "ctlefz2<value>"
Sets CTLE Fz2 value in GHz. It only can be set when CTLE Type is "Custom" and CTLE Design is"3 Poles + 2 Zeros".
Syntax 1 VARIABLE:VALUE "pam4", "ctlefz2 <value>"
Syntax 2 VARIABLE:VALUE "pam4", "ctlefz2?" followed by query
VARIABLE:VALUE? "pam4"
Example 1 VARIABLE:VALUE "pam4", "ctlefz2 1.05"
Example 2 VARIABLE:VALUE "pam4", "ctlefz2?"
VARIABLE:VALUE? "pam4" (query returns "OK:1.05")
VARIABLE:VALUE "pam4", "dfeon<value>"
Turns DFE on/off . The value can be zero or one. One means DFE is on, zero means it is off.
GPIB commands (cont.) GPIB command reference
PAM4 Analysis 71
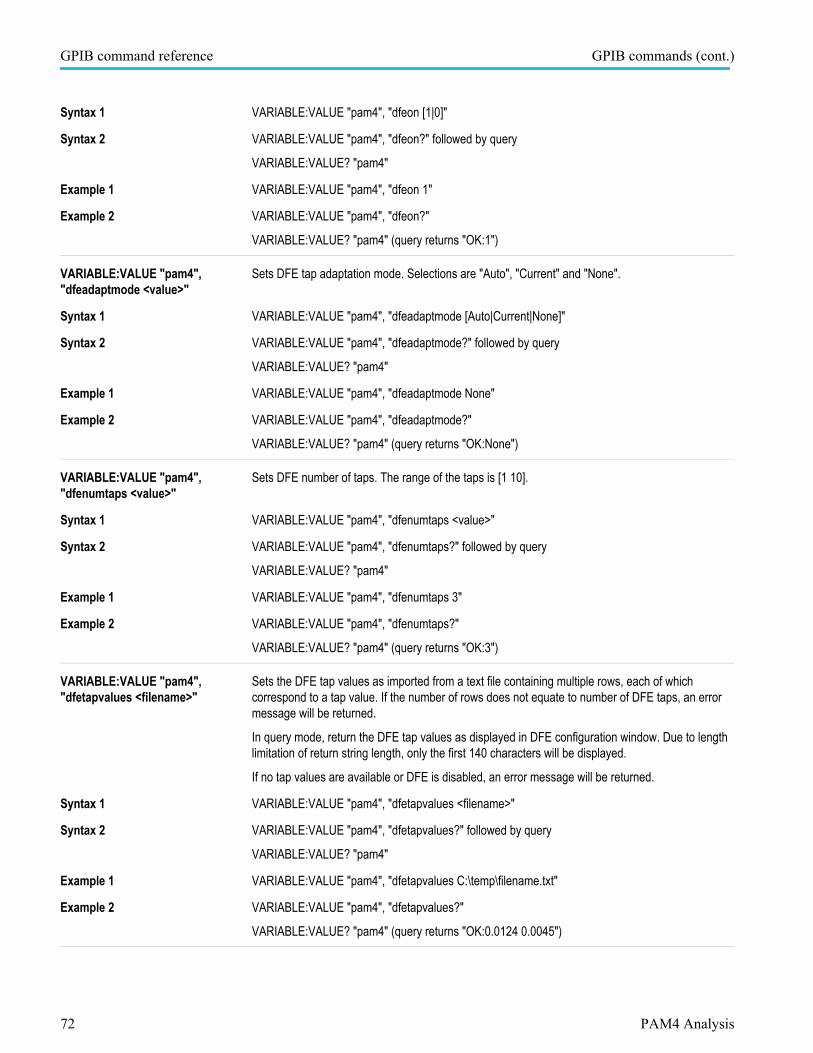
Syntax 1 VARIABLE:VALUE "pam4", "dfeon [1|0]"
Syntax 2 VARIABLE:VALUE "pam4", "dfeon?" followed by query
VARIABLE:VALUE? "pam4"
Example 1 VARIABLE:VALUE "pam4", "dfeon 1"
Example 2 VARIABLE:VALUE "pam4", "dfeon?"
VARIABLE:VALUE? "pam4" (query returns "OK:1")
VARIABLE:VALUE "pam4","dfeadaptmode <value>"
Sets DFE tap adaptation mode. Selections are "Auto", "Current" and "None".
Syntax 1 VARIABLE:VALUE "pam4", "dfeadaptmode [Auto|Current|None]"
Syntax 2 VARIABLE:VALUE "pam4", "dfeadaptmode?" followed by query
VARIABLE:VALUE? "pam4"
Example 1 VARIABLE:VALUE "pam4", "dfeadaptmode None"
Example 2 VARIABLE:VALUE "pam4", "dfeadaptmode?"
VARIABLE:VALUE? "pam4" (query returns "OK:None")
VARIABLE:VALUE "pam4","dfenumtaps <value>"
Sets DFE number of taps. The range of the taps is [1 10].
Syntax 1 VARIABLE:VALUE "pam4", "dfenumtaps <value>"
Syntax 2 VARIABLE:VALUE "pam4", "dfenumtaps?" followed by query
VARIABLE:VALUE? "pam4"
Example 1 VARIABLE:VALUE "pam4", "dfenumtaps 3"
Example 2 VARIABLE:VALUE "pam4", "dfenumtaps?"
VARIABLE:VALUE? "pam4" (query returns "OK:3")
VARIABLE:VALUE "pam4","dfetapvalues <filename>"
Sets the DFE tap values as imported from a text file containing multiple rows, each of whichcorrespond to a tap value. If the number of rows does not equate to number of DFE taps, an errormessage will be returned.
In query mode, return the DFE tap values as displayed in DFE configuration window. Due to lengthlimitation of return string length, only the first 140 characters will be displayed.
If no tap values are available or DFE is disabled, an error message will be returned.
Syntax 1 VARIABLE:VALUE "pam4", "dfetapvalues <filename>"
Syntax 2 VARIABLE:VALUE "pam4", "dfetapvalues?" followed by query
VARIABLE:VALUE? "pam4"
Example 1 VARIABLE:VALUE "pam4", "dfetapvalues C:\temp\filename.txt"
Example 2 VARIABLE:VALUE "pam4", "dfetapvalues?"
VARIABLE:VALUE? "pam4" (query returns "OK:0.0124 0.0045")
GPIB command reference GPIB commands (cont.)
72 PAM4 Analysis

VARIABLE:VALUE "pam4", "ffeon<value>"
Turns FFE on/off. The value can be zero or one. One means FFE is on, zero means it is off.
Syntax 1 VARIABLE:VALUE "pam4", "ffeon [1|0]"
Syntax 2 VARIABLE:VALUE "pam4", "ffeon?" followed by query
VARIABLE:VALUE? "pam4"
Example 1 VARIABLE:VALUE "pam4", "ffeon 1"
Example 2 VARIABLE:VALUE "pam4", "ffeon?"
VARIABLE:VALUE? "pam4" (query returns "OK:1")
VARIABLE:VALUE "pam4","ffeadaptmode <value>"
Sets FFE tap adaptation mode. Selections are "Auto", "Current" and "None".
Syntax 1 VARIABLE:VALUE "pam4", "ffeadaptmode [Auto|Current|None]"
Syntax 2 VARIABLE:VALUE "pam4", "ffeadaptmode?" followed by query
VARIABLE:VALUE? "pam4"
Example 1 VARIABLE:VALUE "pam4", "ffeadaptmode None"
Example 2 VARIABLE:VALUE "pam4", "ffeadaptmode?"
VARIABLE:VALUE? "pam4" (query returns "OK:None")
VARIABLE:VALUE "pam4","ffenumtaps <value>"
Sets FFE number of taps. The range of the taps is [0 25].
Syntax 1 VARIABLE:VALUE "pam4", "ffenumtaps <value>"
Syntax 2 VARIABLE:VALUE "pam4", "ffenumtaps?" followed by query
VARIABLE:VALUE? "pam4"
Example 1 VARIABLE:VALUE "pam4", "ffenumtaps 7"
Example 2 VARIABLE:VALUE "pam4", "ffenumtaps?"
VARIABLE:VALUE? "pam4" (query returns "OK:7")
VARIABLE:VALUE "pam4","ffereftap <value>"
Sets number of precursor taps for FFE. The range of the value is [1 10]. There are restrictionsabout its value, please refer to online help FFE section.
Syntax 1 VARIABLE:VALUE "pam4", "ffereftap <value>"
Syntax 2 VARIABLE:VALUE "pam4", "ffereftap?" followed by query
VARIABLE:VALUE? "pam4"
Example 1 VARIABLE:VALUE "pam4", "ffereftap 1"
Example 2 VARIABLE:VALUE "pam4", "ffereftap?"
VARIABLE:VALUE? "pam4" (query returns "OK:1")
VARIABLE:VALUE "pam4","ffetapspersymbol <value>"
Sets number of taps per unit interval (symbol) for FFE. The range of the value is [1 10]. There aresome restrictions about its value, please refer to online help FFE section.
GPIB commands (cont.) GPIB command reference
PAM4 Analysis 73

Syntax 1 VARIABLE:VALUE "pam4", "ffetapspersymbol <value>"
Syntax 2 VARIABLE:VALUE "pam4", "ffetapspersymbol?" followed by query
VARIABLE:VALUE? "pam4"
Example 1 VARIABLE:VALUE "pam4", "ffetapspersymbol 2"
Example 2 VARIABLE:VALUE "pam4", "ffetapspersymbol?"
VARIABLE:VALUE? "pam4" (query returns "OK:2")
VARIABLE:VALUE "pam4","ffetapvalues <filename>"
Sets the FFE tap values as imported from a text file containing multiple rows, each of whichcorrespond to a tap value. If the number of rows does not equate to number of FFE taps, an errormessage will be returned.
In query mode, return the FFE tap values as displayed in FFE configuration window. Due to lengthlimitation of return string length, only the first 140 characters will be displayed. If no tap values areavailable or FFE is disabled, an error message will be returned.
Syntax 1 VARIABLE:VALUE "pam4", "ffetapvalues <filename>"
Syntax 2 VARIABLE:VALUE "pam4", "ffetapvalues?" followed by query
VARIABLE:VALUE? "pam4"
Example 1 VARIABLE:VALUE "pam4", "ffetapvalues C:\temp\filename.txt"
Example 2 VARIABLE:VALUE "pam4", "ffetapvalues?"
VARIABLE:VALUE? "pam4" (query returns "OK:1.0644 -0.1053")
VARIABLE:VALUE "pam4","savelog <filename>"
Saves the log to a file. Filename includes the file path as well. If the file path or file name is notcorrect, it will return an error message when performing query.
Syntax 1 VARIABLE:VALUE "pam4", "savelog <filename>"
Syntax 2 VARIABLE:VALUE "pam4", "savelog?" followed by query
VARIABLE:VALUE? "pam4"
Example 1 VARIABLE:VALUE "pam4", "savelog
C:\Users\<username>\Tektronix\TekApplications\PAM4\test.txt"
Example 2 VARIABLE:VALUE "pam4", "savelog?"
VARIABLE:VALUE? "pam4"
(query returns "OK:
C:\Users\<username>\Tektronix\TekApplications\PAM4\test.txt")
VARIABLE:VALUE "pam4","clearlog"
Clears the log in the log tab.
Syntax VARIABLE:VALUE "pam4", "clearlog"
Example VARIABLE:VALUE "pam4", "clearlog"
GPIB command reference GPIB commands (cont.)
74 PAM4 Analysis
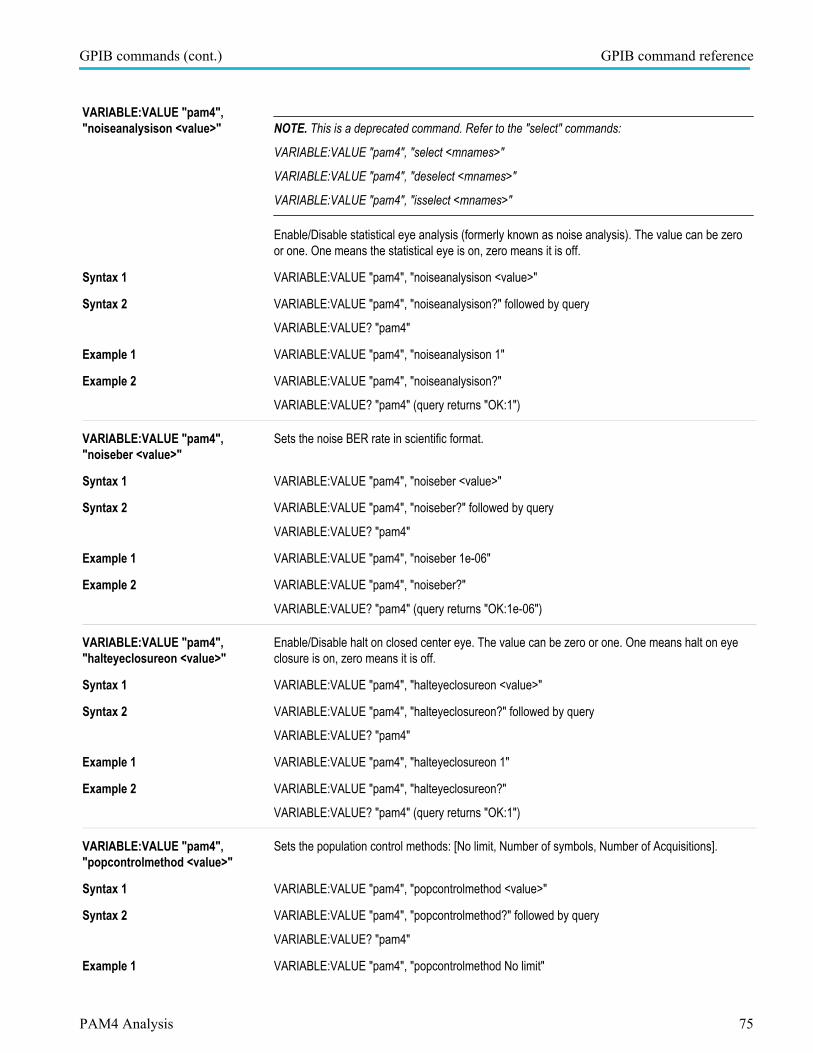
VARIABLE:VALUE "pam4","noiseanalysison <value>" NOTE. This is a deprecated command. Refer to the "select" commands:
VARIABLE:VALUE "pam4", "select <mnames>"
VARIABLE:VALUE "pam4", "deselect <mnames>"
VARIABLE:VALUE "pam4", "isselect <mnames>"
Enable/Disable statistical eye analysis (formerly known as noise analysis). The value can be zeroor one. One means the statistical eye is on, zero means it is off.
Syntax 1 VARIABLE:VALUE "pam4", "noiseanalysison <value>"
Syntax 2 VARIABLE:VALUE "pam4", "noiseanalysison?" followed by query
VARIABLE:VALUE? "pam4"
Example 1 VARIABLE:VALUE "pam4", "noiseanalysison 1"
Example 2 VARIABLE:VALUE "pam4", "noiseanalysison?"
VARIABLE:VALUE? "pam4" (query returns "OK:1")
VARIABLE:VALUE "pam4","noiseber <value>"
Sets the noise BER rate in scientific format.
Syntax 1 VARIABLE:VALUE "pam4", "noiseber <value>"
Syntax 2 VARIABLE:VALUE "pam4", "noiseber?" followed by query
VARIABLE:VALUE? "pam4"
Example 1 VARIABLE:VALUE "pam4", "noiseber 1e-06"
Example 2 VARIABLE:VALUE "pam4", "noiseber?"
VARIABLE:VALUE? "pam4" (query returns "OK:1e-06")
VARIABLE:VALUE "pam4","halteyeclosureon <value>"
Enable/Disable halt on closed center eye. The value can be zero or one. One means halt on eyeclosure is on, zero means it is off.
Syntax 1 VARIABLE:VALUE "pam4", "halteyeclosureon <value>"
Syntax 2 VARIABLE:VALUE "pam4", "halteyeclosureon?" followed by query
VARIABLE:VALUE? "pam4"
Example 1 VARIABLE:VALUE "pam4", "halteyeclosureon 1"
Example 2 VARIABLE:VALUE "pam4", "halteyeclosureon?"
VARIABLE:VALUE? "pam4" (query returns "OK:1")
VARIABLE:VALUE "pam4","popcontrolmethod <value>"
Sets the population control methods: [No limit, Number of symbols, Number of Acquisitions].
Syntax 1 VARIABLE:VALUE "pam4", "popcontrolmethod <value>"
Syntax 2 VARIABLE:VALUE "pam4", "popcontrolmethod?" followed by query
VARIABLE:VALUE? "pam4"
Example 1 VARIABLE:VALUE "pam4", "popcontrolmethod No limit"
GPIB commands (cont.) GPIB command reference
PAM4 Analysis 75
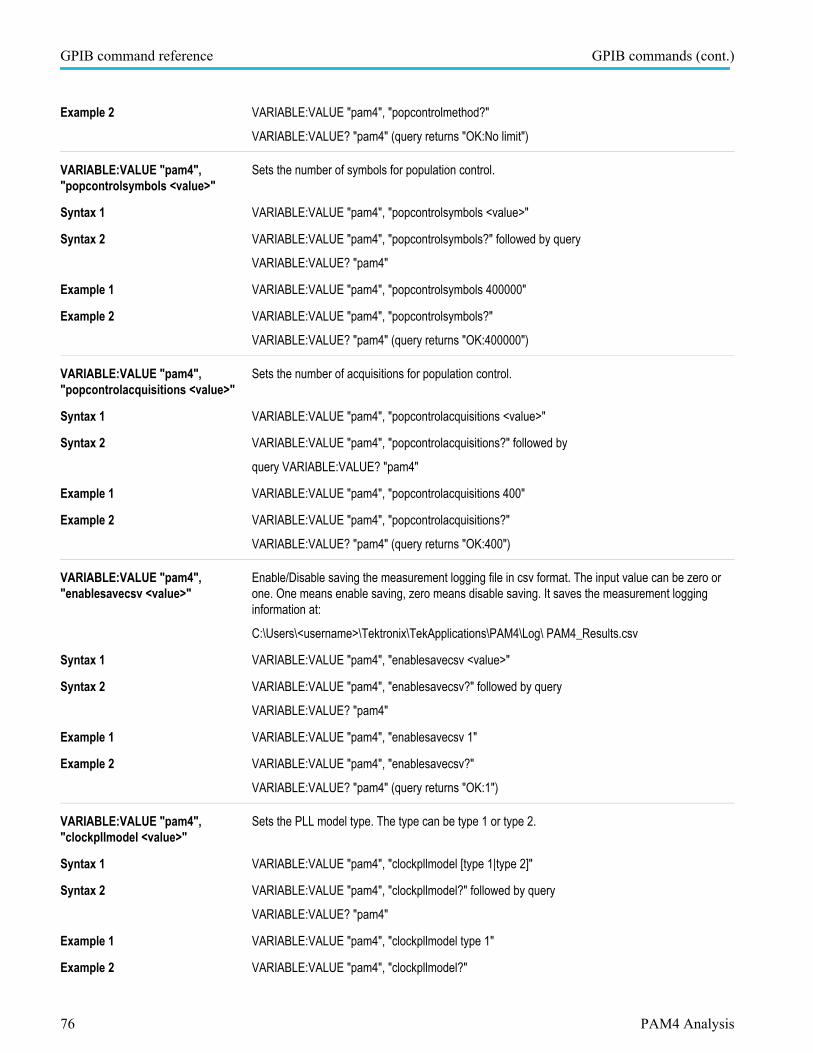
Example 2 VARIABLE:VALUE "pam4", "popcontrolmethod?"
VARIABLE:VALUE? "pam4" (query returns "OK:No limit")
VARIABLE:VALUE "pam4","popcontrolsymbols <value>"
Sets the number of symbols for population control.
Syntax 1 VARIABLE:VALUE "pam4", "popcontrolsymbols <value>"
Syntax 2 VARIABLE:VALUE "pam4", "popcontrolsymbols?" followed by query
VARIABLE:VALUE? "pam4"
Example 1 VARIABLE:VALUE "pam4", "popcontrolsymbols 400000"
Example 2 VARIABLE:VALUE "pam4", "popcontrolsymbols?"
VARIABLE:VALUE? "pam4" (query returns "OK:400000")
VARIABLE:VALUE "pam4","popcontrolacquisitions <value>"
Sets the number of acquisitions for population control.
Syntax 1 VARIABLE:VALUE "pam4", "popcontrolacquisitions <value>"
Syntax 2 VARIABLE:VALUE "pam4", "popcontrolacquisitions?" followed by
query VARIABLE:VALUE? "pam4"
Example 1 VARIABLE:VALUE "pam4", "popcontrolacquisitions 400"
Example 2 VARIABLE:VALUE "pam4", "popcontrolacquisitions?"
VARIABLE:VALUE? "pam4" (query returns "OK:400")
VARIABLE:VALUE "pam4","enablesavecsv <value>"
Enable/Disable saving the measurement logging file in csv format. The input value can be zero orone. One means enable saving, zero means disable saving. It saves the measurement logginginformation at:
C:\Users\<username>\Tektronix\TekApplications\PAM4\Log\ PAM4_Results.csv
Syntax 1 VARIABLE:VALUE "pam4", "enablesavecsv <value>"
Syntax 2 VARIABLE:VALUE "pam4", "enablesavecsv?" followed by query
VARIABLE:VALUE? "pam4"
Example 1 VARIABLE:VALUE "pam4", "enablesavecsv 1"
Example 2 VARIABLE:VALUE "pam4", "enablesavecsv?"
VARIABLE:VALUE? "pam4" (query returns "OK:1")
VARIABLE:VALUE "pam4","clockpllmodel <value>"
Sets the PLL model type. The type can be type 1 or type 2.
Syntax 1 VARIABLE:VALUE "pam4", "clockpllmodel [type 1|type 2]"
Syntax 2 VARIABLE:VALUE "pam4", "clockpllmodel?" followed by query
VARIABLE:VALUE? "pam4"
Example 1 VARIABLE:VALUE "pam4", "clockpllmodel type 1"
Example 2 VARIABLE:VALUE "pam4", "clockpllmodel?"
GPIB command reference GPIB commands (cont.)
76 PAM4 Analysis

VARIABLE:VALUE? "pam4" (query returns "OK:type1")
VARIABLE:VALUE "pam4","clockplldamp <value>"
Sets the PLL damping factor for type 2 PLL.
Syntax 1 VARIABLE:VALUE "pam4", "clockplldamp <value>"
Syntax 2 VARIABLE:VALUE "pam4", "clockplldamp?" followed by query
VARIABLE:VALUE? "pam4"
Example 1 VARIABLE:VALUE "pam4", "clockplldamp 0.700"
Example 2 VARIABLE:VALUE "pam4", "clockplldamp?"
VARIABLE:VALUE? "pam4" (query returns "OK:0.7")
VARIABLE:VALUE "pam4","clockpllbw <value>"
This command is deprecated and may be removed in the future, please use the PI command"clockjtfbw" instead.
This command sets PLL JTF bandwidth in MHz.
Syntax 1 VARIABLE:VALUE "pam4", "clockpllbw <value>"
Syntax 2 VARIABLE:VALUE "pam4", "clockpllbw?" followed by query
VARIABLE:VALUE? "pam4"
Example 1 VARIABLE:VALUE "pam4", "clockpllbw 17"
Example 2 VARIABLE:VALUE "pam4", "clockpllbw?"
VARIABLE:VALUE? "pam4" (query returns "OK:17")
VARIABLE:VALUE "pam4","clockjtfbw <value>"
Sets the PLL JTF bandwidth in MHz.
Syntax 1 VARIABLE:VALUE "pam4", "clockjtfbw <value>"
Syntax 2 VARIABLE:VALUE "pam4", "clockjtfbw?" followed by query
VARIABLE:VALUE? "pam4"
Example 1 VARIABLE:VALUE "pam4", "clockjtfbw 17"
Example 2 VARIABLE:VALUE "pam4", "clockjtfbw?"
VARIABLE:VALUE? "pam4" (query returns "OK:17")
VARIABLE:VALUE "pam4","results ceijittermeas?"
Uses the VARIABLE:VALUE? "PAM4" query to get the parameters afterwards; it returns OIF-CEIjitter measurements UUGJ, UBHPJ and even-odd jitter (EOJ).
Syntax VARIABLE:VALUE "pam4", "results ceijittermeas?"
Example VARIABLE:VALUE "pam4", "results ceijittermeas?"
VARIABLE:VALUE? "pam4"
(query returns "OK:UUGJ 4.267ps;UBHPJ 4.128ps;EOJ 3.015fs;" )
VARIABLE:VALUE "pam4","results corrmeas?"
Uses the VARIABLE:VALUE? "PAM4" query to get the parameters afterwards; it returns thecontent of upper left table on the average waveform page.
GPIB commands (cont.) GPIB command reference
PAM4 Analysis 77
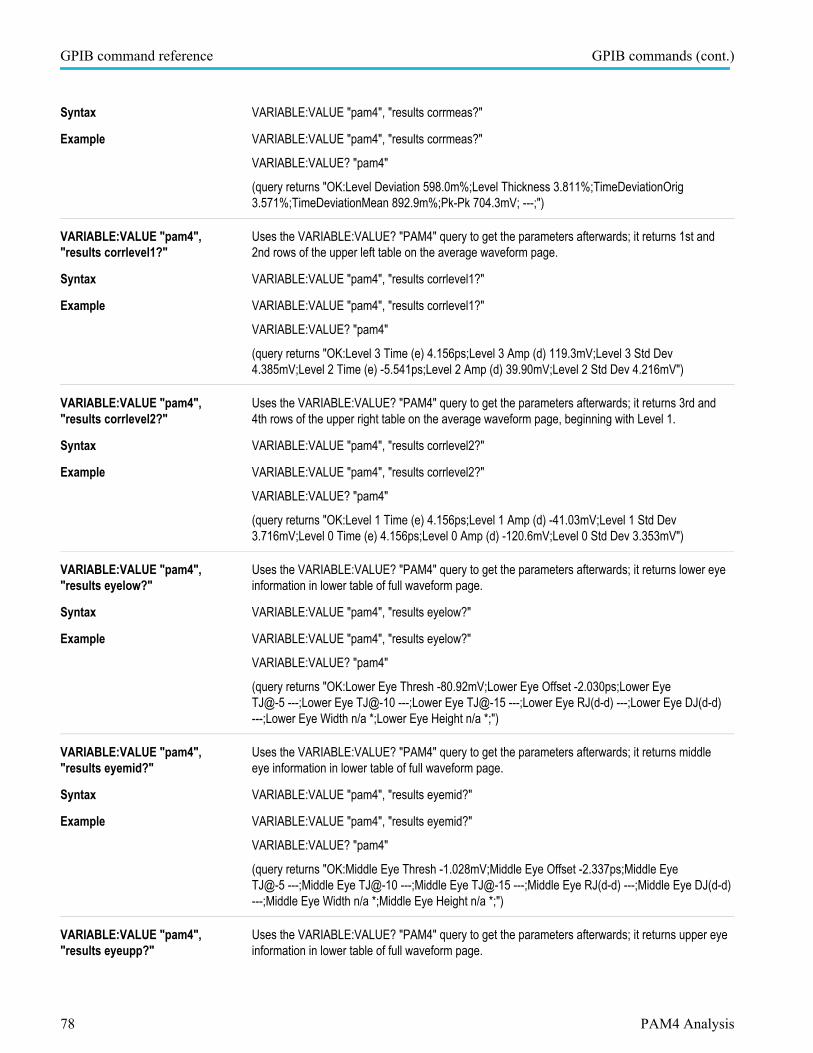
Syntax VARIABLE:VALUE "pam4", "results corrmeas?"
Example VARIABLE:VALUE "pam4", "results corrmeas?"
VARIABLE:VALUE? "pam4"
(query returns "OK:Level Deviation 598.0m%;Level Thickness 3.811%;TimeDeviationOrig3.571%;TimeDeviationMean 892.9m%;Pk-Pk 704.3mV; ---;")
VARIABLE:VALUE "pam4","results corrlevel1?"
Uses the VARIABLE:VALUE? "PAM4" query to get the parameters afterwards; it returns 1st and2nd rows of the upper left table on the average waveform page.
Syntax VARIABLE:VALUE "pam4", "results corrlevel1?"
Example VARIABLE:VALUE "pam4", "results corrlevel1?"
VARIABLE:VALUE? "pam4"
(query returns "OK:Level 3 Time (e) 4.156ps;Level 3 Amp (d) 119.3mV;Level 3 Std Dev4.385mV;Level 2 Time (e) -5.541ps;Level 2 Amp (d) 39.90mV;Level 2 Std Dev 4.216mV")
VARIABLE:VALUE "pam4","results corrlevel2?"
Uses the VARIABLE:VALUE? "PAM4" query to get the parameters afterwards; it returns 3rd and4th rows of the upper right table on the average waveform page, beginning with Level 1.
Syntax VARIABLE:VALUE "pam4", "results corrlevel2?"
Example VARIABLE:VALUE "pam4", "results corrlevel2?"
VARIABLE:VALUE? "pam4"
(query returns "OK:Level 1 Time (e) 4.156ps;Level 1 Amp (d) -41.03mV;Level 1 Std Dev3.716mV;Level 0 Time (e) 4.156ps;Level 0 Amp (d) -120.6mV;Level 0 Std Dev 3.353mV")
VARIABLE:VALUE "pam4","results eyelow?"
Uses the VARIABLE:VALUE? "PAM4" query to get the parameters afterwards; it returns lower eyeinformation in lower table of full waveform page.
Syntax VARIABLE:VALUE "pam4", "results eyelow?"
Example VARIABLE:VALUE "pam4", "results eyelow?"
VARIABLE:VALUE? "pam4"
(query returns "OK:Lower Eye Thresh -80.92mV;Lower Eye Offset -2.030ps;Lower EyeTJ@-5 ---;Lower Eye TJ@-10 ---;Lower Eye TJ@-15 ---;Lower Eye RJ(d-d) ---;Lower Eye DJ(d-d)---;Lower Eye Width n/a *;Lower Eye Height n/a *;")
VARIABLE:VALUE "pam4","results eyemid?"
Uses the VARIABLE:VALUE? "PAM4" query to get the parameters afterwards; it returns middleeye information in lower table of full waveform page.
Syntax VARIABLE:VALUE "pam4", "results eyemid?"
Example VARIABLE:VALUE "pam4", "results eyemid?"
VARIABLE:VALUE? "pam4"
(query returns "OK:Middle Eye Thresh -1.028mV;Middle Eye Offset -2.337ps;Middle EyeTJ@-5 ---;Middle Eye TJ@-10 ---;Middle Eye TJ@-15 ---;Middle Eye RJ(d-d) ---;Middle Eye DJ(d-d)---;Middle Eye Width n/a *;Middle Eye Height n/a *;")
VARIABLE:VALUE "pam4","results eyeupp?"
Uses the VARIABLE:VALUE? "PAM4" query to get the parameters afterwards; it returns upper eyeinformation in lower table of full waveform page.
GPIB command reference GPIB commands (cont.)
78 PAM4 Analysis

Syntax VARIABLE:VALUE "pam4", "results eyeupp?"
Example VARIABLE:VALUE "pam4", "results eyeupp?"
VARIABLE:VALUE? "pam4"
(query returns "OK:Upper Eye Thresh 78.59mV;Upper Eye Offset -1.610ps;Upper EyeTJ@-5 ---;Upper Eye TJ@-10 ---;Upper Eye TJ@-15 ---;Upper Eye RJ(d-d) ---;Upper Eye DJ(d-d)---;Upper Eye Width n/a *;Upper Eye Height n/a *;")
VARIABLE:VALUE "pam4","results fall1?"
Uses the VARIABLE:VALUE? "PAM4" query to get the parameters afterwards; it returns the 2- and3-level transition fall time results from Rise/Fall page.
Syntax VARIABLE:VALUE "pam4", "results fall1?"
Example VARIABLE:VALUE "pam4", "results fall1?"
VARIABLE:VALUE? "pam4"
(query returns "OK:Fall(3-0) Max 12.8ps;Fall(3-0) Mean 12.5ps;Fall(3-0) Min 11.9ps;Fall(2-0) Max15.2ps;Fall(2-0) Mean 13.2ps;Fall(2-0) Min 11.4ps;Fall(3-1) Max 12.7ps;Fall(3-1) Mean12.1ps;Fall(3-1) Min 11.6ps;")
VARIABLE:VALUE "pam4","results fall2?"
Uses the VARIABLE:VALUE? "PAM4" query to get the parameters afterwards; it returns the 1-leveltransition fall time results from Rise/Fall page.
Syntax VARIABLE:VALUE "pam4", "results fall2?"
Example VARIABLE:VALUE "pam4", "results fall2?"
VARIABLE:VALUE? "pam4"
(query returns "OK:Fall(1-0) Max ---;Fall(1-0) Mean ---;Fall(1-0) Min 9.70ps;Fall(2-1) Max14.5ps;Fall(2-1) Mean 12.1ps;Fall(2-1) Min 10.1ps;Fall(3-2) Max 12.2ps;Fall(3-2) Mean11.4ps;Fall(3-2) Min 10.2ps;")
VARIABLE:VALUE "pam4","results fullmeas?" NOTE. This command is deprecated. Use the commands:
VARIABLE:VALUE "pam4", "results fullmeas1?"
VARIABLE:VALUE "pam4", "results fullmeas2?"
This command uses the VARIABLE:VALUE? "PAM4" query to get the parameters afterwards; itreturns the upper left table contents on the full waveform page, beginning with unit interval.
Syntax VARIABLE:VALUE "pam4", "results fullmeas?"
Example VARIABLE:VALUE "pam4", "results fullmeas?"
VARIABLE:VALUE? "pam4"
(query returns "OK:Unit Interval 38.79ps;Symbol Rate 25.78GBd;Equiv Bitrate (2xBd)51.56Gbps;Pattern Length 2047;Symbol Population 123099;Linearity (R_LM) 91.44%;EW6insufficient data *;EH6 insufficient data *;VEC insufficient data *;")
VARIABLE:VALUE "pam4","results fullmeas1?"
Uses the VARIABLE:VALUE? "PAM4" query to get the parameters afterwards; it returns the firsthalf of the upper left table contents on the full waveform page.
Syntax VARIABLE:VALUE "pam4", "results fullmeas1?"
Example VARIABLE:VALUE "pam4", "results fullmeas1?"
GPIB commands (cont.) GPIB command reference
PAM4 Analysis 79

VARIABLE:VALUE? "pam4"
(query returns "OK:Unit Interval 38.79ps;Symbol Rate 25.78GBd;Equiv Bitrate (2xBd)51.56Gbps;Pattern Length 127;Symbol Population 106159;Symbol Errors 0;Symbol Error Ratio0.0000e+00;Bit Error Ratio 0.0000e+00;")
VARIABLE:VALUE "pam4","results fullmeas2?"
Uses the VARIABLE:VALUE? "PAM4" query to get the parameters afterwards; it returns thesecond half of the upper left table contents on the full waveform page.
Syntax VARIABLE:VALUE "pam4", "results fullmeas2?"
Example VARIABLE:VALUE "pam4", "results fullmeas2?"
VARIABLE:VALUE? "pam4"
(query returns "OK:Linearity R_LM 94.62%;EW6 insufficient data *;EH6 insufficient data *;VECinsufficient data *;SNDR Disabled;Peak Disabled;Sigma_e Disabled;Sigma_n Disabled;")
VARIABLE:VALUE "pam4","results fulllevel1?"
Uses the VARIABLE:VALUE? "PAM4" query to get the parameters afterwards; it returns 1st and2nd rows of upper right table on the full waveform page, beginning with V_D(3).
Syntax VARIABLE:VALUE "pam4", "results fulllevel1?"
Example VARIABLE:VALUE "pam4", "results fulllevel1?"
VARIABLE:VALUE? "pam4"
(query returns OK:Linearity R_LM 94.62%;EW6 insufficient data *;EH6 insufficient data *;VECinsufficient data *;SNDR Disabled;Peak Disabled;Sigma_e Disabled;Sigma_n Disabled;"OK:V_D(3) Mean 118.0mV;V_D(3) StdDev 7.202mV;V_D(3) Pk-Pk 59.14mV;V_C(2) Mean40.21mV;V_C(2) StdDev 6.257mV;V_C(2) Pk-Pk 48.74mV;")
VARIABLE:VALUE "pam4","results fulllevel2?"
Uses the VARIABLE:VALUE? "PAM4" query to get the parameters afterwards; it returns 3rd and4th rows of upper right table on the full waveform page, beginning with V_B(1).
Syntax VARIABLE:VALUE "pam4", "results fulllevel2?"
Example VARIABLE:VALUE "pam4", "results fulllevel2?"
VARIABLE:VALUE? "pam4"
(query returns "OK:V_B(1) Mean -41.66mV;V_B(1) StdDev 5.950mV;V_B(1) Pk-Pk52.32mV;V_A(0) Mean -120.0mV;V_A(0) StdDev 6.292mV;V_A(0) Pk-Pk 48.65mV;")
VARIABLE:VALUE "pam4","resultshlowleft?"
The command is used in Eye Symmetric Mask Width (ESMW) calculation. It returns the left cornerof lower eye plot in time unit.
After this command, it uses VARIABLE:VALUE? "PAM4" query to obtain the value.
Syntax VARIABLE:VALUE "pam4", "results hlowleft?"
Example VARIABLE:VALUE "pam4", "results hlowleft?"
VARIABLE:VALUE? "pam4" (query returns "OK:-8.734ps" )
VARIABLE:VALUE "pam4","resultshlowright?"
The command is used in Eye Symmetric Mask Width (ESMW) calculation. It returns the right cornerof lower eye in time unit.
After this command, it uses VARIABLE:VALUE? "PAM4" query to obtain the value.
Syntax VARIABLE:VALUE "pam4", "results hlowright?"
GPIB command reference GPIB commands (cont.)
80 PAM4 Analysis

Example VARIABLE:VALUE "pam4", "results hlowright?"
VARIABLE:VALUE? "pam4" (query returns "OK:2.56ps" )
VARIABLE:VALUE "pam4","resultshmidleft?"
The command is used in Eye Symmetric Mask Width (ESMW) calculation. It returns the left cornerof mid eye in time unit.
After this command, it uses VARIABLE:VALUE? "PAM4" query to obtain the value.
Syntax VARIABLE:VALUE "pam4", "results hmidleft?"
Example VARIABLE:VALUE "pam4", "results hmidleft?"
VARIABLE:VALUE? "pam4" (query returns "OK:8.734ps")
VARIABLE:VALUE "pam4","resultshmidright?"
The command is used in Eye Symmetric Mask Width (ESMW) calculation. It returns the right cornerof mid eye in time unit.
After this command, it uses VARIABLE:VALUE? "PAM4" query to obtain the value.
Syntax VARIABLE:VALUE "pam4", "results hmidright?"
Example VARIABLE:VALUE "pam4", "results hmidright?"
VARIABLE:VALUE? "pam4" (query returns "OK: 602.4fs")
VARIABLE:VALUE "pam4","resultshuppleft?"
The command is used in Eye Symmetric Mask Width (ESMW) calculation. It returns the left cornerof upper eye in time unit.
After this command, it uses VARIABLE:VALUE? "PAM4" query to obtain the value.
Syntax VARIABLE:VALUE "pam4", "results huppleft?"
Example VARIABLE:VALUE "pam4", "results huppleft?"
VARIABLE:VALUE? "pam4" (query returns "OK: 2.4fs")
VARIABLE:VALUE "pam4","resultshuppright?"
The command is used in Eye Symmetric Mask Width (ESMW) calculation. It returns the right cornerof upper eye in time unit.
After this command, it uses VARIABLE:VALUE? "PAM4" query to obtain the value.
Syntax VARIABLE:VALUE "pam4", "results huppright?"
Example VARIABLE:VALUE "pam4", "results huppright?"
VARIABLE:VALUE? "pam4" (query returns "OK: 602.4fs")
VARIABLE:VALUE "pam4","results ieeemeas?"
Uses the VARIABLE:VALUE? "PAM4" query to get the parameters afterwards; it returns the IEEEmeasurements including Jrms, J4u, J3u, even and odd jitter, rise and fall time, SNR_ISI.
Syntax VARIABLE:VALUE "pam4", "results ieeemeas?"
Example VARIABLE:VALUE "pam4", "results ieeemeas?"
VARIABLE:VALUE? "pam4"
(query returns "OK:Jrms ---;J3u ---;J4u ---;EOJ (IEEE) ---;IEEE Rise Time ---;IEEE Fall Time---;SNR_ISI ---;" )
VARIABLE:VALUE "pam4","results opticalmeas?"
Uses VARIABLE:VALUE? "PAM4" query to get the parameters afterwards; it returns the opticalmeasurements that include ER, OMA, AOP, RINxOMA, TDECQ, OMA(outer) – TDECQ, Ceq.
GPIB commands (cont.) GPIB command reference
PAM4 Analysis 81

Syntax VARIABLE:VALUE "pam4", "results opticalmeas?"
Example VARIABLE:VALUE "pam4", "results opticalmeas?"
VARIABLE:VALUE? "pam4"
(query returns "OK:ER ---;OMA ---;AOP ---;RINxOMA ---;TDECQ ---;OMA(outer) - TDECQ ---;Ceq---;" )
VARIABLE:VALUE "pam4","results rise1?"
Uses the VARIABLE:VALUE? "PAM4" query to get the parameters afterwards; it returns the 2- and3-level transition rise time results from Rise/Fall page.
Syntax VARIABLE:VALUE "pam4", "results rise1?"
Example VARIABLE:VALUE "pam4", "results rise1?"
VARIABLE:VALUE? "pam4"
(query returns "OK:Rise(0-3) Max 14.4ps;Rise(0-3) Mean 13.4ps;Rise(0-3) Min 12.1ps;Rise(0-2)Max 15.2ps;Rise(0-2) Mean 12.7ps;Rise(0-2) Min 11.1ps;Rise(1-3) Max 14.8ps;Rise(1-3) Mean13.3ps;Rise(1-3) Min 12.1ps;")
VARIABLE:VALUE "pam4","results rise2?"
Uses the VARIABLE:VALUE? "PAM4" query to get the parameters afterwards; it returns the 1-leveltransition rise time results from Rise/Fall page.
Syntax VARIABLE:VALUE "pam4", "results rise2?"
Example VARIABLE:VALUE "pam4", "results rise2?"
VARIABLE:VALUE? "pam4"
(query returns "OK:Rise(0-1) Max 14.1ps;Rise(0-1) Mean 12.2ps;Rise(0-1) Min 9.88ps;Rise(1-2)Max 15.0ps;Rise(1-2) Mean 11.9ps;Rise(1-2) Min 9.57ps;Rise(2-3) Max 16.2ps;Rise(2-3) Mean14.4ps;Rise(2-3) Min 11.9ps;")
VARIABLE:VALUE "pam4","results sigmanperlevel?"
Uses VARIABLE:VALUE? "PAM4" query to get the parameters afterwards; it returns sigma Nvalues for each level.
Syntax VARIABLE:VALUE "pam4", "results sigmanperlevel?"
Example VARIABLE:VALUE "pam4", "results sigmanperlevel?"
VARIABLE:VALUE? "pam4"
(query returns "OK:Sigma n (3) ---;Sigma n (2) ---;Sigma n (1) ---;Sigma n (0) ---;" )
VARIABLE:VALUE "pam4","results sndrtp?"
Uses the VARIABLE:VALUE? "PAM4" query to get the parameter afterwards; it returns tp, theindex of Pmax computed for SNDR measurements.
Syntax VARIABLE:VALUE "pam4", "results sndrtp?"
Example VARIABLE:VALUE "pam4", "results sndrtp?"
VARIABLE:VALUE? "pam4" (query returns "OK: 46" )
VARIABLE:VALUE "pam4","results sndrvoltage?"
Uses the VARIABLE:VALUE? "PAM4" query to get the parameters afterwards; it returns the steadystate voltage.
Syntax VARIABLE:VALUE "pam4", "results sndrvoltage?"
Example VARIABLE:VALUE "pam4", "results sndrvoltage?"
GPIB command reference GPIB commands (cont.)
82 PAM4 Analysis

VARIABLE:VALUE? "pam4"
(query returns "OK: 0.5")
VARIABLE:VALUE "pam4","resultstmid?"
The command is used in Eye Symmetric Mask Width (ESMW) calculation. It returns the midpoint ofa PAM4 eye plot in time unit.
After this command, it uses VARIABLE:VALUE? "PAM4" query to obtain the value.
Syntax VARIABLE:VALUE "pam4", "results tmid?"
Example VARIABLE:VALUE "pam4", "results tmid?"
VARIABLE:VALUE? "pam4" (query returns "OK:-75.29fs" )
VARIABLE:VALUE "pam4","scopenoisemvrms <value>"
Sets the oscilloscope noise in mV for SNDR, Sigma N, Sigma N per level, Jrms, J3u, J4u, and EyeHeight. The value should be larger than zero and smaller than 5.
Syntax 1 VARIABLE:VALUE "pam4", "scopenoisemvrms <value>"
Syntax 2 VARIABLE:VALUE "pam4", "scopenoisemvrms?" followed by query
VARIABLE:VALUE? "pam4"
Example 1 VARIABLE:VALUE "pam4", "scopenoisemvrms 2"
Example 2 VARIABLE:VALUE "pam4", "scopenoisemvrms?"
VARIABLE:VALUE? "pam4" (query returns "OK: 2")
VARIABLE:VALUE "pam4","sndron <value>"
Enable SNDR Signal Noise Distribution Ratio (SNDR). The values can be 1 or 0. One meansSNDR is on, zero means it is off.
Syntax 1 VARIABLE:VALUE "pam4", "sndron [1|0]"
Syntax 2 VARIABLE:VALUE "pam4", "sndron?" followed by query VARIABLE:VALUE? "pam4"
Example 1 VARIABLE:VALUE "pam4", "sndron 1"
Example 2 VARIABLE:VALUE "pam4", "sndron?"
VARIABLE:VALUE? "pam4" (query returns "OK:1")
VARIABLE:VALUE "pam4","sndrsamplenumber <value>"
Sets the SNDR samples per symbol (M). The value is in the range [32 200].
Syntax 1 VARIABLE:VALUE "pam4", "sndrsamplenumber <value>"
Syntax 2 VARIABLE:VALUE "pam4", "sndrsamplenumber?" followed by query
VARIABLE:VALUE? "pam4"
Example 1 VARIABLE:VALUE "pam4", "sndrsamplenumber 32"
Example 2 VARIABLE:VALUE "pam4", "sndrsamplenumber?"
VARIABLE:VALUE? "pam4" (query returns "OK:32")
VARIABLE:VALUE "pam4","sndrfilterlength <value>"
Sets the SNDR linear fit pulse filter length (Np). The value is in the range [2 100].
Syntax 1 VARIABLE:VALUE "pam4", "sndrfilterlength <value>"
GPIB commands (cont.) GPIB command reference
PAM4 Analysis 83

Syntax 2 VARIABLE:VALUE "pam4", "sndrfilterlength?" followed by query
VARIABLE:VALUE? "pam4"
Example 1 VARIABLE:VALUE "pam4", "sndrfilterlength 64"
Example 2 VARIABLE:VALUE "pam4", "sndrfilterlength?"
VARIABLE:VALUE? "pam4" (query returns "OK:64")
VARIABLE:VALUE "pam4","sndrdelay <value>"
Sets the SNDR linear fit pulse filter delay (Dp) in symbols. The value is in the range [1 100].
Syntax 1 VARIABLE:VALUE "pam4", "sndrdelay <value>"
Syntax 2 VARIABLE:VALUE "pam4", "sndrdelay?" followed by query VARIABLE:VALUE? "pam4"
Example 1 VARIABLE:VALUE "pam4", "sndelay 65"
Example 2 VARIABLE:VALUE "pam4", "sndrdelay?"
VARIABLE:VALUE? "pam4" (query returns "OK:65")
VARIABLE:VALUE "pam4","sndrnb <value>"
Sets Nb for SNRISI computation. The value is in the range 5 to 50.
Syntax 1 VARIABLE:VALUE "pam4", "sndrnb <value>"
Syntax 2 VARIABLE:VALUE "pam4", "sndrnb?" followed by query
VARIABLE:VALUE? "pam4"
Example 1 VARIABLE:VALUE "pam4", "sndrnb 12"
Example 2 VARIABLE:VALUE "pam4", "sndrnb?"
VARIABLE:VALUE? "pam4" (query returns "OK:12")
VARIABLE:VALUE "pam4","sndrbtfilteron <value>"
This command is deprecated and may be removed in the future. The Bessel-Thomson filter isredesigned and can be enabled/disabled by "btfilteron".
Enable/Disable the Bessel-Thomson filter. The values can be 1 or 0. One means the filter is on,zero means it is off.
Syntax 1 VARIABLE:VALUE "pam4", "sndrbtfilteron [1|0]"
Syntax 2 VARIABLE:VALUE "pam4", "sndrbtfilteron?" followed by query
VARIABLE:VALUE? "pam4"
Example 1 VARIABLE:VALUE "pam4", "sndrbtfilteron 1"
Example 2 VARIABLE:VALUE "pam4", "sndrbtfilteron?"
VARIABLE:VALUE? "pam4" (query returns "OK:1")
VARIABLE:VALUE "pam4","sndrdebugplotson <value>"
Allows the SNDR to show more debug plots. The values can be 1 or 0. One means the debug plotsare shown, zero means they are not.
Syntax 1 VARIABLE:VALUE "pam4", "sndrdebugplotson [1|0]"
Syntax 2 VARIABLE:VALUE "pam4", "sndrdebugplotson?" followed by query
VARIABLE:VALUE? "pam4"
GPIB command reference GPIB commands (cont.)
84 PAM4 Analysis

Example 1 VARIABLE:VALUE "pam4", "sndrdebugplotson 1"
Example 2 VARIABLE:VALUE "pam4", "sndrdebugplotson?"
VARIABLE:VALUE? "pam4" (query returns "OK:1")
VARIABLE:VALUE "pam4","errnavenabled <value>"
Enable Error Navigator when it is 1. The values can be 1 or 0. One means Error Navigator isenabled, zero means it is not.
Syntax 1 VARIABLE:VALUE "pam4", "errnavenabled [1|0]"
Syntax 2 VARIABLE:VALUE "pam4", "errnavenbled?" followed by query
VARIABLE:VALUE? "pam4"
Example 1 VARIABLE:VALUE "pam4", "errnavenabled 1"
Example 2 VARIABLE:VALUE "pam4", "errnavenabled ?"
VARIABLE:VALUE? "pam4" (query returns "OK:1")
VARIABLE:VALUE "pam4","enablerelativeunit <value>"
Enable/Disable the use of relatively time unit (UI instead of second) for selected measurements.The values can be 1 or 0. One enables the relative time unit.
Syntax 1 VARIABLE:VALUE "pam4", "enablerelativeunit [1|0]"
Syntax 2 VARIABLE:VALUE "pam4", "enablerelativeunit?" followed by query
VARIABLE:VALUE? "pam4"
Example 1 VARIABLE:VALUE "pam4", "enablerelativeunit 1"
Example 2 VARIABLE:VALUE "pam4", "enablerelativeunit?"
VARIABLE:VALUE? "pam4" (query returns "OK:1")
VARIABLE:VALUE "pam4","export<plot title>:<filename>"
Instructs the PAM4 application to export a plot to a file.
The plot title corresponds to the title displayed in the main plot, which includes: accumulated,correlated , linear pulse and TDECQ.
The export file type includes:
*.bmp; *.emf;.*.eps; *.jpg; *.png; *.tif ; *.fig; *.mat; *.csv
Syntax VARIABLE:VALUE "pam4","export <plot title>: <filename>"
Example VARIABLE:VALUE "pam4","export accumulated:c:\temp\test.fig"
VARIABLE:VALUE "pam4","loggpibtraffic <value>"
Enable/Disable the function to log GPIB traffic in the "Log" panel. The value can be 1 or 0. Oneenables logging.
Syntax 1 VARIABLE:VALUE "pam4", "loggpibtraffic [1|0]"
Syntax 2 VARIABLE:VALUE "pam4", "loggpibtraffic?" followed by query
VARIABLE:VALUE? "pam4"
Example 1 VARIABLE:VALUE "pam4", "loggpibtraffic 1"
Example 2 VARIABLE:VALUE "pam4", "loggpibtraffic?"
VARIABLE:VALUE? "pam4" (query returns "OK:1")
GPIB commands (cont.) GPIB command reference
PAM4 Analysis 85
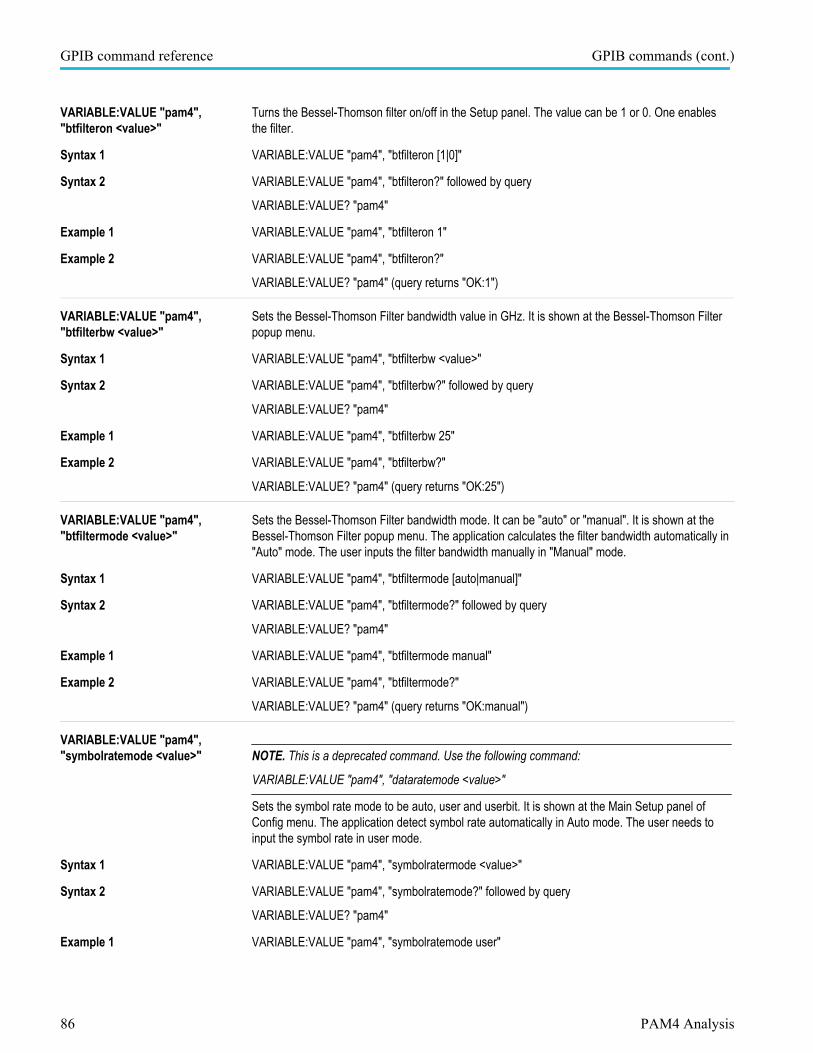
VARIABLE:VALUE "pam4","btfilteron <value>"
Turns the Bessel-Thomson filter on/off in the Setup panel. The value can be 1 or 0. One enablesthe filter.
Syntax 1 VARIABLE:VALUE "pam4", "btfilteron [1|0]"
Syntax 2 VARIABLE:VALUE "pam4", "btfilteron?" followed by query
VARIABLE:VALUE? "pam4"
Example 1 VARIABLE:VALUE "pam4", "btfilteron 1"
Example 2 VARIABLE:VALUE "pam4", "btfilteron?"
VARIABLE:VALUE? "pam4" (query returns "OK:1")
VARIABLE:VALUE "pam4","btfilterbw <value>"
Sets the Bessel-Thomson Filter bandwidth value in GHz. It is shown at the Bessel-Thomson Filterpopup menu.
Syntax 1 VARIABLE:VALUE "pam4", "btfilterbw <value>"
Syntax 2 VARIABLE:VALUE "pam4", "btfilterbw?" followed by query
VARIABLE:VALUE? "pam4"
Example 1 VARIABLE:VALUE "pam4", "btfilterbw 25"
Example 2 VARIABLE:VALUE "pam4", "btfilterbw?"
VARIABLE:VALUE? "pam4" (query returns "OK:25")
VARIABLE:VALUE "pam4","btfiltermode <value>"
Sets the Bessel-Thomson Filter bandwidth mode. It can be "auto" or "manual". It is shown at theBessel-Thomson Filter popup menu. The application calculates the filter bandwidth automatically in"Auto" mode. The user inputs the filter bandwidth manually in "Manual" mode.
Syntax 1 VARIABLE:VALUE "pam4", "btfiltermode [auto|manual]"
Syntax 2 VARIABLE:VALUE "pam4", "btfiltermode?" followed by query
VARIABLE:VALUE? "pam4"
Example 1 VARIABLE:VALUE "pam4", "btfiltermode manual"
Example 2 VARIABLE:VALUE "pam4", "btfiltermode?"
VARIABLE:VALUE? "pam4" (query returns "OK:manual")
VARIABLE:VALUE "pam4","symbolratemode <value>" NOTE. This is a deprecated command. Use the following command:
VARIABLE:VALUE "pam4", "dataratemode <value>"
Sets the symbol rate mode to be auto, user and userbit. It is shown at the Main Setup panel ofConfig menu. The application detect symbol rate automatically in Auto mode. The user needs toinput the symbol rate in user mode.
Syntax 1 VARIABLE:VALUE "pam4", "symbolratermode <value>"
Syntax 2 VARIABLE:VALUE "pam4", "symbolratemode?" followed by query
VARIABLE:VALUE? "pam4"
Example 1 VARIABLE:VALUE "pam4", "symbolratemode user"
GPIB command reference GPIB commands (cont.)
86 PAM4 Analysis

Example 2 VARIABLE:VALUE "pam4", "symbolratemode?"
VARIABLE:VALUE? "pam4" (query returns "OK:user")
VARIABLE:VALUE "pam4","dataratemode <value>"
Sets the data rate mode to "auto", "user" or "userbit". It is shown at the "Main Setup" panel of the"Config" menu. The application detects the symbol rate automatically when in "Auto" mode. Theuser needs to input the data rate in "User" mode (GBauds) and bit rate in "Userbit" mode (Gbps).
Syntax 1 VARIABLE:VALUE "pam4", "dataratermode [auto|user|userbit]"
Syntax 2 VARIABLE:VALUE "pam4", "dataratemode?" followed by query
VARIABLE:VALUE? "pam4"
Example 1 VARIABLE:VALUE "pam4", "dataratemode user"
Example 2 VARIABLE:VALUE "pam4", "dataratemode?"
VARIABLE:VALUE? "pam4" (query returns "OK:user")
VARIABLE:VALUE"pam4","exporterrors <filename>"
Instructs the PAM4 application to export an ASCII text file listing all symbol errors from the currentanalysis cycle, if a repeating pattern is detected in the waveform. The file has comma-separatedvalues arranged in four columns:
■ Column 1: index of erroneous symbol (with index 1 representing the first symbol after clockrecovery begins)
■ Column 2: expected symbol at this location
■ Column 3: actual symbol detected at this location
■ Column 4: time (at center of symbol) where this error occurred
If the filename doesn’t have an extension, “.txt” will be appended.
Syntax VARIABLE:VALUE "pam4","exporterrors<filename>"
Example VARIABLE:VALUE "pam4","exportpattern c:\temp\test.txt"
VARIABLE:VALUE"pam4","exportpattern <filename>"
Instructs the PAM4 application to export an ASCII text file listing one cycle of the detectedrepeating pattern, as a comma-separated row vector using the symbols {0, 1, 2, 3}. If the filenamedoes not have an extension, extension “.txt” will be appended.
The symbol pattern can be saved as ".txt" or ".csv" file. If the application doesn’t detect repeatingpatterns, the file will contain all symbols within the range of clock recovery.
Syntax VARIABLE:VALUE "pam4","exportpattern <filename>"
Example VARIABLE:VALUE "pam4","exportpattern c:\temp\test.txt"
VARIABLE:VALUE? "pam4" (query returns "ERROR: no pattern detect") if there is no patternfound.
VARIABLE:VALUE"pam4","importpattern <filename>"
Instructs the PAM4 application to load the pattern file. The file will be used when the pattern controlis in custom mode.
The loaded pattern file is in *.txt file format.
By query using VARIABLE:VALUe importpattern?", it will return the import file name.
Syntax VARIABLE:VALUE "pam4","importpattern <filename>"
Example 1 VARIABLE:VALUE "pam4","importpattern c:\temp\test.txt"
GPIB commands (cont.) GPIB command reference
PAM4 Analysis 87
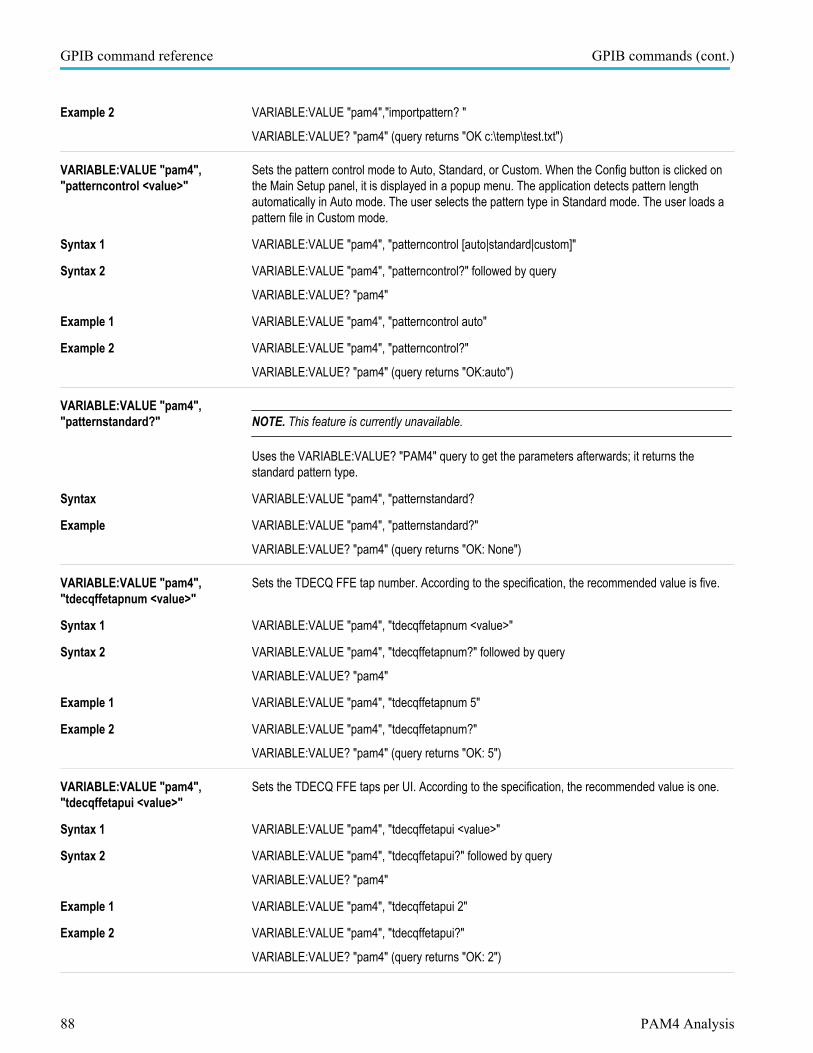
Example 2 VARIABLE:VALUE "pam4","importpattern? "
VARIABLE:VALUE? "pam4" (query returns "OK c:\temp\test.txt")
VARIABLE:VALUE "pam4","patterncontrol <value>"
Sets the pattern control mode to Auto, Standard, or Custom. When the Config button is clicked onthe Main Setup panel, it is displayed in a popup menu. The application detects pattern lengthautomatically in Auto mode. The user selects the pattern type in Standard mode. The user loads apattern file in Custom mode.
Syntax 1 VARIABLE:VALUE "pam4", "patterncontrol [auto|standard|custom]"
Syntax 2 VARIABLE:VALUE "pam4", "patterncontrol?" followed by query
VARIABLE:VALUE? "pam4"
Example 1 VARIABLE:VALUE "pam4", "patterncontrol auto"
Example 2 VARIABLE:VALUE "pam4", "patterncontrol?"
VARIABLE:VALUE? "pam4" (query returns "OK:auto")
VARIABLE:VALUE "pam4","patternstandard?" NOTE. This feature is currently unavailable.
Uses the VARIABLE:VALUE? "PAM4" query to get the parameters afterwards; it returns thestandard pattern type.
Syntax VARIABLE:VALUE "pam4", "patternstandard?
Example VARIABLE:VALUE "pam4", "patternstandard?"
VARIABLE:VALUE? "pam4" (query returns "OK: None")
VARIABLE:VALUE "pam4","tdecqffetapnum <value>"
Sets the TDECQ FFE tap number. According to the specification, the recommended value is five.
Syntax 1 VARIABLE:VALUE "pam4", "tdecqffetapnum <value>"
Syntax 2 VARIABLE:VALUE "pam4", "tdecqffetapnum?" followed by query
VARIABLE:VALUE? "pam4"
Example 1 VARIABLE:VALUE "pam4", "tdecqffetapnum 5"
Example 2 VARIABLE:VALUE "pam4", "tdecqffetapnum?"
VARIABLE:VALUE? "pam4" (query returns "OK: 5")
VARIABLE:VALUE "pam4","tdecqffetapui <value>"
Sets the TDECQ FFE taps per UI. According to the specification, the recommended value is one.
Syntax 1 VARIABLE:VALUE "pam4", "tdecqffetapui <value>"
Syntax 2 VARIABLE:VALUE "pam4", "tdecqffetapui?" followed by query
VARIABLE:VALUE? "pam4"
Example 1 VARIABLE:VALUE "pam4", "tdecqffetapui 2"
Example 2 VARIABLE:VALUE "pam4", "tdecqffetapui?"
VARIABLE:VALUE? "pam4" (query returns "OK: 2")
GPIB command reference GPIB commands (cont.)
88 PAM4 Analysis
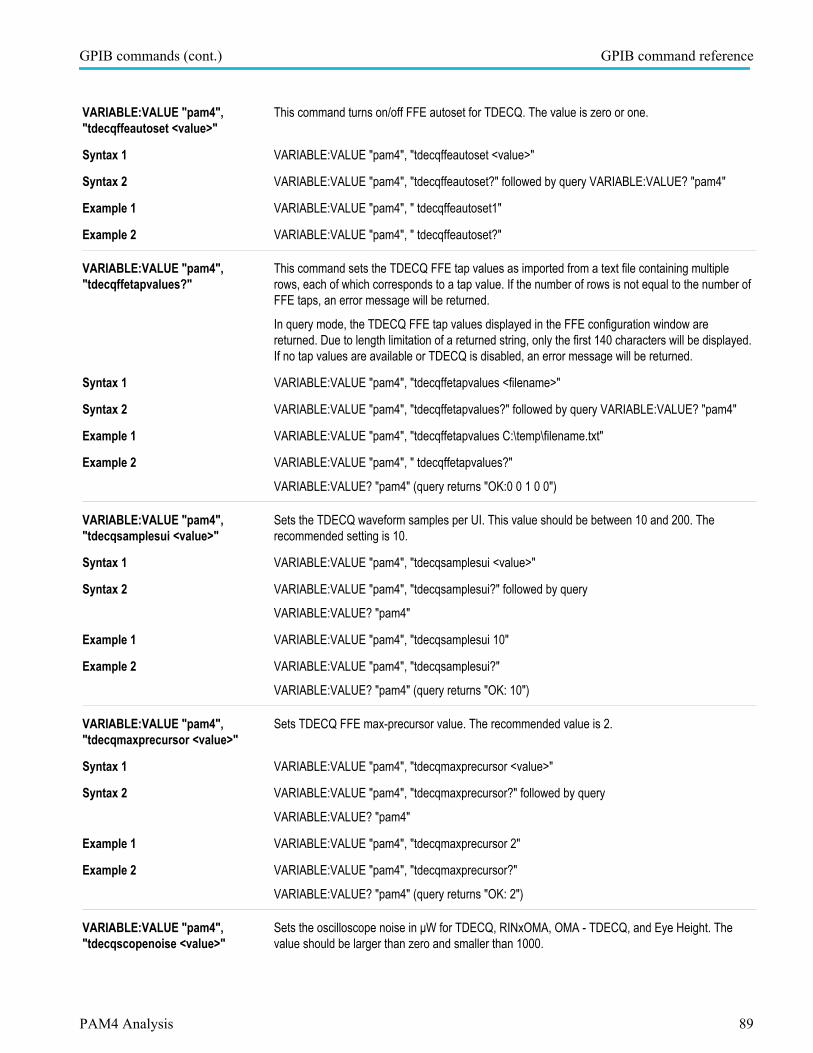
VARIABLE:VALUE "pam4","tdecqffeautoset <value>"
This command turns on/off FFE autoset for TDECQ. The value is zero or one.
Syntax 1 VARIABLE:VALUE "pam4", "tdecqffeautoset <value>"
Syntax 2 VARIABLE:VALUE "pam4", "tdecqffeautoset?" followed by query VARIABLE:VALUE? "pam4"
Example 1 VARIABLE:VALUE "pam4", " tdecqffeautoset1"
Example 2 VARIABLE:VALUE "pam4", " tdecqffeautoset?"
VARIABLE:VALUE "pam4","tdecqffetapvalues?"
This command sets the TDECQ FFE tap values as imported from a text file containing multiplerows, each of which corresponds to a tap value. If the number of rows is not equal to the number ofFFE taps, an error message will be returned.
In query mode, the TDECQ FFE tap values displayed in the FFE configuration window arereturned. Due to length limitation of a returned string, only the first 140 characters will be displayed.If no tap values are available or TDECQ is disabled, an error message will be returned.
Syntax 1 VARIABLE:VALUE "pam4", "tdecqffetapvalues <filename>"
Syntax 2 VARIABLE:VALUE "pam4", "tdecqffetapvalues?" followed by query VARIABLE:VALUE? "pam4"
Example 1 VARIABLE:VALUE "pam4", "tdecqffetapvalues C:\temp\filename.txt"
Example 2 VARIABLE:VALUE "pam4", " tdecqffetapvalues?"
VARIABLE:VALUE? "pam4" (query returns "OK:0 0 1 0 0")
VARIABLE:VALUE "pam4","tdecqsamplesui <value>"
Sets the TDECQ waveform samples per UI. This value should be between 10 and 200. Therecommended setting is 10.
Syntax 1 VARIABLE:VALUE "pam4", "tdecqsamplesui <value>"
Syntax 2 VARIABLE:VALUE "pam4", "tdecqsamplesui?" followed by query
VARIABLE:VALUE? "pam4"
Example 1 VARIABLE:VALUE "pam4", "tdecqsamplesui 10"
Example 2 VARIABLE:VALUE "pam4", "tdecqsamplesui?"
VARIABLE:VALUE? "pam4" (query returns "OK: 10")
VARIABLE:VALUE "pam4","tdecqmaxprecursor <value>"
Sets TDECQ FFE max-precursor value. The recommended value is 2.
Syntax 1 VARIABLE:VALUE "pam4", "tdecqmaxprecursor <value>"
Syntax 2 VARIABLE:VALUE "pam4", "tdecqmaxprecursor?" followed by query
VARIABLE:VALUE? "pam4"
Example 1 VARIABLE:VALUE "pam4", "tdecqmaxprecursor 2"
Example 2 VARIABLE:VALUE "pam4", "tdecqmaxprecursor?"
VARIABLE:VALUE? "pam4" (query returns "OK: 2")
VARIABLE:VALUE "pam4","tdecqscopenoise <value>"
Sets the oscilloscope noise in μW for TDECQ, RINxOMA, OMA - TDECQ, and Eye Height. Thevalue should be larger than zero and smaller than 1000.
GPIB commands (cont.) GPIB command reference
PAM4 Analysis 89

Syntax 1 VARIABLE:VALUE "pam4", "tdecqscopenoise <value>"
Syntax 2 VARIABLE:VALUE "pam4", "tdecqscopenoise?" followed by query
VARIABLE:VALUE? "pam4"
Example 1 VARIABLE:VALUE "pam4", "tdecqscopenoise 2"
Example 2 VARIABLE:VALUE "pam4", "tdecqscopenoise?"
VARIABLE:VALUE? "pam4" (query returns "OK: 2")
VARIABLE:VALUE "pam4","tdecqextendedsearch <value>"
Enables or disables extended search for TDECQ. The value can be 1 or 0. One enables extendedsearch.
Syntax 1 VARIABLE:VALUE "pam4", "tdecqextendedsearch [1|0]"
Syntax 2 VARIABLE:VALUE "pam4", "tdecqextendedsearch?" followed by query
VARIABLE:VALUE? "pam4"
Example 1 VARIABLE:VALUE "pam4", "tdecqextendedsearch 1"
Example 2 VARIABLE:VALUE "pam4", "tdecqextendedsearch?"
VARIABLE:VALUE? "pam4" (query returns "OK: 1")
VARIABLE:VALUE "pam4","tdecqverticaladjust <value>"
Enables or disables vertical threshold adjustment for TDECQ. The value can be 1 or 0. Oneenables vertical threshold adjustment.
Syntax 1 VARIABLE:VALUE "pam4", "tdecqverticaladjust [1|0]"
Syntax 2 VARIABLE:VALUE "pam4", "tdecqverticaladjust?" followed by query
VARIABLE:VALUE? "pam4"
Example 1 VARIABLE:VALUE "pam4", "tdecqverticaladjust 1"
Example 2 VARIABLE:VALUE "pam4", "tdecqverticaladjust?"
VARIABLE:VALUE? "pam4" (query returns "OK: 1")
VARIABLE:VALUE "pam4", "select<mnames>"
Selects the measurement for the tree. The measurement category could be for Electrical or Opticaldepending on the probe type. (See Measurement names lists for values.)
Syntax VARIABLE:VALUE "pam4", "select <mnames>"
Example VARIABLE:VALUE "pam4", "select R_LM"
VARIABLE:VALUE "pam4","deselect <mnames>"
Deselects the measurement from the tree. The measurement category could be for Electrical orOptical depending on the probe type. (See Measurement names lists for values.)
Syntax VARIABLE:VALUE "pam4", "deselect <mnames>"
Example VARIABLE:VALUE "pam4", "deselect R_LM"
VARIABLE:VALUE "pam4","isselect <mnames>"
Queries if the measurement is selected from the tree or not. The measurement category could befor Electrical or Optical depending on the probe type. If the specified measurement is selected onthe tree, it returns one, otherwise it returns zero. (See Measurement names lists for values.)
Syntax VARIABLE:VALUE "pam4", "isselect <mnames>"
GPIB command reference GPIB commands (cont.)
90 PAM4 Analysis

Example VARIABLE:VALUE "pam4", "isselect SNDR?" followed by query
VARIABLE:VALUE? "pam4" (query returns "OK:1”)
Measurement names tables
Electrical measurement names
Tag <mnames> ExplanationSymErrors Symbol ErrorsSER Symbol Error Ratio (actual)BER Bit Error Ratio (actual)R_LM LinearityRJDJ Jitter: RJ / DJ / TJ@BERVEC Vertical Eye Closure (VEC)EW EW depends on target BER (currently BER 10-5)EH EH depends on target BER (currently BER 10-5)Vupp Vertical measurement of upper eyeHupp Horizontal measurement of upper eyeVmid Vertical measurement of mid eyeHmid Horizontal measurement of mid eyeVlow Vertical measurement of lower eyeHlow Horizontal measurement of lower eyeSNDR SNDR measurement valuePmax SNDR measurement PmaxSigmaE SNDR measurement σE
SigmaN SNDR measurement σN
SigmaN_3 SigmaN per levelSigmaN_2SigmaN_1SigmaN_0UUGJ UUGJ (rms)UBHPJ UBHPJ (p-p)CEI_EOJ EOJJrms JrmsJ3u J3u (IEEE) jitter measurementJ4u J4uIEEE_EOJ EOJ (IEEE)
GPIB commands (cont.) GPIB command reference
PAM4 Analysis 91

Tag <mnames> ExplanationIEEE_EOJ_01 EOJ measurements for each of the twelve
possible transitionsIEEE_EOJ_02IEEE_EOJ_03IEEE_EOJ_12IEEE_EOJ_13IEEE_EOJ_23IEEE_EOJ_32IEEE_EOJ_31IEEE_EOJ_30IEEE_EOJ_21IEEE_EOJ_20IEEE_EOJ_10IEEE_Rise Rise Time (IEEE)IEEE_Fall Fall Time (IEEE)SNR_ISI SNRISI
LevelDev Level DeviationLevelThick Level ThicknessTimeDev Time DeviationRiseFallAll Rise & Fall (All Edges)
Optical measurement names
Tag <mnames> ExplanationSymErrors Symbol ErrorsSER Symbol Error Ratio (actual)BER Bit Error Ratio (actual)R_LM LinearityRJDJ Jitter: RJ / DJ / TJ@BERVEC Vertical Eye Closure (VEC)EW EW depends on target BER (currently BER 10-5)EH EH depends on target BER (currently BER 10-5)Vupp Vertical measurement of upper eyeHupp Horizontal measurement of upper eyeVmid Vertical measurement of mid eyeHmid Horizontal measurement of mid eyeVlow Vertical measurement of lower eyeHlow Horizontal measurement of lower eyeER Extinction RatioOMAouter Outer Optical Modulation Amplitude
GPIB command reference GPIB commands (cont.)
92 PAM4 Analysis
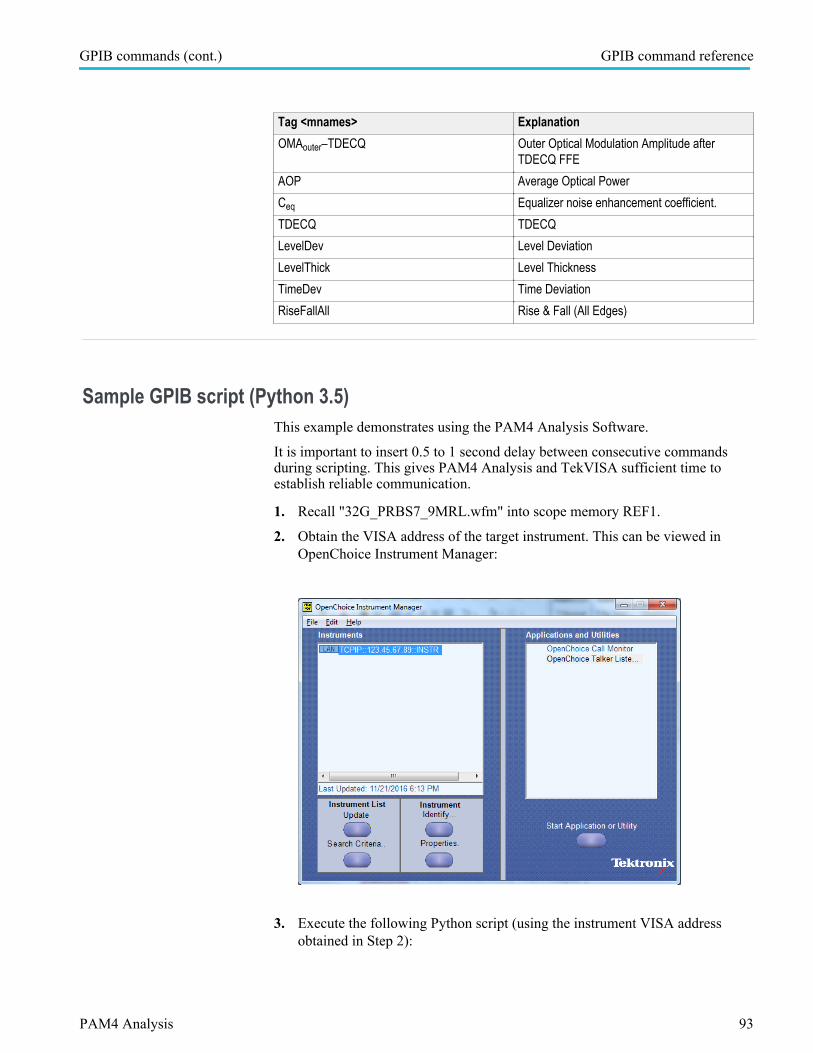
Tag <mnames> ExplanationOMAouter–TDECQ Outer Optical Modulation Amplitude after
TDECQ FFEAOP Average Optical PowerCeq Equalizer noise enhancement coefficient.TDECQ TDECQLevelDev Level DeviationLevelThick Level ThicknessTimeDev Time DeviationRiseFallAll Rise & Fall (All Edges)
Sample GPIB script (Python 3.5)This example demonstrates using the PAM4 Analysis Software.
It is important to insert 0.5 to 1 second delay between consecutive commandsduring scripting. This gives PAM4 Analysis and TekVISA sufficient time toestablish reliable communication.
1. Recall "32G_PRBS7_9MRL.wfm" into scope memory REF1.
2. Obtain the VISA address of the target instrument. This can be viewed inOpenChoice Instrument Manager:
3. Execute the following Python script (using the instrument VISA addressobtained in Step 2):
GPIB commands (cont.) GPIB command reference
PAM4 Analysis 93

# python_pam4demo.py
# Use Python scripting to automate PAM4 Analysis
import time
import visa
# Start VISA session with the instrument
visa_address = 'TCPIP::123.45.67.89::INSTR'
rm = visa.ResourceManager()
scope = rm.open_resource(visa_address)
scope.timeout = 60000
print(scope.query('*idn?').strip())
waittime = 1
# Start PAM4 Analysis
scope.write('APPLICATION:ACTIVATE "PAM4 Analysis"')
time.sleep(waittime)
while(scope.query('variable:value?
"pam4"').strip()!='"OK"'):
time.sleep(5)
# Set waveform source
scope.write('variable:value "pam4","datasource ref1"')
time.sleep(waittime)
scope.write('variable:value "pam4","datasource?"')
time.sleep(waittime)
while(scope.query('variable:value?
"pam4"').strip()!='"OK:REF1"'):
time.sleep(waittime)
scope.write('variable:value
"pam4","datasource?"')
time.sleep(waittime)
# Set data rate
scope.write('variable:value
"pam4","nominalsymbolrate 32"')
time.sleep(waittime)
scope.write('variable:value
GPIB command reference GPIB commands (cont.)
94 PAM4 Analysis

"pam4","nominalsymbolrate?"')
time.sleep(waittime)
while(scope.query('variable:value?
"pam4"').strip()!='"OK:32000000000"'):
time.sleep(waittime)
scope.write('variable:value
"pam4","nominalsymbolrate?"')
time.sleep(waittime)
# Set CTLE
## Turn on CTLE
scope.write('variable:value "pam4","ctleon 1"')
time.sleep(waittime)
scope.write('variable:value "pam4","ctleon?"')
time.sleep(waittime)
while(scope.query('variable:value?
"pam4"').strip()!='"OK:1"'):
time.sleep(waittime)
scope.write('variable:value
"pam4","ctleon?"')
time.sleep(waittime)
## Set CTLE type
scope.write('variable:value
"pam4","ctletype OIF-CEI Gen I"')
time.sleep(waittime)
scope.write('variable:value "pam4","ctletype?"')
time.sleep(waittime)
while(scope.query('variable:value?
"pam4"').strip()!='"OK:OIF-CEI Gen I"'):
time.sleep(waittime)
scope.write('variable:value
"pam4","ctletype?"')
time.sleep(waittime)
## Set CTLE preset
GPIB commands (cont.) GPIB command reference
PAM4 Analysis 95
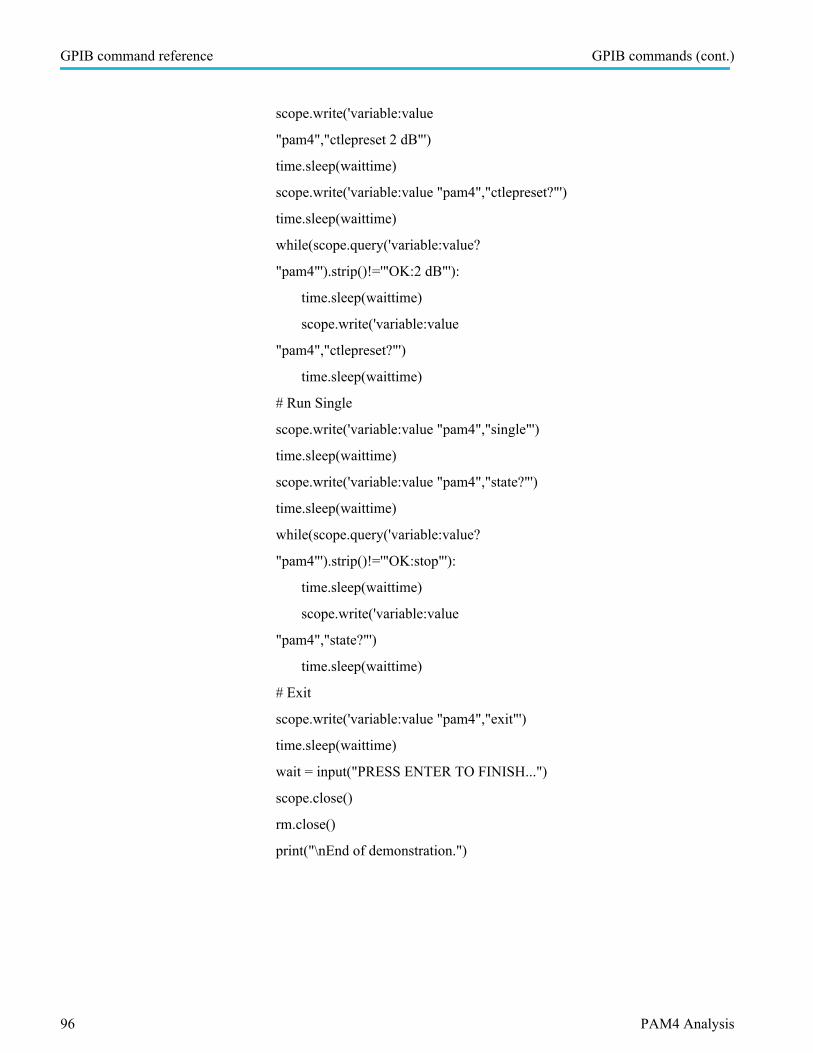
scope.write('variable:value
"pam4","ctlepreset 2 dB"')
time.sleep(waittime)
scope.write('variable:value "pam4","ctlepreset?"')
time.sleep(waittime)
while(scope.query('variable:value?
"pam4"').strip()!='"OK:2 dB"'):
time.sleep(waittime)
scope.write('variable:value
"pam4","ctlepreset?"')
time.sleep(waittime)
# Run Single
scope.write('variable:value "pam4","single"')
time.sleep(waittime)
scope.write('variable:value "pam4","state?"')
time.sleep(waittime)
while(scope.query('variable:value?
"pam4"').strip()!='"OK:stop"'):
time.sleep(waittime)
scope.write('variable:value
"pam4","state?"')
time.sleep(waittime)
# Exit
scope.write('variable:value "pam4","exit"')
time.sleep(waittime)
wait = input("PRESS ENTER TO FINISH...")
scope.close()
rm.close()
print("\nEnd of demonstration.")
GPIB command reference GPIB commands (cont.)
96 PAM4 Analysis

GlossaryBER Bit Error Rate or Ratio. A statistical measure of the frequency of bit errors, expressed as a ratio
between error bits and total bits.
Correlated (averaged) waveform The correlated or averaged waveform is only defined for waveforms with repeating patterns of bitsor symbols. It is a single repeat of the pattern sequence that shows only the deterministic effects(ISI) without any effects due to uncorrelated impairments such as random jitter or noise, or periodiceffects at rates not integrally related to the bit rate or pattern rate.
Conceptually, the correlated waveform for a long real-time waveform with a repeating pattern ofPAM4 symbols is found as follows:
1. The waveform is separated into segments, each holding one full pattern-repeat;
2. The segments are overlaid so that the symbols align and the recovered clock times exactlycoincide;
3. At each (cyclostationary) instant in time across the duration of the repeat, the mean valueacross all the segments is computed and becomes the correlated waveform value at thatinstant.
The actual process must account for time-variant symbol rates and for oscilloscope samples thatdo not coincide.
CTLE Continuous Time Linear Equalizer: a linear equalization method that uses frequency-domainamplitude and phase shaping to counter the effects of a lossy channel or other impairments. It doesnot require clock or symbol recovery.
DFE Decision Feedback Equalizer: A non-linear equalization method that performs clock recovery anduses the recovered states from several prior symbols to predictively correct the next symbol.
DPOJET A Tektronix analysis application that performs Jitter, Eye diagram, and Timing measurements onDPO (and other) series oscilloscopes.
Equalizer A circuit designed to compensate (equalize) the detrimental effects of a transmission channel.Three types of equalizers can be modeled: CTLE (continuous-time linear equalizer), FFE (feed-forward equalizer) and DFE (decision-feedback equalizer).
FFE Feed Forward Equalizer: A linear equalization method that uses FIR with spaced taps to counterthe effects of a lossy channel or other impairments. It can be performed with and without clockrecovery.
ISI Inter-Symbol Interference: A form of waveform distortion in which events (typically waveformtransitions) prior to a point in time cause time-delayed distortions that add or subtract to affect thatpoint.
PAM Pulse Amplitude Modulation, in which a signal with a nominally constant symbol rate uses onediscrete amplitude level during each symbol interval to represent one or more bits.
PAM4 Pulse Amplitude Modulation using four possible voltage levels. Since each symbol can have one offour voltage, it can carry two binary bits of information (conceptually, 00, 01, 10, or 11).
PAM4 Analysis 97
SDLA Serial Data Link Analyzer, a Tektronix analysis application for advanced modeling and simulation ofserial data waveforms, supporting fixture de-embedding, channel embedding and equalization.
SNDR Signal-to-Noise-and-Distortion Ratio: A set of measurements defined by 100G CR4 and KR4standards. SNDR is the ratio between the square of the linear fit pulse peak and the sum ofsquares of linear fit error and vertical noise.
UI Unit interval; the duration of one transmitted symbol which carries two bits of information.
Glossary
98 PAM4 Analysis