pan-arctic land and lake surface temperature from aatsr and …kheyrollah+pour... · pan-arctic...
TRANSCRIPT
Pan-Arctic Land and Lake Surface Temperature from AATSR and MODIS: Products Development and Evaluation
Homa Kheyrollah Pour Claude Duguay University of Waterloo
1st Arctic Products Validation & Evolution Workshop Ottawa, 12-13 November 2014
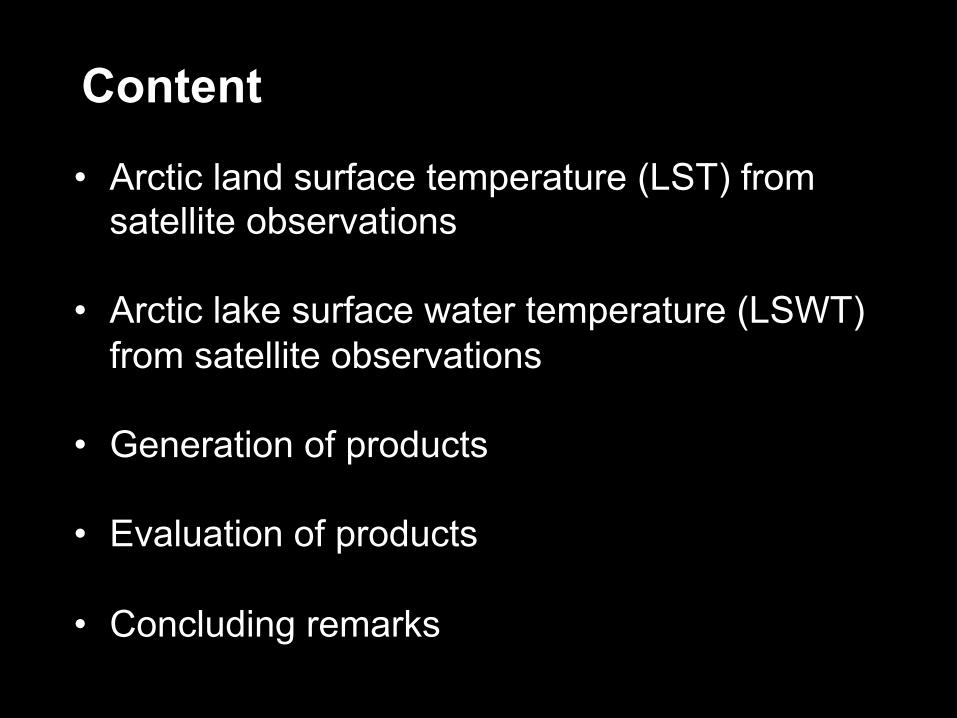
Content
• Arctic land surface temperature (LST) from satellite observations
• Arctic lake surface water temperature (LSWT)
from satellite observations
• Generation of products
• Evaluation of products
• Concluding remarks
Arctic land surface temperature (LST) from satellite observations
• Long term changes in surface temperature • Evaluation of regional climate models • Assimilation into permafrost models
Arctic lake surface water temperature (LSWT) from satellite observations
• Long term changes in water temperature • Evaluation of lake models • Assimilation into weather prediction models
Why?
Why?
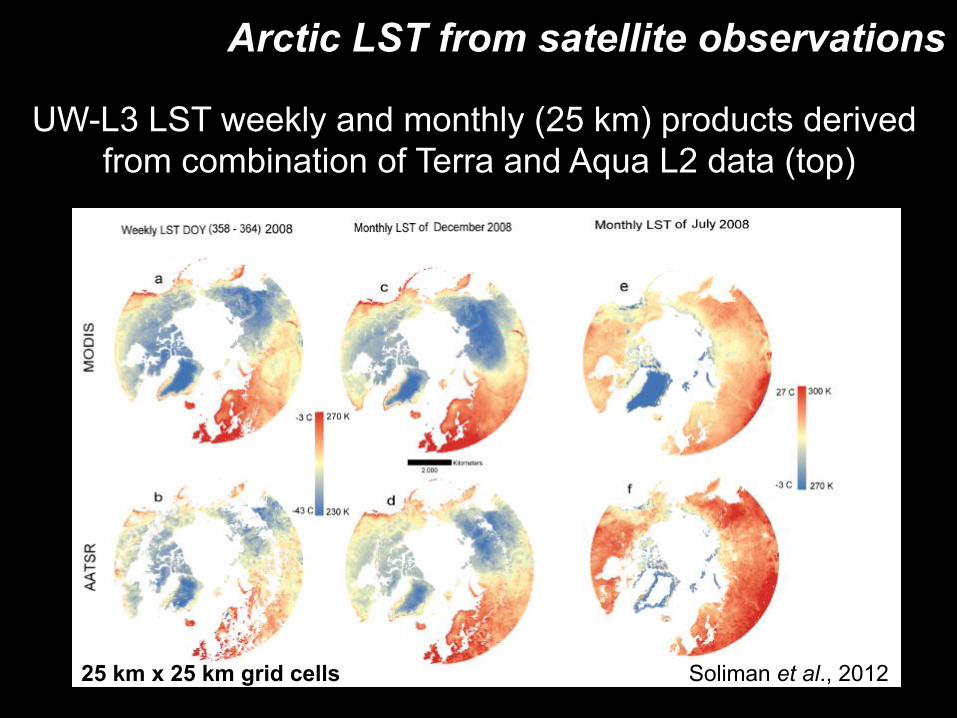
Arctic LST from satellite observations
Soliman et al., 2012 25 km x 25 km grid cells
UW-L3 LST weekly and monthly (25 km) products derived from combination of Terra and Aqua L2 data (top)
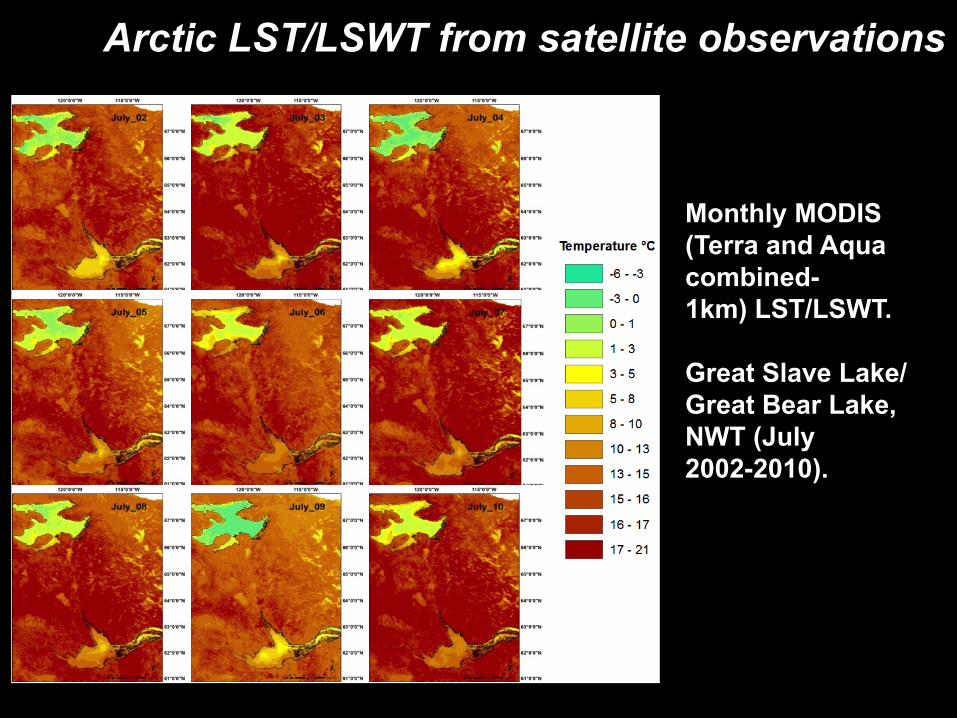
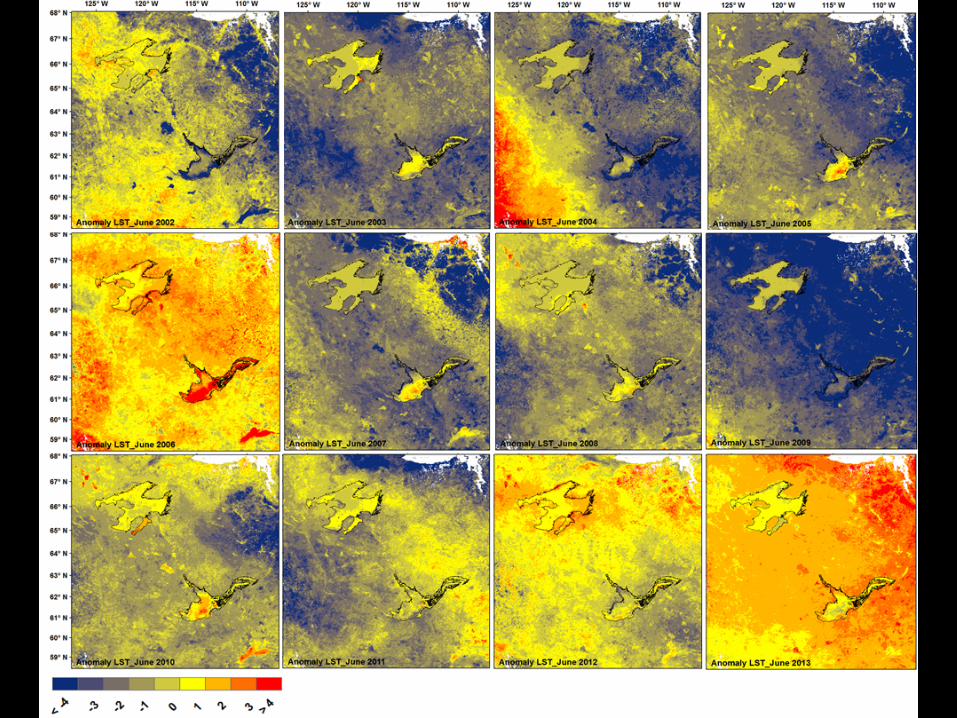
Arctic LST/LSWT from satellite observations
Monthly MODIS (Terra and Aqua combined- 1km) LST/LSWT. Great Slave Lake/Great Bear Lake, NWT (July 2002-2010).
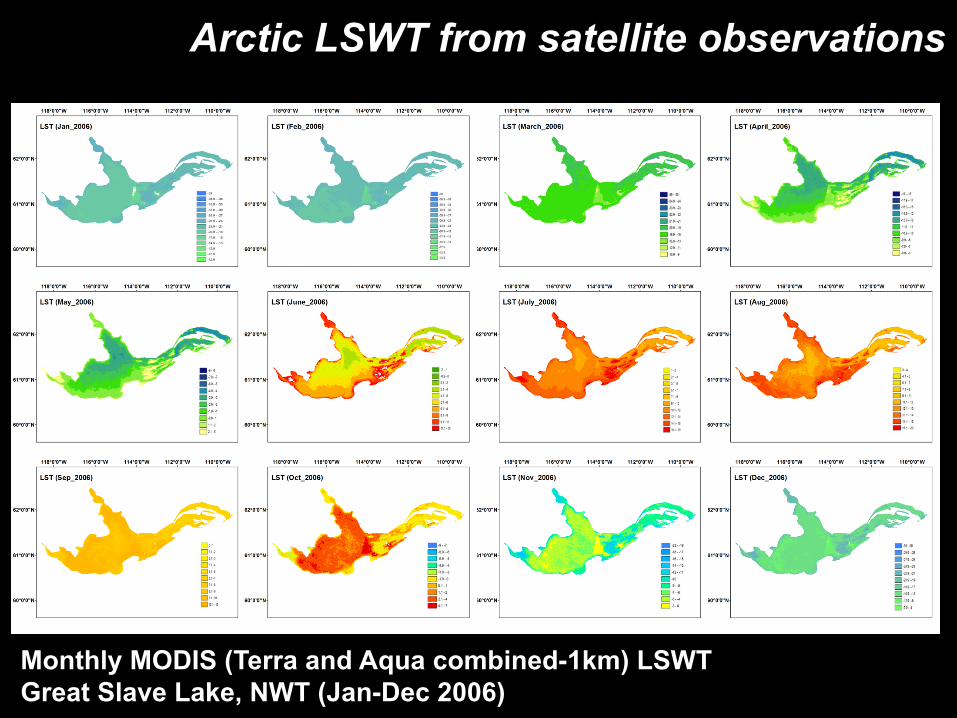
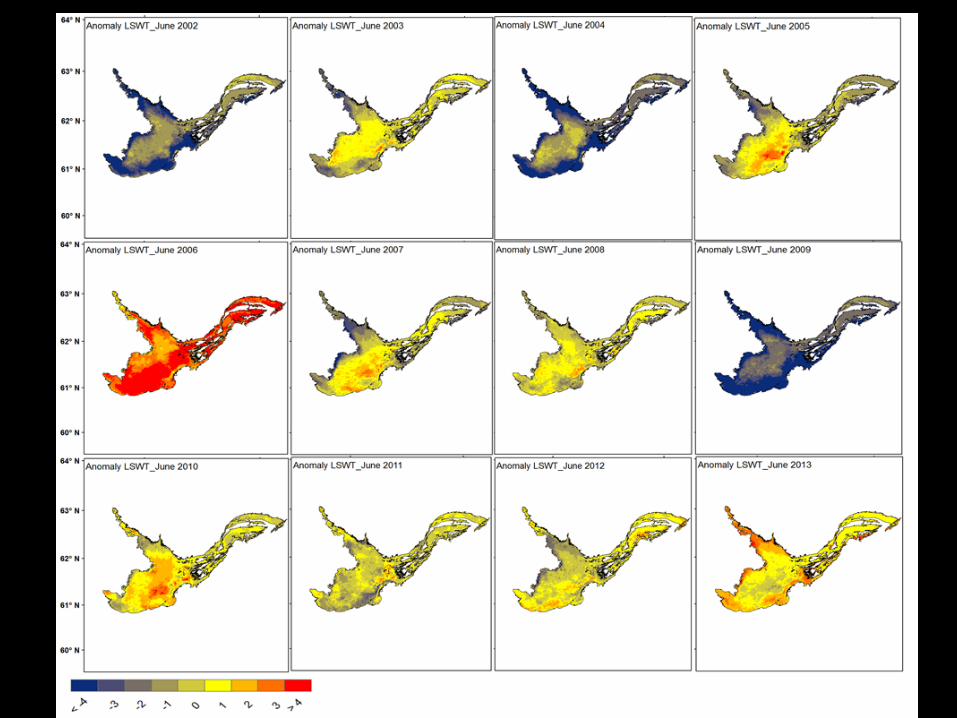
Arctic LSWT from satellite observations
Monthly MODIS (Terra and Aqua combined-1km) LSWT Great Slave Lake, NWT (Jan-Dec 2006)
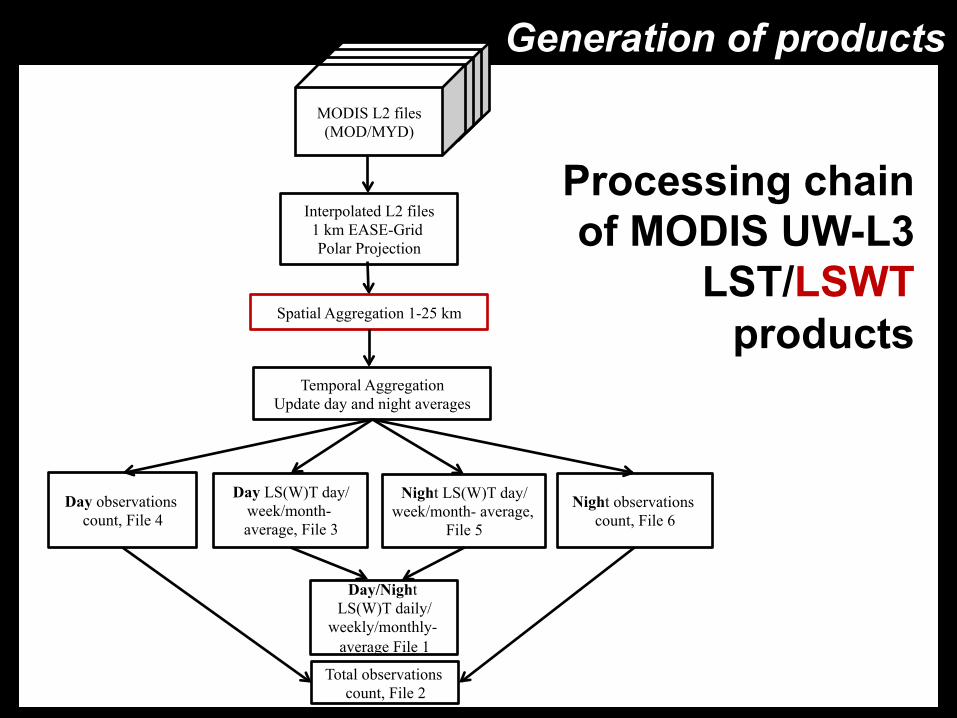
Generation of products MODIS L2 files (MOD/MYD)
Interpolated L2 files 1 km EASE-Grid Polar Projection
Temporal Aggregation Update day and night averages
Day observations count, File 4
Day LS(W)T day/week/month- average, File 3
Night LS(W)T day/week/month- average,
File 5
Night observations count, File 6
Day/Night LS(W)T daily/
weekly/monthly- average File 1
Total observations count, File 2
Spatial Aggregation 1-25 km
Processing chain of MODIS UW-L3
LST/LSWT products

SSM/I: Royer and Poirier, 2010 AMSR-E: Jones et al., 2010
Monthly MODIS (Terra and Aqua combined-1km) and clear-sky monthly average of NARR and SSM/I LST, and AMSR-E screen-height air temperature for July 2007. Mean difference in the order of 1-2 K between MODIS and other products during snow-free conditions.
UW-L3 LST monthly product intercomparison
25 km x 25 km grid cells Soliman et al., 2012
Evaluation of LST products

-50
-40
-30
-20
-10
0
10
20
30
2007 2008
Deline_Station MODIS
Tem
pera
ture
(°C
)
-50
-40
-30
-20
-10
0
10
20
30
40
2007 2008
Deline_Station MODIS
Tem
pera
ture
(°C
)
-50
-40
-30
-20
-10
0
10
20
30
-50 -40 -30 -20 -10 0 10 20 30
MODIS_LST (°C)
Del
ine_
Hou
rlyAi
r Tem
pera
ture
(°C
)
R2= 0.97n= 708Ia= 0.987MBE= 1.12RMSE= ± 4.53
Evaluation of LST products LST vs 2-m air temperature
Daily averaged (MOD/MYD) Hourly overpasses(MOD/MYD)
Evaluation of LSWT products
-10
-5
0
5
10
15
20
25 ΔT (MODIS - In situ) In-situ (0m) MODIS LST
August
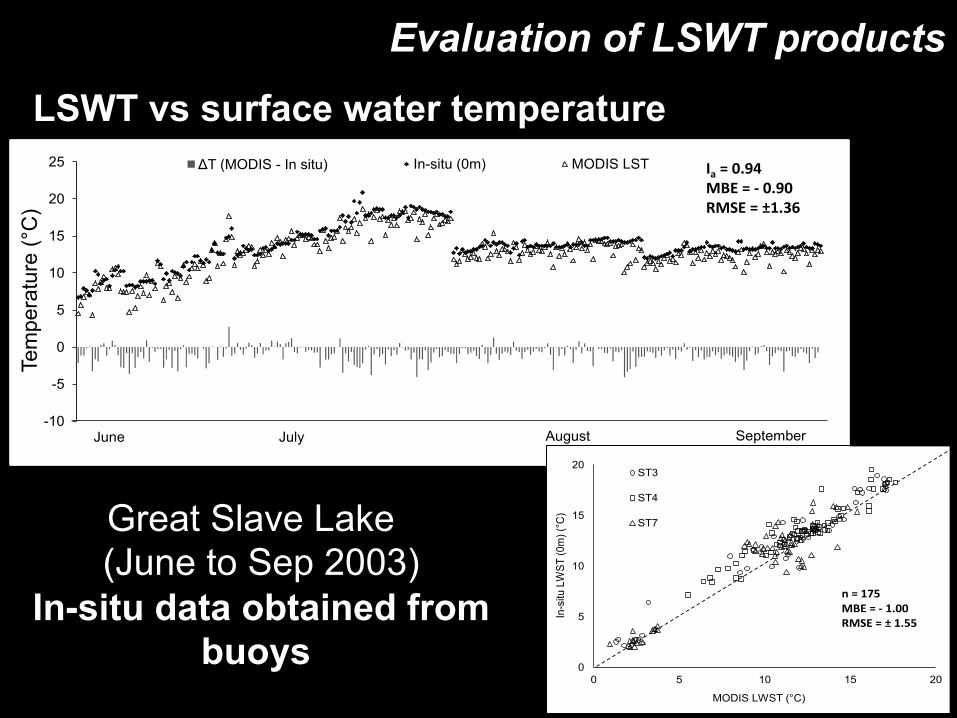
Ia = 0.94MBE = -‐ 0.90RMSE = ±1.36
JulyJune September
Tem
pera
ture
(°C
)
Great Slave Lake (June to Sep 2003)
In-situ data obtained from buoys 0
5
10
15
20
0 5 10 15 20
Axis
Titl
e
ST3
ST4
ST7
n = 175MBE = -‐ 1.00RMSE = ± 1.55
MODIS LWST (°C)
In-s
itu L
WST
(0m
)(°C
)
LSWT vs surface water temperature
Evaluation of LSWT products
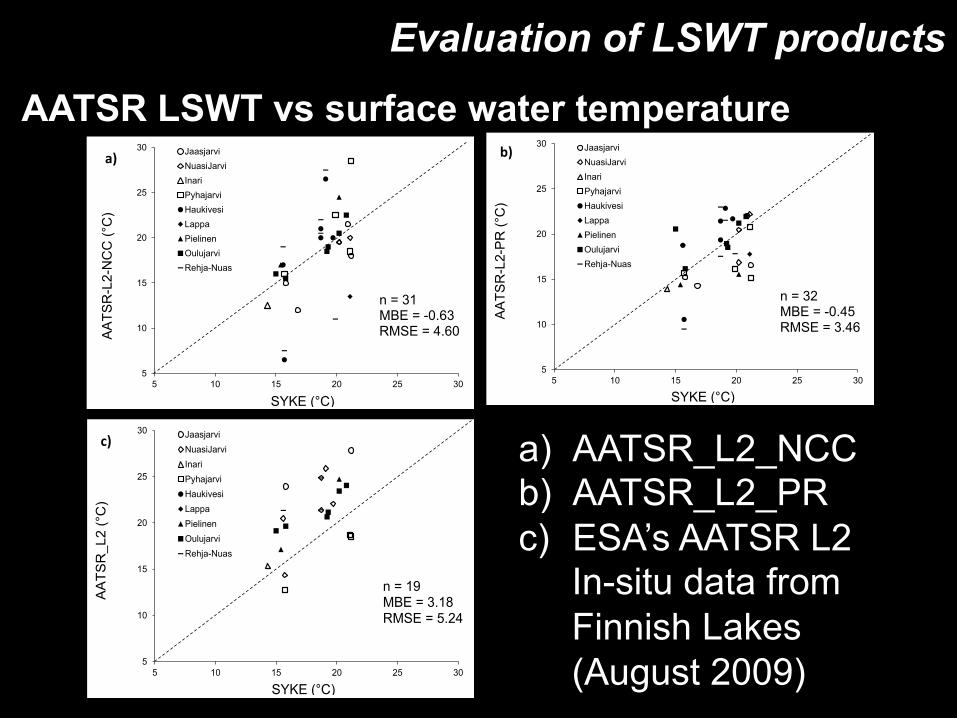
AATSR LSWT vs surface water temperature
5
10
15
20
25
30
5 10 15 20 25 30
JaasjarviNuasiJarviInariPyhajarviHaukivesiLappaPielinenOulujarviRehja-Nuas
SYKE (°C)
AA
TSR
_L2
(°C
)
n = 19MBE = 3.18RMSE = 5.24
c)
5
10
15
20
25
30
5 10 15 20 25 30
JaasjarviNuasiJarviInariPyhajarviHaukivesiLappaPielinenOulujarviRehja-Nuas
SYKE (°C)
AA
TSR
-L2-
PR
(°C
)
n = 32MBE = -0.45RMSE = 3.46
b)
5
10
15
20
25
30
5 10 15 20 25 30
JaasjarviNuasiJarviInariPyhajarviHaukivesiLappaPielinenOulujarviRehja-Nuas
SYKE (°C)
AA
TSR
-L2-
NC
C (°
C)
n = 31MBE = -0.63RMSE = 4.60
a)
a) AATSR_L2_NCC b) AATSR_L2_PR c) ESA’s AATSR L2
In-situ data from Finnish Lakes (August 2009)
Evaluation of LSWT products
-50
-40
-30
-20
-10
0
10
20
30
Jan-02 Jan-03 Jan-04 Jan-05 Jan-06 Jan-07 Jan-08 Jan-09 Jan-10
CLIMo FLake MODIS
Tem
pera
ture
(°C)
-50
-40
-30
-20
-10
0
10
20
30
-50 -40 -30 -20 -10 0 10 20 30
1:1
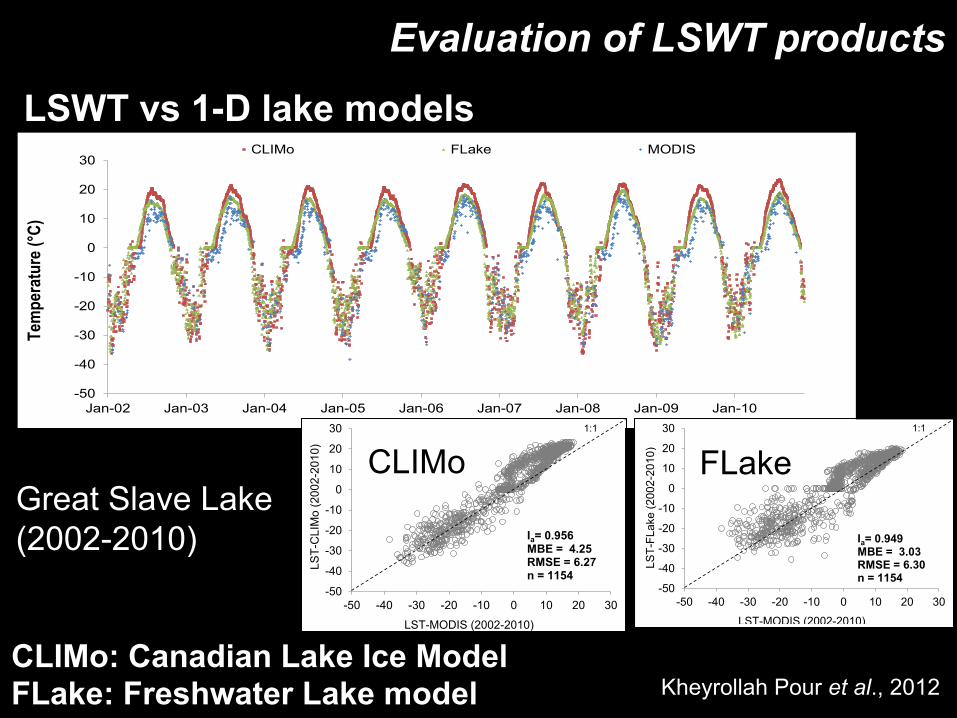
Ia= 0.956MBE = 4.25RMSE = 6.27n = 1154
LST-MODIS (2002-2010)
LST-
CLI
Mo
(200
2-20
10)
-50
-40
-30
-20
-10
0
10
20
30
-50 -40 -30 -20 -10 0 10 20 30
1:1
Ia= 0.949MBE = 3.03RMSE = 6.30n = 1154
LST-MODIS (2002-2010)
LST-
FLak
e (2
002-
2010
)
Great Slave Lake (2002-2010)
Kheyrollah Pour et al., 2012
LSWT vs 1-D lake models
CLIMo FLake
CLIMo: Canadian Lake Ice Model FLake: Freshwater Lake model
Evaluation of LSWT products
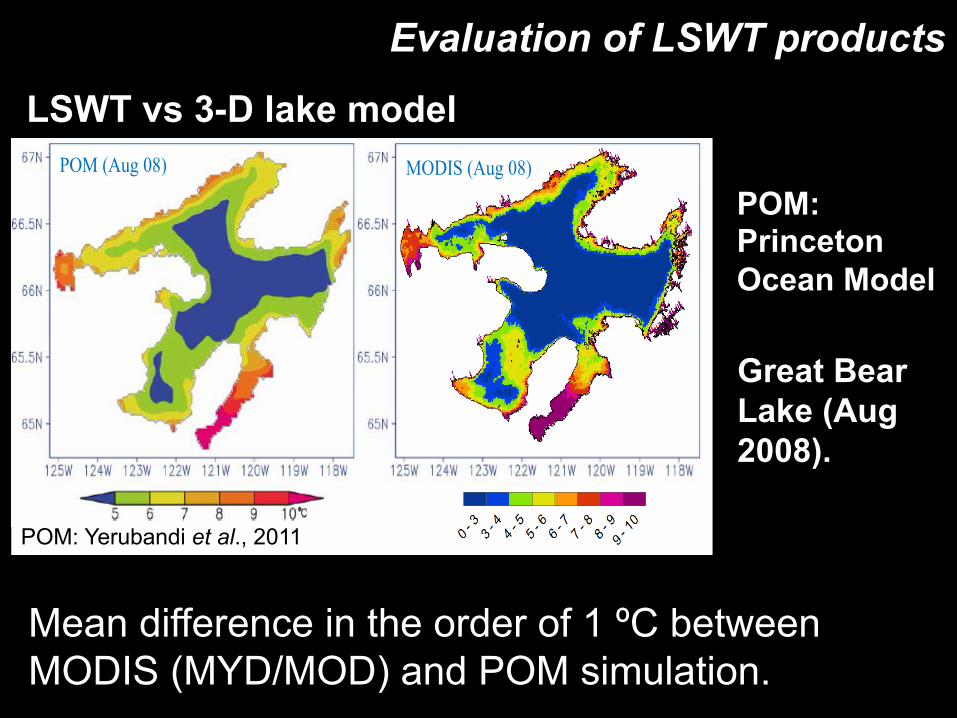
Great Bear Lake (Aug 2008).
LSWT vs 3-D lake model
POM: Princeton Ocean Model
POM (Aug 08) MODIS (Aug 08)
POM: Yerubandi et al., 2011
Mean difference in the order of 1 ºC between MODIS (MYD/MOD) and POM simulation.
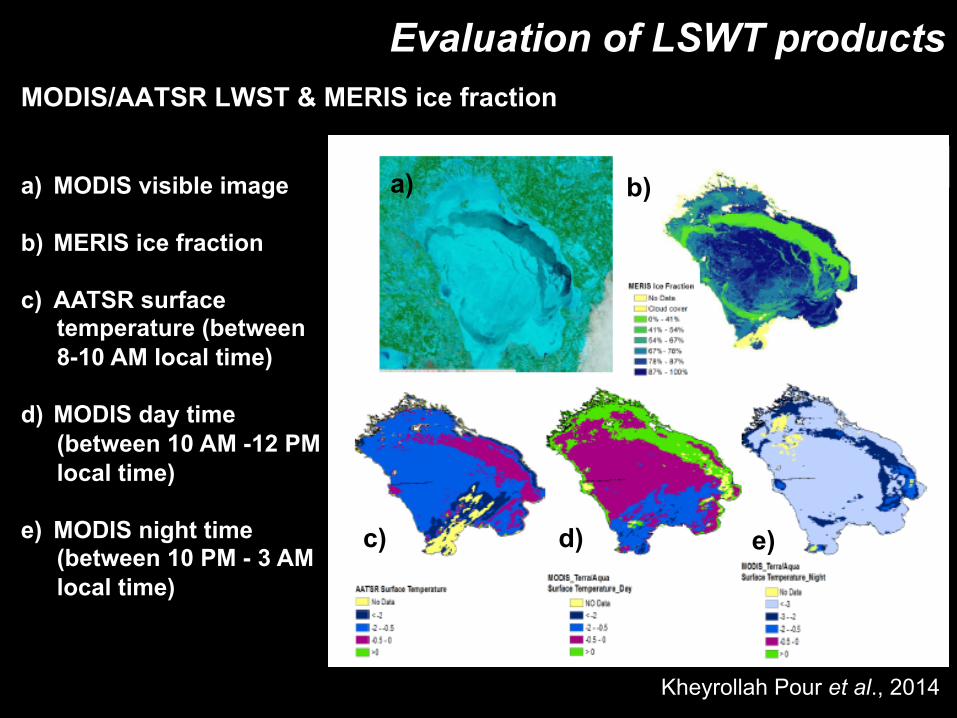
Evaluation of LSWT products MODIS/AATSR LWST & MERIS ice fraction
12 April 2011 a) b)
c) d) e)
a) MODIS visible image
b) MERIS ice fraction
c) AATSR surface temperature (between 8-10 AM local time)
d) MODIS day time (between 10 AM -12 PM local time)
e) MODIS night time (between 10 PM - 3 AM local time)
Kheyrollah Pour et al., 2014
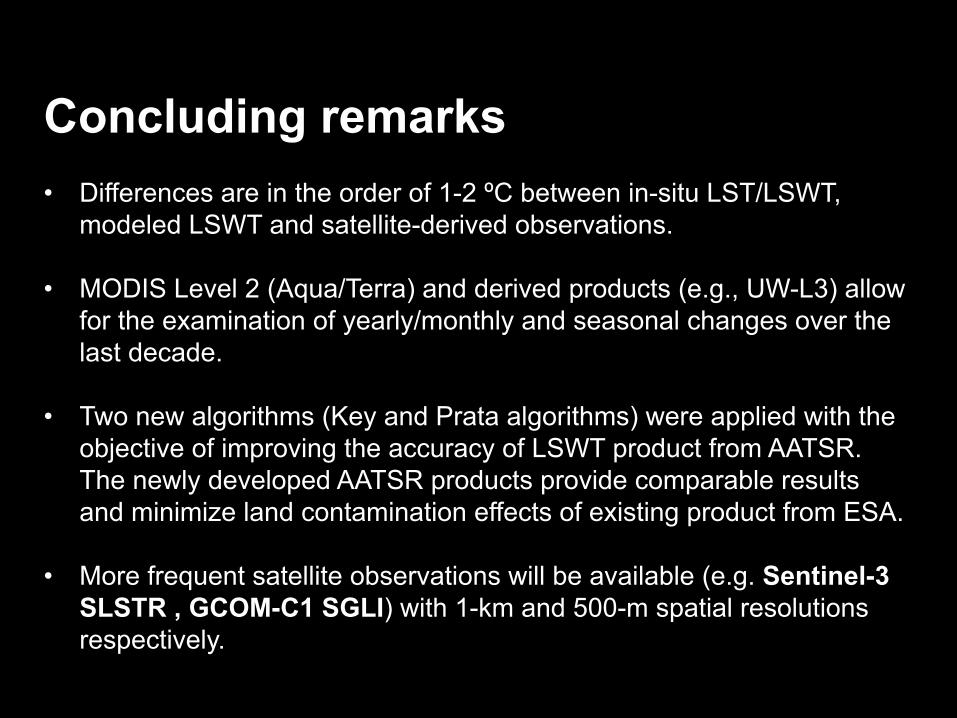
Concluding remarks • Differences are in the order of 1-2 ºC between in-situ LST/LSWT,
modeled LSWT and satellite-derived observations.
• MODIS Level 2 (Aqua/Terra) and derived products (e.g., UW-L3) allow for the examination of yearly/monthly and seasonal changes over the last decade.
• Two new algorithms (Key and Prata algorithms) were applied with the objective of improving the accuracy of LSWT product from AATSR. The newly developed AATSR products provide comparable results and minimize land contamination effects of existing product from ESA.
• More frequent satellite observations will be available (e.g. Sentinel-3 SLSTR , GCOM-C1 SGLI) with 1-km and 500-m spatial resolutions respectively.

Questions?
2nd Annual EarthTemp Network Meeting 12-14 June 2013 Surface temperature in data-sparse and extreme regions Copenhagen, Denmark
Churchill, MB. Feb. 2011
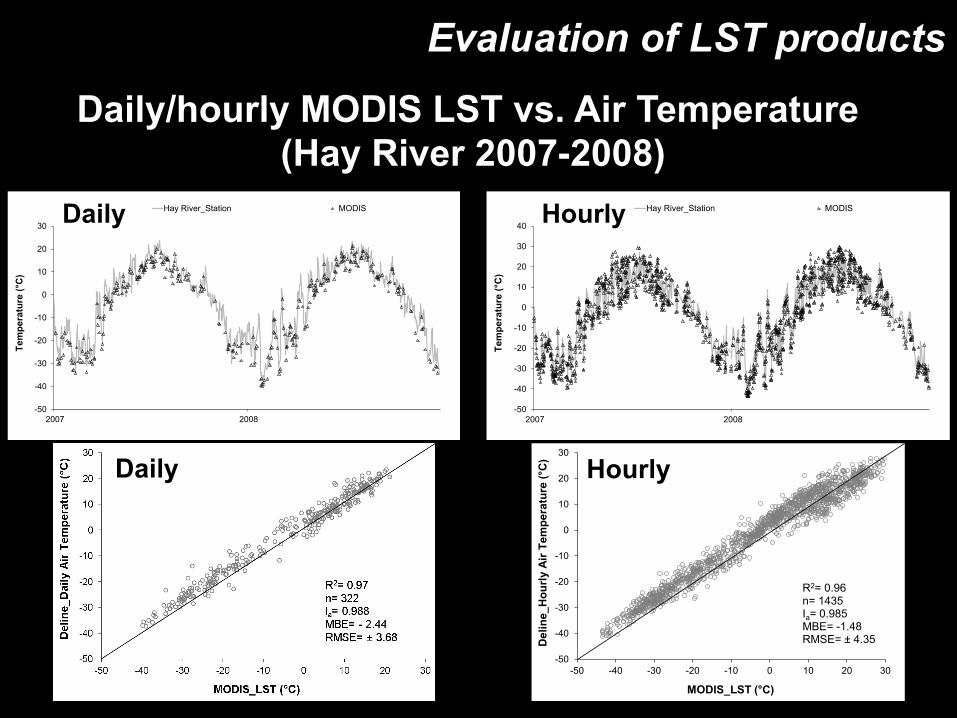
Evaluation of LST products
-50
-40
-30
-20
-10
0
10
20
30
2007 2008
Hay River_Station MODIS
Tem
pera
ture
(°C
)
-50
-40
-30
-20
-10
0
10
20
30
40
2007 2008
Hay River_Station MODIS
Tem
pera
ture
(°C
)
-50
-40
-30
-20
-10
0
10
20
30
-50 -40 -30 -20 -10 0 10 20 30
MODIS_LST (°C)
Del
ine_
Hou
rlyAi
r Tem
pera
ture
(°C
)
R2= 0.96n= 1435Ia= 0.985MBE= -1.48RMSE= ± 4.35
Daily/hourly MODIS LST vs. Air Temperature (Hay River 2007-2008)
Daily
Daily
Hourly
Hourly
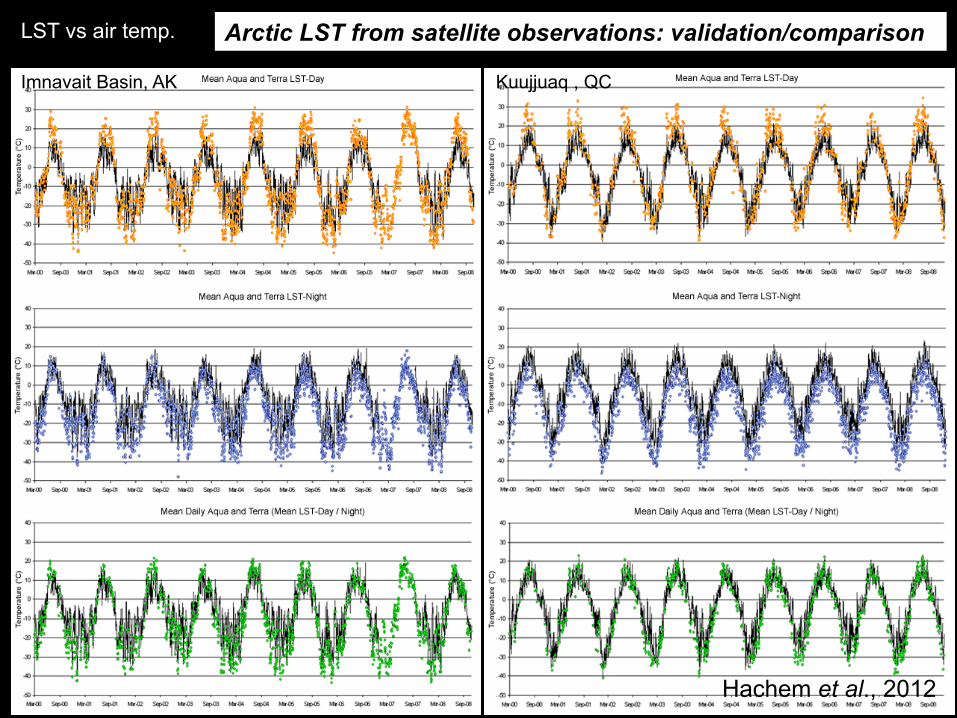
Arctic LST from satellite observations: validation/comparison
! !
Imnavait Basin, AK Kuujjuaq , QC
LST vs air temp.
Hachem et al., 2012
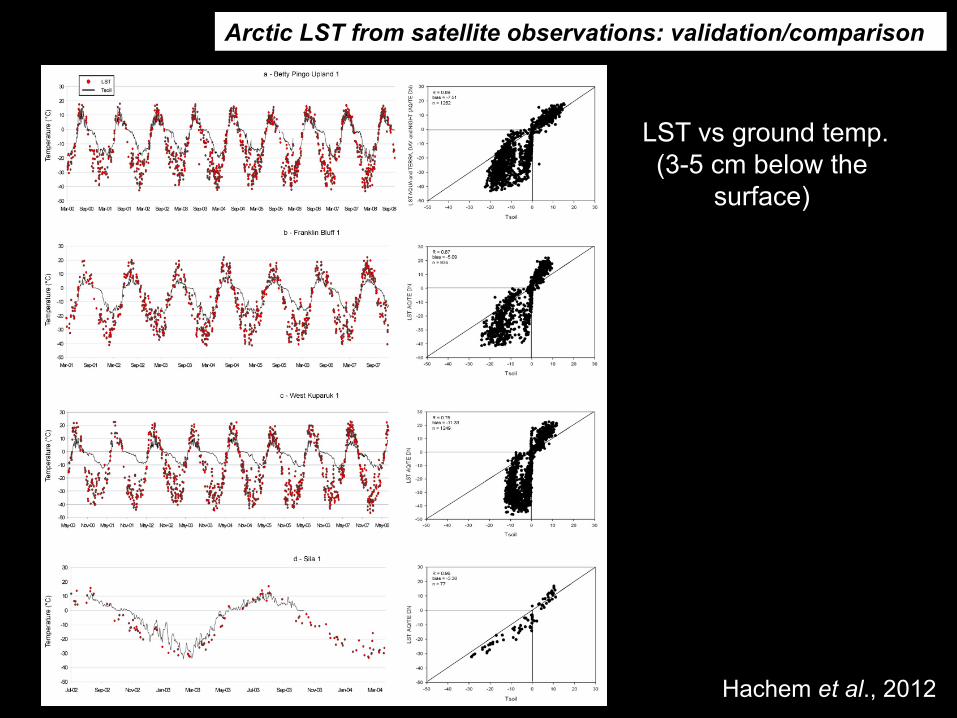
Arctic LST from satellite observations: validation/comparison
Imnavait Basin, AK Kuujjuaq , QC
LST vs ground temp. (3-5 cm below the
surface)
Hachem et al., 2012
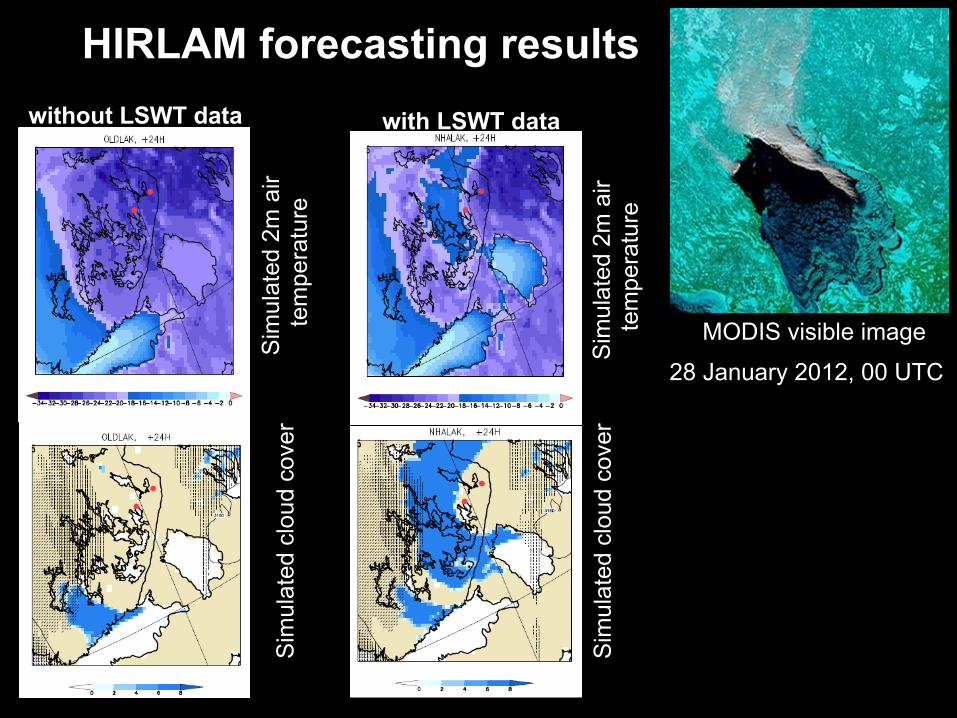
HIRLAM forecasting results
Sim
ulat
ed 2
m a
ir te
mpe
ratu
re
Sim
ulat
ed c
loud
cov
er
without LSWT data
Sim
ulat
ed 2
m a
ir te
mpe
ratu
re
Sim
ulat
ed c
loud
cov
er
with LSWT data
28 January 2012, 00 UTC
MODIS visible image
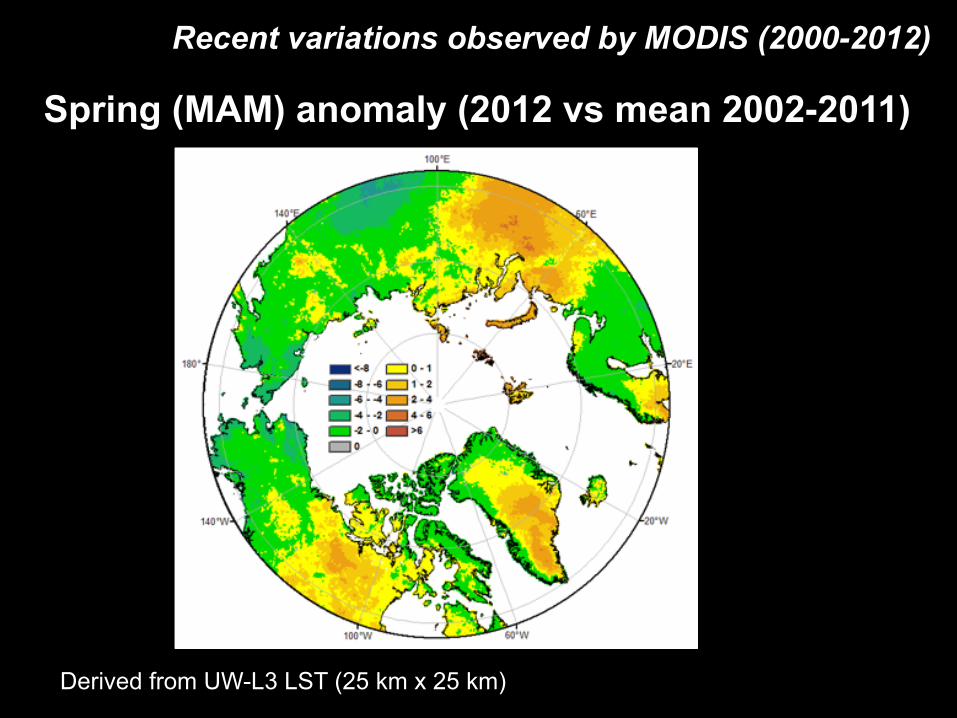
Spring (MAM) anomaly (2012 vs mean 2002-2011)
Recent variations observed by MODIS (2000-2012)
Derived from UW-L3 LST (25 km x 25 km)
March
April
May
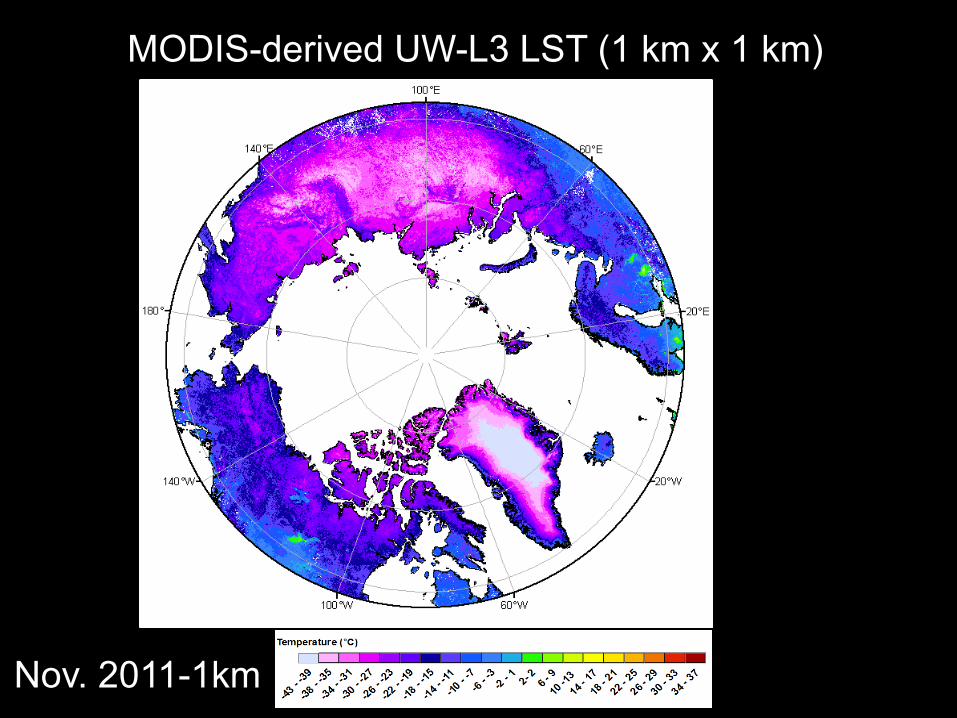
Nov. 2011-1km
MODIS-derived UW-L3 LST (1 km x 1 km)
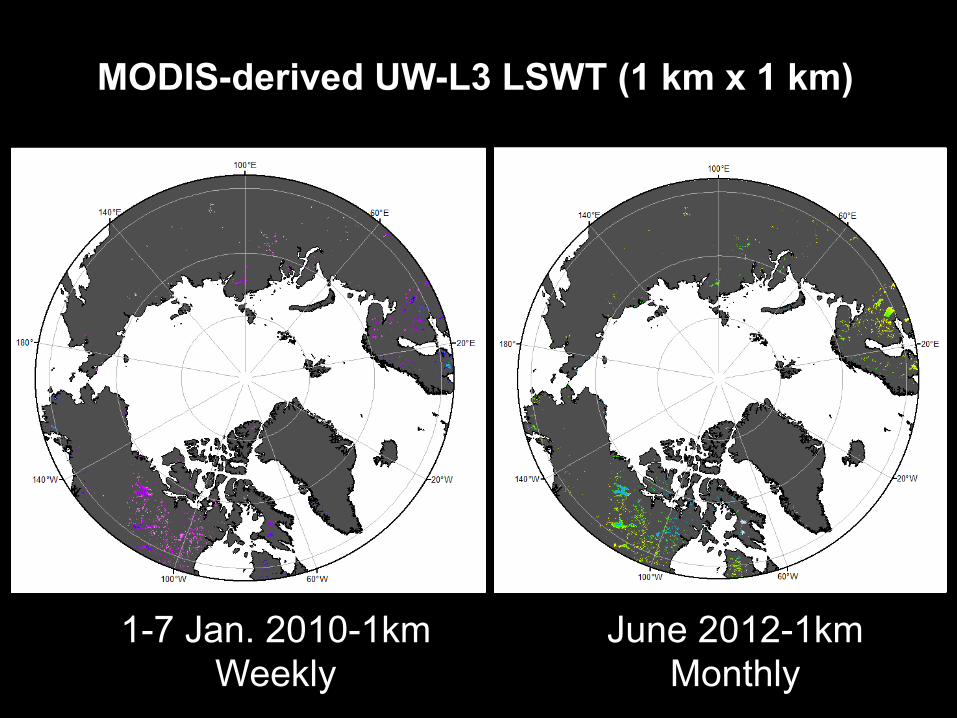
MODIS-derived UW-L3 LSWT (1 km x 1 km)
1-7 Jan. 2010-1km Weekly
June 2012-1km Monthly