panama locking in success public disclosure...
TRANSCRIPT

PANAMA: LOCKING IN SUCCESS
A SYSTEMATIC COUNTRY DIAGNOSTIC
JANUARY 16, 2015
Pub
lic D
iscl
osur
e A
utho
rized
Pub
lic D
iscl
osur
e A
utho
rized
Pub
lic D
iscl
osur
e A
utho
rized
Pub
lic D
iscl
osur
e A
utho
rized

i
ACKNOWLEDGEMENTS
We would like to thank the members of the Panama Country Team from all Global Practices and
IFC, as well as all the partners and stakeholders in Panama, who have contributed to the preparation
of this document in a strong collaborative process. (A full description of this process is found in
Annex 1). We are very grateful for the generosity exhibited in providing us with substantive inputs,
knowledge and advice, particularly given the time limitations.
The team is co-led by Friederike (Fritzi) Koehler-Geib (Sr. Economist) and Kinnon Scott (Sr.
Economist). Ayat Soliman (Program Leader) provided overall coordination. In addition, the
following people provided substantive inputs and guidance: Humberto Lopez (Country Director),
Frank Sader (Principal Strategy Officer), Louise J. Cord (Practice Manager), Auguste Tano
Kouame (Practice Manager), Maryanne Sharp (Country Operations Adviser), Oscar Calvo-
Gonzalez (Program Leader), and Kathy A. Lindert (Program Leader). Peer reviewers are: Pablo
Fajnzylber, Practice Manager; David Gould, Lead Economist; and Jennifer J. Sara, Director.
The table below identifies the full list of team members that have contributed their time, effort and
expertise, and their affiliations. CMU/Global Practice/Cross
Cutting Solution Area/IFC
Team Member
Agriculture Irina I. Klytchnikova, Norman Bentley Piccioni
Caribbean CMU Francisco Galrao Carneiro
Central America CMU Jovana Stojanovic, Kathy A. Lindert, Mary Rose Parrish, Maria del Camino
Hurtado, Oscar Calvo-Gonzalez, Anabela Abreu, Sara Paredes Ponce, Meilyn
Gem, Michelle Mccue, Sonia Molina, Desiree Gonzales
Climate Change Luiz T. A. Maurer
Education Rita Almeida
Energy and Extractives Fernando Javier Anaya Amenabar, Javier Aguilar, Mark Lambrides, Susana
Moreira
Environment and Natural
Resources
Carter J. Brandon, Karen I. Martinez Ona, Klas Sander
Finance and Markets Ana Fiorella Carvajal, Rekha Reddy
Global Partnerships Ashruf Mohammad Megahed
Governance Diego R. Dorado Hernandez, Francisco Lazzaro, Svetlana I. Proskurovska
Health, Nutrition and Population Carmen Carpio, Christine Lao Pena
IFC Angela M. Fonseca Arango, Eduardo Wallentin, Gabriel B. Goldschmidt, Irene
Arias, Luv Jhangimal Khemchand, Sofia Stefanelli
LAC Chief Economist Office Jaime R. de Pinies Bianchi
Macroeconomics and Fiscal
Management
Jennifer Keller, Diana M. Lachy Castillo, Miguel Angel Saldarriaga Noel,
Rong Qian, Silvia Gulino, Susana M. Sanchez, Jennifer Keller
Poverty Mateo Salazar Rodriguez, Liliana Sousa, Bernarda Erazo
Social Protection and Labor Edmundo Murrugarra, Emma M. Monsalve Montiel, Pablo Ariel Acosta
Trade and Competitiveness Alejandro Espinosa-Wang, Jose Eduardo Gutierrez Ossio,
Transport and ICT Lincoln Flor, Shomik Mehndiratta, Doyle Galegos
Treasury Concepcion Aisa Otin, Hector Ibarra Pando
Urban, Rural and Social
Development
Armando Guzman Escobar, Agustin Maria, Carmen Bernardo Garcia, Catalina
Marulanda, Dianna M. Pizarro, Kimberly Vilar, Yoonhee Kim, Luis-Felipe
Dulchicela, Ramon Anria

ii
Water Antonio M. Rodriguez Serrano, Carmen Rosa Yee-Batista, Charles Delfieux,
Elvira Cusiqoyllor Broeks Motta, Laura Maratou-Kolias, Miguel Vargas
Ramirez
ABBREVIATIONS AND ACRONYMS
ACP Panama Canal Authority
ANAM National Environmental Authority
ASEP National Authority of Public Services (Autoridad Nacional de Servicios Públicos)
CBI Panamanian Centro Bancario Internacional
CEDLAS Center for Distributive and Social Studies
CGE Computable General Equilibrium
CND National Dispatch Center
DISAPAS Directorate of Water and Sanitation of the Ministry of Health
DICRE Dirección de Inversiones, Concesiones y Riesgos del Estado.
DIPORP National Integrated Development Plan of the Indigenous Peoples of Panama
ECLAC Economic Commission for LAC
EML Encuesta de Mercado Laboral
ENASSER Encuesta Nacional de Salud Sexual y Reproductiva
ETESA National Electricity Transmission Company
FARC Revolutionary Armed Forces of Colombia
FDI Foreign Direct Investment
GDP Gross Domestic Product
GMM General Method of Moments
IBC International Banking Center
IDB Inter-American Development Bank
IDAAN National Water Supply and Sanitation Administration
IFC International Finance Corporation
ILO International Labor Organization
IMF International Monetary Fund
INEC National Institute of Statistics and Census
IPCC International Panel on Climate Change
IRHE Institute of Water and Electrification
LAC Latin America and the Caribbean
LAPOP Latin American Public Opinion Project
LSCI Liner Shipping Connectivity Index
MAPAS Monitoring Country Progress in Water Supply and Sanitation
MDG Millennium Development Goal
MEF Ministry of Economy and Finance
MICI Ministry of Commerce and Energy
MINSA Ministry of Health
OECD Organization for Economic Co-operation and Development
PAHO Pan American Health Organization
PCW Panama Canal Watershed
PISA Program for International Student Assessment
SCD Systematic Country Diagnostic
SEDLAC Socio-Economic Data Base data base for Latin America and the Caribbean
SEM Sedes de empresas multinacionales

iii
SIEPAC Sistema de Interconexión Eléctrica de los Países de América Central
SSEIR Social Sector Expenditure and Institutional Review
UNCTAD United Nations Conference on Trade and Development
UNDP United Nations Development Program
UNHR United Nations Human Rights
UNODC United Nations Office on Drugs and Crime
U.S. United States
USG United States Government
WDI World Development Indicators
WBES World Bank Enterprise Surveys
WEO World Economic Outlook
WSS Water and Sanitation Services

iv
TABLE OF CONTENTS
I. Executive Summary................................................................................................................. 1 The Nature of Growth in Panama ............................................................................................... 1
Inclusion and Economic Growth ................................................................................................. 2 Sustainability: Economic, Social and Environmental ................................................................. 4 Priority Areas and Complementarities ........................................................................................ 6 Knowledge Gaps ......................................................................................................................... 6
II. Poverty and Shared Prosperity in Panama............................................................................... 8
III. The Nature of Panama’s Economic Growth .......................................................................... 18 The Canal and Trends in World Trade ...................................................................................... 18
The Impact of the Canal on Growth in Specific Sectors ........................................................... 21 The Increasing Role of Public Investment ................................................................................ 28 FDI and Private Investment ....................................................................................................... 28 Panama’s Stable Macroeconomic Environment ....................................................................... 32
Outlook ...................................................................................................................................... 33 IV. Prioritization Linked to Growth ............................................................................................ 35
Prioritization Process ................................................................................................................. 35 Benchmarking the Determinants of Growth ............................................................................. 36
a. Cross Country Benchmarking ........................................................................................ 36
b. Perception Data .............................................................................................................. 39 c. Firm-Level Micro Data .................................................................................................. 39
d. Synthesis......................................................................................................................... 40 Priority Areas ............................................................................................................................ 40
Identified Opportunities ............................................................................................................ 47 V. Inclusiveness of Panama’s Growth ....................................................................................... 51
Positive Trends .......................................................................................................................... 52 Limitations of Growth’s Effects ................................................................................................ 54 Drivers of Poverty Reduction .................................................................................................... 62
VI. Prioritization Linked to Inclusion .......................................................................................... 68 Benchmarking ........................................................................................................................... 68
Priority Area .............................................................................................................................. 72 Identified Opportunities ............................................................................................................ 73
VII. Sustainability ......................................................................................................................... 77 Economic Sustainability ............................................................................................................ 77
Social Sustainability .................................................................................................................. 81 Environmental Sustainability .................................................................................................... 83
VIII. Prioritization Linked to Sustainability ........................................................................... 86 Benchmarking ........................................................................................................................... 86 Priority Area .............................................................................................................................. 88
Identified Opportunities ............................................................................................................ 88 IX. Conclusion ............................................................................................................................. 90 References ..................................................................................................................................... 92

v
LIST OF ANNEXES
Annex 1: Team engagement and consultation process ................................................................ 96 Annex 2: Definition of Peer Countries ...................................................................................... 105
Annex 3: Matrices of Identified Opportunities ........................................................................... 107 Annex 4: International Finance Corporation – Sector Notes ...................................................... 119 Annex 5: Comparison Between ACP and ANAM Water Management Models ........................ 133

vi
LIST OF FIGURES
Figure II.1 Panama’s Poverty Rates 2007 to 2012 (Percent, national poverty line) ..................... 8 Figure II.2 Poverty in LAC and Panama 2007 to 2012 (Percent, international poverty line) ..... 8
Figure II.3 Middle Class in Panama and LAC 2007 to 2012 (Percent, national poverty line) ...... 9 Figure II.4 Urban and Rural Extreme Poverty in Panama 2007 to 2012 (Percent, national
poverty line) .................................................................................................................................... 9 Figure II.5 Shared Prosperity in Latin America and the Caribbean, 2007-2012 (Annualized
Growth Rate of Income for the Poorest 40 % and the Overall Population) ................................. 11
Figure II.6 Shared Prosperity across the Country (Mean Income Growth, Percent) .................... 12 Figure II.7 Panama’s GDP Per Capita as a Share of US versus Latin America (percent, constant
2005 US$) ..................................................................................................................................... 13 Figure II.8 Real GDP Growth in Panama and its Peer Countries 2001 to 2013 (percent change) 13 Figure II.9 Gini coefficient in Panama and LAC 2007 to 2012(Index) ........................................ 14 Figure II.10 Datt-Ravallion Decomposition of Poverty (Percent) ............................................... 14
Figure II.11 Movements out of Poverty ........................................................................................ 15 Figure II.12 Changes in Poverty Status by Original Characteristic (Percent) .............................. 15
Figure II.13 Employment Creation in Panama between 2012 and 2013 Versus its Peers (percent
change) .......................................................................................................................................... 16 Figure II.14 Job Creation by Education Level .............................................................................. 16
Figure II.15 Panama’s Social Spending by Sector (percent of GDP) ........................................... 17 Figure II.16 Growth versus Volatility in Panama and Its Peer Countries 2001-2013 (average
percent change) ............................................................................................................................. 17 Figure III.1 Panama’s Trade Openness compared to its Peer Countries, as measured by the Share
of Exports and Imports of Goods and Services in GDP (Percent of GDP) .................................. 18 Figure III.2 Contribution of Aggregate Demand Factors to Economic Growth from 1947 to 2013
(Percentage points)........................................................................................................................ 18 Figure III.3 Transport and Communication Share of GDP and GDP Growth (Percent, Growth
Index 1950=100) ........................................................................................................................... 19
Figure III.4 Panama-U.S. Growth Differential (percentage points, Panama GDP pc growth minus
U.S. pc growth p.p.) and Inflation Differential ............................................................................. 20
Figure III.5 Panama Canal Revenues, Commodity Index, and World Trade 2000-2013 (nominal
Index, 2000=10) ............................................................................................................................ 21
Figure III.6 Transport Infrastructure in the Canal Zone ............................................................... 23 Figure III.7 Logistic Performance Index ..................................................................................... 23
Figure III.8 Real GDP growth in Panama and its Peer Countries 2001 to 2013 (Percent change)
....................................................................................................................................................... 23 Figure III.9 Line Shipping Connectivity ....................................................................................... 25 Figure III.10 Sectorial Contributions to GDP Growth from 1947 to 2013 (Percentage points) ... 26 Figure III.11 Employment by Sector and Education Level (Total number, 2012) ....................... 26
Figure III.12 Savings versus Investment 1980 to 2013 (Percent of GDP) ................................... 29 Figure III.13 Real GDP Growth and FDI 1980 to 2012 (Percent change) ................................... 29 Figure III.14 Savings versus Investment 1980 to 2013 (Percent of GDP) ................................... 29 Figure III.15 FDI by Economic Activity 2010 to 2012 (Share of total FDI) ............................... 29
Figure III.16 Imports of Goods and Services 1996 -2003 (Share of GDP) .................................. 30 Figure III. 17 Exports of Goods and Services 1996 -2013 (Share of GDP) ................................ 30 Figure III.18 Factors Contribution to GDP Growth 1971 to 2012 (Percentage points) ............... 31

vii
Figure III.19 Labor Productivity by Economic Activity (Dollars of 1996) .................................. 31 Figure IV.1 Prioritization Process................................................................................................. 35 Figure IV.2 Stabilization and Structural Policies Index ............................................................... 38 Figure IV.3 Enrollment Rates by Level, 1990-2010..................................................................... 42
Figure IV.4 Top Ten Business Environment Complaints ............................................................. 43 Figure IV.5 Educational Attainment among Immigrants in the Labor Force in 2010 (By country
of birth) ......................................................................................................................................... 43 Figure IV.6 PISA 2009 Mathematics Mean Score (By country for 15-year-old students and GDP
per capita)...................................................................................................................................... 44
Figure IV.7 Panama’s Institutional Quality in International Comparison .................................... 45 Figure IV.8 Panama’s Efficiency of Legal Framework in International Comparison .................. 45
Figure V.1 Annualized Growth Incidence Curve 2007- 2012 (Constant prices of 2002) ........... 51 Figure V.2 Night Lights in Panama 1997 and 2012 ..................................................................... 52 Figure V.3 The Rise of the Middle Class .................................................................................... 53 Figure V.4 Gini Coefficient by Area ........................................................................................... 53
Figure V.5 Percent of the Population with Access to Basic Services, 1990 to 2012.................... 54 Figure V.6 Changes in Overall Poverty Rates by Geographic Area, 2007-2012 ......................... 54
Figure V.7 Poverty Rates by Province and Comarca, 2012 (percent).......................................... 55 Figure V.8 Changes in Geographic Concentration of the Extreme Poor ...................................... 55 Figure V.9 Destination of Internal Migrants between 2000 and 2010 (percent) .......................... 56
Figure V.10 Educational Attainment of Internal Migrants, 2010 (by Ethnicity, percent) ............ 56 Figure V.11 Unemployment Rates (Open and Broad), by Migration Status and Ethnicity, 2010
(percent) ........................................................................................................................................ 57 Figure V.12 Characteristics of the Poor, ....................................................................................... 58
Figure V.13 Characteristics of the Extreme Poor, by Geographic Area ....................................... 58 Figure V.14 Basic Characteristics of the Indigenous Living in and outside of the Comarcas and
Non-Indigenous in Panama, 2010 ................................................................................................. 61 Figure V.15 Basic Characteristics of the Afro-descendants and all Others in Panama, 2010 ...... 61 Figure V.16 Change in Access to Piped Water in the Dwelling, 2000-2010 ............................... 61
Figure V.17 Change in Access to Sewage Connection in the Dwelling, 2000-2010 ................... 61 Figure V.18 Access to Running Water in the Dwelling by Concentrations ................................. 62
Figure V.19 Contribution of Different Income Sources to Changes in Overall Poverty, 2007-
2012............................................................................................................................................... 63
Figure V.20 Contribution of Different Income Sources to Changes in Extreme Poverty, 2007-
2012............................................................................................................................................... 63
Figure V.21 Net Number of Jobs Created by Geographic Area, 2000 to 2010 ........................... 64 Figure V.22 Net Number of New Jobs by Education Level and Geographic Area, 2000 to 2010
....................................................................................................................................................... 64 Figure V.23 Sector of Employment in 2010, Migrants by Ethnicity and Destination (percent) .. 65 Figure V.24 Contributory and Non-contributory Pension Coverage, 2007 and 2012 .................. 67
Figure V.25 Distribution of Benefits (Leakage), 2012 ................................................................. 67 Figure VI.1 Access to Basic Services by Ethnicity ...................................................................... 68 Figure VII.1 Alternative Routes to the Canal ............................................................................... 80 Figure VII.2 Homicide Rates (per 100,000) ................................................................................. 81
Figure VII.3 Critical Problems Facing the Country (In Order of Importance) ............................. 82

viii
Figure VIII.1 Regional Mean Seasonal Variation in Precipitation, Evaporation, and Total Runoff
under Current (dashed) and Future (solid) Climates and the Change between Current and Future
Climates (bottom panels) .............................................................................................................. 87
LIST OF TABLES
Table III.1 Panama Canal Traffic by Type of Cargo .................................................................... 22 Table IV.1: Top Obstacles to Growth (As Reported by Firms) .................................................... 39 Table IV.2: Synthesis on Process to Benchmark Priority Areas for Growth ................................ 40 Table V. 1Health Indicators .......................................................................................................... 54
LIST OF BOXES
Box II. 1 Indigenous Peoples Demographics and Data ................................................................ 10 Box III.1 Regional Integration in Central America ...................................................................... 24 Box IV.1 Institutional Challenges of the Energy Sector ............................................................... 47 Box V.1 How Institutional Challenges Affect Service Delivery in the WSS Sector ................... 60
Box VI.1 How Institutional Challenges Affect Service Delivery in the WSS Sector .................. 60 Box VI.2 Main Areas of Action for the Plan DIPORP ................................................................. 74
Box VIII.2 La Purisima................................................................................................................. 86

1
I. Executive Summary
1. Panama has made significant progress in reducing poverty in recent years. Between
2007 and 2012, a period including the Great Recession years, Panama managed to reduce poverty
(using the national poverty line) from 39.9 percent to 26.2 percent, and extreme poverty from 15.6
percent to 11.3 percent. Thus, of a population of about 3.6 million people, the number of
Panamanians living below the national extreme poverty line declined by slightly more than
150,000 people and those living below the overall poverty line declined by close to half a million
people.
2. Panama’s progress in reducing poverty and increasing shared prosperity compares
positively with the Latin American region. Poverty reduction in the country was greater than
the Latin American and Caribbean average. Only Bolivia saw greater improvement in shared
prosperity, as measured by the growth of the income of the bottom forty percent of the population,
than Panama. The rise in the middle class, seen in many countries in the region, was particularly
marked in Panama and there has been an overall decline in inequality.
3. This report takes stock of this progress, and reflects on the constraints and
opportunities that Panama faces in continuing on its path of shared prosperity and poverty
reduction. Following a detailed analysis of poverty – recent trends, drivers of poverty reduction,
and demographic factors – the report provides elements to answer three main questions. First,
what has driven growth in Panama in recent years? Second, to what extent has this growth been,
or not been, inclusive? And, finally, how sustainable is the growth and more generally, the
development model of Panama?
4. In doing so, the report identifies a select list of policy priorities for poverty reduction
and shared prosperity in Panama. The analysis of the development challenges in any country,
including Panama, will likely find that there is space for improvement on most areas underlying
development. And yet, a long list of recommendations is likely to be of limited use. Policy makers
face budgetary and political economy constraints that limit their scope for action. Thus, an effort
that prioritizes among competing policy interventions will add significant value to any diagnostic
of country development challenges. Exploiting a diverse set of analytic tools, a benchmarking
exercise and country knowledge, this report also contributes to Panama’s policy debate by
identifying a select list of priorities and opportunities.
THE NATURE OF GROWTH IN PANAMA
5. Over the past decade, Panama has been one of the fastest growing economies
worldwide. Average annual growth was 7.2 percent between 2001 and 2013 and Panama was an
outlier in terms of post-crisis recovery, having had higher growth after the crisis than before. Even
though the growth rate is expected to moderate to between 6 and 7 percent in 2014, this is one of
the highest rates for that year. In addition, not only has growth been high, but it has been
accompanied by progressive distributional change.
6. Panama’s exceptional growth performance over the past decade stems from a number
of factors. The transfer of the Canal to Panama in 2000 allowed it not only to benefit from the

2
growth of world trade, but also to leverage its geographical position to transform itself into a well-
connected logistics and trade hub and a financial center. Complementing this strength, Panama has
undertaken important public investment projects, such as the expansion of the Canal or the
construction of the Metro in Panama City. In the process, it has managed to attract increasing
foreign direct investment (FDI) flows and private investment. As a result of these factors, and the
underlying stable macroeconomic environment, Panama’s real growth since 2001 has been more
than double the average for Latin America and the Caribbean (LAC). The country has been one of
the few that have been able to catch up with the U.S. in terms of per capita Gross Domestic Product
(GDP) in recent years and its growth rate displayed low volatility in international comparison. As
a result, it has consolidated its position as the most competitive economy in Central America and
second only to Chile in LAC.
7. There are good reasons to expect that growth will continue to be strong in Panama
(around 6 percent) in the near future. The completion of major infrastructure projects (Canal
expansion and the first Metro line) will lower public investment in the coming years; yet, this will
be offset by the planned construction of the second Metro line, and the additional traffic generated
by the expanded Canal. In addition, there is no indication of a downturn in private investment
according to residential and non-residential construction leading indicators (such as construction
permits). The continued stable macroeconomic environment and recent moves by the Government
to ensure that the banking sector meets international standards will also continue to make Panama
an attractive country for FDI. The prospects of sustained high growth in the coming years are also
supported by emerging opportunities in key sectors such as transport and logistics, mining,
financial services, and tourism.
8. Nonetheless, certain structural areas require attention to ensure that Panama meets
these high growth expectations: infrastructure, particularly energy, education and skills, and
public sector institutions. For example, the energy sector has not been able to keep pace with the
growing demand of a high performing economy, and this issue will likely become even more
binding as the economy continues to grow at healthy levels. Likewise, while the country has made
large gains in education in recent years, the transformation and modernization of the economy has
exposed weaknesses in both the coverage and quality of secondary and tertiary education. Finally,
there is an obvious mismatch between the increasing sophistication of Panama’s economy and the
effectiveness of its public institutions. Challenges are most marked in transparency, efficiency and
the adequacy of the regulatory framework.
INCLUSION AND ECONOMIC GROWTH
9. Panama’s growth has been inclusive along many dimensions. Over the past years,
growth has been accompanied by declines in income inequality, and vulnerable groups in society
(poor, women, unskilled) have significantly benefited from growth. For example, the average
income growth of the bottom 40 percent (8.2 percent per year between 2007 and 2012) was
significantly higher than income growth for the average Panamanian (6.6 percent per year).
Similarly, the percentage of female-headed households that escaped poverty between 2007 and
2012 (14 percent) was higher than the percentage of male households escaping poverty (12.3
percent) and today, the difference in the poverty rates between female and male headed households
is less than 1 percent (2.6 percent in 2007). The economy has also managed to generate a large

3
number of jobs for the unskilled: an increase of almost 12 percent. The positive effects of
economic growth on poverty came through a combination of increased labor income and a strong
program of public transfers. Labor income was the key driver of both poverty and extreme poverty
reduction in urban areas, but government transfers were the main force behind poverty and extreme
poverty reduction in rural areas.
10. Yet, the degree of inclusion has varied across the country and across population
groups. Despite the strong pro-poor growth, sharp regional disparities remain. Take the case of
Ngäbe Buglé comarca, Panama’s poorest area, where 93 percent of the population is poor,
compared to 26 percent for the country as a whole, and only 15 percent in the richest province.
The rate of change of poverty also varied. While urban extreme poverty fell 40 percent between
2007 and 2012, in rural areas the decline was 15 percent, and in the indigenous territories,
comarcas, only 4 percent. This has resulted in an increasing concentration of the extremely poor
in the indigenous territories. Finally, among the poor and extremely poor in Panama, the groups
with the least human capital, lowest incomes and greatest dependence on social assistance are the
indigenous population living in the comarcas.
11. Benchmarking across indigenous groups in the region shows Panama to be lagging in
economic and social development. In absolute and relative terms, Panama’s indigenous
populations fare poorly compared to other Indigenous Peoples in Latin America. The differences
in terms of access to services are striking. Among 12 Latin American countries, Panama has both
the lowest level of electricity coverage among the indigenous population and the largest gap
between indigenous and non-indigenous populations (52 percentage points compared to the next
largest gap of 38 percentage points in Colombia). The gap in sanitation is also the largest and only
Nicaragua has lower absolute levels. The situation is similar for piped water and internet access.
12. While reducing poverty in Panama will require attention to all deprived groups, the
concentration of the poor in comarcas suggests that this would be a priority area. The
Indigenous Peoples of Panama have significant social capital, and their lands represent significant
wealth and bio-diversity. At the same time they suffer from multiple deprivations: extremely low
incomes, low access to basic services and infrastructure, lower human capital, poorer health
outcomes, fewer labor options and de facto land tenure insecurity. Investments in basic
infrastructure in roads, electrification and sewage systems would benefit both rural indigenous and
non-indigenous groups. However, improving social service for the indigenous will require special
attention to accommodate their cultural norms. In short, while Panama’s agenda on eradicating
extreme poverty is much broader than just the comarcas, the levels and severity of poverty in these
areas and the slowness of positive change suggest that focusing on the comarcas is a priority.
13. At the same time, it is important to understand the complexities of addressing the
development challenges of the comarcas and the need to pay attention to issues of (i)
culturally appropriate economic opportunities, (ii) social assistance, and (iii) infrastructure
provision. The lack of culturally appropriate models for development for the comarcas has
reduced the positive impact of government programs and policies. Differences in community
organization and communal property, among others, need to be taken into account. Furthermore,
a good understanding of the tradeoffs that Indigenous Peoples are, and are not, willing to make
among different goals will be key to finding sustainable solutions. In this regard, the National

4
Integrated Development Plan of the Indigenous Peoples of Panama, completed by the National
Indigenous working group after a two-year effort, provides an opportunity to tackle poverty in the
comarcas. The Plan presents the consensual vision of the goals and priorities of the 12 indigenous
congresses on economic development, social development, and legal rights.
14. The challenges faced by the social protection system in the comarcas also merit
further attention given that outcomes are muted despite good spending levels. Indeed, the
benefits of Red de Oportunidades, the conditional cash transfer program for the most vulnerable,
in the comarcas, appear to have been limited by a lack of differential ethnic services for the various
ethnic groups. In this regard, the adaptation of service provision to the environment is critical,
including, for example, offering multicultural bilingual education in indigenous areas, or ensuring
that health workers are equipped to work in different cultural contexts.
15. Lack of services, particularly access to water and sanitation, continues to be a
constraint in the comarcas. Low population density and dispersed populations are often blamed
for lack of service provision in these areas. This is a challenge that needs to be acknowledged but
the fact that Los Santos, one of the three provinces with the highest rate of poverty reduction in
the past six years, has a population density below that of the poorest comarca, suggests that
additional barriers to service provision are at play.
SUSTAINABILITY: ECONOMIC, SOCIAL AND ENVIRONMENTAL
16. Can Panama sustain this progress and improve on it? Whether Panama can sustain the
progress observed in previous years depends on the extent to which attention is paid to critical
economic, social and environmental issues.
17. Panama’s continued high reliance on foreign financing for its investment program
will depend on continued progress on compliance with international finance standards. The
Panamanian Government is working on reforms to address these concerns but is still under a peer
review process. This phase of this review involves an assessment of legal and regulatory
frameworks; the second phase consists of an assessment of how well the country is doing on tax
transparency in line with international standards. Based on the outcome of the first phase, Panama
is currently undertaking reform measures to allow it to move on to phase two of the process.
18. Sustainability will also depend on Panama successfully assessing and mitigating the
various sources of competition to the Panama Canal, given its crucial role for the country’s
economy. To the east, the recent project by Egypt to widen the Suez Canal in parts of its length
will enlarge transit capacity and decrease waiting time from 18 to 11 hours for most ships. Closer
to home, Panama’s northern neighbor Nicaragua has recently announced the initiation of a project
to build a Nicaragua Canal passing through Lake Managua. Once completed, this canal could have
significant impact on the share of trade going to Panama. Finally, in the medium to long term, the
Northern Passage may open up as global warming melts the Arctic ice cap, substantially reducing
the distance between Asia, Europe and North America. Competition to the Canal requires constant
adjustment of its pricing policy to maintain market edge and competitiveness within the global
market.

5
19. On the social front, the country’s cohesion is threatened by existing inequalities, the
crime and violence linked to Panama’s strategic position as a drug corridor, and weak
protection of land rights. The stark economic inequalities and relative deprivations, coupled with
more precarious forms of urban employment and perceptions, along with evidence of corruption
have been creating strains on society. Relative deprivation has led some groups to further organize
and assert political voice (such as through the Mesa Indigena) but also to increases in violence in
urban areas when combined with the illegal drug trade. However, the risks from crime and violence
affect not only urban youth but also rural and indigenous populations. Struggles around
infringements of indigenous land rights also pose serious threats to social sustainability. This is
particularly the case when one considers mining, which has the potential to be a key source of
growth in the coming years, but that will need to overcome potential opposition from the
indigenous populations living in the areas where the mining deposits are.
20. While the risks to social cohesion exist, various factors may play a mitigating role.
The recent success the Government has had in reining in homicide rates suggests that Panama may
be able to avoid the escalation of crime and violence seen in neighboring countries. The youth
gang movement is nascent and appears amenable to intervention. Ratification of the International
Labor Organization Convention 169 could help promote land and other rights as ratification would
trigger international supervision of the implementation of the Convention, thus providing more
visibility to land rights issues. The planned creation of a Ministry of Indigenous Affairs to help
promote economic and social welfare of the Indigenous Peoples in the country and support the
National Integrated Development Plan of the Indigenous Peoples of Panama provides further
opportunities for improvements in the protection of land and resources rights of the Indigenous
Peoples in Panama.
21. Environmental sustainability depends on safeguarding Panama’s water and natural
resources and on putting in place adequate regulation to mitigate the effects of large
infrastructure and extractive projects, rapid urbanization and risk from to natural disasters.
Safeguarding Panama’s water and natural resource base is critical to the current growth model
linked to the Canal and other economic activities. In terms of long term climate change, the recent
International Panel on Climate Change (IPCC) Fifth Assessment (2014) cites a trend of increasing
precipitation over most of Panama. This is generally good news for the Canal. However, greater
variability, with more frequent floods and droughts, is also predicted and poses a real risk. The
country’s infrastructure-based growth model requires strong environmental regulation and
enforcement to avoid long term irreversible negative impacts. In particular, the growth of the
mining sector raises significant potential environmental risks due to the lack of an adequate
regulatory framework that regulates safe and sustainable mining permits. The challenge of
improving the urban environment is amplified by the ongoing process of decentralization that has
not been coupled with adequate municipal capacity building. Finally, the increasing risks of natural
disasters require an integrated mitigation strategy.
22. Water resources management under varying climate conditions emerges as a priority
area linked to sustainability. Benchmarking across time highlights the greater incidence of
extreme weather events in the last decades. Climate models predict this to be the new norm. The
effects of the economy are multiple, including, most critically, the effect on the Canal operations
as greater variability in rainfall and extreme weather can lead to temporary closures (this has

6
happened four times to date). Changes in rainfall in other areas of the country can affect hydro-
electrical power generation, a key energy source for the country. And, of course, extreme weather
can affect agriculture, the main source of income for many of the poor in the country.
PRIORITY AREAS AND COMPLEMENTARITIES
23. Valuable synergies emerge from looking at priorities and opportunities across the
themes of growth, inclusion and sustainability. The analysis has been framed to answer three
key questions: what is the nature of growth, how inclusive is it and how sustainable. The analysis
identified five priority areas: Infrastructure with a focus on energy, education and skills, public
sector institutions, Indigenous Peoples and water resources management. But beyond the relevance
of each of these areas for growth, inclusion and sustainability it is important to also highlight the
complementarities that exist across them. Some simple examples illustrate this point. Education
and skills have been identified as a priority for economic growth: a well-educated workforce with
relevant skills is fundamental to sustain economic growth. In parallel, closing the education gap
between the poor and non-poor is also highly relevant for inclusion by providing opportunities to
rural and indigenous Panamanians. Institutional capacity clearly affects growth, inclusion and
sustainability.
24. In terms of opportunities within these areas, those identified to improve public
institutions provide a clear example of the synergies. Performance-based budgeting or enhanced
fiscal management along with other opportunities will free resources that could be spent on other
areas, including education or Indigenous Peoples. Moreover, enforcing consistent social and
environmental safeguards regulations and standards across sectors will have an important positive
impact on water resources management.
KNOWLEDGE GAPS
25. In the process of reviewing, analyzing and synthesizing the existing data and research
on Panama, a series of knowledge gaps were discovered. By discovering and describing these
gaps, this report outlines a roadmap for further research on Panama that will benefit the design of
specific policies in the priority areas identified in this report and generate information that can lead
to the identification of new priority areas. Knowledge gaps are in some cases, data related (poverty
by all ethnic groups, for example). In other cases there is a need for more analytical work
(qualitative and quantitative work on the causes of drop-out rates in Panama, or the creation of
simulation tools on growth or climate, for example). Focus on filling these knowledge gaps will
ensure the best possible analytic base for future work on prioritization in the country.

7
Diagnostic Area Priority
Area
Opportunities Complementarities
GR
OW
TH
Energy Managing (reducing) national energy demand - Contributing to a more
efficient public sector
- Reducing demands on
water resources
- Freeing up resources for
priority social programs,
such as education and
indigenous
Increasing power generation via renewables/clean
energy
Increasing domestic and cross border transmission
Modernizing the institutional framework in energy
Improving rural energy services
Education Strengthen targeted public/private technical
education to meet labor market demands
- Reducing drop-out rates
and proving opportunities
for indigenous, inter alia
- Contributing to growth,
potentially increasing
demand for energy and
water
- Contributing to a more
efficient public sector
Strengthen M&E of education to improve quality
Differentiate social assistance benefits to lower the
drop out from secondary education
Public
Sector
Institutions
Meet Global Forum standards on tax/ financial
information sharing (OECD grey list)
- Freeing up resources for
priority social programs,
such as education and
indigenous
- Creating conditions for
sound indigenous people
development framework
and engagement
- Supporting sustainable
energy and water
management
Improve public procurement practices
Introduce performance informed budgeting (PIB)
along with better coordination
Develop effective subnational institutions needed for
decentralization
Improve fiscal management, incl. modernizing
financial planning, debt management and fiscal risk
from disasters
Modernize mining regulatory framework to promote
oversight, benefit sharing and environmental/ social
sustainability
Strengthening financial sector regulation
Enforce consistent social and environmental
safeguards regulation and standards
INC
LU
SIO
N Indigenous
Peoples
Increase the quality, access and cultural pertinence
of health and education services in indigenous
communities
- Reducing drop-out rates
- Ensuring sustainable
water and energy use
- Strengthening institutional
framework for inclusion
Support ‘economic development with identity’, ex.
traditional agriculture; payments for environmental
services; benefit sharing; sustainable tourism.
Strengthen and formalize Indigenous Peoples’
participation in relevant Government decisions and
processes
SU
ST
AIN
-
AB
ILIT
Y
Water Implement integrated water resources management
plans in selected priority basins outside Canal
watershed - Creating economic
opportunities for rural
and indigenous
- Contributing to a more
efficient public sector
- Ensuring supply for
hydropower generation
Scaling up integrated disaster risk planning coupled
with climate adaptation measures
Reduce pollution by improving sewerage treatment
capacity and access to sanitation
Streamline regulatory and institutional functions
across Water sector agencies

8
II. Poverty and Shared Prosperity in Panama
26. Panama has made significant progress on the poverty reduction front over the past
years.1 Between 2007 and 2012, a period including the years of the Great Recession, Panama
managed to reduce poverty (using the national poverty line) from 39.9 percent to 26.2 percent, and
extreme poverty from 15.6 percent to 11.3 percent (Figure II.1: ). Thus, of a population of about
3.6 million people, the number of Panamanians living below the national extreme poverty line
declined by slightly more than 150,000 people and those living below the moderate poverty line
declined by close to half a million people.
27. Panama’s progress in reducing poverty compares positively with the Latin American
region. Indeed, using a US$4 a day poverty line, moderate poverty declined from 33.5 percent of
the population in 2007 to 20.9 percent in 2012. This compares with a poverty decline in the Latin
American region from 32.2 percent to 25 percent over the same period. Likewise, extreme poverty
(using a US$2.5 poverty line) declined from 19.2 percent to 11.8 percent, compared to a decline
in the region from 17 percent to 12 percent (Figure II.2). Extreme poverty, as measured by the
international US$1.25 poverty line (used by the World Bank to measure progress towards the twin
goals) would be 4 percent, which is close to the World Bank’s global extreme poverty target of 3
percent for 2030.
28. The observed declines in poverty rates have been accompanied by a significant
increase in the middle class. When measured as the share of the population with incomes between
US$10 and US$50 a day (as done in the LAC Regional Flagship, Economic Mobility and the Rise
1 Unless otherwise stated, the analysis uses national definitions of poverty and shared prosperity (both poverty lines
and the income aggregate). The analysis focuses on the 2007-2012 period for reasons of data comparability that limit
the use of longer time trends. While every effort has been made to replicate the welfare measure used in Panama,
there are some slight discrepancies (see Cadena et al, 2013) that are not expected to change the story in any way. The
value of the national poverty line was US$7.9/day urban and US$5.8/day.
Figure II.1: Panama’s Poverty Rates 2007 to 2012
(Percent, national poverty line)
Figure II.2: Poverty in LAC and Panama 2007 to 2012
(Percent, international poverty line)
Source: Instituto Nacional de Estadística y Censo (INEC) Source: World Bank
0
5
10
15
20
25
30
35
40
45
2007 2008 2009 2010 2011 2012
Poverty Extreme Poverty
10
15
20
25
30
35
2007 2008 2009 2010 2011 2012
Panama $4 LAC $4 Panama $2.5 LAC $2.5

9
of the Middle Class), the Panamanian middle class increased by about 10 percentage points from
29.7 percent in 2007 to 39.7 in 2012. This is consistent with – though more marked than – the
evolution of the middle class in the Latin American region, which also increased from 27.4 percent
to 34.2 percent (Figure II.3).
29. As a result, the middle class has been the largest group in Panama since 2011. The
typical transition from poverty to middle class is through the vulnerable class (i.e., a group of the
population that while not poor, has a significant chance of falling into poverty in the coming years).
In Panama, in 2007, the middle class was as large as the population living in poverty, but began
increasing between 2007 and 2010 as poverty declined. Starting in 2011, the vulnerable class was
smaller than the middle class.2 This is unlike in Latin America as a whole where despite the
evolution of the middle class, the vulnerable group continues to be the largest.
30. Yet as in most Latin American countries, there are important differences between
poverty levels in rural and in urban areas. Despite the fact that 75 percent of Panamanians live
in urban areas, and two thirds of those in Panama City, the urban-rural discrepancies are still
important. For example, while in urban areas extreme poverty is below 4 percent, in rural areas
extreme poverty is about 27 percent. Moreover, in contrast to urban areas where poverty has fallen
every year since 2007, extreme poverty levels have fluctuated in rural areas and indeed increased
in 2010 and 2012 (Figure II.4). But perhaps more worrisome, as discussed in Chapter V of this
document, poverty rates vary dramatically across the country. In the Indigenous Peoples’
territories (Figures V.7 and V.8), poverty is almost universal and persistent (declining at a rate
below the national average). For example, the Ngäbe Buglé comarca has a poverty rate of 93
percent and an extreme poverty rate of 80 percent. These poverty rates surpass poverty among
indigenous peoples in other countries including Bolivia, Guatemala, Peru and Ecuador.3
2 Ferreira et al. (2013) 3 Using an international poverty line of US$4 per person per day. SEDLAC (CEDLAS and World Bank) del Informe
Los Pueblos Indígenas en América Latina, 2014.
Figure II.3: Middle Class in Panama and LAC 2007 to
2012 (Percent, international poverty line)
Figure II.4: Urban and Rural Extreme Poverty in
Panama 2007 to 2012 (Percent, national poverty line)
Source: World Bank. Source: World Bank.
25
27
29
31
33
35
37
39
41
2007 2008 2009 2010 2011 2012
Panama LAC
0
5
10
15
20
25
30
35
2007 2008 2009 2010 2011 2012
National Rural Urban

10
Box II. 1: Indigenous Peoples Demographics and Data
Panama has a population of around four million people living in 10 provinces, 75 districts or municipalities, 5
collective and semi-autonomous Indigenous territories organized by ethnic groups, i.e., comarcas and 620
corregimientos. The tenth province was created when the original Province of Panama was divided into two—Panama
and Panama Oueste—in January of 2014. Due to the recent split, the analysis here looks at the original Province of
Panama.
Population by Province and Comarca
Source: INEC, 2010.
Panama is home to eight Indigenous ethnic groups or “peoples”, namely the Ngäbe or Ngöbe (260,058), Kuna or Guna
(80,526), Emberá (31,284), Buglé (24,912), Wounaan (7,279), Teribe/Naso (4,046), Bokota, (1,959), and Bribri
(1,068). The 2010 census shows that 196,059 indigenous persons live in comarcas, while 221,500 live in other areas.
The comarcas and other Indigenous territories enjoy significant autonomy and self-government through ten
Congresses and two Councils. The comarcas make up 22.2 percent of the country’s area, or 16,634 square kilometers
and comprise some of Panama’s richest natural resources and cultural diversity. Panama is also home to a population
of Afro-descendants representing 9.2 percent of the national population in 2010. The majority live in Colon (29
percent), Darien (17 percent) and Panama City (11 percent).
Data on the full population of the Indigenous Peoples and Afro-descendants is limited. The annual household survey
used to measure welfare does not include an ethnicity variable. In most of the analysis here, the geographic variable
comarca is used as a proxy for persons of indigenous origin. This has three problems: (i) this captures only the three
largest comarcas; (ii) there are small numbers of non-indigenous people who live in the comarcas; and (iii) using the
comarca variable excludes the half of the indigenous population that lives in other parts of the country from the
analysis. There is also no way to identify Afro-descendants from the household survey as they are included in the
urban or rural areas in which they live. The only data source that allows a comparison to be made of these two groups
is the National Population and Housing Census carried out every ten years: these data are used as much as possible.
Thus, the discussion of welfare of these groups is constrained. These knowledge gaps merit further attention in
Panama.
31. Beyond the progress made on poverty reduction, Panama has also made significant
progress on shared prosperity. Average per capita income, as measured by household surveys,
grew by 6.6 percent between 2007 and 2012 whereas the average incomes of the bottom 40 percent

11
of the population rose 8.2 percent (Figure II.5: ).4 These statistics indicate that not only has growth
been pro-poor - having a clear bias towards the poor - but also that the increase in their incomes
has been significant: at this rate, the incomes of the poor would double every nine years. It is also
worth noting that in Latin America, only Bolivia saw greater income growth among the bottom 40
percent of the population.
Figure II.5: Shared Prosperity in LAC, 2007-2012 (Annualized Growth Rate of Income for the
Poorest 40% and the Overall Population)
Source: Latin America and the Caribbean Equity Lab tabulations of the Socio-Economic Data Base data base for
Latin America and the Caribbean (SEDLAC) produced by the Center for Distributive and Social Studies (CEDLAS
and the World Bank; and World Development Indicators (WDI).
32. However, not everyone in the bottom 40 percent has shared equally in Panama’s
prosperity, similar to the poverty reduction story. The bottom 40 percent of the population has
seen its income rise in all provinces (that existed before January 2014) and the three comarcas
(Figure II.6: ). Those among the bottom 40 percent of the national population who lived in Coclé,
Veraguas and Los Santos saw the highest average income growth - which in the case of Coclé,
was close to 10 percent. However, in the comarcas captured by the data, growth was much lower
at only 2.4 percent. And only in the comarcas was the overall average income growth (5 percent)
greater than that of the bottom 40 percent. Compared with national data, the per capita income
growth in the comarcas was 1.6 percentage points lower than the national growth rate and the
income of the bottom 40 percent was 3.7 times lower than the income of the bottom 40 percent at
the national level. Indeed, as discussed later, even though the number of extremely poor has
declined significantly in the country, the comarcas historically have been, and are now even more
so, the places where extreme poverty is most prevalent in Panama.
4 The process of data harmonization for cross-country comparisons means that the comparable results differ from
those for Panama alone as the construction of measures for one country are quite different from what has to be done
in a multi-country context.

12
Figure II.6: Shared Prosperity across the Country (Mean Income Growth,
Percent)
Source: Authors’ calculations based on Panama household survey (Encuesta de Mercado
Laboral, EML), rounds 2007 and 2011.
33. The extremely poor are highly concentrated in remote geographic areas where
Indigenous Peoples live. The indigenous populations living in the three largest comarcas
represent 42 percent of the extremely poor, but at the same time, represent less than seven percent
of the country’s population (although Indigenous Peoples represent 12.2 percent of the total
population). Many of the Indigenous Peoples in Panama live outside but in close proximity to the
comarcas with collective title, as is the case of the Naso territory, two Wounaan communities in
Darien, and the Dagargunyala collective territory. Many others are awaiting territorial recognition
and titling, as is the case of the Bri-Bri and many communities in Darien. The communities without
land tenure security are at the greatest risk due to land invasions by non-indigenous farmers, the
Revolutionary Armed Forces of Colombia (in the case of Darien), and by parties interested in
resource extraction.
34. At the same time, lack of opportunities within these areas has forced many indigenous
people to migrate to cities. According to the 2010 census, only 40 percent of the Guna population
now lives in the three Guna comarcas, 52.3 percent of Ngäbe and Buglé people live within their
comarca, and in the case of the Emberá and Wounaan, only 24 percent of the population is living
within the comarca5. Internal migration among the indigenous population in Panama is higher than
in most other Latin American countries.6
35. Nonetheless, inequality has not been an issue exclusive to the Indigenous Peoples.
There is a universal perception in Panama that Afro-descendants have also been excluded from the
country’s economic growth and face difficult challenges, including lack of access to basic services,
such as water, electricity, sanitation, education, employment, health services and political
participation. While the limited data available do not completely support this perception,
5 International Working Group, 2011. 6 Economic Commission for Latin America and the Caribbean (ECLAC), 2014.

13
qualitative studies indicate that Afro-descendants rank among the poorest and most vulnerable
groups in the country.7
36. This raises a question about the factors driving poverty reduction in Panama. Over
the past decade, Panama has been one of the fastest growing economies worldwide. With an
average annual growth rate of 7.2 percent between 2001 and 2013, Panama has outpaced most of
its peer countries and grown significantly faster than the average country in any of the analyzed
peer groups.8 The country has been one of the few that have been able to catch up with the U.S. in
terms of per capita GDP in recent years (Figure II.7: and Panama has been an outlier in terms of
post-crisis recovery (Figure II.8: ); while most countries were not able to catch up to their pre-
crisis dynamism, Panama had higher growth after the crisis than before. Even though the growth
rate is expected to moderate to around 7 percent in 2014, this is one of the highest rates for that
year. In addition, not only has growth been high, but it has also been accompanied by progressive
distributional change.
37. Growth accounted for about 80 percent of poverty reduction and the reduction in
inequality accounted for the remaining 20 percent between 2007 and 2012. The recent high
GDP growth rates experienced by Panama would suggest that growth has played a predominant
role in explaining poverty reduction. We test this hypothesis by performing a Datt-Ravallion
decomposition9, which attempts to identify the relative contributions of growth and changes in
inequality for any given poverty change. The results of this decomposition are displayed in Figure
II.10: confirming the hypothesis that growth accounted for about 80 percent of the poverty gains
7 Generating quantitative data on Afro-descendants will be necessary to create an accurate picture of absolute and
relative poverty levels of this ethnic group. 8 Annex 2 contains the types of peer countries (regional, aspirational, structural) and the countries included in each
peer group. 9 See Datt and Ravallion, 1992.
Figure II.7: Panama’s GDP Per Capita as a Share of US
versus Latin America (Percent, constant 2005 US$)
Figure II.8: Real GDP Growth in Panama and its Peer
Countries 2001 to 2013 (Percent change)
Source: WDI Source: World Economic Outlook (WEO).
8
10
12
14
16
18
1960 1970 1980 1990 2000 2010
Latin America & Caribbean Panama
0.6
7.2
12.1
3.9
10.9
8.5
-6
-4
-2
0
2
4
6
8
10
12
14
2001 02 03 04 05 06 07 08 09 10 11 12 2013
Central America Aspirational peers Structural peers
LAC Middle income World
Panama

14
and inequality for about 20 percent. This is in contrast to the Latin American region, where growth
has been admittedly lower and the gains on the inequality front more, where over the same period
of time, growth would have accounted for 57 percent of poverty reduction and inequality for 43
percent.
38. The positive changes in poverty measured by cross-sectional household data hide
some of the movements of the population in and out of poverty. A synthetic panel, constructed
a la Dang et al (2011), shows that the 2007-2012 period saw people moving out of, but also into,
poverty. The synthetic panel results in terms of poverty numbers do not completely align with the
national figures, but the analysis does highlight several important movements of households
(Figure II.11: and Figure II.12: ).10 First, households with low educational levels (primary or
below) and those engaged in agriculture were the most likely to have been poor in 2007 and
remained poor in 2012. Second, households in the agricultural sector and in the bottom income
quintile were the least likely to move out of poverty and most likely to fall into poverty. Finally,
urban areas overall showed the greatest movements out of poverty.
10 The synthetic panel uses a different poverty line (US$4 per day) and, by construction, can only include a subset of
households, i.e., those that have the potential to be in both periods. Thus households with very young heads in 2012
will be excluded from this analysis. Both of these characteristics of the synthetic panel analysis mean that the
estimated levels of poverty will differ between this analysis and the national figures.
Figure II.9: Gini coefficient in Panama and LAC 2007
to 2012 (Index)
Figure II.10: Datt-Ravallion Decomposition of Poverty
(Percent)
Source: World Bank. Source: Authors’ calculations based on Panama household survey
(Encuesta de Mercado Laboral), rounds 2007 and 2011.
50.5
51
51.5
52
52.5
53
53.5
54
2007 2008 2009 2010 2011 2012
Panama LAC
0
10
20
30
40
50
60
70
80
90
Panama LAC
Growth Inequality

15
Figure II.11: Movements out of Poverty
(Percent)
Figure II.12: Changes in Poverty Status by Original
Characteristic (Percent)
Source: Authors’ calculations based on Panama
household survey (Encuesta de Mercado Laboral. EML),
rounds 2007 and 2011 and Hang (2011) methodology
Source: Authors’ calculations based on Panama household survey
(EML rounds 2007 and 2011 and Hang (2011) methodology.
39. But what are the sources of income that have helped people get out of poverty? To
understand the different factors that have contributed to poverty reduction, it is important to
explore developments in labor markets (which typically generate the main income of the poor) as
well as the role of public spending, including transfers (both cash and in kind) to the poor. The rest
of this section explores these issues.
40. Panama has been a top performer in terms of creating jobs, and the poor have
benefited from it. In 2013, the employed labor force in Panama was 66 percent higher than in
2001, an increase that far exceeds those of peer countries.11 For example, the corresponding
increase among the structural peer countries was 17 percent, while in Central America as a whole
it was 44 percent (Figure II.13). The bottom 40 percent have benefitted from this job creation.
While the bulk of net new jobs required completed secondary education or higher, 11.5 percent of
new jobs were for unskilled labor with primary or incomplete secondary. In 2012, the average
years of schooling of the bottom 40 percent of the population was 7.6 years compared to 11.7 for
the rest of the population (Figure II.14).
41. There is a large gap between the extremely poor and the rest of the population. The
heads of extremely poor households in Panama have only 5.1 years of education--4.5 fewer than
the national average. They are also concentrated in the agricultural sector and work mainly as self-
employed or unpaid family workers. The households of the extreme poor have much higher
dependency ratios, driven by a much greater share of young children, and lower life expectancy.
For every worker in an extremely poor household, there are 2.2 dependents, while the national
average is 1.3. The dependency ratio for working age people (15 to 64 years) is 1.25 for extremely
poor households, while the national average is 0.5.
11 Annex 2 provides detailed definitions of the different peer groups. Based on IMF WEO data on changes in the labor
force corrected for unemployment.
0%
20%
40%
60%
80%
100%
Total Urban RuralAlways poor Poor - Non poorNot poor-Poor Never poor
0%
20%
40%
60%
80%
100%
Edu
c: P
ri
Edu
c: S
ec
Edu
c: T
er
Agr
ic
Man
uf
Co
nst
ruct
Ret
ail
Serv
ices
Oth
er
Hea
d F
em
ale
Hea
d M
ale
Qu
inti
le 1
Qu
inti
le 2
Qu
inti
le 3
Qu
inti
le 4
Qu
inti
le 5
Always poor Poor - Non poor Not poor-Poor Never poor

16
Figure II.13: Employment Creation in Panama
between 2001 and 2013 Versus its Peers (Percent
change)
Figure II.14: Job Creation by Education Level
(Total number of jobs)
Source: Authors’ calculations based on the WEO Source: Authors’ calculations based on the Panama
Population and Housing Census, 2000 and 2010.
42. Social spending has increased in real terms also benefitting the poor. Between 2007
and 2012, education and health spending have stayed relatively flat at around 4 percent of GDP
(in a context of very rapid GDP growth), while social protection has decreased by half a percentage
point of GDP (Figure II.15).With 13.3 percent of GDP in 2013, Panamanian social expenditure
was in the middle range for Central America. In that year, Costa Rica dedicated almost 21 percent
of GDP to social expenditure, while Guatemala only spent eight percent. In real terms, social
spending has grown three percent annually over the analyzed period.12 While access to health and
education services has improved for all Panamanians, significant inequalities persist with less
access in rural and indigenous areas where a large part of the poor and extreme poor live. Chapter
V of this report provides more detail on the incidence of social spending.
43. The country has continuously expanded the coverage of its social protection system. In 2006, Red de Oportunidades, a conditional cash transfer program, was introduced to support
families in poverty; in 2009, 100 a los 70 followed to support elderly in need; in 2010, Beca
Universal was put in place to provide a cash transfer to children for school achievements; and in
2012, Angel Guardian was established to provide social assistance to people with severe
disabilities in poverty or vulnerable conditions. While the quality of targeting of these programs
differs and can be further improved, a large share of their benefits reaches the lowest income
percentiles. Chapter V provides further detail on social protection, its incidence, and targeting.
44. Progress towards the twin goals has been achieved not only because of the pace of
growth but also its low volatility. Panama has stood out not only in terms of its fast economic
growth but also in terms of the low volatility of that growth (Figure II.16). In the sample of peer
countries, only a few, such as Bolivia and Guatemala, had lower coefficients of variation of GDP
growth, however at significantly lower average GDP growth rates. As mentioned before, the low
volatility of economic growth is highly relevant for achieving the twin goals. This is due to the
12 This growth rate is based on 2007 constant US$ and taking into account purchasing power parity. When spending
in constant US$ is used, the increase appears larger.
66
17
44
38
2025
19
Panama Structuralpeers
CentralAmerica
LAC World Uppermiddleincome
Aspirationalpeers
0
200000
400000
600000
800000
1000000
1200000
2000 2010
Secondaryincomplete
Secondarycomplete
Primary completeor less
Any tertiary

17
impact of overall output volatility on consumption as well as the negative link between
macroeconomic volatility and equality. 13
45. This report (i) explores the elements behind the observed growth, poverty and
inequality trends; (ii) identifies the factors that may affect the sustainability of Panama’s
recent performance and thus the priority areas for action or policy; and (iii) highlights
specific opportunities for the country to continue as one of the best performers in the Latin
American region on growth and poverty reduction. The rest of the report is structured as
follows. Chapter III looks in more depth at the evolution and features of economic growth and
what may affect it going forward. Chapter IV compares Panama’s progress to other countries to
identify priority areas linked to maintaining growth and opportunities of which the country might
well take advantage. The chapter contains a brief discussion of the prioritization process. Chapter
V focuses on issues of inclusiveness, laying out the evidence of progress as well as the limits on
this progress. Chapter VI attempts to benchmark Panama’s progress on inclusion to that of other
Latin American countries, identifying ethnicity as a priority area and drawing out opportunities for
action. Chapter VII addresses the issue of sustainability from different lenses: economic, social
and environmental. Chapter VIII, using an over-time benchmarking approach, lays out the case for
water to be the final priority area and identifies opportunities for action. The final chapter covers
knowledge gaps that arose during the process of preparing this report, gaps that would ideally be
the focus of any subsequent analysis for Panama’s ability to ensure inclusive and sustainable
growth and make inroads on the twin goals.
13 See for example Breen and Garcia-Penalosa (2004), Garcia-Penalosa and Turnovsky (2004), Huang, Fang, and
Miller (2012), and Loayza, Ranciere, Serven, and Ventura (2007).
Figure II.15: Panama’s Social Spending by Sector
(Percent of GDP)
Figure II.16: Growth versus Volatility in Panama and
its Peer Countries 2001-2013 (Average percent change)
Source: World Bank Social Sector Expenditure and Institutional
Review
Source: WEO
5.5 5.4 5.8 6.0 5.3 5.0
1.0 1.2 1.0 1.3 1.5 0.9
3.9 4.0 3.9 4.0 3.73.7
4.0 4.0 4.2 4.23.9
3.7
14.4 14.7 14.9 15.514.4
13.3
0
5
10
15
20
25
2007 2008 2009 2010 2011 2012
Social Security Social Assistance and Labor Education Health
ARG
BEL
BOL
BRZ
CHL
COL
CRIDOR
ECU
SAL
GUA
HON
MEX
NIC
PANAMA
PAR
PER
URU
Structural peers
Aspirational peers
Central America
LAC
Middle income
World
0.0
0.2
0.4
0.6
0.8
1.0
1.2
1.4
1.6
0 2 4 6 8
Vo
lati
lty
of
Gro
wth
Growth

18
III. The Nature of Panama’s Economic Growth
46. Panama’s exceptional growth performance over the past decade stems from an open
and competitive economy. Panama’s real growth since 2001 has averaged 7.2 percent, more than
double the average for LAC. The country has been one of the few that have been able to catch up
with the U.S. in terms of per capita GDP in recent years (Figure II.7), and its growth rate displayed
low volatility in international comparison (Figure II.16). The economy is one of the most open in
the region (Figure III.1) and is well integrated into the global economy. It has done well in
leveraging its geographical position, including through the Panama Canal, transforming itself into
a well-connected logistics and trade hub and a financial center. Through continuous improvements
in infrastructure, Panama has established a port network that is on par with major international
logistics hubs and an airport network that allows the country to function as a major regional
passenger hub for connecting passengers between North, Central and South America. Thus, the
country has consolidated its position as the most competitive economy in Central America and
second after Chile in LAC, according to the 2014-15 Global Competitiveness Report.
Figure III.1: Panama’s Trade Openness compared to
its Peer Countries, as Measured by the Share of
Exports and Imports of Goods and Services in GDP
(Percent of GDP)
Figure III.2: Contribution of Aggregate Demand
Factors to Economic Growth from 1947 to 2013
(Percentage points)
Source: World Bank, WDI Source: INEC, World Bank Estimations
47. In recent years, five main elements have explained this growth performance: (i) the
transfer of the Canal to Panama which has allowed it to benefit from the growth of world trade;
(ii) the successful management and expansion of the Canal that spilled over to growth in specific
sectors; (iii) the increasing role of public investment; (iv) the parallel increase in FDI and private
investment; and (v) a stable macroeconomic environment. The rest of this section discusses these
elements.
THE CANAL AND TRENDS IN WORLD TRADE
48. The acceleration of growth followed the transfer of the Canal to Panama and
coincided with its successful management. The U.S. built the Panama Canal zone in the ten year
period from 1904 to 1914 after receiving a concession for the construction and operation of the
Canal and the areas surrounding it. In 1977, the two countries signed the Torrijos-Carter Treaties
147.2
98.1 97.880.2
93.4 91.5
200.9
Panama Structural CentralAmerica
LAC World Uppermiddleincome
Aspirational
-15
-10
-5
0
5
10
15
201
94
7-1
97
0
19
71
-19
80
19
81
-19
90
19
91
-20
00
20
01
20
02
20
03
20
04
20
05
20
06
20
07
20
08
20
09
20
10
20
11
20
12
Consumption Private Investment Public Investment Net exports GDP

19
that laid the foundation for the gradual return of the Canal to the Panamanian Government. On
December 31, 1999, the transfer became effective.14 Since then, the Canal has been managed by
an autonomous Government agency, the Panama Canal Authority, which is widely recognized for
its institutional capacity and efficient management. Even though there is no stringent proof of
causality, the increased trend of the growth of transport and communications sector in particular
seems to have followed the return of the Canal to Panama. After the transfer in 1999, trend growth,
both of the transport and communications sector, as well as of the economy as a whole, have
accelerated (Figure III.3).
Figure III.3: Transport and Communication Share of GDP and GDP Growth
(Percent, Growth Index 1950=100)
Source: INEC, World Bank Estimations
49. The Canal has allowed the country to benefit from the increased world trade due to
the fast growth of large emerging economies, such as China. The recent catching-up with U.S.
per capita income seems to have started in 2003 (Figure III.4). Even though Panama’s convergence
towards the U.S. was faster than that of LAC as a whole, the inflection points coincide. Therefore,
it seems that a set of common factors might have driven both Panama’s take off as well as the
resurgence of growth in the rest of Latin America, albeit by different magnitudes. A forthcoming
World Bank study suggests that these common factors are associated with the relatively fast
growth of large emerging markets, such as China.15 However, it is likely that the main channels of
transmission from the growth of China to Panama have been different from those affecting other
fast-growing Latin American countries, such as Bolivia, Chile, Colombia or Peru: for Panama, it
is the Canal, rather than commodities.
14 For a comprehensive description of the history and role of the Panama Canal for the Panamanian economy, see
Barletta (2012). 15 World Bank (2015):”The Rise of the South”, Flagship report of the Chief Economist Office of the LAC Region,
2015.
0
5
10
15
20
25
0
500
1000
1500
2000
2500
3000
1947 1957 1967 1977 1987 1997 2007
Transport and communication share (% of real GDP)
Panama growth index (1946=100)
Colon Free Zone
(1948)
RemonEinsenhower treaty (1955)
Torrijos Carter treaty
(1977)International
Banking Center(1970)
US Invasion (1989)
Canal trasnferred to
Panama (2000)

20
Figure III.4: Panama-U.S. Growth Differential (Percentage points,
Panama GDP pc Growth Minus U.S. pc growth p.p.) and Inflation
Differential
Source: World Bank (2015)
50. Transshipment of goods with origin and destination to China has surged and the
increases in revenues from the Canal between 2000 and 2013 are significant. During these
years, the value of world trade almost tripled from US$6,725 billion to US$18,890 billion. At the
same time, the value of trade that passed through the Canal increased by 16 percent, from US$374
billion to US$434 billion between 2006 and 2013. Overall the share of total world trade going
through the Canal slightly decreased from 3 percent in 2006 to 2.3 percent in 2013. The origins
and destinations of goods passing through the Canal reflect China’s increasing role in world trade.
In 2013, the share of goods originating in China was 7.6 percent, while the share of goods destined
for China was 14.5 percent. While the size of the largest ships that cruise the Canal has increased
and therefore, the same volume of merchandise could be transported through the Canal with less
shipments, overall passages through the Canal have declined from 12,198 vessels in 2001 to 12,045
in 2013.16 The increase in trading volumes and passages has led to an increase in collected tolls
from US$580 million to US$1.847 billion over the same period, and 1.7 and 2.4 percent of GDP
in non-tax revenue to the Government.
16 In 2000, the largest ship could carry around 3,500 containers, while in 2013 this had increased to 4,500 containers
(the maximum of capacity for Panamax ships) in terms of ships that actually pass through the Canal. The second line
of locks will allow ships with a capacity of 12,500 containers (the standard for Post Panamax ships) tons to also pass
through the Panama Canal.
-20
-15
-10
-5
0
5
10
15
19
80
19
82
19
84
19
86
19
88
19
90
19
92
19
94
19
96
19
98
20
00
20
02
20
04
20
06
20
08
20
10
20
12
in p
.p.
Inflation Differential GDP per capita Growth Differential
Pre-Transfer Canal to Panama Post-Transfer Canal to Panama

21
Figure III.5: Panama Canal Revenues, Commodity Index, and World
Trade 2000-2013 (Nominal Index, 2000=10)
Source: Panama Canal Authority and World Trade Organization
51. The resilience of Canal revenues is due to both the variety of goods going through the
Canal as well as a proactive fee policy by the Canal Authority. The three main types of cargo
going through the Canal are containers, grains and oil (Table III.1). Containers mainly carry
different types of manufactured goods and minerals. The Canal Authority constantly adjusts fees
in order to compete worldwide, and the fees are based on volume and weight of the cargo (not the
value). For this purpose, a special measurement has been created, the Panama Canal tons.17 As a
result, Canal revenues have continuously increased even in years when total cargo was declining,
as for example in 2009. Moreover, the variety of goods as well as the adjustments in fees has
decoupled Canal revenues from the price movements of any one good. Even fluctuations in overall
commodity prices that commoved with the value of world trade have had little impact on revenues
(Figure III.5).
THE IMPACT OF THE CANAL ON GROWTH IN SPECIFIC SECTORS
52. The Canal has affected the Panamanian economy both directly and indirectly. In
addition to the direct effects through transport and communication as well as the ongoing
construction to expand the Canal, Canal operations have positively affected the rest of the
economy. The Canal drives the bulk of Panamanian service exports18. In particular, it generates
revenues for the local economy and creates employment in the logistics sector. The recent
expansion of the Canal is the largest project at the Canal since its construction and the largest
infrastructure project in Panama. The expansion will double the Canal’s capacity, increasing
economies of scale and international maritime trade. The expansion program consists of four main
components: (ii) a third set of new locks, (ii) a Pacific access channel, (iii) dredging of navigation
channels, and (iv) improvements to water supply. The impact of the Canal expansion will benefit
the economy through the construction stage and through the increase in traffic, which in turn is
17 The Canal Authority uses the Sistema Universal de Arqueo de Buques del Canal de Panama (CP/SUAB), which is
based on a formula to estimate the “Panama Canal tons” (a Panama Canal ton equals 100 cubic feet of volume
capacity). 18 Pagano et al, 2012
50
100
150
200
250
300
350
2000 2001 2002 2003 2004 2005 2006 2007 2008 2009 2010 2011 2012 2013
Canal revenues World trade Commodity prices

22
expected to boost Canal-related activities. The Government is also expected to have a significant
inflow of additional revenues.19
Table III.1: Panama Canal Traffic by Type of Cargo
Source: Panama Canal Authority and World Trade Organization
53. Taking advantage of its geographic position and the Canal, Panama has transformed
itself into a regional logistics hub performing very well on indicators of connectivity and
logistics. The country has developed a sophisticated transport infrastructure around the Canal
(Figure III.6). In particular, Panama has first-world infrastructure assets, with the Panama Canal
as an axis for structuring the development of its logistics services. Currently, the majority of
logistics operators of the world have permanent operational presence in Panama. This has resulted
in the availability of a wide range of logistics services, mainly devoted to maritime cargo. It is one
of the most connected countries in the region and has the highest Liner Shipping Connectivity
Index (LSCI) in the LAC region (Panama has achieved a score of 45 ahead of Mexico with a score
of 42 and Brazil with 37, and even ahead of developed countries like Canada with a score of 38).20
Its geographic position and the Panama Canal give it an advantage when compared to other
countries in the region. However, connectivity falls short of what other major logistics hubs such
as Singapore and Hong Kong SAR, China achieve (scoring 107 and 117, respectively) on the
LSCI. In the same vein, Panama lags behind these economies in terms of the 2014 Logistic
Performance Index (Figure III.8). Hence, the potential to attract additional services by developing
value-adding service infrastructure remains high. In the same vein, regional integration offers still
untapped opportunities for further efficiency gains and growth (Box III.1).
19 Bussolo et al, 2011 20 The index is computed by the United Nations Conference on Trade and Development (UNCTAD) based on five
components of the maritime transport sector: number of ships, their container-carrying capacity, maximum vessel size,
number of services, and number of companies that deploy container ships in a country's ports.
Total Cargo Containers Grains Oil Others Vessels
(Panama Canal tons) (number of ships)
2001 193.2 30.7 28.1 17.6 23.7 12198
2002 234.9 28.1 22.5 12.5 36.8 11862
2003 242.7 32.4 20.6 10.6 36.4 11725
2004 266.9 32.4 20.0 12.5 35.1 12518
2005 279.1 35.0 19.7 12.4 32.9 12648
2006 296.3 38.2 19.9 11.1 30.8 12772
2007 312.8 41.1 16.0 12.7 30.3 13234
2008 309.6 40.2 16.4 13.9 29.6 13147
2009 299.1 39.6 19.9 16.1 24.4 12855
2010 300.8 34.8 24.1 15.5 25.6 12591
2011 322.1 35.3 24.8 15.2 24.7 12989
2012 333.7 35.9 25.0 15.5 23.6 12862
2013 320.6 36.7 16.5 22.7 24.1 12045
Year(% of total cargo)

23
Figure III.6: Transport Infrastructure in the Canal Zone
Source: Air Cargo Strategy
Figure III.7: Logistic Performance Index Figure III.8: Logistic Performance
Source: WDI. Source: WDI.
Colón
Panamá
Las Cruces
Pacora
Parque Nacional Chagres
Parque Nacional
Soberanía
Las Cumbres
Arraiján
La Chorrera
Nuevo Emperador
Bosque de
Protección San
Lorenzo
Carreteras principales Ferrocarril Canal de Panamá Puertos Aeropuertos Áreas logísticasPuertos petroleros
5
1
2
3
4
7
86
Main roadsMaritime
terminalsRailway Panama Canal Oil ports Airports Logistics areas
Main logistics areas
1.Colon Free Zone
2.Panama Pacific (ZP Howard)
3.MIT Logistics park
4.South Park Logistics park
5.East Coast Industrial and
Business Park
6.Tocumen Storage Complex
7.Panamá logistic park
8. Industrial Park of the Americas
0
0.5
1
1.5
2
2.5
3
3.5
4
4.5
Netherlands Singapore Hong Kong SAR,China
Chile Panama Costa Rica Colombia
0
0.5
1
1.5
2
2.5
3
3.5
4
4.5
Customs Infrastructure Internationalshipments
Logisticscompetence
Tracking & tracing Timeliness
Panama Hong Kong SAR, China Singapore

24
Box III.1: Regional Integration in Central America
The integration of markets and infrastructure networks has extraordinary power to stimulate growth through efficiency
gains, technology spillovers and investment. However, despite several notable bright spots in economic cooperation,
the promise of greater regional integration among the Central American countries has remained largely unfulfilled.
Central America’s efforts at forming greater regional economic ties have been ongoing for decades, most notably on
the trade side stretching from the establishment of a Central American Common Market in the 1970s to the Dominican
Republic-Central America Free Trade Agreement and the EU-Central America Free Trade Agreement. But there have
also been several significant integration successes outside of trade, including in the energy sector with the Sistema de
Interconexión Eléctrica de los Países de América Central (SIEPAC), a transmission line project which came into
being in June 2013 and connects the electricity grids of Panama, Costa Rica, Honduras, El Salvador, Guatemala, and
Nicaragua. That interconnection could enhance investment opportunities for large-scale renewable energy projects, as
well as improve the efficiency and the security of electricity supply in Central America. Financial interconnectedness
is also on the rise, with almost all the banks in the region expanding operations into neighboring countries, although
differences in legal and regulatory frameworks have limited greater connectedness.
But by and large, Central America has not realized the gains expected from integration efforts. Exporters have not
experienced appreciable growth in either export lines or markets since the signing of the regional free trade
agreements. Bilateral trade in Central America remains an agenda of largely untapped opportunities, as evidenced by
the negative elasticity of bilateral trade to different factors including adjacency and time adjusted distance21. This
untapped potential can be attributed to deficiencies in infrastructure, burdensome processes and congestion at the
border crossings limiting trade, even where distances are short. Poor road quality, particularly on secondary and
unpaved rural roads, has led to road transport prices averaging 17 cents per ton-kilometer in Central America, one of
the highest road transportation costs in the world22. Burdensome customs procedures, lack of regulatory harmonization
(for example in terms of phytosanitary standards for agricultural exports), few established trade linkages, an atomized
shipping industry, sparse information sharing on cargo and backhaul in trucking, and relatively few options and
competition for shipping also limit the gains from trade free trade agreements. Transport and logistics costs can surpass
50 percent of the final price of goods traded, and it has been estimated that intraregional exports in Central America
could have doubled if the region achieved the adjacency and time distance factors of a truly integrated region23.
54. In terms of other forms of transportation, railway and air transport are important
contributors to Panama’s logistics success while roads are the weakest link. The Canal-railway
corridor plays an important complementary function in the feeder service scheme of Panama’s
transshipment ports, linking the Atlantic and Pacific seaports on a 75 kilometer stretch along the
Canal. Most of the ships passing through the Canal have their dedicated feeder services for either
the American West or East coast and stop only once at either an Atlantic or Pacific transshipment
port. Air transport is one of Panama’s fastest growing sectors, contributing around US$1 billion to
the country’s GDP and creating over 10,000 direct and indirect jobs. This is the result of having
positioned Panama’s Tocumen International Airport as a major regional passenger hub for
connecting passengers between North, Central and South America. Air passenger volumes have
tripled from 2003-2013 with the national carrier COPA having the main market share as has
international passenger traffic, growing from 2.1 million to 7.7 million during the same period, of
which 50 percent are transit passengers. Contrary to its excellent position in ports and airports
infrastructure, Panama ranks 48th in quality of road infrastructure.24 Road density (190 miles of
roads per one square kilometer of territory) is, together with Nicaragua, the lowest in Central
America. Due to Panama’s geographic location and the concentration of logistics around the Canal
21 Gordillo, Stokenberga, and Schwartz, 2010. 22 Osborne, Pachon and Araya, 2014. 23 Marcelo et al, 2010. 24 World Economic Forum (WEF)Global Competitiveness Report, 2013-2014

25
zone, 71 percent of all main routes are short-haul. Truck utilization is quite low with a high
percentage (50 percent) of empty backhauls and one of the highest wait times in Central America
(0.05h/km). Security costs are above the Central American average amounting to almost US$600
per vehicle in 2011 (a 27 percent increase compared to 2008).
Figure III.9: Line Shipping Connectivity
Source: Air Cargo Strategy
55. In terms of sectoral composition, growth has mainly stemmed from the transport and
communications, financial services, commerce and construction sectors (Figure III.11). In the
past decade, services have accounted for more than 50 percent of GDP growth, boosted by
transport and communication (explaining on average 1.8 percentage points of growth between
2001 and 2013) and financial and business services (explaining 1.7 percent). Commerce, a
traditional growth contributor has recently contributed less as a consequence of external conditions
(1.4 percent on average between 2003 and 2011 versus 1.2 percent between 2012 and 13). In
addition, construction has become one of the key drivers of the economy due to larger investment
(both public and private) in residential and non-residential infrastructure (1.9 percent contribution
over the past five years). Another emerging growth driver has been hotels and restaurants (0.3
percent contribution over the past five years). In contrast, the contributions of agriculture and
manufacturing have declined (from 0.2 and 0.3 percent respectively in 2005 to 0.1 and 0.1 in 2013).

26
56. Panama has continued to develop its position as an international financial center. The
country has established itself as a major offshore banking center hosting 80 banks with total assets
of approximately US$112 billion, nearly three times the size of the country's GDP. Most of the
country’s financing needs are met by the banking sector and not by equity or bond markets.25 The
competitive and sophisticated banking sector of Panama has shown that it is agile and capable of
adapting to a rapidly changing environment. The financial sector has a long tradition in Panama,
preceding the Canal devolution. Its contribution to economic growth has been larger than those of
traditional sectors, such as agriculture and manufacturing. The banking sector of Panama is widely
regarded as healthy and sound. Most banks in Panama are well capitalized, profitable and liquid
with non-performing loans at very low levels. The sector has been driven by investment in logistics
and transport, construction and commerce, and by an increasing private consumption boosted by
solid domestic demand. As a result, mortgage lending represents the largest share of total private
credit in Panama at 30 percent followed by commerce (19 percent including Canal related export
activity and tourism) and consumer credit (16 percent). Mortgage lending has been growing
slightly faster than GDP over the last few years, but the lack of data on real estate prices, and as a
result, the absence of loan-to-value ratios, represents a significant information gap for effective
prudential management and supervision. Nonetheless, anecdotal evidence suggests that a doubling
of urban real estate prices over the past five years has been roughly in line with the rapid pace of
GDP growth.
57. While commerce has been one of the traditional growth drivers, its contribution has
shrunk recently, due to external factors affecting the trade of the Colon Free Zone.
Commerce has been driven by retail sales as a result of the increase in Panamanian incomes and
the expansion of malls and commercial stores, and by wholesale sales, mainly from the Colon Free
Zone. The Colon Free Zone is a giant bazaar cum container port where companies from across the
world - many from East Asia from which 65 percent of the merchandise originates - can market
25 In 2013, total internal credit to the private sector of Panama was US$38 billion. In comparison, the Panama Stock
Exchange traded a total volume of only US$5 billion in 2013, less than 12 percent of GDP. Of this amount, US$3.7
billion corresponded to the private sector, mostly corporate bonds, and the remainder was domestically issued public
debt. Equity represented just US$400 million.
Figure III.10: Sectoral Contributions to GDP Growth
from 1947 to 2013 (Percentage points)
Figure III.11: Employment by Sector and Education
Level (Total number, 2012)
Source: INEC, World Bank Estimations Source: INEC, World Bank Estimations
-3
0
3
6
9
12
15
19
47
-19
70
19
71
-19
80
19
81
-19
90
19
91
-20
00
20
01
20
02
20
03
20
04
20
05
20
06
20
07
20
08
20
09
20
10
20
11
20
12
20
13
Financial services and business services Transport and communication CommerceConstruction and mining Hotels and restaurants OtherGDP
3528
12425
50384
101140
132682
161776
203394
359110
476140
0 200000 400000 600000
Mining and quarrying
Electricity, gas, and water supply
Financial, insurance and real estate activities
Manufacturing
Transportation, storage, and communication
Construction
Agriculture, forestry and fishing
Wholesale, accommodation and food services
Community, social and personal services
Primary incompleted Primary completed Secondary incompleted
Secondary completed Postsecondary incompleted Postsecondary completed

27
their products to buyers from the region saving the latter the inconvenience of traveling to Asia
and of stockpiling parts. This cluster has become a significant financial center serving, in
particular, clients in Columbia and Venezuela as well as other parts of Latin America. In the last
two years, the exports-import activity declined as a consequence of lower sales to Venezuela,
Puerto Rico and Dominican Republic and the deceleration of sales to Colombia. Sales to
Venezuela declined due to the problems of that country in accessing foreign exchange markets,
while sales to Colombia remained stagnant due to increasing tariffs on textile and shoes exports.
58. The construction sector has been an important growth driver in recent years and
created most of the new employment between 2007 and 2012, especially for low-skill workers.
Over the past decade, construction exhibited strong growth explained by vigorous private
investment in residential projects and public infrastructure projects, such as the expansion of the
Panama Canal and the construction of line 1 of the Panama City Metro. In addition, in recent years,
construction of hotels and storage has also contributed to the sector. Related indicators, such as
concrete and cement production, have also exhibited vigorous growth. Overall, construction has
grown on average 21 percent per year in the last five years, contributing 2 percentage points of
GDP. Meanwhile, the sector contributed 17 percent of total growth in employment. It is very likely
that in the last decade there has been a migration of agricultural workers from the provinces to
Panama City to work in the sector. Construction is, after agriculture, the sector with the highest
share of employees that have only secondary education completed or less (Figure III.11).
59. The role of agriculture and manufacturing for growth has decreased, although
agriculture remains a key source of income for the bottom 40 percent. While still growing in
absolute terms, the shares of both agriculture and manufacturing have declined in total GDP due
to the strong growth of other sectors. The share of agriculture dropped from 7 percent of GDP in
2000 to 3 percent in 2013, and manufacturing declined from 10 percent to 5 percent. While
agriculture only accounts for a small share of GDP, it employs 17 percent of the workforce and
has contributed to poverty reduction through employing a large share of the bottom 40 percent (see
Figure II.5). Main products include rice and beans for domestic consumption and of bananas,
plantains, shrimp, sugar, pineapples, watermelons, and coffee for exportation. In terms of
manufacturing, the textile industry is declining and the growth prospects of other industries, such
as food processing, construction materials and chemicals, are dim.
60. Panama is richly endowed with natural capital and has used it sustainably;
nonetheless, the mining sector accounts for a small share of GDP so far although it could
expand further in the future. Between 2008 and 2012, the sector grew 14 percent, averaging 2
percent of the country’s GDP. In 2011 and 2012, gold was the top export of Panama, totaling
US$117 million and US$116 million, respectively. By 2013, the mining sector was producing
US$553 million or 2 percent of Panama’s GDP. Construction materials accounted for most of this
production, while gold production and exports started declining, down to US$66 million in 2013
and to only US$38 million in the first quarter of 2014 (a 97 percent drop vis-à-vis the same period
in 2013), due in large part to a significant decline in gold prices that made production
uneconomical.

28
THE INCREASING ROLE OF PUBLIC INVESTMENT
61. Investment has played a prominent role in Panama’s growth in recent years,
supporting a shift of the country’s growth model towards domestic demand (Figure III.2).
While private consumption has been an important driver of growth throughout (contributing on
average 4.2 percentage points since 2001), the contribution of net exports has fluctuated with
external conditions. During the period from 2004 to 2008, net exports contributed significantly to
overall growth through high export growth in services (accounting for 2.8 percentage points of
overall growth). During the crisis year 2009, net exports contributed positively to growth based on
the significant contraction of imports. In the post crisis years, the contribution of net exports to
growth has been moderate as the expansion of imports exceeded that of exports. While investment,
both public and private, contributed only around 1 percentage point to overall growth between
2001 until 2009, its contribution doubled thereafter off-setting the lower contribution of net
exports. Gross investment reached almost 30 percent of GDP in 2013 (Figure III.14).
62. The increased contribution of public investment to growth has been backed by an
ambitious public investment program and the Panama Canal expansion. The share of public
investment in GDP increased from 3.1 percent in 2001 to 13.7 percent in 2013. In 2010, the
Government launched a public infrastructure program comprising more than 100 projects such as
highway upgrades, roads enlargement and upgrade in Panama City, airport infrastructure upgrades
in six airports (including Tocumen Airport), a cold chain to support agriculture activity and reduce
losses in the sector, the Panama Canal expansion, Metro line 1 in Panama City and a metro bus
system, Panama City Bay remediation, improvement in the sanitation services, hospitals and 21
health care centers, Curundu urban renovation, 10 air naval stations, 4 new prisons, among others.
The total investment of the program is estimated at US$16.7 billion with an overall execution
above 80 percent. 26 The Panama Canal expansion project amounts to US$5.2 billion and is
currently planned to be finalized by the end of 2015. In addition, according to the Government,
this program was expected to generate at least 100,000 new jobs.
FDI AND PRIVATE INVESTMENT
63. FDI has financed a large part of this infrastructure investment and remains the
largest source of external finance of the current account deficit (Figure III.12). Panama has
been successful in attracting FDI inflows from a group of diversified economies from all over the
world. In general, FDI has gained in importance in Panama since the late 1990s and in the last
decade, it reached the current high level in excess of 10 percent of GDP. These buoyant FDI
inflows have financed on average 80 percent of the current account deficit in the last three years.
The average of the deficit on the current account of the balance of payment increased from US$942
million in 2003-2007 to US$3,962 million in 2010-2012. The main reason for the expansion of the
deficit is a large increase in investment from an average of US$3,212 million in 2003-2007 to
US$8,571 in 2010-2012, although was partly compensated for by an increase in savings from
US$1,818 in 2003-2007 to US$4,307 in 2010-2012.
26 The frequent use of turnkey contract may underestimate the total investment.

29
Figure III.12: Current Account Deficit and FDI Figure III.13: Real GDP Growth and FDI 1980 to
2012 (Percent change)
Source: INEC, UNCTAD, World Bank Estimations. Source: World Bank, WDI and INEC. Estimations.
64. As a consequence, Panama’s growth rate is highly dependent on FDI (Error!
eference source not found.). A one percent increase in the FDI to GDP share has a short run
impact on real GDP growth equivalent to 0.63 percentage points and a long term effect equal to
0.79 percentage points; in fact, 56 percent of the variance in the growth rate is explained by FDI.
Figure III.14: Savings versus Investment 1980 to 2013
(Percent of GDP)
Figure III.15: FDI by Economic Activity 2010 to
2012 (Share of total FDI)
Source: World Bank, WDI Source: World Bank estimations and INEC
65. FDI and private investment more generally have increased due to a favorable and
improving business environment. FDI inflows increased from 9 to 11 percent of GDP between
2010 and 2013 and private investment from 13 to 16 percent. As mentioned before, Panama is a
top performer in Latin America in the Global Competitiveness report and has managed to improve
its ranking in the Doing Business indicators, improving to rank 55, or 5th in Latin America in 2014,
from rank 79 overall in 2007.
66. Panama has been successful in attracting headquarters of foreign companies to
Panama City. Under the SEM (Sedes de empresas multinacionales) program (also called Law 41,
-20.0
-15.0
-10.0
-5.0
0.0
5.0
10.0
15.0
20.0
1980 83 85 87 89 91 93 95 97 99 01 03 05 07 09 11 13FDI (% of GDP) Current account deficit (% of GDP)
-20.0
-10.0
0.0
10.0
20.0
30.0
40.0
1980 1985 1990 1995 2000 2005 2010External Gap Gross National Savings (RHS) Gross Investment (RHS)
45.7
21.5
11.68.3
5.1 3.6 2.2 1.7 0.4
Co
mm
erc
e
Tran
spo
rt a
nd
comm…
Fin
anci
alse
rvic
es
Man
ufa
ctu
rin
g
Oth
er
serv
ice
s
Co
nst
ruct
ion
and…
Ho
tels
and
restau
…
Agr
icu
ltu
re
Min
ing

30
established in 2007), Panama created a new incentive regime (made up mainly of fiscal, labor, and
migratory benefits) to attract foreign companies to Panama, similar to the regimes implemented in
Singapore and Switzerland. These benefits are complemented by Panama’s position as a logistics
hub, its connectivity and well-developed infrastructure, its solid banking center and its dollar-
based economy. Maersk Cargo, one of the most important shipping cargo companies in the world,
was the first company to take advantage of this law and set its regional headquarters in the country
in 2007. Maersk was followed by Procter & Gamble (2007), LG, Roche, Caterpillar, Western
Union, Halliburton (2008), Phillips, Cemex, Pan American Life, Nestle (2009), Sab Miller, Otis,
Ericsson, Sanofi (2010), Unilever, Johnson & Johnson, Baxter, Merck, Van Oord, Huawei (2011),
Belcorp, General Electric, L’Oreal, Diageo, 3M (2012), Hino, Ace Limited, Neptune (2013),
among others. As of 2014, there are more than 100 companies under this regime, which in turn
have invested in Panama almost US$600 million and currently employ about 5,000 workers.
67. FDI has flowed into a large range of sectors, with an emphasis on services. To date,
FDI inflows are concentrated in service sectors, such as commerce, transport and communications,
and the financial services (Figure III.15). The sectoral composition of FDI in Panama more closely
resembles some of the Caribbean countries, rather than other Latin American economies.
68. While the increase in investment led to an expansion of imports, mostly of investment
goods, Panama’s exports have grown more slowly and were concentrated in services. Public
and private construction projects generated a need for investment goods, goods that were imported
(Figure III.16). At the same time, Panama’s exports are oriented toward services, unlike those of
many other upper middle income countries. In the period from 2001 to 2013, exports of services
were on average 62 percent of total exports (Figure III.17). These services included mainly
transport and travel, representing more than 75 percent of the total export of services. Transport is
directly linked to Canal services and its share has remained steady in the recent past. Meanwhile,
travel has increased its share as a consequence of the increasing number of tourist arrivals (which
by 2012 exceeded 1.6 million), coming mainly from the United States, Colombia and Venezuela.
Panama’s main export goods are textiles, chemicals and machinery and electric goods, and are
sold primarily to United States, Venezuela and Colombia. Panama’s export markets are diversified
and not concentrated (in 2011, the Herfindahl index was 0.08).
Figure III.16: Imports of Goods and Services 1996 -
2003 (Share of GDP)
Figure III. 17: Exports of Goods and Services 1996 -
2013 (Share of GDP)
Source: WEO, World Bank Estimations Source: WEO, World Bank Estimations
0
20
40
60
80
100
120
19
96
19
97
19
98
19
99
20
00
20
01
20
02
20
03
20
04
20
05
20
06
20
07
20
08
20
09
20
10
20
11
20
12
20
13
Import of goods Import of services
0
20
40
60
80
100
120
19
96
19
97
19
98
19
99
20
00
20
01
20
02
20
03
20
04
20
05
20
06
20
07
20
08
20
09
20
10
20
11
20
12
20
13
Export of Goods Export of Services

31
69. Moreover, the increase in investment in physical capital has also been accompanied
by an increase in the labor force and in total factor productivity, each explaining around a
third of economic growth between 2001 and 2012 (Figure III.18). These results have to be
interpreted with care because the methodology used biases the estimate of total factor productivity
upwards.27 Despite this upward bias and hence uncertainty about the size of the contribution of
total factor productivity, its increase is consistent with the structural change observed in Panama.
Workers from the agricultural sector moved into urban sectors, and the share of better paid services
expanded, suggesting that resources were allocated more efficiently among sectors.
Figure III.18: Factors Contribution to GDP Growth
1971 to 2012 (Percentage points)
Figure III.19: Labor Productivity by Economic
Activity (Dollars of 1996)
Source: INEC, World Bank Estimations Source: INEC, World Bank Estimations
70. At the same time, labor productivity has increased as well, displaying stark
differences across sectors (Figure III.19). Overall, labor productivity has increased by 27 percent
between 2007 and 2012. The main services sectors – financial services, and transport and
communication (which are capital-intensive) – are the more productive activities, with
productivity well above the overall average. Meanwhile productivity in construction, a labor-
intensive sector whose contribution to growth and job creation has been important, is just under
half of the total productivity of the economy. Differences in productivity are also linked to skill
mismatches and the low level of skills of people employed in labor-intensive activities. For
instance, only 9 percent of the total workers in the construction sector have attained a post-
secondary education, while in personal services this figure is 29 percent, and in financial and real
estate activities, this number is almost five times the construction figure.28
71. Job creation has been concentrated in the Province of Panama. Almost two-thirds of
the net job gain in Panama between 2000 and 2010 occurred in the Province of Panama, mainly in
27 The estimation of total factor productivity was done using a stock of capital that does not properly adjust for the
recovery of the Canal Zone in 1999. The reason is that the capital stock is constructed using the perpetual inventory
model and there is no adjustment for the handover of the Canal. However, the impact of the transfer of the Canal to
Panama on the GDP is properly accounted for (appearing under transport, storage etc.). As a result of this
inconsistency, the estimate of total factor productivity is biased upwards. 28 Personal Services include a large variety of occupations ranging from legal services and bookkeeping to
housekeeping.
-6
-3
0
3
6
9
12
15
19
71
-19
80
19
81
-19
90
19
91
-20
00
20
01
20
02
20
03
20
04
20
05
20
06
20
07
20
08
20
09
20
10
20
11
20
12
Capital Labor Productivity GDP
02000400060008000
1000012000140001600018000
2007 2008 2009 2010 2011 2012
Agriculture Manufacturing
Construction Commerce, hotels and restaurants
Total
20000
70000
120000
170000
Financial and housing services Transport and communication

32
the commerce, construction and services sector. Chiriqui and Coclé followed with 9 and 8 percent
of net job growth respectively. It is worth noting that job creation for each one of these sectors in
the Province of Panama is larger than total job creation in any of the other provinces. Agriculture
activity exhibits a loss of almost 9,000 jobs, the only sector with negative net job creation. Chiriqui
and the Comarca Ngäbe Buglé showed the largest losses. It is very likely that the booming
construction services sector has attracted workers from all over the country, mainly from rural
areas, thus contributing to a reduction in the agricultural labor force.
PANAMA’S STABLE MACROECONOMIC ENVIRONMENT
72. Another factor in Panama’s strong growth performance was the country’s stable
macroeconomic framework. Macroeconomic stability in Panama is based on full dollarization,
fiscal policy that follows a fiscal rule, and a healthy banking sector. Dollarization dates back to a
monetary convention signed with the United States following Panama’s independence from
Colombia in 1903 and coinciding with the beginning of the Panama Canal construction. Given
the lack of independent monetary policy, fiscal policy plays a crucial role in stabilizing the
economy. And Panama has adapted the social and fiscal responsibility law in 2002 that mandates
fiscal deficit ceilings to help maintain fiscal prudence. According to the latest International
Monetary Fund (IMF) Article IV Consultation, most local banks have a traditional business model
with limited wholesale funding, and are well capitalized, profitable and liquid. The system showed
its resilience during the 2008 global financial crisis.
73. As a result fiscal deficits have been kept in check despite the high public investment
and a low tax revenue collection. As discussed above, public investment has been stepped up
significantly in recent years and Panama has been characterized by relatively low tax revenues.
Despite the recent tax reform program implemented in 2009 and 2010, tax revenue reached 12.0
percent of GDP in 2013. It averaged 11.9 percent of GDP in the last three years, below the average
of 13.4 percent in Central America and the world average of 17.3 percent. Revenues from the
Canal are a significant non-tax revenue source for the Central Government representing over 10
percent of total Government revenues. While dividends and fees from the Panama Canal and other
non-tax revenues added another 4.8 percentage points of GDP in 2013 to Central Government’s
current revenues, they are low by international standards. Nevertheless, fiscal deficits remained
relatively low amounting to -2.1 percent in 2011, -1.5 in 2012, and -3 percent 2013 (overall fiscal
balance excluding the Panama Canal Authority).
74. In recent years with particularly high growth rates, inflation rose slightly and has
moderated with the reacceleration of growth rates leading to a gradual real exchange rate
appreciation. Inflation peaked at around 6 percent in 2011 and has since come down to levels
around 3 percent. As these rates have been higher than the inflation rate in the United States since
the economy took off in 2003, the inflation differential has led to a gradual real appreciation with
modest consequences for Panama’s competitiveness.
75. Panama continued the downward trending of its debt-to-GDP ratio. The ratio of public
debt to GDP (including external debt contracted for the Panama Canal expansion) fell from about
66 percent in 2005 to about 41 percent in 2013. To encourage the development of domestic capital
market, the authorities have also increased local debt issuance. Its efforts have been awarded by

33
all credit rating agencies. Panama achieved investment grade in the spring of 2010 and the rating
has further improved in 2012. In April 2013, all three agencies confirmed Panama’s BBB rating,
one notch above investment grade, on par with Brazil, Mexico and Peru.
OUTLOOK
76. There are good reasons to expect that growth will continue to be strong in Panama
(6-7 percent) in the near future. The completion of major infrastructure projects (Canal
expansion and of the first Metro line) will lower public investment in the coming years; yet, this
will be offset by the planned construction of the second Metro line, and the additional traffic
generated by the expanded Canal. Further, there is no suggestion of a downturn in private
investment according to leading indicators of residential and non-residential construction.
Construction permits in the first half of 2014 reached 7268 (equivalent to US$1,155 million of
new construction). This represents a similar amount of construction permits than in the first half
of 2013 (7,254) but an increase in value of 20 percent.
77. The prospects of sustained high growth in the coming years are also supported by
emerging opportunities in key sectors such as transport and logistics, mining, financial
services, and tourism. The transport and logistics sector is already one of the most important and
dynamic sectors in the economy and is expected to remain a main contributor to growth. The
higher volume of cargo passing through the expanded Canal by itself will increase the demand for
related transport and logistics services. In addition, major business opportunities in the next few
years are related private transport infrastructure and the development of added-value logistics
services. For example, the private sector is lining up investments of around US$600m to expand
existing port terminals and US$300m to construct a new container terminal in the Pacific. Special
economic zones and several logistics parks for warehousing and other services are also being
developed. The recently started expansion of other transport and logistics subsectors as for
example air transport, roads and railroads is expected to continue. Among these, Tocumen airport
is currently undergoing an expansion with a total investment of around US$700m, and the road
network is being modernized.
78. While the mining sector could turn into a major driver of growth in the near future,
it is subject to uncertainties. The largest business opportunity is the Cobre Panama project
that is owned by Minera Panama, 80 percent foreign owned by Canada based First Quantum
Minerals. This project alone could involve around US$10 billion in investment over the first ten
years. Over a projected 30-year life, it could also contribute US$7 billion to the Panamanian
economy in the form of royalties and taxes, create 10,000 new jobs and over 2,000 temporary jobs
(from 3,780 in 2013, or 0.2 percent of the country’s employees), make US$1.5 billion in wage
payments and US$800 million in social security payments. Uncertainties on the future outlook of
the sector relate to the uncertain levels of global demand for minerals with effects on prices and
the actual size of the underground deposits. Moreover, political, social and environmental factors
add to the complexities (this issue is further developed in Chapter VII).
79. Panama has the most dynamic banking sector in the Central American region and is
expected to continue to support GDP growth. On the one hand, the projected growth in the
logistics and transport sector is expected to raise demand for funds for new investment projects.

34
On the other hand, high growth is raising Panamanians’ income increasing the opportunities for
Bank intermediation. In addition, the diversification of the economy into new growth sectors will
increase the relevance of alternatives to bank finance. In addition, business opportunities are
emerging in the insurance and reinsurance markets. The insurance market’s penetration is low in
regional comparison and Panama seeks to position itself as a reinsurance hub for Latin America.
80. Tourism is an important sector for Panama. The total contribution of the travel and
tourism sector to GDP was about 14 percent of GDP in 2013 and according to the World
Travel and Tourism Council is expected to increase by 7 percent in 2014, and continue to
grow by 6.3 percent annually over the next decade. This growth will be supported by transport
improvements (e.g., expansion of Tocumen) as well as a series of grants and incentives to invest
in tourism facilities (more than US$100 million are in the pipeline to build new hotels in the next
three years in Panama City, Chiriquí, Los Santos, and Bocas del Toro).
Filling Knowledge Gaps
There are several sectors that are promising drivers of growth going forward. A thorough analysis of different growth
scenarios would support present day decision-making. There are uncertainties about the sectoral composition of
growth and the lack of knowledge about the channels through which poverty reduction and shared prosperity would
be affected. A promising tool to fill this knowledge gap would be a computable general equilibrium model. Such a
model would provide insights on the trade-offs between investing in different public services. It would also provide
information on the channels through which different scenarios would affect growth, employment, and ultimately
poverty reduction and shared prosperity.

35
IV. Prioritization Linked to Growth
PRIORITIZATION PROCESS
81. The goal of the SCD prioritization process is to identify the most critical factors
constraining or driving growth. The diagnostic of growth in the previous chapter presents the
first step in identifying priority areas and concrete opportunities for actions that Panama could take
to increase the probability of growth continuing and contributing to welfare. In this Chapter, the
next steps in the prioritization process are presented along with their key results. (Figure IV.1
shows the full steps of the conducted prioritization process). A similar process for inclusiveness
and sustainability is carried out in subsequent chapters (Chapters V and VI for inclusiveness and
VII and VIII for sustainability).
Figure IV.1: Prioritization Process
82. To identify the key constraints to Panama’s continued growth, the analytical
benchmarking included three different approaches: cross-country benchmarking,
perceptions data from enterprise surveys, and micro-analysis. The purpose of this exercise is
to understand which determinants of growth are the most binding and thus identify priority areas
for action. In addition to identifying areas that are constraints to the country today, the analysis
also focuses on those that could have the highest impact on growth going forward. Since no single
method can provide a definitive answer to such questions, this exercise seeks to weigh a variety of
evidence from different sources and approaches. This is complemented with the most recent
country knowledge and experience on the emerging priority areas.
83. Once the broad priority areas were identified, the next step in the prioritization
process was a series of consultations with the country team and stakeholders in Panama. The
goal was to identify the most critical actions or policies within these priority areas that represent
opportunities for Panama to continue to improve its progress on shared prosperity and extreme
poverty reduction. To hone in on those opportunities with the greatest potential impact, a series of
filters or criteria were applied: 29
Impact on twin goals: Under this criterion, the potential impact on the twin goals of
reducing poverty and increasing the welfare of the bottom forty percent was assessed.
Time horizon of impacts: Here the possible timeframe in which the impact could be
expected to be realized was taken into account, identifying low-hanging fruits and seeking
a balance between short- and long-term impacts.
29 These criteria are those suggested in the “Analytics Approaches for a Systematic Country Diagnostic: A Resource
Document”, Section 5 prepared by Jeeyeon Seo, February 2014.
Diagnostic
Benchmarking
Country Knowledge
SCD Filters
Identified Priority Areas
Country Knowledge
SCD Filters
Identified Opportunities

36
Complementarities: This filter sought to assess the degree to which an identified
opportunity in an area would have possible positive impacts on other constraints and
priority areas.
Evidence-base: The greater the evidence base, the more weight an identified opportunity
was given in the prioritization process.
Political feasibility: The country’s political economy affects the feasibility of addressing
the proposed actions or reforms. Although each opportunity was assessed against this
criterion, opportunities with low political feasibility were still included.
Essential pre-conditions: Two definitions of this criterion were used. The first, if the
proposed actions or reforms were a necessary condition for a productive life, such as
ensuring a “basic minimum standard of living for all”. The second was if the opportunity
was a critical one for other equally important opportunities to be addressed.
84. This last step was carried out through two activities: (i) a facilitated one-day
workshop and (ii) broad-based consultations with stakeholders in Panama. In the workshop
the country team gathered information and inputs on possible policy actions and
interventions that could address the challenges and constraints identified under each of the
priority areas. These inputs were organized in the form of matrices around specific opportunities
to which the SCD filters were applied. This allowed sectoral teams to cross-fertilize across
thematic areas, and engage in discussions on the feasibility and relevance of some of the
interventions. These matrices were then refined and shared broadly with the country team to seek
additional input as needed to fill remaining gaps in some of the areas/filters.
85. This was followed by broad-based consultations with stakeholders in Panama to
discuss and validate the identified priority areas as well as prioritized opportunities. In
particular, it allowed for better understanding of the political economy context and time horizon
of some of the proposed actions. The full set of developed matrices of opportunities is included in
Annex 3.
BENCHMARKING THE DETERMINANTS OF GROWTH
86. To identify the constraints to Panama’s continued growth, a variety of methods were
used, including cross-country benchmarking, and micro and perception data. The purpose of
this exercise was to understand which determinants of growth are the most binding, and to identify
not only the areas that are holding countries back but also those that could have the highest impact
on growth.
a. Cross Country Benchmarking
87. Cross-country regressions have been commonly used to identify the determinants of
growth. Growth regressions are used to identify which of a large number of factors are statistically
and economically significant determinants of growth rates. Cross-country growth regressions
provide a useful input for the analysis. Of particular interest are studies that not only estimate the
determinants of growth but also benchmark the performance of individual countries in Latin
America for each of the explanatory variables. In this regard, two sources are particularly useful.
The first one is a study of economic growth in LAC by Loayza et al. (2005). The second one is a

37
forthcoming LAC regional study by Araujo et al. (2014) which updates and builds on the work by
Loayza et al. (2005) and increases the sample in terms of country coverage and time period.
88. In a first step, these analyses provide an estimate of the impact of the explanatory
variables on economic growth in a large panel of countries, taking into account potential
sources of biases. The analyzed explanatory factors include: transitional convergence (initial
GDP), cyclical reversion (initial output gap), structural policies in areas such as education,
financial depth or public infrastructure, and stability policies, such as lack of price stability or
cyclical volatility. In both cases, the impact of these factors on economic growth is analyzed
relying on system General method of moments (GMM) estimation, an econometric estimation
technique that takes into account unobserved country-specific effects and joint endogeneity of the
explanatory variables (growth drivers) with the dependent variable (economic growth) in a
dynamic model of panel data. Loayza et al. (2005) uses an unbalanced panel of 78 countries with
non-overlapping five-year observations that span the period from 1961 to 1999. Araujo et al.
(2014) expands the sample to 126 countries using five-year non-overlapping panel data from 1970
to 2010.
89. The estimation results can give a sense of the relative importance of the factors behind
growth; however, important limitations of the approach have to be taken into account. First,
as for any econometric estimation, the results may be biased due to omitted variables; second,
instruments used for the GMM estimation may be mis-specified; and third, the proxies for the
explanatory factors may not adequately capture the actual concept that is being analyzed. Given
these limitations, the results from the econometric analysis are cross-checked with additional types
of analysis and country-specific knowledge to form a plausible overall picture.
90. In a second step, a benchmark exercise is carried out to explore the growth that a
country could have achieved if it were a top performer in terms of each of the explanatory
variables. This type of counterfactual exercise highlights the areas with the largest impact on per
capita income for a given country. This is the approach followed by both Loayza et al. (2005) and
Araujo et al. (2014), although with slightly different specifications. The scenarios studied in
Loayza et al. (2005) correspond to a hypothetical situation in which the determinants of growth in
each country would improve to be on par with the top 25 percent of the countries. In Araujo et al.
(2014), one of the scenarios considered corresponds to an improvement in the determinants of
growth to the 90th percentile of LAC. This helps determine the possible effects that a stellar
performance (relative to the rest of LAC) in specific policy-sensitive areas might have had for a
country’s level of GDP per capita. In addition, Araujo et al. (2014) consider what would be the
impact on GDP per capita if the determinants of growth were to improve to the average levels
observed in OECD countries.
91. The analysis by Loayza et al. (2005) suggests that infrastructure, education, and the
government burden are significant constraints to growth in Panama. In contrast, stabilization
policies, financial depth and external conditions appear insignificant.30 The authors also find that
increases in trade openness would positively impact growth in Panama. However, this finding
30 As is common in the literature, both Loayza et al. (2005) and Araujo et al. (2014) classify the determinants of growth
in different categories, including structural factors – such as human capital or infrastructure – and those determinants
of growth that are related to stabilization policies – such as inflation.

38
likely overstates the possible impact of these policies in the case of Panama because the proxy
used for trade openness in the regression analysis refers to trade in goods, while Panama is a
country that exports services rather than goods. The fact that stabilization policies, financial depth,
and external conditions as measured by terms of trade shocks are insignificant is consistent with
Panama having performed very well in these dimensions in the past.31
Figure IV.2: Stabilization and Structural Policies Index
Source: Araujo et al (2014)
92. The analysis by Araujo et al (2014) suggests that infrastructure and education are
significant constraints to growth in Panama. The results of the exercise indicate that Panama’s
GDP per capita would have been higher with more improvements in infrastructure and, to a lesser
extent, education. Government consumption also appears as an area where Panama would benefit
from improved policies. In particular, current expenditures appear large compared to the levels
observed in the best performing countries. The authors do not find a significant impact on growth
had Panama improved its performance in public sector institutions. However, this finding likely
understates the importance of improving institutions, since the variable used in the model to proxy
institutions is a measure of the degree of political competition and political constraints rather than
a measure of the effectiveness or efficiency of public institutions. As in the case of Loayza et al.
(2014), there is no significant impact on growth from an improvement in variables related to
macroeconomic stabilization, reflecting the fact that Panama has already achieved a high degree
of macroeconomic stability, as shown in Figure IV.2.
31 Similarly, Swiston and Barrot (2011) find limited opportunities to boost growth given Panama’s already relatively
high performance in the explanatory variables used in their model.
Argentina
Bolivia
Brazil
Chile
Colombia
Costa Rica
Dominican Republic
Ecuador
GrenadaGuatemala
Guyana
Honduras
Haiti Jamaica
St. Kitts & Nevis
Mexico
Nicaragua
Panama
Peru
Paraguay
El Salvador
Uruguay
Venezuela
0
0.2
0.4
0.6
0.8
1
0 0.1 0.2 0.3 0.4 0.5 0.6 0.7 0.8 0.9 1
Stab
iliza
tio
n p
olic
ies
ind
ex (
0 lo
wes
t, 1
hig
hes
t)
Stuctural policies index (0 lowest, 1 highest)

39
b. Perception Data
93. Microeconomic survey data can provide further insights into the key constraints to
growth. Data collected through the World Bank Enterprise Surveys (WBES) in particular provides
a wealth of information about the experience of firms and what may prevent them from growing.
The Enterprise Surveys, two of which were conducted for Panama (2006 and 2010), provide useful
data on the perceptions of firms about what they experience as key constraints to growth.
Perception data from the WBES suggest a number of areas that are to some extent aligned with
the results of the cross-country benchmarking. This is particularly the case for the lack of an
adequately educated workforce (education in the cross-country benchmarking) and electricity
(infrastructure in the cross-country benchmarking).
Table IV.1: Top Obstacles to Growth (As Reported by Firms)
2006 2010
Top five concerns
of firms Electricity
Corruption
Crime
Tax rates
Macroeconomic instability
Corruption
Practices of the informal sector
Inadequately educated workforce
Crime
Electricity
Source: WBES
c. Firm-Level Micro Data
94. But Enterprise Surveys provide much more than just perception data. A second type
of data collected in these surveys is objective in nature. Importantly, this data relates to both firm
performance (e.g., sales, employment, and productivity) and investment climate constraints (e.g.,
how much does a firm pay in bribes, as opposed to the perception of a given respondent on the
extent of corruption). The availability of these objective measures help nuance some of the
findings. For example, in the case of corruption –one of the top two obstacles–the 2010 Enterprise
Survey shows that the percentage of firms who pay bribes is relatively small. Thus, the Graft Index,
a composite index of corruption that reflects the proportion of times a firm was asked or expected
to pay a bribe when soliciting six different public services, permits or licenses, is similar to the
LAC average. Yet corruption perception has increased and now Panama ranks 102nd of 175
countries, while in 2001, it ranked 52nd. While this information does not solve the disconnect
between a high perception of corruption and relatively average objective indicators of bribing, it
suggests that other factors may well be affecting the perception of corruption.
95. The econometric analysis of firm-level data helps to shed light on the areas that would
have most impact on growth. Because of the availability of objective measures of firm
performance and of the seriousness of investment climate constraints, it is possible to estimate
econometrically the relationship between investment climate characteristics and firm productivity.
This is the exercise that Fajnzylber et al. (2009) undertake using a pooled sample of more than
10,000 firms from across Latin America. Similar caveats apply as mentioned for the econometric
analysis of the benchmarking part of the analysis.
96. Results from the micro-econometric analysis suggest that regulatory compliance,
security, and infrastructure quality are the areas that would have the most impact. Fajnzylber

40
et al. (2009) estimates that improvements in regulatory compliance would have the most impact
on the productivity of Panamanian firms. Regulatory compliance captures the effect of regulation
and institutional quality and is proxied by three variables that are likely to be a reflection of
excessive or arbitrarily enforcement of rules and regulations. Interestingly, infrastructure quality
is proxied in this analysis by firms’ losses causes by electricity outages.
d. Synthesis
97. The different sources of evidence suggest a broadly consistent set of areas that include
infrastructure, education, and public sector institutions. The cross-country benchmarking
exercise concluded that improvements would mainly come from infrastructure and education. The
analysis of microeconomic survey data highlighted regulatory compliance and security (both of
which relate to the effectiveness of public sector institutions) and the quality of infrastructure (see
Table for an overview).
Table IV.2: Synthesis on Process to Benchmark Priority Areas for Growth
Cross-country benchmarking Micro survey data Emerging
priority areas Loayza et al.
(2005)
Araujo et al.
(2014)
2006
Enterprise
survey
2010
Enterprise
Survey
Micro-
econometric
analysis
Areas
that
would
have
the
most
impact
Infrastructure
Education Government
burden
Infrastructure
Education
Government
burden
Electricity
Corruption
Crime
Tax rates
Macro-
economic
instability
Corruption
Practices of
the informal
sector
Inadequately
educated
workforce
Crime
Electricity
Regulatory
compliance
Security
Infrastructure
quality
Infrastructure
(e.g., electricity)
Education
Public sector
institutions
PRIORITY AREAS
Infrastructure with a focus on energy
98. While the presented cross-country and microeconomic evidence points to binding
constraints in the broad area of infrastructure, in recent years Panama has been ranked
highly on infrastructure in international comparisons. Panama is one of the most competitive
countries in the region on infrastructure developments, such as roads, ports and airports according
to the Global Competitiveness Ranking prepared by the World Economic Forum. Panama has
positioned itself in the last decade as a foreign trade and logistics hub due to the development of
infrastructure and services for the different modes of transport, with the Panama Canal at the
center. Moreover, according to the World Economic Forum’s Executive Opinion Survey, the
quality of Panama’s of port infrastructure performance exceeds that of other countries in the LAC
region and is similar to that of Dubai and Hong Kong SAR, China. In addition, overall
infrastructure has improved in recent years boosted by the Government’s ambitious public
investment program. Of particular importance are the Panama City-Colon highway, the Metro line,
and upgrades to airports.

41
99. However, certain infrastructure components appear to have lagged behind, such as
urban connectivity and, most strikingly, energy. The ability of various segments of society to
access job and market opportunities in a cost effective manner is critical for broad-based economic
growth. Metropolitan areas face congestion and connectivity challenges, particularly in the lower
income neighborhoods on the outskirts of Panama City (Choloma and Araihan). Panama’s capacity
to invest in and manage urban development has not kept pace with the real estate boom which has
taken place over the last decade. Panama City would need to significantly improve its offering in
terms of public spaces, walkability and other amenities to compete with other global cities. The
capital was listed among ten cities showing the steepest decline in the livability ranking of 140
global cities32. The full impact of the Metro on access and mobility requires a comprehensive and
multimodal integration policy.
100. The energy sector in particular, has not been able to keep pace with the growing
demand. The lack of the diversification of power generation has not matched the accelerated
increase in demand in the last years33. Total installed capacity in Panama is approximately 2,500
MW, and is comprised primarily of hydropower (both reservoir and run of river) and fossil fuel-
based generation. However, given system-wide inefficiencies (including several power plant
failures) and recent droughts, firm capacity has fallen to as low as 1,600 MW, while peak demand
reached 1,500 MW, leaving Panama vulnerable to shortages. Generation capacity expansion is not
the only cause of the current power sector crisis. The fact that Panama’s transmission grid has also
failed to keep up with growing demand has both limited the delivery of electricity from existing
generation assets to distributors and prevented new power plant construction. With the system
unable to meet rapidly growing demands, the Government has been forced to put emergency
response measures in place and the energy shortage experienced during dry seasons is putting
tremendous pressure on electricity prices.
101. The underlying reason for the current situation is market distortion due to weak
strategic planning, along with subsidies and inefficiencies in the institutional set up. The
subsidies reduce incentives to invest in efficient power generation, transmission and distribution.
The Government plays a major role in the transmission market, while the private sector owns the
power generation and distribution assets. The potential expansion of two interconnection lines to
Costa Rica and Colombia, the latter being the most difficult to execute, are expected to reduce
pressures on the power market. The current subsidies scheme poses risks on fiscal sustainability
and has heavily distorted the prices of the market, which in turn has increased the political cost of
modifying the scheme. Electricity costs in Panama remain among the highest in Central America
despite Government subsidies (the price per KWh for industrial users was 16.95 cents/US$, for
commercial users 17.33 and for residential users 13.83).
Education and Skills
102. Panama has made large gains in education in recent years, with primary enrollment
almost universal and increasing secondary enrollments. Pre-school enrollment has also been
expanded, boding well for future educational attainment. However, the sector faces a number of
challenges that may undermine growth and productivity going forward. Retention in secondary
32 Economist Intelligence Unit (2012). 33 Espinosa el al (2013).

42
education is low and there are concerns about the quality and relevance of the education system
for the present job market.
Figure IV.3: Enrollment Rates by Level, 1990-2010
Source: WDI
103. The demand for highly educated workers is strong and growing in Panama, yet the
system faces significant drop-out numbers at the secondary level. Between 2000 and 2010, the
number of jobs in the country grew by close to 40 percent. The bulk of the jobs created, however,
required completed secondary or tertiary education (see figure in Chapter II above). Less than
eight percent of all jobs were filled by those with primary schooling or less. Despite this strong
demand, the enrollment rate in Panama for secondary schooling is low. After age 12, enrollments
begin to fall; highlighting the difficulties the system has in retaining students. The fact that this
pattern has changed very little between 2007 and 2012 is of further concern.
0
10
20
30
40
50
60
70
80
90
100
Pre primary(gross)
Primary(net)
Secondary(net)
Tertiary(gross)
1990
1995
2000
2005
2010

43
Figure IV.4: Top Ten Business Environment
Complaints
Figure IV.5: Educational Attainment Among
Immigrants in the Labor Force in 2010 (By
country of birth)
Source: WBES, (http://www.enterprisesurveys.org); People
1st, “Skills 2020: World-class skills for Panama’s hotel and
tourism sector”
Source: Authors’ calculations based on Population Census
2010.
104. Firms highlight secondary and vocational education as a binding constraint for the
business environment. A study of the top business environment constraints (World Bank, 2011)
found an inadequately educated labor force to be one of the top three constraints for developing a
business in Panama (Figure IV.4). The quality of graduates appears low: in 2009, on the
international education tests (PISA), Panamanian students underperformed by international
standards, having one of the lowest scores (Figure IV.6: PISA 2009 Mathematics Mean Score (By
country for 15-year-old students and GDP per capita(No further data exist as the country pulled
out of the tests after 2009). The expected growth in demand for high skill workers may not benefit
Panama citizens if those with the required skills are not available. Although international migration
is low in Panama at present (4 percent of the population immigrated in the last ten years), the
education levels of many of these migrants are above those of the national population (Figure
IV.5).
105. Dropout rates remain high despite the high returns to education. Panama exhibits large
positive economic returns to education, higher than Honduras, Costa Rica and El Salvador.34 On
the one hand, the opportunity costs of schooling have probably risen: the massive job creation in
recent years has provided income opportunities for students. On the other hand, there is a lack of
physical infrastructure at the secondary level: for many in remote rural areas, access to schooling
is still a binding constraint.
34 Central America Social Sector Expenditure and Institutional Review, 2014.
2.6%
3.2%
3.6%
3.7%
5.6%
8.0%
8.8%
13.5%
13.7%
32.5%
0% 10% 20% 30% 40%
Customs and trade…
Business licenses…
Access to finance
Labor regulations
Courts
Electricity
Crime, theft and…
Inadequately…
Practices of the…
Corruption
0%
20%
40%
60%
80%
100%
Did not complete Primary Primary
Secondary Tertiary
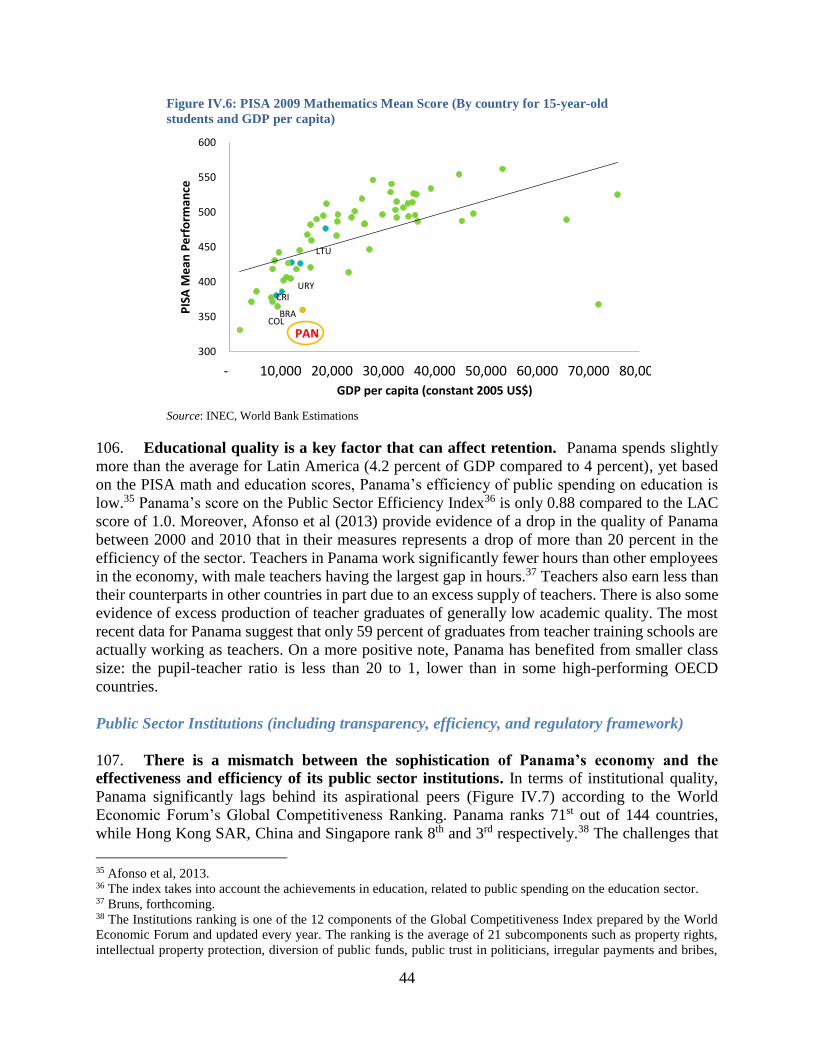
44
Figure IV.6: PISA 2009 Mathematics Mean Score (By country for 15-year-old
students and GDP per capita)
Source: INEC, World Bank Estimations
106. Educational quality is a key factor that can affect retention. Panama spends slightly
more than the average for Latin America (4.2 percent of GDP compared to 4 percent), yet based
on the PISA math and education scores, Panama’s efficiency of public spending on education is
low.35 Panama’s score on the Public Sector Efficiency Index36 is only 0.88 compared to the LAC
score of 1.0. Moreover, Afonso et al (2013) provide evidence of a drop in the quality of Panama
between 2000 and 2010 that in their measures represents a drop of more than 20 percent in the
efficiency of the sector. Teachers in Panama work significantly fewer hours than other employees
in the economy, with male teachers having the largest gap in hours.37 Teachers also earn less than
their counterparts in other countries in part due to an excess supply of teachers. There is also some
evidence of excess production of teacher graduates of generally low academic quality. The most
recent data for Panama suggest that only 59 percent of graduates from teacher training schools are
actually working as teachers. On a more positive note, Panama has benefited from smaller class
size: the pupil-teacher ratio is less than 20 to 1, lower than in some high-performing OECD
countries.
Public Sector Institutions (including transparency, efficiency, and regulatory framework)
107. There is a mismatch between the sophistication of Panama’s economy and the
effectiveness and efficiency of its public sector institutions. In terms of institutional quality,
Panama significantly lags behind its aspirational peers (Figure IV.7) according to the World
Economic Forum’s Global Competitiveness Ranking. Panama ranks 71st out of 144 countries,
while Hong Kong SAR, China and Singapore rank 8th and 3rd respectively.38 The challenges that
35 Afonso et al, 2013. 36 The index takes into account the achievements in education, related to public spending on the education sector. 37 Bruns, forthcoming. 38 The Institutions ranking is one of the 12 components of the Global Competitiveness Index prepared by the World
Economic Forum and updated every year. The ranking is the average of 21 subcomponents such as property rights,
intellectual property protection, diversion of public funds, public trust in politicians, irregular payments and bribes,
300
350
400
450
500
550
600
- 10,000 20,000 30,000 40,000 50,000 60,000 70,000 80,000
PIS
A M
ean
Pe
rfo
rman
ce
GDP per capita (constant 2005 US$)
CRI
LTU
COLBRA
PAN
URY

45
Panama faces regarding its public sector institutions can be summarized as relating to
transparency, the regulatory framework, and efficiency of public sector management.
Figure IV.7: Panama’s Institutional Quality in International Comparison
Source: World Economic Forum, Global Competitiveness Indicators
108. The challenge of the transparency of Panama’s public institutions is widely
recognized. Government practices are perceived as relatively non-transparent and the monitoring
and evaluation function is weak. The issues raised by the Global Forum in the OECD highlight
some of the weaknesses. The Corruption Perception Index prepared by Transparency International
shows that Panamanians perceive their government as more corrupt in recent years than in earlier
periods. Moreover, public trust in politicians is low in Panama; in 2010, just over half of the
population expressed positive levels of trust in the national government and only a third for the
National Assembly (LAPOP, 2010).
109. Panama has demonstrated high levels of efficiency in the management of the Canal,
efficiency that is not been replicated across the full public sector. An overarching problem is
the inability to translate a strategic vision into implementable policy. Despite sundry multi-year
sectorial strategy documents, the lack of linkage between the various plans and of strategic
planning, including at the municipal levels, reduces Government efficiency and erodes the
foundation for efficient fiscal management39. In addition, budget credibility is one of the key public
financial management weaknesses in Panama, also affecting Government transparency. The lack
of budget predictability and the difficulty of realistically defining activities to be executed during
the following year promote improvisation and reduce budget relevance and strategic value, as it is
judicial independence, favoritism in decisions of government officials, wastefulness of government spending, burden
of government regulation; among others. These subcomponents are built using the data from the Executive Opinion
Survey applied in 144 countries 39 Public Expenditure and Financial Assessment report, 2013
71
112
46
87
116
31 26
8
82
58
3
27
7
99109 105
114
Pan
ama
Bu
lgar
ia
Co
sta
Ric
a
Cro
atia
Do
min
ican
Rep
ub
lic
Uru
guay
Esto
nia
Ho
ng
Ko
ng
SAR
, Ch
ina
Ko
rea,
Rep
.
Lith
uan
ia
Sin
gap
ore
Taiw
an, C
hin
a
Un
ited
Ara
b E
mir
ates
El S
alva
do
r
Gu
atem
ala
Ho
nd
ura
s
Nic
arag
ua
Structural peers
Aspirational peers
Other Central American countries

46
no longer a strategic tool of public administration and planning;, but rather becomes a tool for
registering commitments and transfers.
110. Panama’s regulatory framework shows important weaknesses that are apparent in
most sectors of the economy. According to the World Economic Forum’s Global
Competitiveness Ranking, Panama ranks 69st in efficiency of legal framework in challenging
regulations out of 144 countries, while Hong Kong SAR, China and Singapore rank 3rd and 21st
respectively. Box IV.1 illustrate some of these weaknesses in the case of energy.
Figure IV.8: Panama’s Efficiency of Legal Framework in International Comparison
Source: World Economic Forum, Global Competitiveness Indicators
69
124
28
138
65
40
233
113 108
21
75
15
6854
61
118
Pan
ama
Bu
lgar
ia
Co
sta
Ric
a
Cro
atia
Do
min
ican
Rep
ub
lic
Uru
guay
Esto
nia
Ho
ng
Ko
ng
SAR
, Ch
ina
Ko
rea,
Rep
.
Lith
uan
ia
Sin
gap
ore
Taiw
an, C
hin
a
Un
ited
Ara
b E
mir
ates
El S
alva
do
r
Gu
atem
ala
Ho
nd
ura
s
Nic
arag
ua

47
Box IV. 1: Institutional Challenges of the Energy Sector
The governance system in the energy sector has been criticized for its lack of proper planning, weak or limited staffing
and institutional capacity. Slow and/or not always-transparent decision-making is a key factor in the slow pace of
investments in energy infrastructure expansion and strengthening in recent years. Further, existing policies, legislation,
and regulations – the rules of the game – need to be revisited to meet the needs of a modern, expanding, and
diversifying power system that is developing in Panama.
The sector is also characterized by a multiplicity of agencies that are not coordinated. Four primary institutions
comprise the government’s role in the energy sector: (i) the National Energy Secretariat is the lead national agency
that coordinates the actions in the energy and power sector across ministries and agencies; (ii) the National Electricity
Transmission Company (ETESA) is the only participant in the transmission sector. It was created by Law 6 and is the
remnant of the Institute of Water and Electrification (IRHE) responsible for managing the state monopoly on the
energy sector since 1997. It has the responsibility for expanding and operating the transmission system, as well as
operation of the energy market; (iii) the National Dispatch Center (CND) which coordinates the participants in the
distribution market, and (iv) the National Public Service Authority (ASEP) which, besides ensuring compliance with
regulation in the electricity sector, is responsible for regulation related to telecommunications, water delivery and
sewage. In the distribution sector, three private companies control power distribution: ENSA, Edemet and Edechi.
The Panamanian State owns about 40 percent of the shares of ENSA, while Edemet and Edechi belong to the Spanish
group Unión-Fenosa.
The graphic below illustrates the relationship between the relevant agencies.
Energy Sector Institutional Framework Diagram
Source: IDB
IDENTIFIED OPPORTUNITIES
111. A series of specific opportunities have been identified within each of the priority areas
described above, namely energy, education and skills, and public sector institutions. Through
the application of a series of filter and criteria40 along with ground-truthing with stake-holders in
Panama, a set of opportunities for action were identified. These opportunities are briefly described
here while a detailed description of each opportunity can be found in Annex 3. The explicit links
40 See the first section of this Chapter for the detailed list of criteria used.

48
between these opportunities and their effect on specific sectors in the economy that could turn into
future drivers of growth is outlined as well.
112. Identified opportunities in the context of education and skills include both concrete
policy measures and analytical work to understand the underlying causes of the challenges.
he first opportunity consists of rendering secondary education in Panama more relevant for the
labor market. This could be achieved through the introduction of a vocational training program
with participation of the private sector and public sector coordination. This could also be
complemented by a revision of secondary and tertiary education curricula to integrate private
sector needs into the training of young Panamanians. A highly relevant action in this regard appears
to be the comprehensive introduction of English into curricula. A second opportunity consists of
strengthening the monitoring and evaluation of education with the goal of improving the quality.
Low-hanging fruit in this context are participating in the 2015 PISA testing and analyzing the
causes of drop-out from secondary education both by exploiting existing administrative data and
by holding focus group sessions. Finally, a third opportunity consists of addressing high drop-out
rates by expanding the Beca Universal program through targeted offerings for vulnerable students,
including culturally appropriate offerings in indigenous areas.
Filling Knowledge Gaps
There is little data available on coverage and quality of public service delivery across the country. The role of
municipalities in regulating and/or providing public services is fundamental in reaching out to the unserved.
Understanding the correlation between weak local governments and access/quality of public services in the poorer
geographic regions is critical to promoting better service delivery. The same is true for linking spatial data on public
social services to outcomes. A contribution to filling this knowledge gap could consist of compiling detailed
information (data bases) on the quality and resources of regions, municipalities and metropolitan areas in Panama.
113. For energy, opportunities present themselves in the context of short-term demand
management, the institutional framework, and power generation, transmission and
distribution. The first opportunity consists of the management of national energy demand. This
opportunity could be realized in a short time frame. In other countries such as Brazil, these types
of short-term demand response measures led to a 20 percent reduction in demand. The impact in
Panama is expected to amount to a 10 percent reduction. The second opportunity consists of the
modernization of the institutional framework of the sector, including improving the coordination
among institutions that are key players in the sector. The third set of opportunities relates to the
physical infrastructure of energy generation, transmission, and distribution: by adding renewable
energy or natural gas power generation, Panama may mitigate the risks of power shortages through
(a) taking advantage of their costs being lower than the existing oil-based generation; (b) reducing
vulnerability to droughts associated with large hydropower plants; and (c) reducing dependence
on imported fossil fuels. By expanding the number of transmission lines, electricity flows from
existing and planned power projects will not be limited by the capacity for throughput as is
currently the case given the lack of adequate power transmission.
114. Opportunities on public institutions relate to transparency and efficiency of public
institutions as well as the adequacy of the regulatory framework. Two main opportunities
emerged in the context of transparency. The first is related to meeting the standards on tax and
financial information sharing of the Organization for Economic Co-operation and Development
(OECD), the second is related to improving public procurement practices, in particular for large

49
infrastructure projects. In the context of public institution efficiency, three further opportunities
present themselves. First, a move to performance-based budgeting, accompanied by better
coordination among Government plans and entities, could have major benefits. Second,
developing institutional capacity at the municipal level is needed to support the move towards
decentralization. Improving fiscal management would be the third opportunity under public
institution efficiency. This is particularly relevant in a country like Panama that has fully out-
sourced its monetary policy to the United States Federal Reserve and that has little room for fiscal
maneuver due to the deficit ceiling mandated under the Fiscal Responsibility Law. These strong
constraints on fiscal policy mean that the only way in which Panama can create fiscal space is
through efficiency gains. Finally, improving the adequacy of the regulatory framework including
the formulation and adaption of a modern mining regulatory framework, the enforcement of social
and environmental safeguards regulations; and third, an update of financial sector regulations.
These actions are particularly relevant for the financial and mining sectors, which are promising
sectors for the economy going forward.
115. The impact of making progress on the opportunities identified will vary by sector.
Some specific examples of how these policy opportunities will affect promising sectors of
Panama’s economy are mentioned here. These examples draw on the International Financial
Corporation’s private sector expertise in Panama. Comprehensive sector notes can be found in
Annex 4.
116. Improvements in public sector institutions will help both the mining and financial
sectors of Panama to maintain or increase their roles as important drivers of growth. To
ensure that the country can take advantage of the existing mining potential, the formulation and
adaption of a modern mining regulatory framework is both an opportunity and high priority.
Overall, the existing mining legal and regulatory framework has not been updated to incorporate
new international standards on effective oversight of mining activity by the relevant government
and municipal institutions, subnational royalty sharing schemes, and environmental protection and
social responsibility. Even though the financial sector is well regulated, transparency could be
enhanced by achieving OECD Global Forum standards, which promote transparency and
information exchanges, thus reducing operational costs and ameliorating systemic risk.
Transparency and appropriate regulatory frameworks are also critical for Panama to launch itself
as a reinsurance hub for Latin America and improvements in the institutional framework are
required to develop the domestic capital market and expand the role of the Panamanian Stock
Exchange.
117. For tourism, and the transport and logistics sector, focusing on the priority areas of
education and energy will remove existing barriers to expansion. The large number of planned
activities in the transport and logistics sector will generate new demand for a well-trained labor
force that is English-proficient and capable of working in a multi-cultural environment. Tourism
is also expected to continue to be a significant driver of growth in Panama; investor confidence
remains high given the country’s strategic location and stability. The opportunities identified above
of updating the curriculum of the International Baccalaureate and introducing bi-lingual education
will be critical to meeting the new labor demand of both sectors and improving productivity. The
energy sector will need to respond to new demands as well, not simply by generating more power
but by providing transmission mechanisms to areas presently under-served. The present saturation

50
of the hotel market in the capital, for example, means that new investments will more likely take
place in remote areas and provinces outside of Panama. The opportunities identified to improve
transmission as well as generation of electricity will prevent energy from becoming a barrier to
these sectors.

51
V. Inclusiveness of Panama’s Growth
119. Panama’s growth has been inclusive along many dimensions but the geographic and
ethnic distribution of growth has not been homogenous. Growth has been strong, averaging 7.2
percent between 2001 and 2013, and above 8 percent for five of the past seven years despite the
crises of 2008-09. The bottom forty percent of the population has benefited more than the average
Panamanian from growth. Average income growth among the bottom forty percent of the
population was 7 percent compared to 6.3 percent overall (Figure V.1)41 with the resulting fall in
overall poverty from 40 to 26 percent of the population and extreme poverty from 16 to 11 percent
(see Chapter II). Yet the geographic distribution of growth has not been homogenous: the poorest
areas, being the indigenous territories (comarcas), continue to lag behind.
Figure V.1: Annualized Growth Incidence Curve
2007- 2012 (Constant prices of 2002)
Source: Calculations by authors based on the Encuesta de
Mercado Laboral(EML)
Note: Numbers in blue boxes represent the average annual
growth rate of the full population and the bottom 40 percent.
120. The change in the view of night lights in Panama between 1997 and 2010 underscores
the overall growth performance along with the remaining geographic inequality, inequality
linked to ethnicity (Figure V.2). On the one hand, economic growth around the Canal is clearly
visible as is the expansion of growth into the interior in the provinces of Coclé, Los Santos and
Chiriquí through the spread of night lights. On the other hand, the continued darkness over
substantial sections of the country reflects regions that have either only benefited slightly from
economic growth, or were so far behind the others that recent growth has not been enough for them
to catch up, or regions where there are disperse populations to which it is hard to provide services
(including but not limited to electricity). In particular, the indigenous territories are in areas of the
map that have remained without access to electricity.
41 This chapter uses figures based on Panama’s national methodology. These vary from those figures based on
harmonized data and methods used for cross-country comparisons.
0.0%
2.0%
4.0%
6.0%
8.0%
10.0%
0 10 20 30 40 50 60 70 80 90 100
An
nu
al g
row
th r
ate
7 % 6.3 %

52
Figure V.2: Night Lights in Panama 1997 and 2012
Source: Night Lights Data
(http://geowb.worldbank.org/portal/apps/OnePane/swipe/index.html?webmap=674a46aa308f43c7bd340fb26cbad811,8
a9227075dcf4d3893611310596bbf71)
POSITIVE TRENDS
121. Recent economic growth has led to a substantial increase in the size of the middle
class. In 2007, the middle class spanned the 69th to 84th centiles of the population while in 2012,
it had expanded to encompass the 57th to 96th centiles of the distribution (Figure V.3). The share
of income going to the middle class rose from 52.4 to 55.8 percent during the period (using the
definition of middle class as having per capita income of US$10-50 per day). The top earners
doubled their population share, from one to two percent and saw their share of total income rise
from 10 to 16 percent. The ratio of the share of income of the top 10 percent of the population over
the remainder of the population has remained at 2.2 percent from 2007 to 2012.
1997
2010

53
Figure V.3: The Rise of the Middle Class
(a) 2007 (b) 2012
Source: Authors’ calculations based on EML, 2007 and 2012.
Note: Poor is defined as having income below the national poverty line, middle class having incomes of US$10-50 a day per
capita with the rich having incomes of more than US$50 per day. In this analysis, the vulnerable are those whose incomes are
above the poverty line but below the middle class and thus face a danger of falling back into poverty.
122. Changes in inequality at the
national level, and within urban areas,
have been minimal: a one percentage
point change over five years (Figure V.4).
In contrast, rural inequality has fallen
substantially – four percentage points in five
years – although it is still slightly higher than
in urban areas. The decline in rural inequality
appears to be driven by increased public
spending in rural areas that reached the
poorest groups along with internal migration:
self-selection in migrants lowers the
inequalities in their communities of origin
(see below for a discussion of internal
migration).
123. There has also been substantial progress on non-monetary indicators of welfare and
access to services. Life expectancy has risen steadily and the country has met the Millennium
Development Goal in terms of child mortality (Table V.1). While not expected to reach the MDG
goal on maternal mortality, the last ten years have nonetheless seen some progress on reducing
maternal mortality in the country. Malnutrition rates have also declined. Progress has been made
in measures of welfare related to service access as well. Enrollment in education has increased at
all levels since 1990, with the biggest gains seen at the pre-school and tertiary levels. The average
years of schooling of the population has increased by 1.6 years since 1990 and 0.1 years since
2005. Access to running water in a dwelling increased from 84 percent in 2000 to 94 percent in
2010, electricity access rose seven percentage points (a smaller number given the higher starting
point) and access to sanitation, while still limited, rose from 60 to 72 percent between 2005 and
2010 (Figure V.5).
Figure V.4: Gini Coefficient by Area
2007-2012 (Index)
Source: Authors’ calculations based on EML, 2007-2012
44
46
48
50
52
54
56
2007 2008 2009 2010 2011 2012
Urban Rural Total
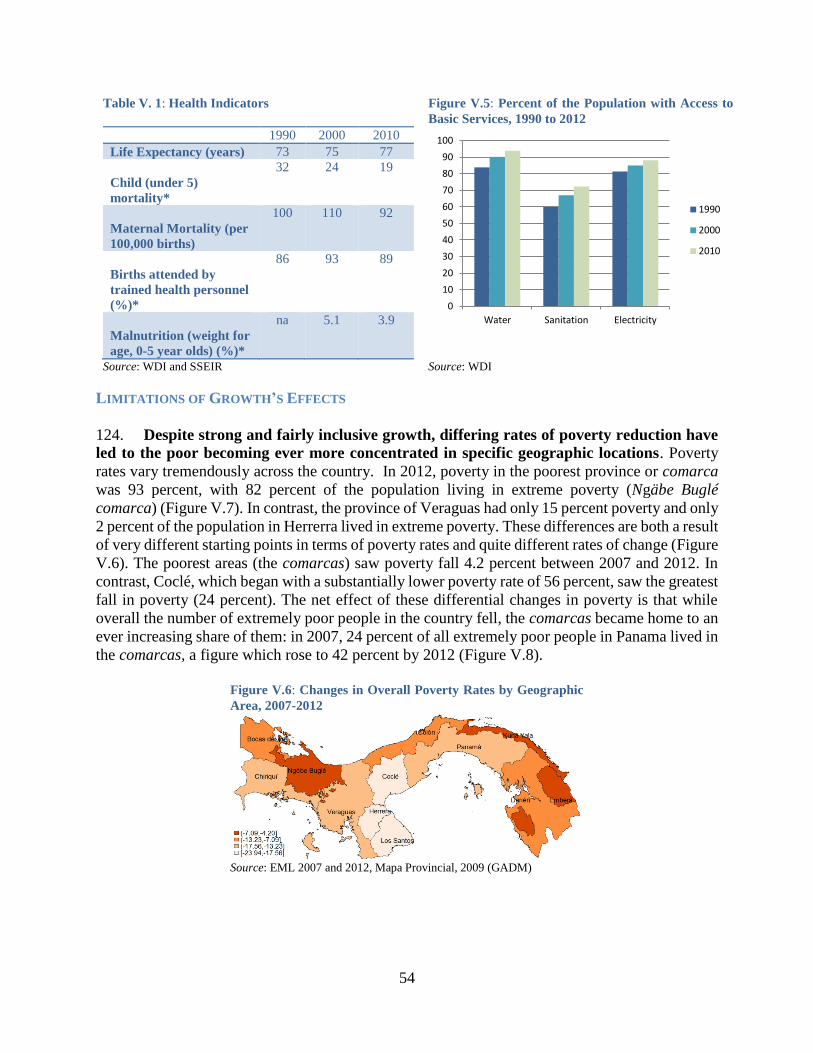
54
Table V. 1: Health Indicators Figure V.5: Percent of the Population with Access to
Basic Services, 1990 to 2012
1990 2000 2010
Life Expectancy (years) 73 75 77
Child (under 5)
mortality*
32 24 19
Maternal Mortality (per
100,000 births)
100 110 92
Births attended by
trained health personnel
(%)*
86 93 89
Malnutrition (weight for
age, 0-5 year olds) (%)*
na 5.1 3.9
Source: WDI and SSEIR Source: WDI
LIMITATIONS OF GROWTH’S EFFECTS
124. Despite strong and fairly inclusive growth, differing rates of poverty reduction have
led to the poor becoming ever more concentrated in specific geographic locations. Poverty
rates vary tremendously across the country. In 2012, poverty in the poorest province or comarca
was 93 percent, with 82 percent of the population living in extreme poverty (Ngäbe Buglé
comarca) (Figure V.7). In contrast, the province of Veraguas had only 15 percent poverty and only
2 percent of the population in Herrerra lived in extreme poverty. These differences are both a result
of very different starting points in terms of poverty rates and quite different rates of change (Figure
V.6). The poorest areas (the comarcas) saw poverty fall 4.2 percent between 2007 and 2012. In
contrast, Coclé, which began with a substantially lower poverty rate of 56 percent, saw the greatest
fall in poverty (24 percent). The net effect of these differential changes in poverty is that while
overall the number of extremely poor people in the country fell, the comarcas became home to an
ever increasing share of them: in 2007, 24 percent of all extremely poor people in Panama lived in
the comarcas, a figure which rose to 42 percent by 2012 (Figure V.8).
Figure V.6: Changes in Overall Poverty Rates by Geographic
Area, 2007-2012
Source: EML 2007 and 2012, Mapa Provincial, 2009 (GADM)
0
10
20
30
40
50
60
70
80
90
100
Water Sanitation Electricity
1990
2000
2010

55
Figure V.7: Poverty Rates by Province and Comarca,
2012 (Percent)
Figure V.8: Changes in Geographic Concentration
of the Extreme Poor
Source: Encuesta de Mercado Laboral 2007 and 2012,
Note: Panamá Province has been divided into two separate provinces since 2013. However the data sources are representative
only for the full Panama province level.
125. Internal migration may also play a role in the concentration of poverty as it is both
large and there is evidence of self-selection among migrants. There has been substantial internal
migration in recent years: in 2010, one-fifth of the population over 15 lived in a district that was
not the same as where it had lived ten years previously. The rates vary little by ethnicity: the Afro-
descendants are slightly less prone to migrate (20 percent having migrated), while the indigenous
are slightly more likely (22.6 percent) and the migration rate for all other groups was 21.6 percent.
Due to data limitations, it is not possible to look at either the total number of migrants (many
persons may have migrated and then returned to their previous location in the ten-year reference
period) nor trace the full migration patterns.42 However, the overall picture is one of movement
with a tremendous bias towards the Province of Panama: 67 percent of all migrants moved to the
Province of Panama. Among the indigenous migrants, 48 percent of moved to this province while
compared to 79 percent of Afro-descendants (Figure V.9).
42 As intermediate moves cannot be seen in the data, it is unknown if rural migrants move directly to large urban areas
or make a series of intermediate moves, moving first to small towns or cities and then to larger ones.
0
10
20
30
40
50
60
70
80
90
100
Overall Poverty Extreme Poverty
Comarca Ngobe Buglé Comarca Kuna Yala
Comarca Embera Bocas del Toro
Panamá Los santos
Darien Chiriquí
10%
6%
20% 15%
24%42%
0%
2%
4%
6%
8%
10%
12%
14%
16%
18%
2007 2012
Pe
rce
nt
Los Santos
Herrera
Darién
Colón
Bocas del Toro
Coclé
Veraguas
Chíriqui
Panamá
Comarcas

56
Figure V.9:Destination of Internal Migrants between 2000 and
2010 (Percent)
Source: Authors’ calculations based on 2010 Population and Housing Census.
Note: For population 15 and older.
126. Internal migrants to the Province of Panama show evidence of being positively self-
selected: education levels of those migrants are higher than those of non-migrants (Figure
V.10). The difference in education between migrants and non-migrants is especially pronounced
among the indigenous population: while 47 percent of the non-migrant indigenous adult population
has not finished primary school, only 22 percent of those indigenous migrants to the Province of
Panama fell into this category. Among the Afro-descendants and other Panamanian populations,
migrants are more likely to have completed secondary or tertiary school than non-migrants, while
those who did not finish secondary school are less likely to have migrated. This pattern of positive
self-selection does not hold for migrants to other parts of the country, perhaps reflecting the greater
range of employment offerings for lower-skilled workers. Further evidence of self-selection comes
from the fact that migrants are less likely to be unemployed than non-migrants (Figure V.11).
However, this is probably also driven by return migration, unsuccessful migrants being more likely
to return to their place of origin.
Figure V.10: Educational Attainment of Internal Migrants, 2010 (By Ethnicity, percent)
Source: Authors’ calculations based on 2010 Population and Housing Census. For population 15 and older.
67%
48%
79%
0%
10%
20%
30%
40%
50%
60%
70%
80%
90%
100%
Share of allmigrants
Share of IPmigrants
Share of ADmigrants
Comarca Kuna Yala,Comarca EmberáComarca NgobeBugleBocas del Toro
Colón
Coclé
Veraguas
Darien, Herrera, LosSantosChiriquí
Panamá
0%
10%
20%
30%
40%
50%
60%
Primaryincomplete
Primarycomplete
Secondarycomplete
Tertiary Primaryincomplete
Primarycomplete
Secondarycomplete
Tertiary Primaryincomplete
Primarycomplete
Secondarycomplete
Tertiary
Other IP AD
Non-Migrant
Migrant - Province of Panama
Migrant - Other

57
Figure V.11: Unemployment Rates (Open and Broad), by Migration Status and Ethnicity,
2010 (Percent)
Source: Authors’ calculations based on 2010 Population and Housing Census. For population 15 and older.
Note: IP= Indigenous Peoples, AD=Afro-descendants, Other=All other ethnic groups. Unemployment
(open) refers to those who report being unemployed and actively searching for work; Unemployed (Broad)
includes those actively searching as well as “discouraged workers”, those who would like to work but have
given up searching.
127. There remain wide disparities among various groups and areas in the country (Figure
V.12). Geographic differences are large with the poor under-represented in urban areas relative to
the population of cities, and over-represented in rural areas and the comarcas. In absolute terms,
however, urban and rural areas have similar numbers of poor people at around 40 percent of the
total. The remaining 21 percent of the poor live in the three largest comarcas. While there are
greater numbers of poor people in urban areas than in the comarcas, the urban poor are better off
than their poor counterparts in the comarcas. Among the urban poor, monthly incomes are twice
as high, the years of schooling of the head of household are more than double, a greater share of
household members are of working age and their school-age children are more likely to be enrolled
in school than those in the poor households in the comarcas. And the discrepancies are greater
among the extreme poor: the population living in the comarcas is worse off than other extremely
poor persons in the rest of the country (Figure V.13). Forty-two percent of the extremely poor live
in comarcas, despite that fact that only six percent of the total population lives there. The extremely
poor in rural areas are somewhere in between the comarcas and the urban extremely poor on most
indicators but actually have the highest income per capita per day (at US$1.7 compared to US$1.3
in the comarcas and US$1.5 in urban areas).
128. Differences by ethnicity are also marked. Ideally, the data should allow a comparison
among the indigenous population living in the comarcas, the indigenous population living outside
the comarcas, the Afro-descendant population and the rest of the population. However, as
discussed in Box II.1, the data limitations preclude the calculations of comparable poverty rates of
the full indigenous population or that of the Afro-descendants. The only data source that allows a
comparison to be made of these two groups, indigenous outside of comarcas and Afro-
0%
2%
4%
6%
8%
10%
12%
Province ofPanama
Elsewhere Province ofPanama
Elsewhere Province ofPanama
Elsewhere
Other IP AD
Migrants Unemployment (Open) Migrants Unemployment (Broad)
Non-migrants Unemployment (Open) Non-migrants Unemployment (Broad)

58
descendants, is the decennial National Population and Housing Census. The Census provides data
on several indicators that can serve as proxies for welfare.
Figure V.12: Characteristics of the Poor,
by Geographic Area
Figure V.13: Characteristics of the Extreme Poor,
by Geographic Area
Source: Authors’ calculations based on EML, 2007-2012
129. The indigenous population that lives outside of the five comarcas appears to be better
off than their counterparts living in comarcas (Table V.2).43 Those living outside the comarcas
have much greater access to services and their incomes are more than three times as high. They
are also more educated although their children have the same enrollment rate as those in the
comarcas. Households tend to be smaller, with more working age members and more male-headed
households – further evidence of selectivity in migration. Despite the fact that indigenous people
living outside the comarcas appear to be doing better in terms of basic indicators, they still lag
behind their non-indigenous counterparts on all indicators.
130. In contrast, Afro-descendants, for the indicators for which data exist, appear to be
slightly better off than the population at large (Table V.2). On average, their access to services
is higher, reflecting in part that many live in the urban areas of Colon and Panama City. Income
levels are also higher as are education levels and school enrollment. However, none of the
indicators related to services reflects the quality of these and there are legitimate concerns about
service quality in Colon and parts of Panama City. Moreover, there is a concern that, for reasons
of stigma, only the better off and more empowered members of the group will self-identify as
Afro-descendant, which would lead to an over-estimation of welfare among Afro-descendants.44
43 Using the census data allows for an analysis of all five comarcas, not just the three largest represented in the
household survey (EML). However, approximately three percent of the indigenous population in Panama lives in
territories that have not been given the legal status of comarca. These are considered to live in non-comarca areas for
the purpose of the present analysis. 44 We are indebted to members of the civil society consultation group around Afro-descendant issues for this insight.
21.2
47.6
1.6 3.3
84.3
6.6
70.0
40.5
15.1
41.9
2.5
38.944.3
3.58.5
91.7
4.4
60.3
32.7
13.9
50.0
3.4
0.0
20.0
40.0
60.0
80.0
100.0
Comarca Rural Urban
41.746.3
1.3 3.2
84.2
7.0
71.2
43.5
15.1
39.4
2.1
24.519.9
43.9
1.5 8.2
89.8
4.6
51.7
33.8
15.2
48.6
2.4 3.0
0.0
20.0
40.0
60.0
80.0
100.0
Comarca Rural Urban

59
However, with the available quantitative data, the Afro-descendant population does not appear to
be at a particular disadvantage.45
Table V.2: Basic Characteristics of the Population by Ethnicity, 2010
Indigenous in
Comarcas
Indigenous
outside
Comarcas
Afro-
descendants
All others
Share of national population (%) 5.7 6.3 8.8 79.2
Income levels
Income Per Capita Per Day (2010
USD)
1.3 4.8 13.2 11.9
Dwelling characteristics
Access to electricity (%) 5.9 60.5 96.7 89.6
Access to water (%) 44.8 80.1 96.8 95.4
Flushing Toilet (%) 0.9 34.5 81.4 64.6
Household Demographics
Age of head 45.3 41.4 47.7 48.0
Proportion age 0-12(%) 39.3 30.2 17.0 17.7
Proportion age 13-18(%) 12.8 12.3 8.0 8.4
Proportion age 19-70(%) 44.3 55.1 68.6 66.8
Proportion age 70+(%) 3.7 2.4 6.4 7.2
Household Characteristics
Education of head (years) 3.5 5.9 10.9 9.5
Enrollment 6-18 yr olds (%) 82.8 82.9 93.0 91.5
Household size 6.0 5.4 3.4 3.5
Male headed HH 68.4 80.8 66.9 71.2
Source: Population and Housing Census, 2010.
Note: Less than two percent of the Afro-descendants also self-identify as Indigenous. For purposes of this analysis these people
were considered Afro-descendants
131. Economic growth has translated into improved access to services, but despite
evidence of convergence, sharp differences remain; growth has not been enough to fill the
gaps. Between 2000 and 2010, education levels (enrollment rates) have risen fastest in the
provinces or comarcas with the lowest initial levels and in the areas with the biggest gap between
males and females; notably, female enrollments have climbed more quickly than those of men.
The convergence appears similar in terms of access to water with rates of change higher in the
areas that started with lowest coverage (Figure V.16). Colon is an outlier here, showing a high rate
of change. In terms of sanitation (sewer connections), the story is similar for all of the country
except the three comarcas: these areas are almost completely excluded from access to sanitation
(Figure V.17). Institutional factors affect the provision of public services in water and sanitation
(see Box V.1).
45 See Chapter VI below for a discussion of other issues related to Afro-descendants that these data cannot address.
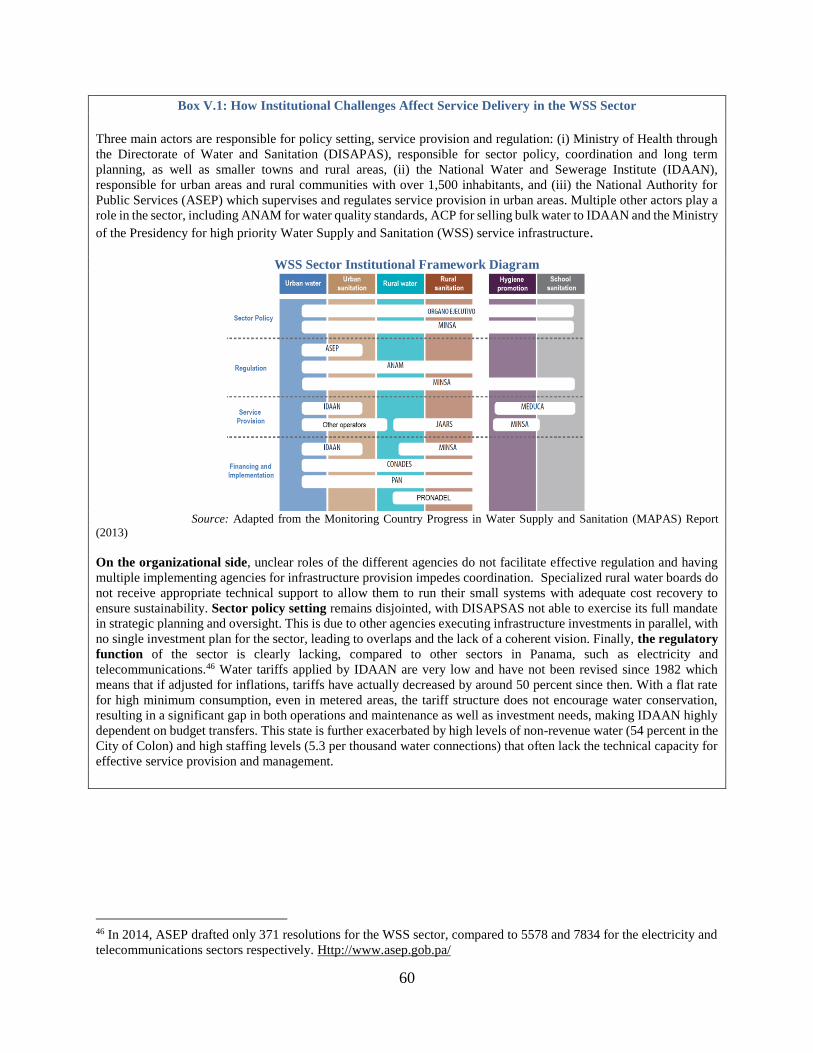
60
Box V.1: How Institutional Challenges Affect Service Delivery in the WSS Sector
Three main actors are responsible for policy setting, service provision and regulation: (i) Ministry of Health through
the Directorate of Water and Sanitation (DISAPAS), responsible for sector policy, coordination and long term
planning, as well as smaller towns and rural areas, (ii) the National Water and Sewerage Institute (IDAAN),
responsible for urban areas and rural communities with over 1,500 inhabitants, and (iii) the National Authority for
Public Services (ASEP) which supervises and regulates service provision in urban areas. Multiple other actors play a
role in the sector, including ANAM for water quality standards, ACP for selling bulk water to IDAAN and the Ministry
of the Presidency for high priority Water Supply and Sanitation (WSS) service infrastructure.
WSS Sector Institutional Framework Diagram
Source: Adapted from the Monitoring Country Progress in Water Supply and Sanitation (MAPAS) Report
(2013)
On the organizational side, unclear roles of the different agencies do not facilitate effective regulation and having
multiple implementing agencies for infrastructure provision impedes coordination. Specialized rural water boards do
not receive appropriate technical support to allow them to run their small systems with adequate cost recovery to
ensure sustainability. Sector policy setting remains disjointed, with DISAPSAS not able to exercise its full mandate
in strategic planning and oversight. This is due to other agencies executing infrastructure investments in parallel, with
no single investment plan for the sector, leading to overlaps and the lack of a coherent vision. Finally, the regulatory
function of the sector is clearly lacking, compared to other sectors in Panama, such as electricity and
telecommunications.46 Water tariffs applied by IDAAN are very low and have not been revised since 1982 which
means that if adjusted for inflations, tariffs have actually decreased by around 50 percent since then. With a flat rate
for high minimum consumption, even in metered areas, the tariff structure does not encourage water conservation,
resulting in a significant gap in both operations and maintenance as well as investment needs, making IDAAN highly
dependent on budget transfers. This state is further exacerbated by high levels of non-revenue water (54 percent in the
City of Colon) and high staffing levels (5.3 per thousand water connections) that often lack the technical capacity for
effective service provision and management.
46 In 2014, ASEP drafted only 371 resolutions for the WSS sector, compared to 5578 and 7834 for the electricity and
telecommunications sectors respectively. Http://www.asep.gob.pa/

61
Figure V.14: Change in Access to Piped Water in the
Dwelling, 2000-2010
Figure V.15: Change in Access to Sewage
Connection in the Dwelling, 2000-2010
Source: Authors’ calculations based on Panama 2000 and 2010 Population and Housing Censuses
132. There is a striking correlation between living in a comarca and having little or no
access to water, sanitation or even electricity. Figure V.18 shows this for running water in the
dwelling, with the only exception being Guna Yala. In part, this reflects the rural nature of the
comarcas and the relatively dispersed populations that live there. However, other rural areas have
better services: in 2008, a child in a comarca had a 35 percent probability of having access to
electricity compared to an 81 percent probability of an average rural child having electricity, while
for sewerage connections, the numbers were 10 percent and 35 percent47. In short, the low
coverage-comarca link is strong. Interestingly, the other ethnic minority in the country, the Afro-
descendants, do not appear to be as constrained in terms of services, probably as they are more
likely to live in urban areas.
133. The disparities in access to services are reflected in the very different social outcomes
observed across the population. In 2013, life expectancy in the comarcas was estimated to be
between 7 and 9 years lower than in the rest of the country: 66.2 years in the comarca of Emberá
in 2007 (66.9 years in 2009), and 68 and 68.6 respectively in those two years in the comarca of
Ngäbe Buglé.48 In 2008, the last year when national data were available, malnutrition in the Ngäbe
Buglé comarca was almost six times higher than in urban areas49 and under five mortality was
almost twice the national average in 2012.50 At just under 45 percent, teenage pregnancy rates in
the Emberá comarca are almost three times the national average of 15 percent and similar to those
of Ethiopia.51 Bocas del Toro also shows poor health indicators and high drop-out rates. The
burden of related diarrheal illness in children falls disproportionately on rural and, especially,
indigenous households and is estimated to cause 130 premature deaths and 1 million cases of
diarrhea in children under five each year. In addition, fuel wood burning in rural indigenous
households is the primary culprit for acute respiratory illnesses, with an estimated economic cost
of 0.2 percent of GDP. Finally, children in comarcas are more likely to drop out of school than
either their rural or urban counterparts: at age 18, only 39 percent of children in the comarcas are
in school compared to 47 percent in rural areas and 69 percent in urban ones.
47 World Bank, 2011a. 48 PAHO, 2013. 49 World Bank, 2012. 50 WDI and WB Panama Results Story Brief. 51 Population and Housing Census 2010 and WDI.
0
20
40
60
80
100
Pe
rce
nt
of
Ind
ivid
ual
s
Water 2000 Water 2010
0
20
40
60
80
100
Pe
rce
nt
of
Ind
ivid
ual
s
Sanitation 2000 Sanitation 2010

62
Figure V.16: Access to Running Water in the Dwelling by Concentrations of Indigenous Peoples
Source: Authors’ calculations based on the Population and Housing Census of Panama 2010.
DRIVERS OF POVERTY REDUCTION
134. The positive effects of economic growth on poverty reduction came through a
combination of increased labor income and a strong program of public transfers (Figure V.17
and Figure V.18). Sources of income that mattered for poverty reduction varied across the country
and by type of poverty. Labor income was the key driver of overall poverty reduction in urban
areas and the comarcas. In contrast, government transfers played the biggest role in poverty
reduction in rural areas. For extreme poverty reduction, labor income was only important in urban
areas: in rural areas and the comarcas, labor income changes would have increased poverty in the
absence of government transfers.

63
Figure V.17: Contribution of Different Income
Sources to Changes in Overall Poverty, 2007-2012
Figure V.18: Contribution of Different Income
Sources to Changes in Extreme Poverty, 2007-2012
Source: Authors’ calculations based on the EML, 2007-2012.
Note: Other incomes include imputed rent, private scholarships and other sources not included in existing categories.
Labor Income
135. The differential effect of labor income on poverty reduction is due both to the
geographic distribution of job growth and the quality of those jobs. The patterns of economic
growth are seen both in the number and types of jobs that have been created in the past ten years.
As described in Chapter III above, job growth in Panama has been substantial in recent years.
However, this has benefited different regions disproportionately. Census data from 2000 and
201052 show that the bulk of these new jobs have been in the Province of Panama (Figure V.19).
Nonetheless, the comarca Emberá has seen the sharpest job growth, up 58 percent compared to 43
percent in Panama (and 49 percent in next fastest growth province, Darien). In contrast to the
growth in jobs in the comarca Emberá, the comarca Ngäbe Buglé saw a net loss of jobs while
Guna Yala saw an increase of only 17 percent.
136. The quality of the jobs created also differs by region of the country (Figure V.20). The
areas with the lowest poverty reduction, the comarcas, were largely those with low net job growth.
In the comarca Emberá, where job growth was strikingly high, the majority of these jobs were in
agriculture, typically a low productivity sector in Panama. In fact, almost half of the new jobs
generated in the comarca Emberá required only a primary education or less. In contrast, for Coclé,
Herrera and Los Santos, the provinces with the greatest poverty reduction between 2007 and 2012,
job growth was much higher (ranging from 26 to 41 percent) and most jobs created in these
provinces were those that required either completed secondary schooling or tertiary studies: 84
percent in Herrarra, 93 percent in Los Santos and 73 percent in Coclé.
52 The Census data are less up to date than the Encuesta del Mercado Laboral, but have the advantage of allowing the
analysis to be done for a longer time period and to be done for the three comarcas separately.
-16-14-12-10
-8-6-4-202468
10
National Urban Rural ComarcaPe
rce
nta
ge p
oin
ts c
han
ge in
Ove
rall
Po
vert
y
Capital Goverment Transfers
Labor Other
-16-14-12-10
-8-6-4-202468
10
National Urban Rural ComarcaPe
rce
nta
ge p
oin
t ch
ange
in e
xtre
me
p
ove
rty
Capital Goverment Transfers
Labor Other
Pension Private Transfers

64
Figure V.19: Net Number of Jobs Created by
Geographic Area, 2000 to 2010
Figure V.20: Net Number of New Jobs by Education Level
and Geographic Area, 2000 to 2010
Source: Authors’ calculations based on the Population
and Housing Census of Panama 2000 and 2010.
Source: Authors’ calculations based on the Population and Housing
Census of Panama 2000 and 2010.
Note: the Province of Panama is omitted due to scale issues.
137. The net result is continued low levels of income diversification among the indigenous
populations in the comarcas. Despite a decline, agriculture still provides two-thirds of labor
income in the comarcas compared to only 44 percent in other rural areas, a dependence that affects
welfare gains. Agriculture is a sector that is shedding jobs and represents a small share of GDP
and, moreover, agriculture productivity53 is neither growing nor is it even as high as Latin
American averages. Why agriculture has lagged behind is unclear. Given that returns to other
sectors in Panama are higher, there is probably underinvestment in agriculture. This reliance on
agriculture is also a result of the populations in the comarcas being physically distant from the
growth corridors of the country and lacking other skills, which may act as a further barrier to
obtaining jobs in other sectors.
138. Internal migration is linked to the uneven growth of jobs in Panama and migration
leads to greater income diversification.54 The sector of employment among migrants is largely
determined by destination, not ethnicity (Figure V.21). Between 18 and 25 percent of migrants
who migrated to the Province of Panama worked in commerce, regardless of ethnicity. However,
working in hotels, restaurants and private households was more common among indigenous
migrants, who have lower educational attainment than the other two groups. Construction work is
also under-represented among indigenous migrants raising questions about barriers to entry. Those
among the indigenous who migrate outside of the Province of Panama are more likely to work in
agriculture: the sector accounts for more than half of migrant employment outside of the comarcas
and the Province of Panama.
53 Productivity here is defined as total GDP of the sector divided by number of jobs in the sector. 54 Growth can create the incentives for migration but, at the same time, migration can create a labor pool that can
facilitate growth. Given the data limitations, no attempt is made here to determine causality. The self-selection
discussed above could also be linked to employment diversification.
0
200000
400000
600000
800000
1000000
1200000
1400000
1600000
1800000
2000000
2000 2010
Veraguas
Panamá
Los Santos
Herrera
Darién
Comarca Ngobe Bugle
Comarca Emberá
Comarca de Kuna Yala
Colón
Coclé
Chíriqui
Bocas del Toro
-5,000
0
5,000
10,000
15,000
20,000
25,000
30,000
Prim or less Inc. Sec. Comp. Sec. Any Tertiary

65
Figure V.21: Sector of Employment in 2010, Migrants by Ethnicity and Destination
(percent)
Source: Authors’ calculations based on 2010 Population and Housing Census. For population 15 and
older.
139. Overall, women have benefited from the growing job market.55 The rate of growth of
jobs for women has outpaced that for men; 25.6 percent compared to 15.4 percent respectively
between 2007 and 2012.56 Female labor force participation rose five percentage points between
2000 and 2012 to reach 53 percent. Unemployment rates for women fell dramatically as well;
falling from 18 to five percent in five years between 2007 and 2012 with the 2012 rate just one
percentage point higher than that of men. The quality of jobs for women also improved; in 2000
59 percent of all jobs held by women required complete secondary education or higher, by 2010
this had risen to 69 percent. The share of male jobs requiring these levels of education was just 45
percent in 2010.57 Female employment in the informal sector remained lower than men (27 percent
compared to 31 percent respectively) although men are catching up to women on this indicator.
The gender income gap in Panama was the lowest in Latin America in 2010 at 0.90. However, of
concern, are the continued occupational segregation of jobs and relatively low labor force
participation rates of women; the LAC average is five percentage points higher than that of
Panama.
Public Transfers
140. Government spending has played a significant role in reducing extreme poverty and
overall poverty in rural areas. Overall spending in the social sectors is similar to that of
Panama’s neighbors: 13.3 percent in Panama compared to 13.7 percent in Central America. A series of programs and benefits have been introduced in the past few years. Red de
Oportunidades, the conditional cash transfer program begun in 2003, is the largest. The program
55 Unless otherwise mentioned, this section on labor markets and women is based on World Bank, 2014d. 56 Favaro, 2014. 57 The data on quality of jobs (education and formality) are from the 2000 and 2010 Population and Housing Census.
0%
20%
40%
60%
80%
100%
Other IP AD Elsewhere Comarca High IP Elsewhere High AD Elsewhere
Panama Other IP AD
Primary Construction Commerce Hotels and restaurants Transportation
Real Estate Public Admin/Defense Education Private households Other sectors

66
consists of four components: (i) conditional cash transfers to beneficiaries contingent on
enrollment of children in school and the use of preventative health care services; (ii) provision of
the health and education services required by beneficiaries; (iii) support to families in accessing
such services; and (iv) infrastructure improvement. The cash transfer is designed to mitigate
poverty today and, by increasing human capital, poverty in the future. The 100 a los 70 non-
contributory pension program provides a pension to all elderly persons with no other pension. In
2014, this was modified to provide US$120 to all persons 65 and older. Finally, the Beca
Universal, or universal education benefit, provides cash transfers to family to encourage school
attendance. The benefit is given contingent on a student attending school for a given number of
days and maintaining a minimum grade level. The program started as an effort to lower secondary
school drop-out rates but has since been expanded to primary school as well.
141. The impact of the Red de Oportunidades has been positive. A quantitative analysis of
the program58 found important effects. For rural children ages 12-15, the program led to a 10.2
percentage point increase in school enrollment and a similar (10.1) decrease in child labor. In the
comarcas, the increase in school enrollment was a bit lower at 7.9 percentage points, but the
decrease in child labor greater (15.8 percentage points). The health benefits were not as large
across the board but improved in some areas: incidence of Papanicolau test rose almost 12 and 15
points among rural and indigenous women respectively. A qualitative analysis of the program59
highlighted the overall positive perceptions of the program and identified some areas for
improvement. Beneficiaries noted not just the economic benefit and access to services but also an
increased sense of social inclusion and female empowerment. Children’s access to schooling has
improved. In terms of health, awareness regarding preventative reproductive health increased. The
report found that the program has had the unexpected positive results of strengthening social
capital and spawning initiatives for group savings and microenterprises. Highlighting this,
beneficiaries suggested the introduction of stages into the program with productive
entrepreneurship as a final stage.
142. The benefits of Red de Oportunidades have been limited by a lack of differential
services for the various ethnic groups in the country. The qualitative study emphasizes the need
for adaptation of service provision to the environment. There continue to be issues in access and
educational quality, as well as the need for multicultural bilingual education in indigenous areas.
Program beneficiaries also expressed the need for culturally appropriate health services and health
workers with specific skills to work in different cultural contexts. The program has had less success
in affecting malnutrition as well. There have also been concerns raised about implementation, with
cultural sensitivities not being addressed and inappropriate conditions being applied.
143. The non-contributory pension program has the potential to lower poverty among the
elderly although it has not yet completely delivered on its promise. While no formal evaluation
of the program exists, simulations of first order effects using pre-program data (2009) show that a
universal assignment of 100 balboas to all people 70 and older could cause poverty among the
older population to be more than halved and extreme poverty to almost disappear.60 The
differences in overall poverty reduction for men and women is fairly similar, although for extreme
58 Arráiz and Rozo, 2011. 59 Waters, 2009. 60 Cardoza and Scott, 2013.

67
poverty, the benefit would lower poverty among men less, suggesting that elderly men suffer from
more severe poverty than women. By 2013, however, only 30 percent of all elderly were enrolled
in the program, thus reducing its impact on poverty. Nonetheless, it is clear that the program is
benefiting the poor elderly (Figure V.24). The expansion of the program to 65 and older and the
increase in the benefit will also have an important poverty reduction effect among the older
population. If the program is to have this effect, however, issues affecting program take-up will
need to be understood and addressed.
144. The effects of the universal scholarship, Beca Universal, also have not been evaluated.
The expansion of the program from secondary to all students has made it more progressive. It is
likely that the program has helped lower poverty in addition to increasing enrollment and retention
rates. Simulations of its effects on poverty using data from before the program show a strong effect
in indigenous areas. More recent, anecdotal evidence from the Ministry of Education suggests that
for the Ngäbe Buglé, the benefit has reduced the seasonal migration around the coffee harvest,
allowing children to remain in school.
145. Despite the significant impact of public transfers on extreme poverty, there are still
challenges related to both targeting and the take-up of programs. As noted previously, less
than half of those eligible for the non-contributory pension actually received it in 2012 and lack of
cultural adaptation may be affecting the take-up of Red de Oportunidades. Additionally, 18 percent
of the population in the bottom quintile receives no social assistance of any sort. Nor does all
spending benefit the poor (Figure V.25). There are costly leakages with 31 percent of spending of
the top seven social programs going to the top 60 percent of the population. This leakage of benefits
to the richer end of the distribution is also mirrored in some of the Government’s subsidy programs.
Cooking gas subsidies, for example, represented US$82 million in 2010 dollars and increased
government spending by 2.1 percent, yet the subsidy barely reaches the poorest: three in four
extremely poor cook with wood.
Figure V.22: Contributory and Non-contributory
Pension Coverage, 2007 and 2012
Figure V.23: Distribution of Benefits (Leakage),
2012
Source: SSEIR, World Bank, 2014. Source: SSEIR, World Bank, 2014.
45.1
66.1 68.872.4
76.5
42.7
67.7
0.0
10.0
20.0
30.0
40.0
50.0
60.0
70.0
80.0
90.0
20
07
20
12
20
07
20
12
20
07
20
12
20
07
20
12
20
07
20
12
20
07
20
12
Q1 Q2 Q3 Q4 Q5 Total
% e
lde
rly
Solo Jubilado o Pensionado Solo 100-70
Pension, jubilacion y 100-70
0%10%20%30%40%50%60%70%80%90%
100%
% o
f b
en
efi
ts
Q1 Q2 Q3 Q4 Q5

68
VI. Prioritization Linked to Inclusion
BENCHMARKING
146. The strong economic growth in recent years has been inclusive, yet it had different
effects across regions and populations with some benefiting significantly less. On the positive
side, incomes of all groups rose, with those at the lower end and the middle of the income
distribution increasing the most. Economic growth also translated into the expansion of services
and access to education and health. Poverty fell and social outcomes improved. Overall, Panama’s
poverty rate places it ahead of most of its peers (Figure VI.1). However, the analysis in the previous
chapter has shown that even in an environment of strong growth pre-existing income and
opportunity gaps in the country have persisted. Moreover, it is unclear that the present growth
model will be adequate to eradicate extreme poverty in the near future.
Figure VI.1: Panama’s Poverty Rate Compared to Peers
(US$ 4 per day poverty line)
Source: WBI.
Within Panama
147. Comparing different population groups reveals a continuum of states of poverty even
within the groups of poor and extremely poor Panamanians. Using household survey data,
comparisons of income poverty, human capital and household characteristics were made for the
populations living in urban and rural areas and the comarcas. The results of the comparison are
clear (see Figures V.12 and V.13 in the previous chapter). Among the poor and extremely poor in
Panama, the groups with the least human capital, lowest incomes and greatest dependence on
social assistance are the indigenous population living in the comarcas. Using the census data,
comparisons were made by ethnic groups: indigenous people living in comarcas, indigenous
people living outside of the comarcas, Afro-descendants and all others in the country. The census
does not provide a comparable measure of income poverty but does have information on human
0
5
10
15
20
25
30
35
40
45
Panama Structural CentralAmerica
LAC Uppermiddleincome
Panama Structural
Central America LAC
Upper middle income

69
capital, income, and demographic and household characteristics linked to welfare. Again the
results of the comparison (see Table V.2 in the previous chapter) show a clear welfare hierarchy:
among the poor and the extremely poor, it is the indigenous living in the comarcas that have the
lowest levels of income, human capital and show the highest dependency ratios.
148. High economic growth benefited
some groups less, particularly the
indigenous population. Overall poverty
reduction in the past five years has been on the
order of 34 percent (28 percent for extreme
poverty). The comarcas have also
experienced a lower level of poverty
reduction than the rest of the country. Urban
areas saw extreme poverty fall 40 percent
between 2007 and 2012. Extreme poverty in
rural areas only fell by 15 percent, less but still
a respectable reduction. In contrast, the
comarcas only experienced a 4 percent
decline in extreme poverty in the same period.
This means that share of the extreme poor by
area is even more disproportionate to the
area’s population share than before. Urban areas represent 75 percent of the national population,
but only 20 percent of the extremely poor live in urban areas. The comarcas, however, where only
6 percent of the population live, concentrate 42 percent of the extreme poor (Figure VI.2). This
concentration has increased markedly in the 2007-2012 period: up from 24 percent to 42 percent
(see Figure V.8). This pattern also applies to overall poverty.
Across Latin America
149. In addition to exhibiting the most severe poverty in Panama, the indigenous peoples
living in comarcas in Panama fare poorly compared to other indigenous people in Latin
America in both absolute and relative terms (Figure VI.3). The substantial gaps between
indigenous and non-indigenous populations within Panama in terms of services and human capital
are mirrored in the gaps between the Indigenous Peoples of Panama and others Indigenous Peoples
in the region. Additionally, other countries in the region with large indigenous populations have
seen economic growth more effectively moving these groups out of poverty. In Peru, Ecuador and
Bolivia, the gap in poverty rate changes between the indigenous population and the overall
population is smaller than in Panama.
150. The differences in between Panama’s Indigenous Peoples’ access to services and those
in other LAC countries are striking. Among 12 Latin American countries61, Panama has both
the lowest level of electricity coverage among the indigenous population (40 percent) and the
61
This comparison of the indigenous populations in Panama with those in the rest of Latin America is based on “Los
Pueblos Indígenas en América Latina: Balance político, económico y social al término del Segundo Decenio
Internacional de los Pueblos Indígenas en el Mundo” Washington, D.C., (World Bank, 2014c)) and compares Panama
to Brazil, Bolivia, Chile, Colombia, Costa Rica, Ecuador, El Salvador, Mexico, Nicaragua, Peru and Venezuela.
Figure VI.2: Share of Population and Extremely Poor
by Area, 2012
Source: Authors’ calculations based on EML, 2012.
0
10
20
30
40
50
60
70
80
Urban Rural Comarca
Population Share Share of Extremely Poor
Share of All Poor
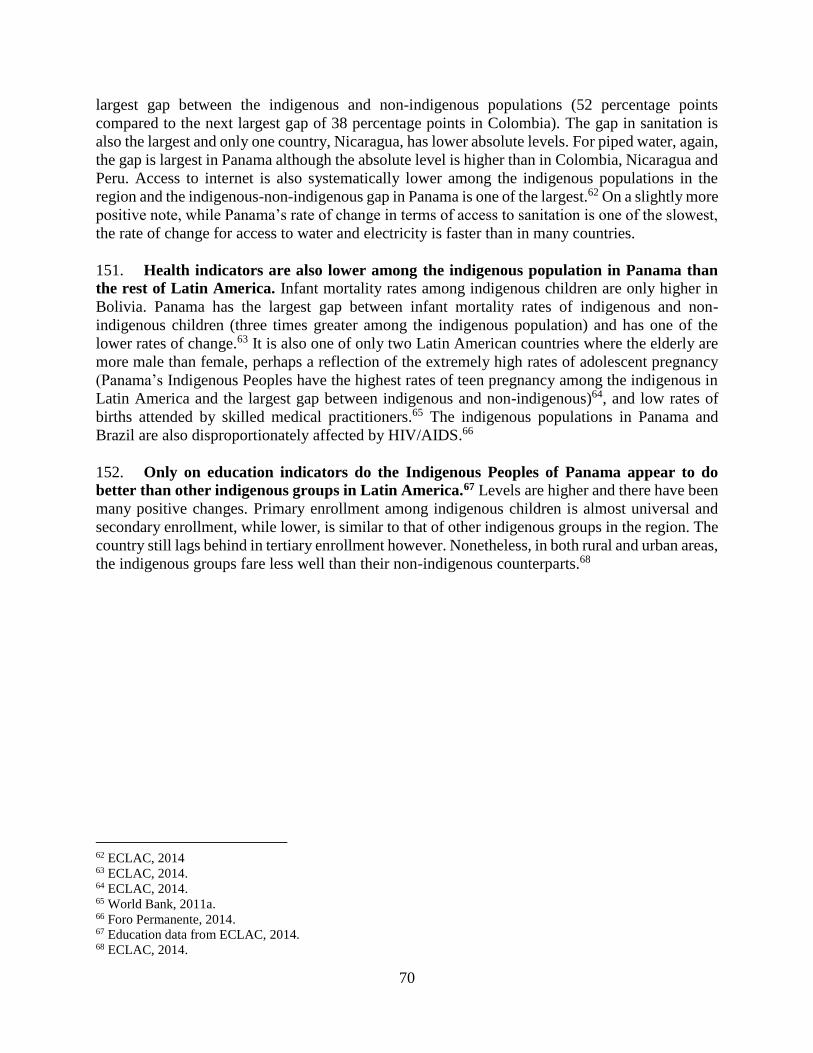
70
largest gap between the indigenous and non-indigenous populations (52 percentage points
compared to the next largest gap of 38 percentage points in Colombia). The gap in sanitation is
also the largest and only one country, Nicaragua, has lower absolute levels. For piped water, again,
the gap is largest in Panama although the absolute level is higher than in Colombia, Nicaragua and
Peru. Access to internet is also systematically lower among the indigenous populations in the
region and the indigenous-non-indigenous gap in Panama is one of the largest.62 On a slightly more
positive note, while Panama’s rate of change in terms of access to sanitation is one of the slowest,
the rate of change for access to water and electricity is faster than in many countries.
151. Health indicators are also lower among the indigenous population in Panama than
the rest of Latin America. Infant mortality rates among indigenous children are only higher in
Bolivia. Panama has the largest gap between infant mortality rates of indigenous and non-
indigenous children (three times greater among the indigenous population) and has one of the
lower rates of change.63 It is also one of only two Latin American countries where the elderly are
more male than female, perhaps a reflection of the extremely high rates of adolescent pregnancy
(Panama’s Indigenous Peoples have the highest rates of teen pregnancy among the indigenous in
Latin America and the largest gap between indigenous and non-indigenous)64, and low rates of
births attended by skilled medical practitioners.65 The indigenous populations in Panama and
Brazil are also disproportionately affected by HIV/AIDS.66
152. Only on education indicators do the Indigenous Peoples of Panama appear to do
better than other indigenous groups in Latin America.67 Levels are higher and there have been
many positive changes. Primary enrollment among indigenous children is almost universal and
secondary enrollment, while lower, is similar to that of other indigenous groups in the region. The
country still lags behind in tertiary enrollment however. Nonetheless, in both rural and urban areas,
the indigenous groups fare less well than their non-indigenous counterparts.68
62 ECLAC, 2014 63 ECLAC, 2014. 64 ECLAC, 2014. 65 World Bank, 2011a. 66 Foro Permanente, 2014. 67 Education data from ECLAC, 2014. 68 ECLAC, 2014.

71
Figure VI.3: Access to Basic Services by Ethnicity
(a) Electricity
(b) Sanitation
(c) Water
Source: World Bank, 2014c.
0
10
20
30
40
50
60
70
80
90
100
IP
Non-IP
0
10
20
30
40
50
60
70
80
90
100
IP
Non-IP
0
10
20
30
40
50
60
70
80
90
100
IP
Non-IP

72
PRIORITY AREA
153. The increasing concentration of poverty in indigenous areas suggests that special
attention is needed for these areas and this population group. The Indigenous Peoples of
Panama have significant social capital, with well-developed and functioning community and
governance structures. Their lands represent significant wealth and bio-diversity. However, many
of the Indigenous Peoples in Panama suffer from chronic poverty and they have multiple
deprivations: extremely low incomes, low access to basic services and infrastructure, lower human
capital, poorer health outcomes, fewer labor options and de facto land tenure insecurity. Many of
these problems are long-term and have been less responsive to economic growth and social
program impacts than expected.
154. The complexities of addressing the twin goals in the comarcas require attention to
issues of culturally appropriate economic opportunity, social assistance, infrastructure
provision and the enforcement of legal rights. The concentration of economic growth in specific
sectors and geographic areas outside of the comarcas, along with the limited shifts in employment
and earnings within the comarcas, highlight the constraints of the present growth model and
domestic markets. The challenges faced by the social protection system in the comarcas also merit
further attention. Spending levels are at adequate levels yet outcomes are muted. Education
enrollments have increased, in part due to social assistance programs, but less in the comarcas than
in other rural areas and the benefits in health are more limited. The impact on poverty reduction,
in the short term, is constrained due to both limits in coverage and benefits. The lack of services
continues to be a constraint, particularly water and sanitation. Low population density and
dispersed populations are often blamed for lack of service provision. While this may be true in
part, the fact that Los Santos, one of the three provinces with the highest rate of poverty reduction
in the past six years, also has a population density below that of the poorest comarca, suggests that
other barriers to service provision are at play than need to be addressed. Additionally, the lack of
culturally appropriate models for development has reduced the positive impact of government
programs and policies. Differences in community organization, communal property, inter alia,
need to be taken into account. Furthermore, understanding the tradeoffs the indigenous peoples
are, and are not, willing to make among different goals is needed.
155. While solving the problems of extreme poverty in Panama will not be done only
focusing on the Indigenous Peoples living within the comarcas, this appears to be a good
starting point. The fact that the comarcas are home to 42 of the extremely poor in the country
explains the focus on those areas, as does the fact that poverty is worse in the comarcas than in the
rest of the country. As important, many of the issues that affect livelihoods in the comarcas also
affect those of their rural neighbors. Some investments, such as those in basic infrastructure in
roads, electrification and sewage systems would benefit both groups rural non-indigenous and rural
indigenous populations. In contrast, investing in social services such as health and education would
require special attention to the comarcas to adapt services to the social and cultural norms of the
Indigenous Peoples. In short, while Panama’s agenda on eradicating extreme poverty is much
broader than just the comarcas, the levels and severity of poverty there and the slowness of positive
change suggest the importance of prioritizing the comarcas.

73
Filling Knowledge Gaps
While some evidence suggests that Afro-descendants in Panama are better off than Indigenous Peoples, they also
suffer from deprivations. The knowledge gap around Afro-descendants, however, limits what can be concluded in
this report. For those indicators of well-being that exist, Afro-descendants are, on average, better off than the
Indigenous Peoples. However, they also suffer from multiple deprivations. A 2013 qualitative study highlights the
fact that both Afro-Panamanians and other Panamanians perceive racial discrimination as a factor that creates
obstacles to Afro-descendants’ economic, educational, social and labor opportunities as well as limits access to
basic services vis-à-vis the rest of the Panamanian population. Furthermore, Afro-Panamanians perceive that there
is negative stereotyping in the media towards the Afro-descendant community and Afro-Panamanian women feel
they are particularly discriminated against, especially in the labor force. A further report argues that Afro-
descendant populations live in areas with poorer infrastructure, have lower access to education, health care,
employment and political participation. 69 An important task going forward will be to address both the data gaps in
the country as well as pull together what little data that exist to attempt to better understand the constraints and
opportunities of this group. It is hoped that the Consejo de la Etnia Negra (Council of the Black Ethnicity)70 will
be a source for further consultation and data
IDENTIFIED OPPORTUNITIES
156. The National Integrated Development Plan of the Indigenous Peoples of Panama
(Plan (DIPORP) for its Spanish initials) provides a new opportunity to affect welfare among
Indigenous Peoples in Panama. This is due to the fact that is represents a consensus, is focused
on the broad range of issues that affect development and looks to the long term as well as the short
and medium terms.71 The Plan is the result of the two year-effort by the National Indigenous
Development Working Group (Mesa nacional de desarrollo indígena). The Working Group itself
was established in the aftermath of a period of conflict between the indigenous communities and
the national Government around land rights, inter alia, and was charged with creating a national
development plan that would become national policy and be approved into law.72 (See Box VI.1
for a summary of the specific areas of the Plan DIPORP).
69 UNHR, 2013 70 Created in 2007 under the Presidential decree, known as Ley 116, the council, which was to sit within the
Ministerio de Gobierno, was designed to more proactively mainstream the needs and aspirations of Afro-
Panamanians into government programming, culturally appropriate educational services and anti-discrimination
policies. 71 The facts around the Plan DIPORP come from the Plan itself (Mesa 2013). 72 The Working Groups had four areas of work: (i) elaborate the Plan DIPORP, (ii) create a permanent space for
consultation between the Government and the Indigenous Peoples, (iii) improve the capability of the different actors
to implement the consultation process and uphold international laws and agreements, and (iv) disseminate to all
parties, the development plans, agreement and results in the appropriate language.

74
Box VI. 2: Main Areas of Action for the Plan DIPORP
Governance &
Territories
• Strengthen traditional structures towards a plurinational state
• Strengthen the leadership & capacity of traditional authorities
• Strengthen territorial governance & guarantee/strengthen land tenure security
• Adopt & implement international legal instruments (ILO 169) & establish
safeguards
• Implement consultation & participation mechanisms for all projects and decisions
that affect IP territories
• Empower IP women and youth & their participation and leadership
Economics
• Develop a “green” and productive culture focused on environmental protection and
conservation
• Promote entrepreneurial activities and development models owned by the territories
• Strengthen traditional productive systems and develop new crops and food
sovereignty
• Improve existing economic activities & structures
• Develop sustainable production models for territorial economic development
• Promote participation of women and youth in productive activities
Education, Culture
and Health
• Revise & implement Law 88 on Intercultural Bilingual Education
• Improve education quality and efficiency, focus on innovation and competitiveness,
technology and communication
• Increase and improve higher education for youth and women
• Revitalize and promote cultural development
• Improve infrastructure and integrated health service, preventative medicine, access
to clean water, and sanitation
• Increase the number of health personnel and improve coordination with authorities
• Strengthen, through the traditional authorities, traditional medicine through public
resources
Housing,
Infrastructure &
Energy
• Improve housing and communal spaces using traditional practices
• Establish a program of special attention for urban indigenous people & their housing
• Improve and expand existing road, WSS, energy, communication infra in territories
• Establish renewable energy programs Source: Plan DIPORP, 2014
157. The Plan DIPORP represents a consensus among the 12 indigenous congresses. For the
first time, there is one document that has been agreed upon by all the Indigenous Peoples in the
country and represents a unified vision of the goals and priorities of these groups. The lengthy
process undertaken by the Working Group to reach this consensus was carefully designed to
respect the traditions and customs of each group. During the first phase of the Plan DIPORP’s
development (March-July 2013), a total of 94 consultation meetings among the 12 indigenous
congresses were carried out by the traditional authorities of each group. The second phase, that of
drafting the Plan itself, was carried out by a committee of indigenous and government
representatives and facilitated by the United Nations Development Programme (UNDP)
representatives. The proposed Plan was submitted to the Working Group for approval on October
1, 2013 and then underwent a validation process (phase three) across the country and among all
the indigenous groups and was approved in December 2013. The fourth phase, that of approval by
the Government and the National Assembly, was launched prior to the elections but, due to the
change in government, has had to be re-started and a new law making the Working Group
permanent (and validating the Plan DIPORP) is expected to be submitted to the National Assembly
in the new year for discussion and debate.

75
158. The broadness of the Plan DIPORP is another factor that enhances its usefulness as
a guide for improving shared prosperity and eradicating extreme poverty among indigenous
populations. Unlike many related exercises, the Plan is not limited simply to legal issues but
instead addresses the entire gamut of constraints and opportunities facing the Indigenous Peoples.
The Plan is based on the three thematic pillars of economic development, social development and
legal rights and its concrete goals and objectives across these areas provide important direction for
how the national Government, civil society and the Indigenous Peoples’ congresses can work
together to address poverty eradication and promote shared prosperity.
159. Finally, the Plan DIPORP has a long-term focus. The Plan covers a 15-year planning
horizon. This longer term focus provides an explicit opportunity for evaluation and adjustments to
the Plan throughout implementation and allows for investment in both physical and human capital.
Much of the Plan DIPORP focuses on training and capacity building, aimed at both the indigenous
communities and public servants in an attempt to build new mechanisms of service provision and
take-up. The Plan DIPORP also addresses short term concerns but it is the longer term focus that
provides the greatest opportunity for Panama to affect the welfare of the indigenous populations
and learn in the process.
160. Using the Plan DIPORP as a foundation will ensure that the cultural identity and the
specific characteristics of the Indigenous Peoples are taken into account in the determination
of the best combination of social assistance and economic development. Local knowledge,
practices, systems and experience are critical components to determining the best combination of
social assistance and economic development that can lead to long term success. The Plan DIPORP
highlights how many of the barriers to service access and use are due to poor design elements that
fail to embrace culturally specific practices and systems, and failure to effectively include the
Indigenous Peoples in the design and delivery of programs - all elements critical for ownership
and uptake. Addressing the cultural and contextual issues may help to make public investment
more effective: in the 2009-2012 period, overall budget execution was just under 70 percent
although the majority of the sectors saw much smaller percentages (housing 26 percent, agriculture
30 percent, for example).73 It is not clear whether the low execution of public investment is due to
inappropriate investments, low take-up or low capacity of executing agencies.
161. The prioritization process for identifying opportunities to affect inclusiveness and the
welfare of the indigenous populations is based on the Plan DIPORP and consultations with
the country team and stakeholders in Panama. The critical opportunities that have been
identified reflect the three thematic pillars of the Plan: economic development, social development
and legal issues.
162. Opportunities have been identified around specific types of economic development,
governance and the provision of health and education services with the emphasis being on
culturally appropriate interventions. In terms of economic activities, the focus would be on
economic development with identity, namely promoting activities that generate income while
enhancing existing natural resources. Increasing the quality and access of health and education
services in indigenous communities requires that the service content and delivery mechanisms are
adapted to be culturally pertinent. Finally, the focus on governance is to take advantage of the
73 MEF, 2012

76
opportunity to enhance the Indigenous Peoples’ participation as Panamanian citizens while at the
same time recognizing their cultural uniqueness and diversity in aspirations and world view.
163. Realizing these economic growth opportunities will depend heavily on progress being
made on the priority areas identified in Chapter IV above. The comarcas lack basic
infrastructure that is needed for creating the foundations for economic growth. Focusing on
overcoming the present inability of the energy sector to supply power to the comarcas will
contribute to the development of new industries and job creation within the comarcas. In parallel,
the opportunities identified around institutions (regulations, transparency and effectiveness) will
be needed to ensure revenues from economic opportunities can be generated and effectively
managed for the benefit of the indigenous population while the land rights of the Indigenous
Peoples are protected. This is of particular importance if the mining sector is to grow in a socially
and environmentally appropriate manner. Finally, as described in the Plan DIPORP, education is
a major concern. To the extent that the system can be improved through modernizing the
curriculum and adapting the way in which service is provided both dropout and attainment levels
can be affected with subsequent effects on economic outcomes.
164. Addressing these issues has a direct effect on eradicating extreme poverty given that
such poverty is concentrated in the Indigenous Peoples. Evidence for successful interventions
in culturally appropriate economic development come from Norway, Canada, Peru, Australia and
Alaska. Costa Rica has implemented a program of Payments for Environmental Services of US$3
million per year to indigenous communities for ten years. Both this and the new anteproyecto de
ley to regulate Payments for Environmental Services, presented to the National Assembly in
August of 2014, could serve as a model for Panama. Evidence of successful improvements in
relationships between governments and the Indigenous Peoples’ governance structures can be
found in Canada, Brazil and Bolivia, again examples of how such work could be implemented in
Panama.
165. There is substantial political will around these opportunities. As discussed above, the
Plan DIPORP creates a platform on which the indigenous communities themselves, the national
Government and the private sector can build. Many of the proposed changes in service delivery
are already covered in law (Resuelto N° 4376 del 25 de agosto de 1999, Ministerio de Salud,
Medicina Tradicional, Gaceta Oficial N° 23,880, 7 de septiembre de 1999; Bilingual and
Intercultural education Law No. 88). And there are agreements in place to legislate around the Plan
DIPORP. Finally, the creation of a vice-ministry of Indigenous Affairs and the plan to transform
this into a Ministry both point to the political feasibility of actions around these identified
opportunities.

77
VII. Sustainability
166. How sustainable is Panama’s progress towards achieving the twin goals? The previous
sections of this document have described Panama’s progress towards the twin goals, the country’s
outstanding growth performance, and the overall inclusive nature of this growth so far. The current
section turns to the future, addressing the question of whether Panama can sustain this progress.
This question will be addressed from an economic, social, and environmental perspective,
followed by a reflection on priority areas from a sustainability point of view.
ECONOMIC SUSTAINABILITY
167. In the past, Panama has achieved progress mainly through fast economic growth, a
strategy that is viable for the short to medium term, albeit with a few qualifications. Given
the rapid growth of recent years, it is expected to moderate in the future. As pointed out in the
growth section however, the identified priority areas of energy, education, and public sector
institutions are likely to impact growth negatively in the future if they remain unaddressed.
Moreover, as pointed out in the inclusiveness section, growth may continue to stop short of
including the Indigenous Peoples of Panama, unless specific efforts are made to address their
situation and opportunities. In addition, compliance with international transparency standards,
continued efforts on macroeconomic stabilization policies, and the economic role of the Canal for
the country need to be carefully taken into account. This section discusses these three challenges.
168. The sustainability of Panama’s high reliance on foreign financing for its investment
program will depend on continued progress on compliance with international standards on
transparency. The country appeared on the blacklist by the Financial Action Task Force as a
“high-risk and non-cooperative jurisdiction” that did not support international efforts to fight
money laundering in 2000.74 In addition, Panama’s practices on tax information sharing caught
the attention of the OECD Global Forum resulting in a peer review process on the full and effective
exchange of information being initiated in 2009. Finally, Panama’s maritime registry also appeared
on the black list of the Paris Memorandum of Understanding. This international body, made up of
27 maritime administrations from Europe and North America, seeks to eliminate the operation of
sub-standard ships through a harmonized system of port State control. Panama’s open registry
allows for easy registration (often online), the ability to employ cheaper foreign labor, and
exemption from income taxes for foreign owners. Panama's registry is consistently beset by
allegations of corruption and the criticism of hiding the true identity of ship owners and the lax
enforcement of rules and regulations.
169. Panamanian authorities reacted to the inclusion into the money laundering black list
in 2000 by adopting legislation that allowed the country to progress to the so-called grey list.
In particular, Panama introduced new legislation to expand criminal offenses for money laundering
which was enough to remove the country from the blacklist in June 2001. The country is now
74 The Financial Action Task Force is an inter-governmental body established in 1989 by the Ministers of its Member
jurisdictions and currently includes 36 member countries. The objectives of the Task Force are to set standards and
promote effective implementation of legal, regulatory and operational measures for combating money laundering,
terrorist financing and other related threats to the integrity of the international financial system.

78
included on the so-called grey list of the Financial Action Task Force. This list names countries
that are in the process of improving compliance with international standards on global anti-money
laundering and combating the financing of terrorism. In the Latin American region, Argentina,
Cuba and Nicaragua also appear in this list. A recent report on observance of standards and codes
conducted by the IMF found that Panama's anti-money laundering framework was still not fully
in line with the Task Force’s recommendations. The country has ratified the main United Nations
Conventions on money laundering and has legal provisions in its Penal Code that are broadly in
line with the standards set by the Task Force. However, a number of significant deficiencies
remain, according to the report.75
170. In June 2014, the Government made a high-level political commitment to addressing
remaining deficiencies. The Government will work on implementing its action plan to address
these deficiencies, including by: (i) adequately criminalizing money laundering and terrorist
financing; (ii) establishing and implementing an adequate legal framework for freezing terrorist
assets; (iii) establishing effective measures for customer due diligence to enhance transparency;
(iv) establishing a fully operational and effectively functioning financial intelligence unit; (iv)
establishing suspicious transaction reporting requirements for all financial institutions and
designated non-financial businesses or professions; and (vi) ensuring effective mechanisms for
international co-operation.76 Progress in implementing this action plan and the passage of a new
anti-money laundering law would address the major deficiencies identified in the report on
observance of standards and codes and help to strengthen the status of Panama as an international
financial and business center.
171. In terms of compliance with international standards of tax transparency, Panama has
taken measures to move to the next phase of the Global Forum’s peer review process. Compliance with Global Forum’s standards involves demonstrating that national legislation and
bilateral/multilateral agreements on sharing of information for tax purposes meets the standards
onten different technical elements. In September 2009, the OECD Global Forum launched a formal
peer review process to monitor and review progress made towards full and effective exchange of
information, which consists of two phases: Phase 1 (review of legal and regulatory frameworks of
each country) and Phase 2 (assessment of the practical implementation of the “internationally
agreed standard” on tax transparency). Significant progress has been accomplished in these areas.
The Panamanian Government has successfully negotiated 19 Double International Taxation
Agreements based on the OECD’s Model Tax Convention on Income and on Capital, and 11 of
these are already in force. As a result of these agreements, the Government has adjusted its internal
legislation for the effective application of international tax agreements and to include the principles
of transparency and effective exchange of information for tax purposes. In order to achieve this,
the Government passed (i) Law 33-2010 to introduce transfer pricing rules, permanent
establishment and tax residency into Panama’s Fiscal Code; (ii) Resolution 088-DS/AL 2010 to
create the International Taxation Unit and the Tax Information Exchange Unit; (iii) Law 2 -2011
75 See IMF, “Panama: Report on Observance of Standards and Codes on the FATF Recommendations for Anti-Money
Laundering and Combating the Financing of Terrorism”, IMF Country Report 14/55, February 2014. 76 See http://www.fatf-gafi.org/topics/fatfgeneral/documents/plenary-outcomes-jun-2014.html. GAFISUD is a
regionally based inter-governmental organization that includes 12 countries from South America, Central America
and North America in order to combat money laundering and terrorist financing by means of a commitment to
continuous improvement of national policies in these areas and to the enhancement of different cooperation
mechanisms across its member countries.

79
to identify and apply the “Know your clients” procedures; and (iv) Law 47-2013 to immobilize
bearer shares through a custodial arrangement system.
172. In addition, Panama was able to reform its maritime registry to advance to the white
list of compliant countries. Since 2008, Panama has made enough progress in reforming its
maritime registry to advance to the white list of the Paris Memorandum of Understanding.
173. Macro stability remains a continuous task and requires a high degree of fiscal
prudence to be sustainable. Given that the Panama has given up monetary policy as a policy tool
and restraint the use of fiscal policy, the country has little room for discretionary fiscal policies.
Mindful of this, Panama is managing its fiscal balance following a fiscal rule, the social and fiscal
responsibility law that was introduced in 2002 and updated several times to adapt to realities such
as the 2008 global financial crisis. The fiscal rule mandates fiscal deficit ceilings and has helped
Panama to maintain fiscal prudence.
174. Yet additional budget flexibility would be welcomed to create room for
countercyclical policy. Almost 70 percent of the total expenditure in Panama is rigid. This is even
more binding in the context of low tax revenue collection, which averaged 10.2 percent of GDP in
the period from 2001 to 2013, compared to the already low 12.7 percent of GDP of the Central
American region. The requirement of prudent fiscal policy restrains the role of Government in
terms of public service provision to Panamanian citizens. Moreover, 50 percent of the non-tax
revenues come from the Panama Canal, and this makes the Government highly dependent of these
resources. Policy measures as the creation of a sovereign fund (Fondo de Ahorro de Panama) are
adequate but might be insufficient to provide fiscal resources for prolonged periods of down-turn
where revenues both from the Canal and from tax collection are dropping in the context of a
shrinking economy.
175. In addition to prudent fiscal policy, the country’s dollarization also calls for a
healthy banking sector. Lending practices in Panama need to be (and indeed have been) more
conservative than in countries that do have a lender of last resort and/or a deposit insurance
scheme, with greater liquidity reserves and a strict, ready-and-able-to-act-swiftly, supervisory
role on the Authorities. The Panamanian Superintendence of Banks has been playing a strong
role in this sense.
176. As an international financial center with extensive external linkages, the country is
exposed to external risks and reputational risks weigh heavy. Foreign assets of Panamanian
banks represent 39 percent of GDP, significantly more than the five largest economies of LAC
none of which exceed 5 percent. As a result, credit risks in foreign country debtors could have
significant impact on the balance sheet of Panamanian banks. Similarly, foreign liabilities of the
Panamanian banking system represent 95 percent of GDP which is more than four times larger
than Chile (21 percent) which has the highest percentage relative to GDP amongst the top five 5
Latin American economies. This implies that the Panamanian banking sector is highly exposed
to international interest rates
177. Finally, given the crucial role of the Panama Canal for the country’s economy, a close
look at the sustainability of Canal operations is warranted. In particular, competition to the

80
Canal requires constant adjustment to maintain market edge. Alternative shipping routes to the
Panama Canal have been a constant source of curiosity, as many attempts continue to be made to
find other options for global routes. On the eastern side, the recent project by Egypt to widen the
Suez Canal in parts of its length seeks to enlarge transit capacity and decrease waiting time from
18 to 11 hours for most ships. The 72 kilometer works are expected to be completed within one
year as per official Government statements.
178. Closer to home, several countries have played with the idea of a dry canal in Central
America; however this continues to be a commercially less competitive option. The recent
announcement by Panama’s northern neighbor Nicaragua of the initiation of a project to build the
Nicaragua Canal passing through Lake Managua could have significant impacts on the share of
trade going to Panama, once completed. The project, financed by the Hong Kong SAR, China
based HKND Group, is estimated to cost US$50 billion and will include some of the largest
earthworks in recent times to clear a 278 km passage way through Lake Managua, with significant
environmental and social impacts to be considered.
179. In the medium to long term, another less cited competition may be created by nature
as global warming melts the arctic cap. Its summer ice cover has already shrunk by more than
40 percent over the last few decades, raising the prospect that it may soon be possible to sail along
the Arctic sea routes with ease. By utilizing the so called Northern Sea route along the Russian
northern coast (also known as the Northern Passage) or the Northern Passage through the Canadian
Arctic archipelago, large bulk carriers would substantially reduce the distance between Asia,
Europe and North America. This would mean saving more than 4000 nautical miles between
German and Japanese ports.77
Figure VII.1: Alternative Routes to the Canal
Source: World Bank, 2014
77 Kerr, 2002

81
SOCIAL SUSTAINABILITY
180. The country’s main risks relative to social sustainability and social cohesion are
linked to the dynamic growth that has lifted many into middle class status while leaving
others in extreme poverty, the crime and violence linked to Panama’s strategic position as a
drug corridor and weak land rights protection. The stark economic inequalities and relative
deprivations, along with both perceptions and evidence of corruption and more precarious forms
of urban employment, create strains on
society. Relative deprivation has led
some groups to further organize and
assert political voice (such as the Mesa
Indigena), while others take advantage of
the low barriers to entry to the illegal drug
trade that continues to grow in the
country’s unofficial economy.
181. Relative poverty in urban areas,
exclusion and the illegal drug trade are
factors in the increases in violent crime
and gender-based violence. The
country’s homicide rate places it 39th in
terms of homicides globally (Figure
VII.2).78 Cases of reported rape rose 36
percent between 2009 and 2012—and in 2009 nationally, 19.7 percent of women experienced some
kind of physical violence after the age of 12 with 9.3 percent reporting experiencing physical
violence within the past year while thefts rose nine percent. 79 80 The population is very conscious
of the increased crime and violence. In 2004, crime and violence ranked third in the top five
problems of the country, moving up to first place by 2008 and has remained in this position (Figure
VII.3).81
78 UNODC, 2013. 79 Unless otherwise stated, all data of this section is taken from the Encuesta Nacional de Salud Sexual y Reproductiva
(ENASSER, 2009). 80 Overseas Security Advisory Council, US Department of State, 2013. 81 LAPOP 2004 through 2012.
Figure VII.2: Homicide Rates (per 100,000)
Source: UNODC, 2012.
0
20
40
60
80
100
120
140
160
19
95
19
96
19
97
19
98
19
99
20
00
20
01
20
02
20
03
20
04
20
05
20
06
20
07
20
08
20
09
20
10
20
11
El Salvador Guatemala
Honduras Mexico
Panama Canada
Panama

82
Figure VII.3: Critical Problems Facing the Country (In Order of Importance)
2004 2006 2008 2010 2012
Unemployment/lack of
jobs
Unemployment/lack of
jobs
Crime and
delinquency
Crime and
delinquency
Crime and
delinquency
Corruption Crime and delinquency Economy Economy
Inflation, high
prices
Crime and
delinquency Corruption
Unemployment/lack
of jobs
Unemployment/lack
of jobs Corruption
Economy Economy
Inflation, high
prices
Inflation, high
prices Lack of water
Poverty Lack of water Corruption Corruption Economy Source: LAPOP, 2004 to 2012
182. Urban youth, along with rural and indigenous populations face particular risks.
Similar to many of its Central American neighbors, Panama has a large youth cohort with 24.9
percent of the population between the ages of 15 and 29, 15 percent of which neither work nor
attend school.82 Rising gang activity, with roughly 240 gangs in Panama that operate in and around
the major urban centers83, are of some concern. Rural and indigenous areas are also vulnerable to
crime and violence. This is particularly the case in Darien, a region socially and politically isolated
and economically marginalized and which is affected by violent conflict between Colombian and
Mexican cartels for control over narcotics trafficking routes and the presence of demobilizing
guerillas and displaced persons from Colombia. The violence and insecurity is affecting production
as families are moving to larger population centers and women stop working in community
agricultural plots.
183. Crime and violence have the potential to stifle growth if not managed. The examples
from the neighboring countries are stark. An extensive growth analysis of El Salvador84 identified
crime and violence as one of the two major constraints to growth with the huge cost of crime and
violence a major factor limiting El Salvador’s ability to compete on the world markets.85 In
Honduras, the costs of crime are estimated to represent 10 percent of GDP--the health costs alone
are estimated at 1.3 percent of GDP—and GDP could increase by 0.7 percent if a 10 percent
reduction in crime could be generated.86 While estimates of costs are subject to error, the fact that
crime and violence, if unchecked, can hamper growth is a legitimate concern.
184. Struggles around infringements of indigenous land rights also pose serious threats to
social sustainability. The legal establishment of the five comarcas between 1938 and 2000 formed
the base of rights and protections for the indigenous population, a base that is widely recognized
as a model of protection of indigenous rights. However, the United Nations Human Rights
Council87 argues that the legal framework is fragile and that Panama has significant problems in
terms of both the implementation and the protection of the rights of the Indigenous Peoples,
especially their rights over land and natural resources. Panama is one of the six Latin American
countries that have not signed the ILO Convention No. 169, a legally binding international
82 Hoffman, 2012. 83 REDSAL, 2012. 84 USG-GOES, 2011. 85 USG-GOES, 2011; Acevedo, 2008. 86 World Bank, 2011b. 87 HRC, 2014.

83
instrument open to ratification, which deals specifically with the rights of indigenous and tribal
peoples.
185. Illegal logging, large mining interests and other encroachment on indigenous lands
are ongoing problems. Land and resource issues have sparked protests and confrontations,
leading to fatalities in recent years, and may continue as the Indigenous Peoples feel threatened.
The head of the National Coordinating Body of Indigenous Peoples in Panama is quoted as saying
in reference to this issue: “We are a peaceful people, but we are at war, and it is being fought by
women, children, men, caciques,” (Barrigón Dogirama as cited in Berger, July 31, 2013). 88 In
2011, after three weeks of violent protests and roadblocks by the Ngäbe Buglé and environmental
groups, the Government repealed the reforms to the mining law (Law 8). The cancellation of the
law leaves a legal vacuum as the clauses of the mining law that Law 8 had replaced were not re-
instated. Both the mining and tourism sectors, while potential sources of much needed growth,
also have continued potential to impinge on indigenous rights and lead to confrontations.
186. While the risks to social cohesion exist, various factors may play a mitigating role.
The recent success the Government has had in reining in homicide rates suggests that Panama may
be able to avoid the escalation seen in the neighboring countries. Most youth gangs in Panama are
in relatively early stages of development, are largely a neighborhood oriented phenomenon with
limited adult involvement, and lack criminal sophistication or linkages to organized crime and/or
corrupt public officials. The nascent gang problem, among others, could be dealt with if the country
can pull together its well-established but fragmented array of actors --governmental and non-
governmental actors, including the private sector -- that work in the area of youth services and
crime prevention to provide “wrap-around”89 services to disenfranchised youth. Ratification of the
Convention 169 could help to promote land and other rights as ratification would trigger
international supervision of the implementation of the Convention, covering a range of issues from
non-discrimination to cultural specificities, consultation and participation and the right to define
priorities for development in the comarcas. The planned creation of a Ministry of Indigenous
Affairs to help promote economic and social welfare of the Indigenous Peoples in the country and
support the Plan DIPORP provides further opportunities improvements in the protection of land
and resources rights of the Indigenous Peoples in Panama.
ENVIRONMENTAL SUSTAINABILITY
187. Safeguarding Panama’s water and natural resource base is critical to the current
growth model linked to the Canal and other economic activities. The Panama Canal needs
close to 2,580 hm3 of water per year and depends entirely on Lake Gatun, and consequently, the
health of the surrounding rainforest. One month of full operation uses around one-third of the
available Gatun Lake volume, which results in a heavy dependence on precipitation, a concern in
the dry season.90 In 2015, once the Canal expansion is complete, it is estimated that approximately
3,736 hm3 of water will be needed to operate the Canal, a 45 percent increase. Ensuring that water
88 Reuters, 2011. Caciques are traditional indigenous leaders. 89 Wrap-around services refer to the coordination of multiple service providers (i.e., health, education, social services,
law enforcement, civil society, etc.) that respond to the changing needs of youth through the various lifecycle stages.
In the U.S., a case worker typically coordinates the provision of such wrap-around services. 90 Panama Canal Annual Report (2013)

84
resources are adequately managed is a top priority for the Panama Canal Authority, which has put
in place a strong management and monitoring system that ensures that different demands for water
are met while maintaining the health of the watershed ecosystem. The risk posed by shifting
climate patterns, therefore, becomes critical to the sustainability of the Canal operation and hence
economic sustainability. The El Nino Southern Oscillation climatological phenomenon over the
Panama Canal watershed is characterized by a reduction of total amount of rainfall. In terms of
long term climate change, the recent IPCC 5th Assessment (2014) cites a trend of increasing
precipitation over most of Panama. This is generally good news for the Canal. However, greater
variability, with more frequent floods and droughts, poses a real risk.
188. Infrastructure-based growth requires strong environmental institutions and
enforcement to avoid long term irreversible negative impacts. As Panama continues on its
development trajectory fueled by investments in the construction and logistics sectors and aspires
to expand its image as a tourism and service hub, strong regulatory and institutional environmental
framework, monitoring and enforcement are needed to guide the design and implementation of
infrastructure projects. The limitations of the national environmental authority, ANAM, in the
areas of priority setting, planning, and capacity to implement key regulations can lead to significant
negative impacts. Environmental information systems are also an important component needed to
facilitate greater public participation, an issue which has caused several social conflicts and
outbreak of violence around protected and indigenous areas in past years.
189. In particular, the growth of the mining sector faces environmental risks. As mentioned
in previous sections, the mining sector has the potential to contribute significantly as a driver of
growth in the coming decades. However, for this to materialize, the tension between its growth
potential and the significant environmental and social challenges needs to be addressed, given that
the mining sector is responsible for some of the largest releases of heavy metals into the
environment of any industry. It also releases other air pollutants, including sulfur dioxide and
nitrogen oxides, and leaves behind tons of waste tailings, slag, and acid drainage. Occupational
and environmental exposure to heavy metals, silica, and asbestos can occur during mining
operations. The lack of an adequate regulatory framework that regulates safe and sustainable
mining permits and incentives for employment promotion and redistribution schemes remains a
key bottleneck for the sector to reach its potential.
190. Increasing urbanization is not matched by adequate planning and service delivery
capacity for safe and clean living conditions. A rapidly growing urban population (at a rate of
2.4 percent per year, it is the fifth highest in the region after Haiti, Guatemala, Honduras and
Paraguay), as was discussed in Chapter V, increases the pressure for adequate urban planning to
avoid additional future problems.91 Total environmental health costs estimated at 1.3 percent of
GDP per year.92 In particular, urban air pollution and associated respiratory illnesses and mortality
is a growing concern in Panama City, San Miguelito and other urban centers, with 90 percent of
total air pollution resulting from transport emissions from the increasingly large vehicle fleet. The
91 As a result of pollution from untreated urban wastewater from Panama City, Panama Bay in recent years has reached
a critical state of eutrophication with unpleasant odors and bans on consumption of fish from its waters. A first phase
of waste water treatment under the “Sanitizing the Bay” project is contributing to the improvement of hygienic
conditions in and around the metropolitan area. 92 Country Environmental Analysis, 2008

85
estimated annual costs of mortality and morbidity due to urban air pollution is estimated at 0.7
percent of GDP. There is marked quality differences between fast-developing urban areas and
those lagging behind. For instance, about 400,000 people in urban areas receive water only 7 hours
per day, there is very low wastewater collection in low-income urban areas, and 17 percent of the
urban population still has inadequate latrines. The challenge of improving the urban environment
is reinforced by the ongoing process of decentralization. Law 37 of 2009 gives increased
responsibilities to municipal governments in terms of planning and investment in urban
infrastructure. However, this has not been coupled with adequate capacity building at that level to
allow municipalities to undertake their enhanced roles in planning, budgeting and implementing
sound investment choices. Institutional strengthening of local governments will be critical to
ensure that Panama’s urbanization follows a sustainable trajectory.
191. In addition to rural vulnerability to natural disasters, urban exposure to disasters is
also increasing. The indigenous comarcas Ngäbe Buglé, Emberá-Wounaan and Guna Yala, and
the provinces of Bocas del Toro and Darien show historically significant levels of vulnerability to
natural disasters.93 The people affected in these rural areas are characterized by low incomes, as
shown previously, as well as precarious housing conditions and poor access to basic services
(water and sanitation, electricity, etc.). Increasingly, however, urban areas are also seeing more
disaster impacts, within a context of a general lack of informed disaster risk management policies
and interventions. The Metropolitan Area of Panamá, home to 43 percent of the country’s
population and generating about 68 percent of the GDP, has seen increasing floods of higher
impacts in the last decade. More than ten national emergency declarations have been issued since
2005, with serious landslides and flooding affecting Panama and Colon, and estimated losses at
over US$135 million. While Panama exposure to seismic hazard is not as high as neighboring
countries, the potential losses would be huge: a national loss of US$1,634 million is estimated if
Panama is struck today by an earthquake similar to that of July 18, 1934 (magnitude 7.4).
93 Gordón et al, 2012

86
VIII. Prioritization Linked to Sustainability
BENCHMARKING
193. Successful Canal operations depend on the availability of adequate water supply all
year round. The risk of lack of water availability in critical months is evident: the peak of Canal
traffic coincides with the lowest rainfall period. Droughts threaten the consistent water supply for
the Canal operations, such as the risk posed by the drought of this year to limit the size of ships
passing through. At the same time, big storms threaten to flood its infrastructure, as has famously
occurred in an unprecedented closure in December 2010 (see Box VIII.1). The urban expansion
west of the Canal towards Capira puts an extra burden on the Gatun Lake while developments to
the east impact the Madden Dam buffer capacity. The data in the past decades demonstrates that
the incidence of extreme weather events is increasing.
Box VIII. 1: La Purisima94
In December 2010, Panama experienced the longest three-day rainstorm in the history of the Canal and recorded a
record 760 mm of rainfall in 24 hrs. The intense rain led to 500 landslides, which impacted approximately 9,000
people and caused a surge in turbidity of the water source to 700 NTU, causing the principal potable water plant that
services Panama City to collapse. As a result, parts of Panama City were left without water for 50 days95. Canal
operations were stalled for 17 hours, and for the fourth time in its history, the Panama Canal Authority had to open
the lock drains to lower water levels. In addition, the company charged with operating the Bayano Dam had to open
its gates given that the basin was reaching its maximum capacity. This action resulted in the flooding of the town of
El Llano in Chepo. Residents had to be evacuated and lost approximately US$6 million in agricultural production and
household edifices. 96 The total cost of La Purisima was estimated at US$150 million.
194. Climate change could lead to increased variability in rainfall, thereby affecting Canal
operations. First, climate change may result in changes in rainfall, which according to the recent
Intergovernmental Panel on Climate Change (IPCC) 5th Assessment Report (2014) cites a trend of
increasing precipitation over most of Panama. Fabrega el al (2013)97 analyzed the projected
hydroclimatic patterns for Panama98, where the study projects an increase in precipitation over all
four regions of Panama for the 2075-2099 period: Bocas del Toro, Veraguas, Panama Canal and
Darien. Future precipitation appears to increase for all regions by at least 5 percent, with the
exception of some areas of the Bocas del Toro region (Figure VIII.1). Increments greater than 15
percent were projected for the most populated areas in Panama located next to the Canal. However,
another predicted change is that of higher variability, including increased occurrence of extreme
weather events. Overall, climate change-induced weather extremes could lead to costly slow-
downs that would actually make the Canal a less-efficient shipping route and cause a ripple of
delays.
94 Named as such given that it took place around the day of Immaculate Conception, December 8. 95 Espinosa, Jore A. “Gestion del agua en el Canal de Panama durante la inundacion extrema en diciembre de 2010”
Division del Agua, Autoridad del Canal de Panama. 96 Paez, Aristides Cajar. “La madre de las Lluvias” La Prensa 141142. 97 Fabrega el al. “Hydroclimate Projections for Panama in the Late 21st Centruy”, Hydrological Research Letters 7 (2),
2013. 98 Using the MRI AGCM3.1 (Atmospheric Global Circulation Model) under the SRES A1B scenario.

87
Figure VIII.1: Regional Mean Seasonal Variation in Precipitation, Evaporation, and Total Runoff under
Current (dashed) and Future (solid) Climates and the Change between Current and Future Climates
(bottom panels)
Source: José Fábrega et al.
Notes: Global climate circulation model prediction: regional mean seasonal variation in precipitation, evaporation and total
runoff under current (dashed) and future (solid) climates. Black lines denote precipitation (mm/day red lines denote
evaporation, and green – runoff (the difference between precipitation and evaporation)
195. In addition, adequate water management underlies the country’s ability to generate
hydropower for different uses. Hydropower generation is the most water-intensive sector in
Panama, utilizing 50,000 hm3 per year to operate99. During several recent extended dry seasons100,
the metropolitan areas suffered from electricity rationing and the need to import the equivalent of
a month of energy usage for 100,000 families from the Central American Electrical
Interconnection System given low water levels at hydroelectric dams. The growing economy and
related rise in demand for hydropower is faced with limitations on hydropower investments in
specific areas. This increases the need to safeguard available opportunities, such as in the Bocas
del Toro region, where rainfall patterns are not predicted to increase much, and ensure that the
upstream watersheds remain healthy.
196. Sustaining its forest, biodiversity and coastal resources is also critical for tourism and
rural livelihoods. Tourism is a growing industry in Panama, which in 2010 consumed 1.3 hm3 of
water, while many of the large tourist resorts on the Pacific coast rely on groundwater resources.
In 2013, tourists spent approximately US$4.5 billion in Panama, much of it linked to the forest,
biodiversity and coastal resources which attract increasing numbers every year. The amount of
water needed to sustain the health of Panama’s ecosystems is yet unknown. The National Authority
of Environment (ANAM) has established the necessary amount of water for ecological protection
at 10 percent of overall water flow in basins when granting water resource concessions, but
recognizes that this number does not represent the amount of water necessary for conservation.101
While agriculture consumes much less water and plays a smaller role in the economy (3 percent
of GDP), the livelihood of the rural poor depends on it and subsistence farmers have much less
coping mechanisms in the face of extreme weather and climate risks. The Plan Nacional de
Gestion Integrada de Recursos Hidricos identifies the main contamination source in Panama as the
direct discharge of sewage into water bodies without prior or sufficient treatment. The second main
99 ANAM, National Plan, 2010-2030 100 IDB, Energy Integration in Central America, 2011 101 ANAM, National Plan for Integrated Water Resources Management (2013)

88
contamination source identified is the dumping of solid waste into water bodies. This is followed
by diffuse contamination from agriculture (pesticide and fertilizer run-off) and detergent use in
cities. Finally, deforestation is also listed as a source of contamination as erosion causes
sedimentation and high turbidity levels on water bodies.
PRIORITY AREA
197. Given its central role in the economic engine of Panama, as well as a key component
for other growth sectors and the livelihoods of the poor, adequate water resources
management emerges as the key priority area under sustainability.
198. In Panama, there are two worlds of water resources management: the Panama Canal
watershed and the rest of the territory. The Panama Canal Authority has a strong monitoring
and management program for its water sources, watersheds and forestry resources to ensure the
continuity and sustainability of water supply for Canal operations. This includes hydraulic and
water quality monitoring, as well as strict land use planning, community-based forest conservation
and sustainable resource use programs in the Canal’s watershed. In contrast, the remaining 95
percent of the country’s watersheds fall under the authority of ANAM, where the capacity and
resources to implement and enforce the National Plan for the Integrated Management of Water
Resources (2010-2030) are more limited.
199. Comparison of results from water management efforts shows stark differences. The
Panama Canal Authority is fully responsible for the conservation and management of the Panama
Canal Watershed (PCW), supported by an Inter-institutional Commission. On the other hand, the
responsibility of ANAM for management of watershed faces conflicting overlaps with several
other institutions, such as the Ministry of Health (MINSA) and IDAAN. Monitoring of the PCW
has been undertaken systematically over the last two decades, including vegetation cover,
hydrological conditions, water quality and social aspects related to land use and settlement. Water
quality in PCW is ranked good to excellent. In contrast, ANAM carries out water balances only at
ten watersheds and 95 rivers. Of these monitored, 34 percent are classified as contaminated or
slightly contaminated. Only four watersheds have management plans and one has an
implementation strategy. In terms of concrete results, the PCW was able to reforest and maintain
more than 6,200 hectares in the PCW, compared to only 300 hectares around the targeted
watersheds in the rest of the country. In their conservation efforts, the Panama Canal Authority
has involved and helped over 3,500 producers and residents to receive land titles, and engaged
over 6,000 residents and producers in training programs related to sustainable management and
production systems. Finally, forecasting and modeling climate change impacts is a central
component of the design of new investments in and around the Canal. y contrast, only limited
information and small scale adaptation and mitigation programs are undertaken by ANAM in
selected dry areas. Annex 5 provides a detailed comparison between the two management models
and associated program results.
IDENTIFIED OPPORTUNITIES
200. Implementing integrated water resources management plans in priority basins can
provide a gradual expansion of the successful model outside the Canal watershed. Rather than

89
focusing on revising the legal framework for water resources management (which could prove to
be a lengthy process), the country could embark on a prioritized program to improve the
management plans and implementation capacity in selected priority watersheds. Supporting the
development of river basin-based plans would benefit from the successful experience of the PCW,
including through sharing of knowledge and expertise across the two institutions, and help build
the institutional capacity for ANAM to gradually expand its coverage.
201. Scaling up integrated disaster risk planning coupled with long term climate change
adaptation measures is critical to enhance Panama’s future resilience capacity. ANAM is
working on small scale climate change adaptation and mitigation measures, which should be
scaled-up to better prepare vulnerable groups and sectors for higher rainfall and longer dry seasons.
To achieve this, there is a need to better integrate national disaster risk management into water
resource management planning in priority basins. Enhanced information and decision support
capacity across key sectors along with improved early warning and monitoring systems is required
to build the ability to forecast and plan for a future in which the occurrence of extreme events
could be the new norm. A detailed description of these opportunities in the water sector is also
included in Annex 3.
Filling Knowledge Gaps
The hydrogeological situation of the country is not well known. Investing in a better understanding of the water
resource base is a priority in the short to medium term. Panama’s National Plan for Integrated Water Resources
Management (2010-2030) indicates that the number of water use concessions have increased from 350 in 2004 to
952 in 2010, which is only a portion of the actual number of users. About 34 percent of the available water is
classified as contaminated or slightly contaminated. Water use conflicts occur frequently among users of the same
water source, with limited Government capacity to manage and monitor water use. At the same time, economic
incentives and instruments to adequately value and manage water allocations are non-existent in Panama,
monitoring capacity is limited and the legal and regulatory framework is outdated. ANAM could be supported in
developing a better understanding of water availability, especially groundwater. ANAM estimated that 235,000
people, many of whom live in rural areas, rely on groundwater for domestic and agricultural uses, but the country
currently has limited knowledge on the quantity and quality of groundwater.102 ANAM also only collects water
balances at ten watersheds, and does not have a full picture of the current water demand, making it difficult to
establish a fair price for the ecological value of water. Filling this knowledge gap is considered a priority over the
short to medium term.
102 ANAM, Curso Regional Presentation, 2010.

90
IX. Conclusion
202. The analysis identifies five policy priorities that Panama may consider to sustain its
recent track record on growth, poverty reduction and shared prosperity. Growth prospects
for Panama are good in the near term with projections for 2014-2019 around 6 percent based on
sustaining high levels of investment. However, a number of potential impediments are emerging
and could slow growth over the medium to long term if left unaddressed. First, infrastructure,
specifically energy, is creating bottlenecks to growth. Second, weaknesses in education and a
shortage of skilled labor may be limiting growth and concerns about quality and high drop-out
rates from secondary education have been identified as challenges in the education sector. Third,
weak public sector institutions may slow down growth, notably if the challenges of transparency,
pockets of low efficiency, and weaknesses in the regulatory framework remain unaddressed. In
terms of building an inclusive society, the analysis shows that the indigenous have benefited least
from Panama’s excellent growth performance. Therefore, addressing the challenge of their
inclusion has been identified as a fourth priority area. Finally, water management has emerged as
fifth priority area. As climate change could lead to increased variability in rainfall, careful water
management will decide the sustainability of the successful operation of the Panama Canal as a
major pillar of economic activity.103
203. These five priority areas are even more relevant when we take into account the
valuable synergies among them. The analysis in this document has been framed around three
questions: (i) what is the nature of growth, (ii) how inclusive is it and (iii) how sustainable. Yet, it
is clear that each priority area affects the others. Some simple examples illustrate this point.
Infrastructure with a focus on energy has emerged as a priority area under economic growth.
However, it is also highly relevant for inclusion and the sustainability of the development model.
As described in the inclusion chapter, the limited access of the indigenous to electricity and basic
services is a barrier to their economic growth. Addressing the energy deficit in the country will
help to remove this barrier and facilitate productive activities and human capital investments. At
the same time, solving the energy shortages appropriately can improve fiscal and environmental
sustainability. Similarly education and skills have been identified as a priority for economic
growth: a well-educated workforce with relevant skills is fundamental to sustain economic growth.
In parallel, closing the education gap between the poor and non-poor is also highly relevant for
inclusion by providing opportunities to rural and indigenous Panamanians. Institutional capacity
clearly affects growth, inclusion and sustainability. Finally, while the focus on indigenous groups
arose from the assessment of inclusion, facilitating the contribution of these groups to economic
activity in line with their cultural values would contribute to national growth and sustainable
development. And sectors like mining and tourism may be able to generate higher growth if
Panama becomes a more inclusive society. From a vantage point of social cohesion the area of
Indigenous is crucial for sustainability.
204. In terms of opportunities, those identified under the institution priority area provide
103 The priority areas of infrastructure with a focus on energy, education and skills, and institutions including
transparency, efficiency, and the regulatory framework are discussed in detail in chapter on the prioritization linked
to growth. The priority area of indigenous is discussed in detail in the chapter on the prioritization linked to inclusion.
The priority area of water management is discussed in detail in the chapter on the prioritization linked to sustainability.

91
other clear examples of complementarity. An improvement in public sector management, be it
through performance-based budgeting or enhanced fiscal management, will free resources that
could be spent on other areas, including education or Indigenous Peoples. In addition, greater
transparency will also lead to a more efficient allocation of public resources. In terms of improving
the regulatory framework, adopting a modern mining regulatory framework to promote adequate
oversight, benefit sharing and environmental and social sustainability is one of the likely necessary
conditions to begin conversations with Indigenous Peoples on developing this industry in
comarcas. Enforcing consistent social and environmental safeguards regulations and standards
across sectors obviously will have an important and positive impact on water management.
205. The opportunities identified to improve education and skills will also lead to
advancement on multiple fronts. If targeted technical education is strengthened better prepared
graduates will be available for the labor market. On the one hand this will lead to a better workforce
available to work in the energy sector, on the other hand this may lead to a growth impulse in the
long run that could generate even more energy demand and reinforce the need for action on the
energy sector. Strengthening the monitoring and evaluation of education with the goal of
improving the quality could help identify institutional weaknesses in the education sector.
Knowing in which parts of the country pupils are doing well and crossing administrative data with
outcome data can deliver useful insights in this context. Given the particularly high drop-out rates
in indigenous areas the increased payments of the CCT program Beca Universal could make a
difference. However, in this context, it is important to understand the parameters for the high drop-
out rates in those areas. Finally, a link with water management is that the Panama Canal Authority
is able to hire highly educated individuals and is one of the most efficient organizations of the
country. Improving the quality of students through technical education, monitoring and evaluation,
and reduced school drop-out could boost development in many sectors including the water sector
in the rest of the country.
206. A final example of complementarities is seen within the Indigenous Peoples priority
area. Increasing the pertinence of health and education services in indigenous communities could
help reduce high drop-out rates in there. Supporting the economic development with identity
especially in relation to payments for environmental services and robust benefit sharing
arrangements certainly create complementarities with water management and the institutional
framework. The strengthening and formalizing Indigenous Peoples’ participation in Government
decisions and processes that concern them has potential positive effects on all the other priority
areas.
207. In summary, Panama has been a success story in most regards and by addressing the
identified priority areas is likely to sustain this success. There are, of course, risks including the
global economic environment, rising interest rates and climate change for example. There are also
risks that Panamanians could be unable to reach consensus to move on the priority areas. However,
the country has proven to be resilient during recent crises and the analysis in this report suggests
that the country has the building blocks for locking in success.

92
References
Araujo, J., Brueckner, M., Clavijo, M., Vostroknutova, E. and K. Wacker (2014): “Benchmarking
the Determinants of Economic Growth in Latin America and the Caribbean,” World Bank
Report No. 91015-LAC.
Araujo, J., Clavijo, M., Vostroknutova, E. and K. Wacker (eds.) (2014): “Understanding Latin
America and the Caribbean’s Income Gap”, Forthcoming World Bank Report.
Araujo J., Vostroknutova E., Wacker. K, Clavijo M., (2014): “Understanding the Latin American
and the Caribbean income gap: What is preventing LAC from converging to higher income
levels?”, World Bank Report, 212 pp.
Arraiz I., Rozo S., (2011): “Same Bureaucracy, Different Outcomes in Human Capital? How
Indigenous and Rural Non-Indigenous Areas in Panama Responded to the CCT.”
Documento de Trabajo OVE /WP-03/11, Oficina de Evaluación y Supervisión (OVE),
Banco Interamericano de Desarrollo, Washington, D.C.
Autoridad del Canal de Panama, (2013): “Informe anual 2013”.
Barletta, N. (2012): “Estrategia para el Desarollo Nacional—Vision, Realizacion, Actualizacion”,
Panama: Universidad Latina, 2012.
Barro, R. and J. Lee (1994). "Sources of Economic Growth," Carnegie Rochester Conference
Series on Public Policy.
Berger E., (2013): “Panama indigenous groups say land under threat”, Thomson Reuters
Foundation - Wed, 31 Jul 2013 10:45 GMT. http://www.trust.org/item/20130731093650-
v4tb5/?source=hptop.
Breen, R. and García-Peñalosa C., (2005): "Income Inequality and Macroeconomic Volatility: An
Empirical Investigation,"Review of Development Economics, Wiley Blackwell, vol. 9(3),
pages 380-398.
Brueckner M., (2014): Background paper for Latin America and the Caribbean’s Study on the
Determinants of Economic Growth: Econometric Analysis. 84 pp.
Bruns, B. and Luque, J (2015): Great Teachers: How to raise student learning in Latin America
and the Caribbean. World Bank.
Bussolo, M., de Hoyos, R., and D. Medvedev (2011): “Distributional effects of the Panama Canal
Expansion”, The World Bank Policy Research Working Papers, No. 5848
Cadena, K., Cardoza C., Lucchetti L., and Scott K., (2013): “Central America en el Nuevo milenio:
seis historias diferentes de pobreza y desigualdad.” World Bank..
Cardenas H., Salazar J., (2007): “Panama’s Growth Diagnosis”, Inter-American Development
Bank Working Paper 39, 2007.
Council on Human Rights (2014). “Informe del Relator Especial sobre los derechos de los pueblos
indígenas, James Anaya: Adición La situación de los derechos de los pueblos indígenas en
Panamá”. Report A/HRC/27/52/Add.1, United Nations.
Datt G., Ravallion M., (1992): "Growth and Redistribution Components of Changes in Poverty
Measures: A Decomposition with Applications to Brazil and India in the 1980s." Journal
of Development Economics, 38, 275-295.
Dollar, D., Kleinberg, T., Kraay A., (2013): “Growth still is good for the poor”, Policy Research
Working Paper 6568, World Bank.
Eden M., Nguyen H., (2014): “Reconciling Micro-and Macro- based estimates of technology
adoption lags in a model of endogenous technology adoption”, in “Understanding the Latin

93
American and the Caribbean income gap: What is preventing LAC from converging to
higher income levels”, 57-73.
Espinasa R., Balza L., Hinestrosa C., Sucre C., Guerra S., (2013): “Dossier energético Panama”,
Inter-American Development Bank.
Fabrega J., Nakaegawa T., Pinzon R., Nakayama K., and O. Arakawa, (2013): “Hydroclimate
projections for Panama in the late 21st century”, Hydrological Research Letters, 7(2), 23-
29.
Fajnzylber P., Guasch L., Lopez H., ed., (2010): “Does the Investment Climate Matter?
Microeconomic Foundations of Growth in Latin America, The World Bank and Palgrave
Macmillan, 346 pp.
Ferreira F., Messina J., Rigolini J., Lopez-Calva L., Lugo M., Vakis R., (2013):”Economic
Mobility and the rise of the Latin American middle class”, The World Bank Latin
American and Caribbean studies, 203 pp.
Ferrer D., Fisher E., Roach G., Macera G., Chellew G., Giménez I., Gasteazoro R., (2014):
“Finanzas públicas: Diagnostico y propuestas”, Fundacion para el desarrollo económico y
social de Panama.
Garcia-Penalosa, C. and Turnovsky, S. (2004): “Macroeconomic Volatility and Income Inequality
in a Stochastically Growing Economy”, conference volume of “Economic Growth and
Income Distribution: On the Nature and Causes of the Wealth of Nations,” conference held
in Lucca, Italy, June 16-18.
Gill, S., Ivailo I., Willem van E., Donato De R., (2014): “Diversified development : making the
most of natural resources in Eurasia”. World Bank.
Gordillo D., Stokenberga A., Schwartz J., Jordan, (2010): “Understanding the Benefits of Regional
Integration to Trade: The Application of a Gravity Model to the Case of Central America”,
World Bank Policy Research Working Paper Series, World Bank.
Guevara J., (2008): “Panama in 2007: Economic growth, social combustion, and institutional
catalepsy”, Revista de Ciencia Política, Volumen 28, Numero 1, 305-328.
Hausmann, R., Pritchett, L., and D. Rodrik (2005):"Growth Accelerations", Journal of Economic
Growth, Springer, vol. 10(4), pages 303-329, December.
Huang H., Fang W., Miller S. (2012): “The Effect of Growth Volatility on Income Inequality”,
University of Nevada Working Paper.
Instituto Nacional de Estadísticas y Censo, 2007 to 2013. “Encuesta del Mercado Laboral”,
Contraloria, Panama.
Instituto Nacional de Estadística y Censos 2000, 2010 “Censo nacional de población y vivienda”,
Contraloria, Panama.
Instituto Nacional de Estadísticas y Censo, (2014): “Cuadro 9. Panamá. Estimaciones
proyecciones de la población total, Provincia y Comarca Indígena, según sexo y edead: al
de julio de 2000-“30”,
http://www.contraloria.gob.pa/inec/Publicaciones/Publicaciones.aspx?ID_SUBCATEGO
RIA=10&ID_PUBLICACION=491&ID_IDIOMA=1&ID_CATEGORIA=3,
downloaded October 13, 2014.
Inter-American Development Bank and World Bank, (2012): “Public Expenditure and
Financial Accountability (PEFA)”, 136 pp.
International Monetary Fund, (2011): “Financial Sector Assessment Program Update. Panama
Draft Aide-Memoire”, 56 pp.

94
International Monetary Fund, (2014): “Panama: Report on Observance of Standards and Codes on
the FATF Recommendations for Anti-Money Laundering and Combating the Financing of
Terrorism”, IMF Country Report 14/55, 19 pp.
Klytchnikova K., Dorosh J., (2013): “How Tourism Can (and Does) Benefit the Poor and the
Environment: A Case Study from Panama”. World Bank, Washington, D.C.
Latin America Public Opinion Project, (LAPOP) 2004, 2006, 2008, 2010 and 2012. Constructed
Panel downloaded from http://www. vanderbilt.edu/lapop, November 2013.
Loayza N., Fajnzylbe P., Calderon C.,(2004): “Economic Growth in Latin America and the
Caribbean: Stylized facts, explanations, and forecasts”. Central Bank of Chile Working
Paper 265.
Loayza N., Raddatz C., (2010): “The composition of growth matters for poverty alleviation”,
Journal of Development Economics, 93, 137-151.
Loayza, N., Ranciere, R., Serven, L., Ventura J. (2007):” Macroeconomic Volatility and Welfare
in Developing Countries: An Introduction”, The World Bank Economic Review, Vol. 21,
No. 3, pp. 343–357.
Maloney W., Rodriguez-Clare A., (2007) “Innovation Shortfalls”, Review of Developing
Economics, 11(4), 665-684.
Nakayama K., Beitia C., Vallester E., Pinzon R., Fabrega J., Nakaegawa T., Maruya Y., Espinosa
J., Olmedo B., Kato J., and K. Komai, (2011): “Increase in simple precipitation intensity
index in Panama”, Annual Journal of Hydraulic Engineering, Vol 2011.
Pagano A., Light M., Ungos R., Sanchez O., and Tapieros E. (2012): “Impact of the Canal
Expansion on the Panamanian Economy”, Maritime Policy and Management, Vol. 39,
No.7, pp. 705-722
Primola C., De la Guardia E., De Ycaza F., Barría Y., Kelly M., Urrutia V., (2013): “Politica
energética: Diagnostico y propuestas”, Fundacion para el desarrollo económico y social de
Panama.
Seidel B., (2010): “The causes and limits of the recent economic growth in Panama”. Berlin School
of Economics of Law.
Swiston A., Barrot L., (2011): “The role of structural reforms in raising economic growth in
Central America”, IMF Working Paper 11/248, 21 pp
United Nations Office of Drugs and Crime, (2013): “Statistics Online”, https://stats.unodc.org
United States Department of State (2013). “Panama 2013 Crime and Safety Report”, OSCA, July.
https://www.osac.gov/pages/ContentReportDetails.aspx?cid=14201
USG-GOES, (2011): “Partnership for Growth: El Salvador Constraints Analysis”, Millenium
Challenge Corporation, Washington, D.C.
World Bank, (2011): “Crime and Violence in Central America : A Development Challenge - Main
Report”. World Bank. https://openknowledge.worldbank.org/handle/10986/2744 License:
Creative Commons Attribution CC BY 3.0.
World Bank (2013). “Growth Volatility in Paraguay—Sources, Effects, Options”, World Bank,
Washington D.C., forthcoming.
World Bank, (2008): “Panama Country Environmental Analysis”.
World Bank, (2011): “Panama poverty assessment : translating growth into opportunities and
poverty reduction”, Report No. 62955-PA, World Bank.
World Bank, (2014): Social Sector Expenditure and Institutional Review Data Base.
World Bank, (2014). “Night Lights Data”,

95
http://geowb.worldbank.org/portal/apps/OnePane/swipe/index.html?webmap=674a46aa308f43c7
bd340fb26cbad811,8a9227075dcf4d3893611310596bbf71
World Bank, (2014): World Development Indicators.
http://data.worldbank.org/products/wdi
World Bank, (2014): “POVCALNET”.
http://iresearch.worldbank.org/PovcalNet/index.htm
World Bank (2014c). “Los Pueblos Indígenas en América Latina: Balance político, económico y
social al término del Segundo Decenio Internacional de los Pueblos Indígenas en el
Mundo” Washington, D.C.
World Bank (2014d). “Panama Gender Note”, Latin American and the Caribbean Poverty,
Gender and Equity Unit (LCSPP), mimeo.
World Bank (2015):”The Rise of the South”, Flagship report of the Chief Economist Office of
the Latin America Region, 2015.

96
Annex 1: Team engagement and consultation process
The SCD core team followed a highly inclusive process in the development of the final product
and the elaboration of the diagnostics. In this annex, the collaborative steps followed towards the
preparation of the draft document are detailed.
TEAM COLLABORATION STEPS
Formulation of hypotheses: The SCD
preparation process started with the
formulation of a set of 13 general hypotheses
around key areas for Panamas growth and
poverty reduction patterns based on the
review of the literature. The country team and
key specialists in specific areas provided
feedback and comments on their validity as
well as additional information to substantiate,
refine or change these hypotheses, or to
dismiss them.
Brainstorming sessions: the SCD team held
two broad brainstorming sessions in which
the participants discussed: (i) the revised
hypotheses and propose means of analyzing
the knowledge gaps; and (ii) a draft of the
overall SCD storyline, that translated the
hypotheses into a full structure around
growth, inclusiveness and sustainability
following the SCD guidelines.
Bilateral consultations: Several rounds of
bilateral consultations with sectorial teams
were held to focus on the remaining
knowledge gaps that could be filled prior to
the elaboration of the overall storyline.
Pulse Survey: A pulse survey was
administered mid-way through the process to
get specific feedback from the broader team
on the approach taken to team engagement
and the value of the SCD exercise to staff
working on Panama. Feedback received104
shed light on areas of strength in team
collaboration, while providing guidance on
possible improvements going forward.
Prioritization workshop: A facilitated
workshop with the broad Panama Team was
held with the objective of soliciting inputs on
identified opportunities within the five
identified priority areas using the SCD
prioritization filters. The workshop resulted
in five elaborated matrices of key opportunity
areas within and across the themes.
RESULTS OF PULSE SURVEY
104 31 respondents from GPs, CMU, IFC and others, for a response rate of 45 percent
July
•Forumulation of Hypotheses
Aug/ Sep
•Team Brainstormings
Aug/ Sep
•In-country data collection
•Bilateral Consultations
Oct
•CN review
•Pulse survey
Nov
•Prioritization Workshop
•Bilateral meetings
Nov/ Dec
•Country Consultations
•SCD Draft Report

102
0%
10%
20%
30%
40%
50%
60%
Bringing togetherand creating space
for all country teammembers tocontribute
Making individualsfeel more
integrated into thecountry team
Integrating multiplesectoral data and
information into aconsistent
developmentstoryline
% o
f R
esp
on
den
ts
Effectiveness of Process Dynamics
Very Effective
Effective
Neither Effective nor Ineffective
Somewhat Ineffective
Very Ineffective
0% 10% 20% 30% 40% 50% 60% 70% 80% 90%
None of the above, the contribution to the SCDreport was the main benefit
I gained access to client and relevant dialogue thathelped my area of work
I was able to link my sectoral challenges to otherrelevant ones in the country and identify common
solutions
I identified opportunities for work collaboration withother practice colleagues
I learned more about the different work areas andteam members of the country team
I understand the country better.
% of Survey-Takers Who Agree
Individual Benefits of SCD Participation

103
ENGAGEMENT WITH PANAMA
The SCD preparation was accompanied by a consultation process in Panama to ensure that all key
stakeholders provided inputs into the deliberations and shared early findings. Two preparation
missions were conducted during the period of August 25-29 and September 29-Oct 3, 2014, in
which the SCD team held meetings with counterparts in Panama from the Government, private
sector, academia and think tanks to get their views on the growth pattern of Panama and its
performance in various dimensions over the past decade.
Following the Concept Note review, a series of consultations were held from November 17th to
20th, 2014 and in early December with a broad range of stakeholders (see Table). During these
consultations, preliminary findings and emerging priority areas were discussed. Viewpoints of the
different constituencies largely confirmed the main storyline and provided feedback and inputs
that assisted in particular with the political economy context discussions of identified opportunities
under the focus themes.
Consultation Participants
GOV. SECTOR REPRESENTATIVES CIVIL SOCIETY ORGANIZATIONS
WATER
Asociación Nacional para la Conservación de la
Naturaleza (ANCON)
Ministerio de Salud (MINSA)/Dirección del Sub-
Sector de Agua Potable y Alcantarillado Sanitario
(DISAPAS)
Centro de Estudios y Acción Social Panameño
(CEASPA)
Ministerio de Salud (MINSA)/Dirección de
Planificación (DIPLAN)
Fundación Natura
Instituto Nacional de Acueductos y Alcantarillados
Nacionales (IDAAN) PRIVATE SECTOR
ENERGY MINING
Secretaría Nacional de Energía (SNE) Cámara Minera de Panamá
Autoridad Nacional de los Servicios Públicos
(ASEP)
Consejo Nacional de la Empresa Privada (CONEP)
LOGISTICS CONSTRUCTION
Ministerio de Comercio e Industrias (MICI) Convivienda
EDUCATION Costa Verde
Ministerio de Educación (MEDUCA) Ingeniería Carpen
SOCIAL PROTECTION TOURISM
Ministerio de Desarrollo Social (MIDES)/ Programa
Red de Oportundidades
Fundación Panamá Viejo
Fundación Amador
Ministerio de Desarrollo Social (MIDES)/ Programa
120 a los 65 BANKING
Ministerio de Desarrollo Social (MIDES)/ Programa
Ángel Guardián
La Hiptecaria
Ministerio de Desarrollo Social (MIDES)/Secretaría
Técnica del Gabinete Social
Multibank
MINISTRY OF ECONOMY AND FINANCE Inversiones Bahía
Dirección de Crédito Público (DdCP) Superintendencia de Bancos
Dirección de Programación de Inversiones (DPI) TRANSPORT & LOGISTICS
Dirección de Inversiones, Concesiones y Riesgos del
Estado (DICRE)
Zona Libre de Colón
Dirección de Análisis Económico y Social Manzanillo International Terminal
Dirección de Políticas Públicas (DPP) Cámara Marítima de Panamá

104
Dirección de Cooperación Técnica Internacional AFRODESCENDANTS GROUPS
Dirección de Gestión Administrativa de Proyectos Alianza para el Desarrollo e Innovación de los
Afropanameños y Fundación Arnold Walters
(ADINA/FAW)
INDIGENOUS PEOPLES Sociedad de Amigos del Museo Afroantillano
(SAMMAP)
Plan de Desarrollo de Pueblos Indígenas de Panamá
Technical and Legal Experts
Consejo Nacional de la Etnia Negra (CONEN)
Mesa Indígena Comisión Nacional Contra la Discriminación (CNCD)

105
Annex 2: Definition of Peer Countries
In order to compare Panama’s performance and structural features, the team has selected six
comparable groups of peers: Central American countries, Latin American peers, upper middle
income countries, the World, structural peers, and aspirational peers. In the case of the former two,
both groups were selected using the ‘Find your friends’ tool, which is mainly based on the World
Economic Outlook database.
STRUCTURAL PEERS
Under this classification, countries with similar characteristics to Panama were aggregated, using
the following criteria for the period 2001 - 2013:
Population between 1.0 and 12.0 million
No land-locked
No fragile state
GDP per capita between 4,000 and 13,000
Direct Investment as a share of GDP higher than 3.5 percent
Credit rating higher than BBB-
This classification delivers the following group of countries:
ASPIRATIONAL PEERS
Under this classification, countries that may be used as good examples of development for Panama
and that Panama may emulate are aggregated using the following criteria for the period 2001 -
2013:
GDP per capita higher than 8,000 dollars
GDP growth higher than 3.5 percent
Inflation below 4.5 percent
Investment to GDP higher than 20 percent
Non commodity exporters
No land-locked
Structural peers Population (million) GDP per capita Direct Investment Credit rating
Bulgaria 7.20 4975 10.3 BBB
Costa Rica 4.86 6438 4.6 BB
Croatia 4.28 11542 3.9 BB+
Dominican Republic 10.60 4228 4.0 B+
Panama 3.79 6407 7.8 BBB
Uruguay 3.40 8566 4.6 BBB-

106
This classification delivers the following group of countries: Aspirational peers GDP per capita GDP growth Inflation Investment to GDP
Hong Kong SAR, China 29810 3.9 1.4 22.4 Estonia 12702 4.0 4.3 28.2 Korea 18145 3.9 3.0 28.4 Lithuania 10089 4.6 3.0 21.0 Panama 6407 7.2 3.2 21.5 Singapore 36840 5.4 2.2 24.3 Taiwan, China 16796 3.6 1.0 20.8 United Arab Emirates 38693 4.1 4.4 21.9
OTHER PEERS
The other 4 comparable groups (Central America, LAC, Upper middle income, and the World) are
directly obtained through the ‘Find my friends tool’.

107
Annex 3: Matrices of Identified Opportunities
ENERGY OPPORTUNITIES
NAME
Managing (reducing)
national energy
demand
Modernizing
(coordination/streamlin
ing) the institutional
framework in energy
Increasing power
generation via
renewables and other
clean energy options
Increasing domestic
transmission and cross
border transmission
Improving rural energy
services
IMPACT ON TWIN
GOALS
Reduces the need for
new production and
transmission lines,
freeing up resources for
social spending; reduces
environmental and social
implications, reduces
brownouts and rolling
blackouts favoring
business and protecting
jobs and labor earnings
Contributes to greater
sustainability of the
energy sector, and
therefore increased
competitiveness; could
improve energy
efficiency, reducing
costs to government;
improving quality of
service delivery and
expanding access to
electricity among the
poor
Lowers costs to
government, frees up
resources for social
spending; increases
private sector
investment; reduces local
and global
environmental
emissions; improve
reliability of the power
system
Enables increased access
to lower cost generation,
therefore reduces
government
expenditures, frees up
resources for social
spending;
Greater reliability in
energy delivery,
increases private sector
investment
Provides services to
communities that have
had no electricity;
Affect health care
services delivery;
improve respiratory
health as people move
away from reliance on
wood for cooking;
improve delivery of
educational services;
create opportunities for
rural business
development and
investment through
providing a supply of
energy, insuring
communications
TIME HORIZON Short term Short to medium term Medium to long term Medium Term Medium to Long term
COMPLEMENT-
ARTIES
Reducing government
subsidies could free up
resources for improving
basic/social services
Opportunity to address
framework for dealing
with environmental and
social issues (serving
other similar sectors)
Reducing government
subsidies could free up
resources for improving
basic/social services
Reducing government
subsidies could free up
resources for improving
basic/social services
Increased access to basic
infrastructure in rural
communities contributes
to rural commerce and
agricultural opportunities
that can help limit
impacts associated with
urbanization
EVIDENCE-BASED
A strict national demand
reduction program in
Brazil (2001-2002)
successfully led to 20%
reduction in demand
Effective governance –
institutions, policies and
regulations – creating the
conditions for markets,
including attracting
High confidence as
evidenced by the
increased expenditures
of the government
through subsidies
Moderately confident.
Relationship between
improved
transmission/interconnec
tion reduces dependence
Evidence regarding lack
of electricity coverage in
rural areas/comarcas is
strong and result in the
lack of economic

108
avoiding brownouts and
blackouts. Also, UK
BIT studies have shown
impact using behavioral
economics; Davis, Fuchs
and Gertler 2014 showed
that energy inefficient
appliance buybacks in
Mexico were an
expensive way to do this;
energy crises in Brazil
and other countries have
been effectively
mitigated through a
reduction in
consumption, thereby
avoiding excess
dependence on
expensive emergency
power generation
investments and
transparent competition,
contributes to economic
growth and access.
(World Development
Report 2002 : Building
Institutions for Markets;
https://openknowledge.w
orldbank.org/handle/109
86/5984)
brought on by increased
reliance on high cost
emergency power
stations. Renewable
energy systems,
including utility scale
wind and solar
photovoltaics , and
natural gas power, have
lower levelized costs
than oil fired power
generation (source:
European Commission
report
http://ec.europa.eu/energ
y/studies/doc/20141013_
subsidies_costs_eu_ener
gy.pdf)
on high cost emergency
power stations. In
Brazil, expanded
transmission systems
enabled rapid
development of
alternative power
generation sources
including wind, solar and
biomass; resulting in
diversified energy
portfolio with greater
energy security and
lower long term
levelized costs.
development. Global
evidence suggests social
and economic benefits of
electrification including
in Brazil, China, India,
Mexico and South
Africa.
(http://www.iea.org/publ
ications/freepublications/
publication/rural_elect.p
df)
POLITICAL
FEASIBILTY
Reduction in wasteful
energy consumption
resulting from a shared
community response
leads to lower energy
related expenditures
thereby freeing resources
for other spending
Transparent and
effective coordination
among energy
institutions contributes to
greater confidence
among consumers and
investors
Affects the budget and
thus puts this activity in
conflict with other
sectoral priorities;
Environmental and
social issues as new
generation could cause
pollution and or use
lands that are in
indigenous areas or of
importance for
biodiversity
Affects the budget and
thus puts this activity in
conflict with other
sectoral priorities;
Environmental and
social issues as new
transmission lines will
cross national parks,
biodiversity areas and
lands of IP
Contributes to
strengthened
relationships with rural
and indigenous
communities
ESSENTIAL PRE-
CONDITIONS
Yes. Offers least cost
option to reduce energy
prices thereby enabling
increased access and
supporting
business/industrial
growth and ultimately
economic development
Yes. Key factor
enabling investments in
other aspects, including
generation, transmission,
efficiency, and access
Yes. Reliable cost
effective electricity is
essential to power
industry and commerce
which enable economic
development
Yes. Reliable cost
effective electricity is
essential to power
industry and commerce
which enable economic
development
Yes. Access to modern
energy services is an
essential precondition for
basic services including
lighting, refrigeration,
cooking, and health care

109
EDUCATION/SKILLS OPPORTUNITIES
NAME
Strengthening targeted public/private
technical education to better respond to
labor market demands
Strengthening monitoring and
evaluation of education with goal of
improving quality
Increasing payments of the CCT
program Beca Universal differentiated
by student grade level (three cycles) to
address high drop-out rates in
secondary education
IMPACT ON TWIN
GOALS
Increases employment opportunities for
youth and increases income generation
Improves indirectly the quality of the
education system and labor skills
Increases job opportunities for youth,
reduce poverty
TIME HORIZON Short to medium: Introduction of
vocational training and bilingual
education, revision of high school
certificates
Medium to long: Impact on labor market
outcomes
Short-term: Participation in 2015 PISA
testing
Analysis of high school drop-outs with
existing administrative data
Long term: Establishment and application
of monitoring and evaluation framework
Short – Medium term
COMPLEMENT-
ARTIES
Increased investment attractiveness
Virtuous cycle of jobs creation
Enhanced competitiveness productivity
Attract investment in education
Enhanced social assistance for poor
EVIDENCE-BASED
Good results in other countries such as
France and Germany, failure of
traditional Education system to prepare
youth.
Literature: Mejores Empleos en Panamá:
El Rol del Capital Humano (WB 2012),
Technical Vocational Education and
Training – Mapping Institutions and
Policies (WB 2014)
Countries that participate in PISA have
evidence of the quality of their education
system
School subsidies for the poor: Evaluating
the Mexican Progresa Program (Schultz
2004)
The impact of the Bolsa Escolar/Familia
CCT program on enrollment, dropout
rates and grade promotion in Brazil
(Glewwe and Kassouf 2012)
POLITICAL
FEASIBILTY
Market open for private services
provision
The country didn’t participate in the last
round
Government has taken first steps
ESSENTIAL PRE-
CONDITIONS
Included in Government’s priority
programs
Link CCT beneficiaries to productive
training
Included in Government’s priority
programs

110
PUBLIC SECTOR INSTITUTIONS: TRANSPARENCY
OPPORTUNITIES
NAME
Meeting Global Forum standards on tax and
financial information sharing (OECD grey list)
Improving public procurement practices
IMPACT ON TWIN GOALS Mitigates reputational risks to avoid potential declines
in foreign deposits, insurance premiums and activities
related to legal and accounting services. By improving
transparency and meeting international standards
Panama will help to ensure the continued high levels
of FDI it depends on (in the absence of a developed
stock market) . Continued poverty reduction and
shared prosperity depends critically strong levels of
FDI, especially in the short term.
Increases accountability and transparency and reduces
transaction costs. Improving the public procurement
practices will improve the monitoring and evaluation of
public investment and spending, improving the efficiency
of public spending. Such efficiencies free up resources
which can be used for strengthening the social assistance
programs of the government that help move people out of
poverty in both the present and the future (in the latter by
breaking the cycle of poverty: Red de Oportunidades).
TIME HORIZON
Short: Changes in regulations and procedures
Medium: A more complete revamping of the
information sharing system
Medium to long: Improvements of existing regulations to
better accommodate public investment project.
COMPLEMENTARITIES
Improving Panama’s standings in the international
community can have spillover effects on major
infrastructure projects due to the link to the continued
presence of high levels of FDI in the country. Of
particular importance is for the energy sector where
resolving transmission line and generation shortages
will require strong investments.
Improving the public procurement system can increase the
quality of services delivery; enhancing both the inputs to
the services, affecting the timeliness of the procurement
process itself and lowering costs.
EVIDENCE-BASED
There is evidence from OECD countries but the
potential impacts for Panama need to be assessed.
Evidence from other countries including Peru and
Argentina, Literature: Panama: Enhanced Public Sector
Efficiency Technical Assistance Project, Report No. 59159-
PA

111
POLITICAL
FEASIBILTY
There has been some movement on this front but it is
not clear that the political will needed to push this
agenda forward is in place.
Substantial work has been done to date by the government.
The country has moved to the use of framework
agreements, thereby complying with Law 22 of 2006
(although the complex infrastructure projects of the recent
years have highlighted weaknesses in these agreements)
and generating savings in time, price and transaction costs.
An e-procurement platform, PanamaCompra, has been
integrated with other systems (DGI and Ministry of
Industry and Commerce). There remains, however a
substantial agenda, particularly the need to shift more
purchases to the PanamaCompra system.
ESSSENTIAL PRE
CONDITIONS
Yes Commitment of the Minister of Finance and Secretaría de
Presidencia. Technical cooperation across government
entities.

112
PUBLIC SECTOR INSTITUTIONS: EFFICIENCY OF PUBLIC SECTOR MANAGEMENT OPPORTUNITIES
NAME
Introducing performance informed
budgeting (PIB) accompanied by
better coordination between
different Government
plans/entities
Developing effective municipal
(and metropolitan) institutions
needed for decentralization and
transfer of governmental functions
Improving fiscal management
including the modernization of
financial planning, debt management
and fiscal risk from disasters
IMPACT ON TWIN GOALS
Allows for strategic allocation of
resources to policy priorities, thus
facilitating focus on achievement of
results on better services to citizens’
special programs for disadvantaged,
etc. The coordination between
different Government plans/entities
allows defining priorities among
competing policies and taking into
account impact of programs on each
other
Enhances efficiency of spending
towards high priority economic and
poverty reduction programs.
Supports service provision and
ability for economic planning to
marginalized communities and rural/
remote areas, and competitiveness of
urban economic agglomerations
Frees up fiscal resources for priority
service delivery and social protection
programs with direct impact on the poor
TIME HORIZON
Medium: Developing and
implementing a PIB approach in the
MEF and line ministries
Long: Better alignment of
government expenditure (both
operational and investment) with
policy goals
Short: Implementation of Law 37 of
2009
Medium: Capacity building under
new framework and design of
metropolitan coordination structures
Short: Introduction of financial planning
information technology tool, Measures to
increase liquidity in the domestic debt
market, formulation of a strategic plan
for fiscal risk management of disasters
Medium: Full-fledged modernization of
financial planning, Implementation of
improved fiscal management practices
COMPLEMENTARITIES
Better management of government
programs and strengthened
accountability of public
administration for results
Better coordination helps reduce
inefficiency in resource allocation,
and avoid duplication of functions
and activities across the government.
Effective coordination facilitates
coherence and transparency within
the government
Rural and local services in water
supply and sanitation, education,
IP economic opportunities
Improved transparency, increased
resilience, improved public procurement,
more resources available for priority
social programs and services

113
EVIDENCE-BASED
Performance Informed Budgeting has
been implemented in the majority of
OECD countries through program
budgeting approach
Outside the advanced OECD
countries with multiple examples of
central coordination systems for
design, implementation and
monitoring implementation of
important government policies, e.g.
UK, Canada, emerging economies
have improved their performance
through better coordination,
including Brazil, Chile, Colombia,
Costa Rica, Lithuania, etc.
Successful local municipal
development programs implemented
in countries such as Chile, Colombia,
Indonesia, or Tunisia demonstrate the
improvement in planning, investment
financing, service delivery, citizen
engagement and central government
oversight and
IMF Article IV (IMF 2014)
Panama – Disaster Risk Management
Development Policy Loan with a
Catastrophe Deferred Drawdown Option
No. 60719 (WB 2011) Non Lending
Technical Assistance on Debt
Management (WB NLTA 2010)
Public Debt Markets in Central America,
Panama and the Dominican Republic
(IMF 2007)
POLITICAL
FEASIBILTY
There is a strong commitment to
better management of government
programs on the part of MEF
(Dirección de Políticas Públicas,
Dirección de Programación de
Inversiones). DIPRENA declares its
commitment to the objective
however requires substantial capacity
building
High High
ESSSENTIAL PRE
CONDITIONS
Yes Yes Yes

114
PUBLIC SECTOR INSTITUTIONS: ADEQUACY OF REGULATORY FRAMEWORK OPPORTUNITIES
NAME
Adopting modern mining
regulatory framework to promote
adequate oversight, benefit sharing
and environmental/ social
sustainability
Enforcing consistent social and
environmental safeguards
regulation and standards across
sectors
Strengthening financial sector
regulation
IMPACT ON TWIN GOALS
Contributes a potential share of GDP
up to 10 percent. Contribution to
budget through royalties and
concessions. Adequate benefit
sharing towards bottom 40 percent
Ensures sustainability of present
investments, adequacy of natural
resource base for future growth.
Safeguards the rights of marginalized
groups and reduces social conflict.
Ensures resilience of financial sector
to a range of potential shocks,
support sustainable expansion of
financial services to excluded
populations.
TIME HORIZON
Tension in terms of timing: Short:
Investment opportunities
Medium: Coherent framework and
institutional structure
Short to Medium
Medium
COMPLEMENTARITIES
FDI, fiscal, growth, export,
environment, social inclusion.,
particularly of IP
Direct link to infrastructure,
territorial planning and extractive
sectors.
Resilience to Natural Disasters.
Support FDI
Links to fiscal, growth, infrastructure
finance, social inclusion
EVIDENCE-BASED
Literature: Stanley, M. and E
Mikhaylova, 'Mineral Resource
Tenders and Mining Infrastructure
Projects Guiding Principles',
Extractive Industries for
Development Series #22, September
2011,
EPA/ OECD/ WB models for
environmental impact assessment
and social safeguard policies in large
transport, hydropower, mining
industry, coastal developments
demonstrate mitigation of risk
Sound financial systems bolster
sustainable growth
POLITICAL
FEASIBILTY
Ongoing dialogue with civil society
(mesa rotonda) brought 54
agreements, however concerns need
to be addressed under strong political
championship.
Medium. ACP model for Canal
related infrastructure can serve as
model.
Medium: Political will uncertain.
ESSSENTIAL PRE
CONDITIONS
Yes Yes Yes

115
INDIGENOUS PEOPLES OPPORTUNITIES
NAME
Increasing the quality, access and
cultural pertinence of health and
education services in indigenous
communities (within and outside
comarcas)
Supporting the economic development
with identity especially in relation to
traditional agriculture; payments for
environmental services; robust benefit
sharing arrangements; and sustainable
tourism.
Strengthening and Formalizing
Indigenous Peoples’ participation in
Government decisions and processes
that concern them
IMPACT ON TWIN
GOALS
Increases access and health service
delivery: (i) food & nutrition; (ii) Maternal
and child health with high quality &
cultural pertinence.
Increase multicultural education
Revitalize IP cultures
Reduce catastrophic health expenditures
Increases potential for income generation
for both extreme poor and poor, especially
if specific focus on women is included.
Improves effectiveness & cultural
pertinence of investments w/ IPs, while
improving Indigenous women’s agency
should contribute to reducing poverty and
increasing shared prosperity
TIME HORIZON
Short: Access
Medium: Quality
Long: Cultural pertinence
Medium – long term
Short: Laws
Medium: Capacity
COMPLEMENT
ARITIES
• Social protection (conditional cash
transfers, school scholarship program)
• Water & sanitation
• Infrastructure (access to)
• Youth leadership
• Crime prevention
• Performance bared budget for health –
catastrophic insurance Social protection
(conditional for the Indigenous Peoples)
• Monitoring water and epidemiology
• Gender-specific interventions
Empower IPs resources owners as partners
in national development &
competitiveness.
National Energy and Resource needs:
This would create a platform to build trust
and work strategically with IP on projects
of national importance. It would do so by
officially recognizing their territorial
authorities and providing an opportunity
for their direct engagement in the planning
and implementation of policies, programs,
and projects that affect/benefit their
communities.
Better management of NRM
Youth leadership
Reduce social conflict
Social cohesion
EVIDENCE-BASED
Health: The IP Development Plan cites an
2010 IDB study, breaking down the factors
that have affected indigenous peoples
access to health: 11.3% did not demand
health services due to their cost; 64.2%
due to the long distances to a health center;
44% due to lack of transportation, as well
as having felt mistreated by the health staff
Norway, Canada , Peru, Australia , Alaska
Programa para el Desarrollo Empresarial
Indígena: While there has not been a
comprehensive evaluation of outcomes,
the program supported several Indigenous
cooperatives and companies develop,
improve, and commercialize their products
Government to IP
Results internationally
Canada, Brazil, Bolivia
Present indicators of poverty in IP areas
demonstrate lack of effectiveness in
investments
Baseline investment data in IP territories.

116
and low participation in program design.
Moreover, cultural differences and
language limitations limit health
education. Only 20% of the population has
health insurance, compared to 50% of the
non-indigenous population. Generally the
study concludes that the IP population
generally does not use health services
when they are sick or injured.”
Reference: Plan Nacional de Desarrollo
Integral de los Pueblos Indígenas en
Panama citing, BID. Inclusión Social en
Panamá: La población indígena. Julio
2010. P. 21
Education: The Plan cites a Save the
Children study on school drop out rates by
age group. Only 65% of Ngäbe and Buglé
children between 6 and 12 years old attend
school, regardless of where they live; 43%
of children between 13 and 19 and 7.5% of
youth between 20 and 24.
(coffee, forestry, cacao, honey, handcrafts,
etc) Video available online.
Costa Rica, PES = US$3 million per year
to IP communities for 10 years + new
anteproyecto de ley to regulate Payments
for Environmental Services (appears to
currently be in the Assembly) presented in
Aug. 2014
We could review the results from the
multi-sectoral program financed by IADB
in Panama in Darien
POLITICAL
FEASIBILTY
Health:
Resuelto N° 4376 del 25 de agosto de
1999, Ministerio de Salud, Medicina
Tradicional, Gaceta Oficial N° 23,880, 7
de septiembre de 1999
The Ministry of Health has created a unit
dedicated to designing culturally pertinent
indigenous health public policy.
Education:
Passing of 2010 Bilingual and Intercultural
education Law No. 88
The Ministry of Education’s “Muevate por
Panama” literacy program has provided
literacy training to over 20,000 people in
the comarcas between 2007 and 2012.
Politically feasible to start with
entrepreneurial, tourism, and PES
activities. Government and IP
championing through IP national devt
plan.
High levels of mistrust (ej. Martinelli env
law reform), internal conflict (ej. Naso
King), and historical lack of sharing in
benefits of hydro and other extractive
industries (ej. Bayano), would make
extractives and benefit sharing a more
difficult, long term goal.
Yes, IP intersectoral plan, proposed by IP
authorities to govt after 2-year internal
consultations with govt participation.
IP mesa 12 congresses united

117
ESSENTIAL PRE-
CONDITIONS
Health:
-Investment in health infrastructure
-Supply of needed medicines
-Bilingual medical staff
-Support for the practice traditional
medicine (practiced by traditional healers
and midwives).
Education:
-Implementation of Law 88 by investing
state funds, instead of exclusively
international grant money.
-Staffing schools in indigenous areas (incl.
comarcas) with teachers who are fluent in
the pertinent language and who will allow
and encourage speaking the native
language.
-specialized curriculums
-textbooks in indigenous languages
-continuous teacher attendance in schools
-increased teacher commitment to teach in
indigenous schools
-Increased accountability of teachers
towards parents and students (currently
teachers register high absenteeism)
-Principals who foster interculturality
instead of prohibiting it.
- Baseline mapping of overlap of IPs and
key national watersheds/protected areas
(to make argument of environmental
services being provided).
- Close infrastructure and access to
financing gaps (especially in transport,
WSS, electricity, and productive infra)
- Environment of trust
- Governance framework effective
- Land tenure security
- Carried out as part of National
Development Plan for IPs with significant
participation of IP authorities in design
and implementation.
- Law projects approved
- New institutions have clear mandate and
budget, and support to build capacity
- IP National Development Plan moving
towards implementation
Implementation of Law 72 to finalize
pending collective land titling through IP
Land Titling Directorate (part of ANATI )
formed in 2010

118
WATER OPPORTUNITIES
NAME
Implementing integrated
water resources management
plans in selected priority
basins outside Canal
watershed
Scaling up integrated disaster
risk planning coupled with
climate adaptation measures
Reducing pollution by
improving sewerage
treatment capacity and
access to quality sanitation
services
Streamlining regulatory and
institutional functions across
Water sector agencies
IMPACT ON TWIN
GOALS
Contributes to economic
growth (Hydro production,
tourism, agriculture)
Reduces income losses from
natural disasters, enhances the
coping mechanisms and
diversifies the economic base
for the most vulnerable groups
Sanitation Increases
welfare/health
Waste (bottom 40%)
Drainage Water
Sustainability (floods)
Treatment
Draws in investment
Enhances efficiency of
resource allocation and
implementation capacity for
high priority programs and
disadvantaged groups
TIME HORIZON
Short: Planning
Medium to Long:
Implementation:
Medium to Long
Short: Quality for those with
access
Medium: New access,
community management
Long: Quality of life
Medium
COMPLEMENT-
ARTIES
• Energy - sustainability of
clean energy sources
• Indigenous Peoples –
ensuring sustainable use of
natural resource base
• Hydropower
generation
• Indigenous People economic
opportunities/ livelihoods
• Marginalized groups (rural
IP, Colon)
• Indigenous population living
in urban areas
• Crime Violence
Institutional Capacity for
Environmental and Social
management
EVIDENCE-BASED
Canal Watershed management
model has demonstrated that
efforts lead to reduced
deforestation and efficiency of
water consumption by
different users
Climate projections forecast
increased rainfall as well as
increased occurrence of
extreme weather events
Integrated urban water
management in Medellin
(Colombia), Monterrey
(Mexico) and Sao Paolo
(Brazil) have shown significant
improvements
• In 2014 ASEP (Regulatory
agency) only drafted 371
resolutions for the WSS
sector, compared to 5578
and 7834 in the electricity
and telecommunications
sector respectively.
• Tariffs have not been
revised since 1982 (decrease
by 50% of adjusted for
inflation)
POLITICAL
FEASIBILTY
High
High
Colon, Panama Bay and basic
sanitation is a national priority
for the current government
Medium
ESSENTIAL PRE-
CONDITIONS
Yes
No
Yes

119
Annex 4: International Finance Corporation – Sector Notes
DATE: November, 2014
SUBJECT: PANAMA: Mining Sector Briefing – One Pager
Overview of the Energy Industry in Panama
Although mining has a long history in Panama dating to pre-colonial times, advanced development
did not start until in recent years, following the commencement of operations of the Molejon gold
mine. Mining in Panama today is a US$553mn industry, representing about 2.1% of GDP.
However, FDI in mining stands at just 0.4% of GDP. Current activities include gold (12m oz
identified. 68.4k oz produced in 2013, or 35% growth y-o-y, US$116 million in exports, or
Panama’s top mineral export, going to North America), copper (22.7mnt identified), silver (25,000
oz identified) and molybdenum.
Key Players
The main players are Petaquilla Minerals, Minera Panama, S.A., Minera Cerro Quema, S.A., and
Greenfield Resources, Inc. Petaquilla owns the Molejon gold mine in Colon, which is likely to
become the primary source of gold output in the years to 2018, per BMI. Minera Panama, S.A.,
with Canada-based FQM holding an 80% ownership stake, owns the 5,900 ha, US$6.43 billion
“Cobre Panama” project, which is expected to come online in 2017, have a mining life of at least
30 years, and produce annual amounts of 320,000 tons of copper, 100,000 oz of gold, 1.8 million
oz of silver, and 3,500 tons of molypdenum. FQM’s cash costs of copper per latest audited
financial reports (2013) were at US$1.30/lb for copper and are an estimated US$1.32/lb-
US$1.48/lb for 2014, compared to major copper projects under Barrick Gold Co. in Zambia
(US$2.29/lb for the Lumwana mine in 2013, US$1.90/lb-US$2.10/l est. in 2014) and Chile
(US$1.60/lb for the Zaldivar mine in 2013). Minera Cerro and Greenfield Resources are planning
to invest over US$100 million each in mining projects.
Recent trends
Mining output has more than doubled following annual growth rates of between 20% and 30%
since 2008. According to the General Comptroller’s Office of the Republic, the mining sector grew
4.6% in 2009 and in 2012 accelerated to 30%, surpassing the construction (29.3%), transportation
& telecommunications (11.2%) and financial intermediation (10.2%) sectors. The Comptroller
also reported that the value of gold exports declined 96.6% in 2014. Between January and March
2014, only US$1 million was exported, as compared to US$31 million in 2013.
Regulatory Framework and Government Role
Article 257 of Panama Constitution provides for state ownership of minerals and authorizes the
Directorate General of Mineral Resources (DGMR) under Min. of Commerce and Industries
(MICI) to oversee & grant exploration and/or extraction concessions. The Code of Mineral
Resources of Panama (CMR) is the main legal body governing activities in the mining sector; it
has been amended, abolished and re-established several times. Law 32 of February 1996 regulates

120
the extraction of nonmetallic minerals used as building materials to safeguard the integrity of the
environment, public works and population centers. Law 11 of March 2012 followed the 2011-12
Ngäbe-Buglé protests and prohibits mining in indigenous lands (e.g., Cerro Colorado) and requires
prior consultation of indigenous authorities for hydroelectric projects. Law 13 of 2012: Mining
companies must pay minimum 4% royalty for gold & 5% for copper, maximum royalties of 8%,
however, companies granted concessions under Law 9 of 1997 (e.g., Pentaquilla Gold) are not
legally required to do so. Includes provisions to incentivise investment in local infrastructure
projects and social development programs in surrounding communities. The National
Environmental Authority (ANAM): Reviews & approves environmental impact studies related
to mining concessions and ensuring their compliance in accordance with local legislation. The
National Directorate of Mining Resources (NDMR): Charged with licensing. Lacks
independence and power to influence policy and implement changes, and licensing program is
slow, with requests lingering from the 1990s.
Main Challenges, Emerging Opportunities
China growth slowdown likely to drive down copper & iron ore prices in the coming years, could
force delays. Rising treasury yields may affect gold projects. E&S issues will be more closely
followed, and Petaquilla has faced issues in this area in recent years. Indigenous peoples’
resistance to mining in Panama is centered on inadequate consultation, lack of trust and weak
transparency, and protets in recent years have revolved around Cerro Colorado, one of the largest
porphyry copper reserves known and not exploited worldwide. Cobre Panama does not sit on
indigenous peoples land and at present is not a focal point of contention. Cobre Panama is projected
to have significant development impacts in the form of investment, job growth, and payments to
workers.
Future Perspectives
1. The future of the mining sector is uncertain given the complexities of economic, political
and social factors. The only existing large-scale operation is that of Minera Panama
(copper) which is in hands of the Canada-based First Quantum Minerals. Other projects
are facing serious issues as is the case of the Petaquilla gold mine that has financial
difficulties and other minor developments include Minera Santa Rosa that has
environmental and social constraints. There is much pressure resting on the success of the
Minera Panama to assure the well-being of the industry and its growth for the future.
2. The local IFC team does not foresee significant investment in the sector other than that of
Minera Panama, at least in the next five years, given the lack of a strong regulatory
framework and the opposition of indigenous and local communities. Public opinion may
become positive over time but this will require a strong alliance between the government
and the private sector to make sure that royalties paid by mining companies are invested in
the communities, and communities are engaged in the projects. Currently, we understand
that there is no mechanism of accountability of these royalties and institutional capacity to
manage said royalties is also limited.

121
DATE: November 2014
SUBJECT: PANAMA: TRANSPORT AND LOGISTICS Sector Briefing
Overview of Transport and Logistics T&L in Panama
Panama has a network of ports that handle containerized, bulk, liquid and general cargo, as well
as passengers in cruise terminals. Panamanian seaports are divided into two groups: state ports and
private ports. State ports are operated by the Panama Maritime Authority and provide dockage and
other related services for local users and short-sea services. The Panamanian maritime industry
represents 20 percent of GDP and is the fastest growing sector in the national economy. Air
transport is one of Panama’s fastest growing sectors thanks to Panama’s Tocumen International
Airport. Panama has 27 public and 41 private airports. The main projects in roads and railroads for
2014 onwards are expected to be contracted by the government using turnkey contractual
arrangements.
Key Players
The most representative international players that develop, invest, own, and operate the main ports
in Panama are Hutchinson Port Holdings from China, SSA Marine a subsidiary of Carrix from
Seattle, Evergreen Marine Corporation from Taiwan, China and, PSA a subsidiary of the Port of
Singapore Authority. In aviation, the Autoridad Aeronautica Civil de Panama monitors and
enforces international regulation for civil aviation. Moreover, Copa Airlines is an important
stakeholder of airport development. Copa Airlines is Panama’s flag carrier and it is listed in the
New York Stock Exchange. In 2013, Copa reported US$2.6 billion dollars in revenue and US$427
million dollars of net income. On the other hand, the Panama Canal Railway Company, a joint
venture between Kansas City Southern and Mi-Jack Products provides railroad transportation for
passengers and containerized cargo between Panama City and Colon City under a 50-year
concession. On roads and infrastructure, in 2010, the National Highway Agency was created after
the Government bought ICA’s concession of the South Corridor.
Recent Trends
Even though Panamanian ports rank top with the most volume of cargo moved in the region, in
2013, the ports closed with 6 million 561 thousand TEUS or 4.6% less traffic than the previous
year due to labor strikes and the decline of exports to Venezuela and Colombia. However, during
the first nine months of 2014, Panamanian ports mobilized 5 million 46 thousand TEUS or 1.9%
growth when comparing the same period in 2013. The expansion of the Panama Canal will be
completed in 1Q16 at a cost of US$5.25 billion, the expanded Canal will double transport capacity
from 300 million tons to 600 million tons. In recent years, the Government has invested heavily in
expanding Tocumen airport and at the same time opening and integrating with smaller airports
throughout the country. Just recently, Tocumen expanded operations with the operations of the
North Terminal. This terminal added 21,000 square meters of operational space. Equally
important, the trend for construction and development of roads will be strong through government
driven initiatives that in some cases might involve concessions. The process allowed international
companies to actively compete for these projects and as such, expectations and perceptions are

122
deemed transparent. Important construction companies such as Odebrecht and FCC have an
important portfolio in Panama.
Regulatory Framework and Government Role
Law 80 of 2012 introduced new and updated incentives and regulations related to the hospitality
industry, cruise ships infrastructure, convention centers, and marinas among others. The benefits
include tax exemptions, import exonerations, certificates and others.
Main Challenges and Emerging Opportunities
IFC’s limitation is the fact that the Government is executing the projects under turnkey
arrangements so preventing the IFC to invest directly. For this reason, IFC is starting to consider
financing solutions for construction companies who are facing constraints in obtaining
short/medium term financial instruments. There has been interest from FCC and potentially other
construction companies.
Future Perspectives
a. Ports: Given the expectations surrounding the soon-to-be-completed expansion of the
Panama Canal, investments to expand in existing ports and launch of potential new
ports is expected to continue. While investors perceive Panama positively in this regard
given its location and stability, many could choose to wait for the expansion to be
completed to determine new opportunities. Value-added logistics services are a rising
trend and catering to the increase in Canal traffic will become a key driver in the future
as well.
b. Airports & Roads and Railways: Researchers and residents alike believe that Panama
is the “construction phase” and this trend will continue to be a key focal point for
government driven initiatives. Most concessions are granted to private companies
through a transparent bidding process, but designed as turnkey in nature; therefore,
financing opportunities for IFC is limited but will continue to attract big international
players such as Odebrecht and FCC.

123
DATE: November 2014
SUBJECT: PANAMA: Agro-industrial/manufacturing Sector Briefing
Overview of the Agro-industrial/manufacturing Industry in Panama
The agro-industrial/manufacturing industry has been occupying a relatively marginal position in
Panamanian economy, even after the commercial opening with the country’s entrance to the World
Commerce Organization in 1997. Today, the sector accounts for 5.1% of the total country’s GDP,
while five years ago, it represented about 7% of the national economy. Its main activities are
alimentary (mainly meat, fish, fruit) and beverage products, paper and paper goods, mineral (not
metallic) products, elaborations from metal (not reparation), other kinds of transport equipments
and furniture. Even though manufactured products do not represent much of the GDP, they
comprise around 78% of total Panamanian exports.
Key Players
The main players in the sector include Grupo Melo, Cerveceria Nacional, Rey Holdings, Grupo
Calesa, Industrias lacteas, Empresa Panameña de Alimentos, Cochez y Cia, Tubotec, Plastiglas
and Papelera Istmeña. Main segmets are agroindustrial, food and beverage, construction material,
paper, plastic and PVC goods.
Recent Trends
The agro-industrial/manufacturing industry in Panama registered a 2.7% growth during 2013,
mainly driven by construction materials such as cement, lime and plaster, followed by non-
alcoholic beverages. Meat production segment, instead, has decreased over the last year. Panama's
economy was generally supported by the relative strength of domestic consumption, which was
reflected in the dynamism of several agro-industrial/manufacturing and services activities. In
particular, according to the IMAE, household demand contributed to the rise in the production of
poultry, dairy (each up by 10% year-on-year), and non-alcoholic beverages (up by 9% year-on-
year). Households also played a key role in the dynamism of retail activities, such as fuel
consumption and car sales (which rose by 9% and 6% year-on-year respectively), as well as in the
overall growth of electricity and water production (each up by 4% year-on-year). The forecast for
the next 3 years indicates a growth in industrial activity of 8.2%. 4/5% and 3.5% respectively for
2014, 2015 and 2016.
Regulatory Framework and Government Role
The Ministry of Commerce and Industry (MICI) sets the regulatory framework for the industrial
and agro-industrial/manufacturing activities, with the purpose of promoting the development of
FDI, industrial activity and exports. PROINVEX is an agency for investment attraction and export
promotion in Panama, ascribed to the MICI, which manages a One-Stop-Shop Integrated
Information System that allows the investors to easily identify all the instruments that the National
Government has available for the FDI. The agency is focused on investment promotion in strategic
sectors set by the National Government’s Strategic Plan 2009-2014.

124
Several invectives for industry have been implemented in Panama in order to promote FDI,
including fiscal exoneration, special and migratory labor benefits, and special customs regime. The
whole legal framework includes:
Law for Investment Stability (Law 54/1998)
Law of Special Economic Area Panama Pacific (Law 41/July 2004)
PanamaEmprende (Law 5/January 2007)
Law for Industrial Promotion (Law 76/November 2009)
Law for Exports Promotion (Law 82/December 2009)
New Law of Free Zones (Law 32/April 2011)
Industrial Promotion Certificate (CFI)
Main Challenges and Emerging Opportunities
The sector has been growing less rapidly than the rest of the economy, decreasing its relative
contribution to the total GDP. Exports are a key factor for the strengthening of the sector, given
that the market is facing continuous changes and high level of competition. The Panamanian agro-
industrial/manufacturing industry’s growth over the last years seems to be too dependent on the
construction activity, which could be a challenge. Nevertheless, the Government’s efforts in
promoting industrial activity by creating dedicated bodies and special legislation make Panama
one of the most attractive countries in Latin America for doing business. In the most recent Doing
Business 2014 Report, it was actually ranked #1 in Central America and #5 in Latin America,
which represents a good opportunity for investors.
Future Perspectives
a. Given that more than half of the country’s population works in the agro-industrial/agro-
industrial/agro-industrial/manufacturing sector, it will continue to be a driver of
development as well as a sustainable option for Panama. Local commercial bank
financing is readily available for said entities given their successful trajectory in Panama.
That being said, two of the major public banks focused on this sector – Banco Nacional
de Panama and Banco de Desarrollo Agropecuario – are rumored to be consolidating into
one entity which may cause credit delays for those in need and there is also a planned
revision of agro-subsidies that would affect credit, but access is nonetheless expected to
remain high.
b. In order to remain competitive against other older and more experienced competitors,
there is an opportunity for companies to invest in new equipment and methods that would
enable processing more efficient.
c. There is potential opportunity for growth in the lactose/dairy business with investments
made in technologies that would augment productivity and supply.
d. As with other sectors, ensuring the maintenance of a solid base of talented and skill-
specific human capital will be important.

125
DATE: November 2014
SUBJECT: PANAMA: Financial Sector Briefing
Overview of the Financial Industry in Panama
Panama has the largest banking sector in Central America in terms of assets and number of banks,
and is considered stable and well regulated. The Panamanian International Banking Center is
mainly private and is made up of 48 general-license banks, 29 international-license (offshore)
banks and two state-owned banks. Additionally, 13 banks maintain representative branch offices
in the country.
Banks are mainly deposit driven (80%), and the second source of funding is credit lines (17%).
Total International Banking Center (IBC) assets account for US$118 billion (first semester 2014).
Assets of general license banks total US$84 billion, Off-Shore Bank assets total US$22.6 billion,
while SOEs hold US$11.1 billion in assets. s of end 2013, the sector accounted for 7.6% of total
Panamanian GDP, increasing by 9.6% in 2013.
Key Players
The Banking sector is dominated by the top six banks (Banco General, Banco Nacional de Panama,
Banistmo, Bladex, Global Bank and BAC) which together account for almost 65 percent of the
market share (based on assets). Of the top six, there are two local banks, one SOE, and the
remaining are international banks. The remainders of banks in the sector have less than 5 percent
of market share each. Besides banks, there are 575 registered NBFIs (Dec. 2013) with total assets
of US$1 billion, 593 Coops with assets totaling US$1.8 billion, and Microfinance Institutions,
broken down into many small entities. The insurance market is concentrated, with ASSA,
Internacional de Seguros, MAPFRE, Assicurazioni Generali and Aseguradora Ancon as the top
players. In the reinsurance market, Panama currently has no significant role, however recent news
articles have suggested that Panama will try to position itself as the new reinsurance hub for Central
America. Current market participants include Alliance Re Reinsurance Suisse, Barents Re,
Colonial Re Reinsurance Company.
Recent Trends
The banking system in Panama has seen a significant change in market participants during the past
five years as U.S. and European entities affected by the financial crisis have exited the region,
including GE, HSBC and, most recently, BBVA and Citibank. Both the Panamanian Centro
Bancario Internacional (CBI) and the National Banking System’s assets have been growing over
the years.
Regulatory Framework and Government Role
The CBI was formally created in 1970 through Decree N. 238 which reformed the Banking Regime
and created the Comision Bancaria Nacional (National Banking Commission) as the supervisory
body. In February 1998, Decree 9 was passed to introduce a new regulatory framework and to
move away from the self-regulation philosophy that had been the norm in Panama for the previous

126
two decades. The new legislation established a framework with a regulator having clear powers
and financial autonomy: the Superintendencia de Bancos de Panama (SBP), replacing the
Comision Bancaria Nacional.
Main Challenges and Emerging Opportunities
There is growing international pressure to increase the exchange of banking information and shut
down tax havens has placed Panama among a handful of jurisdictions under increasing regulatory
scrutiny. Panama is making relevant efforts to address this pressure, and was removed from
Colombia’s gray list where it was placed in the first half of October 2014. Panama is also currently
evaluating methods to ensure compliance with OECD and GAFI standards to avoid these gray lists
as well. That being said, perception regarding Panama’s potential incorporation to these lists may
affect investor confidence in the country; however, foreign investments have continued to grow.
Future Perspectives
a. Panama’s financial sector is growing, has good asset quality, is profitable, and thus
attractive for investors. Concerns may arise from potential investors as perceptions
regarding potential inclusion in gray lists could possibly reduce investors’ appetite for
the industry. Nevertheless, it is unlikely that Panama be placed on a gray list in the long
term given Panama’s considerable work and progress on resolving issues related to the
same. Investor confidence appears to remain strong and FDI remains high.
b. Given the large number of players in the market, it is possible that the banking sector
may undergo consolidations, and the trend shows growing interest of local banks to also
expand operations further in the region.
c. In addition, the insurance market’s penetration appears to be low as compared to regional
counterparts and there may be some growth opportunities in the insurance and
reinsurance markets in the future as Panama seeks to launch itself as a reinsurance hub
for Latin America.

127
DATE: November 2014
SUBJECT: PANAMA: Energy Sector Briefing
Overview of the Energy Industry in Panama
The energy sector in Panama has been evoluting significantly since its restructuring and
privatization in 1997, when the Law 6/1997 set the regulatory framework for the Panamanian
electricity market. Since then, from 984 MW of installed capacity the market has expanded rapidly
and now has 2,695 MW (first semester 2014). Historically, the production matrix was supplied by
thermal or hydro plants (around 40% and 60% respectively). Today, with the recent installation of
a 55-MW wind plant and a 2.4-MW solar plant, the matrix also includes a 2% of renewables (other
than hydro), in addition to 42% of thermal and 56% of hydro capacity. The sector accounts for
2.6% of total GDP.
Key Players
The energy sector in Panama is made up of power generation, transmission and distribution. On
the generation side, there are three types of companies which compete in an open competitive
market: generators, co-generators, and self-generators. This market is mostly private and the main
players are: AES Panama’, GDF Suez, Enel Fortuna, Panama Canal Authority (ACP), AES
Changuinola. Transmission is a natural monopoly and thus regulated. ETESA is a state-owned
entity in charge of operation and maintenance of the high voltage transmission network. The
system consists of two transmission lines, with the third line currently under construction and the
fourth in pipeline. Panama is member of regional grid SIEPAC, of which Costa Rica, Nicaragua,
El Salvador, Honduras and Guatemala are also members. There is also renewed interest in the
proposed 400-MW interconnection with Colombia (ICP) and the project is at
studies/environmental assessments phase. With respect to distribution, there are three regulated
service providers, covering different geographic areas of the country: EDEMET, ENSA, EDECHI.
These companies are controlled by multinational firms with the State of Panama holding a minority
stake. For non-regulated users (demand >100kW), they can either purchase their energy needs
through bilateral contracts with prices freely agreed upon parties and/or purchase the service from
a distribution company at regulated tariffs.
Recent trends
The power sector in Panama is currently facing a crisis resulting of inefficient regulatory
framework, lack of institutional and technical capacity, transmission constraints and a currently,
hydro-focused generation that is balanced with expensive liquid fuels during dry seasons.
Panamanian spot market prices are the highest in the region, ranging between US$240/MWh and
US$300/MWh during the last months.
Regulatory Framework and Government Role
Law 6 of February 1997 and subsequent resolutions set the regulatory and institutional framework
for the Panamanian electricity public service. The law states that the Transmission, Distribution
and Commercialization of electric energy are regulated, while Generation is not regulated. The

128
key governing institutions include the Secretariat of Energy (SNE), the Transmission Authority
(ETESA), the Distribution Authority (CND) - part of ETESA, and the Energy Regulatory
Authority (ASEP) – which rules the electricity market and other public services. Law 11 was
enacted in March 2012 granting protection for indigenous groups. Law 11/2012 requires the prior
consultation of indigenous authorities or hydroelectric projects. Indigenous groups have argued
that Law 11 is limited in its scope in that it does not ban hydroelectric projects in their territory.
Other relevant laws include Law 45/2004, Law 44/2011, Law 37/2013, which respectively
promote the construction of mini hydros and set tax incentives for the construction of wind and
solar plants.
Main Challenges and Emerging Opportunities
The main challenges are centered on Panama’s ability to address the consistently-growing energy
demand. This includes institutional capacity building and strategy preparation, as well as
addressing transmission, generation and distribution deficiencies. On the institutional front,
strategic coordination between key existing agencies remains the main challenge.
Future Perspectives
a. Despite the challenges identified above, Panama has a functioning spot market system and
a well regulated sector. Though strategic planning as a whole has been a challenge, the
future is optimistic as the current administration has expressed their interest in supporting
and strengthening the sector. For private sector players, there is a role to construct and
operate renewable energy plants to aid in the diversification of the matrix and market rules
are quite clear for the same. Transparency in bids is also a positive factor for private
investors. Transmission may prove to be an ongoing challenge, but given that line 3
construction is already underway and line 4 is in the design stages to address growing
demands, there is reason to believe that certain constraints will be addressed in the mid-
term and thus investor confidence is expected to remain high.
b. LNG – There exist opportunities to bring liquefied natural gas to the region with a terminal
and processing plant in Panama, which would strengthen regional integration and change
the energy landscape, including further driving down of the electricity prices, in Panama
in particular. Recently the Panamanian government decided not to renew the concession
for the construction of a US$1.2 billion 550-MW LNG plant that had been awarded to a
private, local company in 2013, because it was unable to secure financing, as a result of a
weak PPA that had been granted in the prior government. Therefore, a key initiative for
the current administration is to construct a new PPA and put out a tender in the next 12
months with a bankable PPA.

129
DATE: November 2014
SUBJECT: PANAMA: Tourism Sector Briefing
Overview of Tourism in Panama
Tourism is an important sector for Panama given that the total contribution of Travel & Tourism
to GDP was of US$5,829.4 m (13.9 percent of GDP) in 2013, and is forecast to increase by 7.1%
in 2014, and by 6.2% p.a. to US$11,383.6 m (15.6% of GDP) by 2024. In 2013, the total
contribution of Travel & Tourism to employment, including jobs indirectly supported by the
industry, was 13.5% of total employment (234,000 jobs). This is expected to increase by 2.6% in
2014 to 240,000 jobs and grow by 2.7% p.a. to 315,000 jobs in 2024 (15.9% of total). In 2013,
Travel & Tourism directly supported 102,500 jobs (5.9% of total employment). This is expected
to increase by 2.8% in 2014 and by 2.8% p.a. to 139,000 jobs (7.0% of total employment) in 2024.
Travel & Tourism investment in 2013 was US$715.4 mm, or 6.0% of total investment. It is
forecasted to increase by 12.1% in 2014 and by 6.0% p.a. over the next ten years to US$1,443.0m
in 2024 (6.9% of total).
Key Players
Copa Airlines is Panama’s flag carrier and it is listed on the New York Stock Exchange, with
Panama serving as the airline’s hub out of Tocumen Airport. Copa reported US$2.6 billion dollars
in revenue and US$427 million dollars of net income. The Panama Tourist Authority is the
government agency in charge of promoting tourism in Panama and at the same time monitoring
and implementing the aforementioned incentives. Asociación Panameña de Hoteles (Apatel) is the
local hotel association and its main goal is to promote tourism through investments in hotel
infrastructure. Finally, Aventuras 2000 is part of Grupo Colon 2000 who owns the cruise port in
the Atlantic. Aventuras 2000 manages the entry point at Colon and at the same time provides
tourist services throughout Panama.
Recent Trends
Between January and September, 34 operation licenses were granted for new hotels. The combined
investment is US$103 million and 90% expected to be built in areas beyond the city. These include
Chiriqui, Los Santos and Bocas del Toro. In addition, two luxury hotels will open in Panama in
the next couple of years. During the first five months, the number of tourists in Panama increased
by 3.5% compared to the previous year. This is approximately 33,860 more tourists than the
previous year thus putting the mark over more than a million tourists. Around 42% of tourists that
arrive to Panama reside in countries where Spanish is not the official language. During the first
eight months of the year, Tocumen International Airport registered approximately 4.884 million
passengers. When compared to the previous year, this represents a growth of 9.6%. Out of those
passengers, 2.5 million were in transit. In 2013, cruise tourism grew by 11.7 percent, representing
approximately 400,000 passengers through 135 cruises. On September 30, Panama inaugurated
the first Frank Gehry museum in Latin America. The bio-diversity themed museum aims to
replicate the efforts of other cities such as Bilbao that benefitted by the inclusion of unique
museums.

130
Regulatory Framework and Government Role
Law 80 of 2012 introduced new and updated incentives and regulations related to the hospitality
industry, cruise ships infrastructure, convention centers, and marinas among others. The benefits
include tax exemptions, import exonerations, certificates and others.
Main Challenges and Emerging Opportunities
The city has an oversupply of hotel rooms with an occupancy rate of 56%. As incentives push the
development of tourism, the main challenge would be to sustain the 7-10% growth rate. Panama
needs important reform to its educational system in order to welcome tourists (42 percent) who do
not speak Spanish. This relates to addressing and developing the necessary human capital to offer
high quality multilingual services.
Future Perspectives
a. It is anticipated that tourism will continue to be a significant driver of growth in
Panama, with investor confidence remaining high given the country’s strategic location
and stability. However, given that saturation of the hotel market, particularly in the
capital, it is likely that greater investments will be made in more under-developed areas
and provinces outside of Panama, thus driving development.
b. Regional tourism is expected to remain more than 50%; however, international
campaigns focused on Europe, Canada and Asia will continue to grow thus requiring
the need for multilingual human capital. It is expected that local schools and
universities – both public and private - will continue to expand their educational
curricula in order to incorporate English-speaking as an essential skill.

131
DATE: November 2014
SUBJECT: PANAMA: Commerce Sector Briefing
Overview of Commerce in Panama
As of end of 2013 and in line with the trend for the past five years, Commerce represents
approximately 18% of the Panamanian GDP as it grows on a year on year basis. Panama is ranked
52 in the most recent Doing Business classification thus climbing three positions from the previous
year. According to the ranking, Panama is therefore the first country in terms of ease of doing
business in Central America and the fifth in Latin America behind Colombia, Peru, Mexico and
Chile.
Key Players (Local)
In food and beverage, Super 99 is the biggest supermarket chain in Panama with over 40 branches
throughout the country. Grupo Rey is the holding company of Rey Supermarkets and Pharmacies
Metro and Econofarmacias. There are approximately 22 Rey Supermarkets throughout the country
and they have expanded steadily throughout the years. Riba Smith was founded in 1946 in Panama,
currently has four supermarkets and two stores in Panama City, Chitre and Coronado, and plans to
double this number over the next three years. Super Xtra was founded in Panama over 20 years
ago and now holds ten supermarkets throughout the country. Empresas Tagaropulos SA is a
Panama-based holding company engaged, through its subsidiaries, in the import, distribution and
wholesale of dry goods, food, and hygiene and beauty products. Agencia Feduro, a wholesale
distributor of products from Procter Gamble, Arla Foods among others. Cerveceria Nacional is
part of the SABMiller Group. The Company has a 70 percent market share in the beverage
segment. In the department store segment, Felix B. Maduro is an important A and B segment
stakeholder and Conway, Collins, Grupo el Costo, and Grupo el Titan are other major players in
the segmented low cost retail space. In the Do it Yourself segment there are two major players:
DoIt Center and Cochez y Cia. Both companies are Panamanian and have a long history in
construction materials and hardware. Finally, in Electronics, Panafoto and Multimax are
considered the most important in the market.
Recent Trends
Commerce has been growing over the last five years at a yearly average of 7.5%. Multinational
companies are encouraged to establish in Panama through Law 41/2007 which grants fiscal
incentives to international companies opening an office in Panama. As of October 2014, about
110 international companies have been established under this law, with investments totaling
US$700 million, consequently generating 1,300 jobs. On the other hand, activities in the Colon
Free Zone have decreased over the last couple of years due to restrictions on traditional markets
(Venezuela and Colombia – debt obligations and custom tariff respectively). Moreover, the signing
of a Commercial Promotion Agreement with the United States in October 2012 had a strong impact
between the two countries. This led to bilateral trade worth approximately US$11.2 billion in 2013.
inally, Panama is becoming a leader in Luxury Retail, with over ten major brands establishing in
Panama before exploring other larger markets. By 2015, it is expected that all major Luxury
Groups will have a presence in Panama thus signaling confidence in Luxury shopping.

132
Regulatory Framework and Government Role
Law 5 of January 2007 lists the types of businesses that have specific regulatory regimes. The
Ministry of Commerce and Industry (Ministerio de Comercio e Industrias - MICI) provides helpful
information and frameworks for local and foreign investors in order to set up a business.
Main Challenges and Emerging Opportunities
Panama is an attractive market for foreign investors due to its strategic location, its economic
development, international banking center, transport connectivity and untapped business
opportunities. Important infrastructure works including the expansion of the Panama Canal are
expected to increase merchandise inflow through Panama, of which 10% of the total cargo stays
in Panama while 90 percent is exported. The possible entry of important foreign players,
encouraged by the commercial agreements and Law 41, could negatively affect national players.
Nevertheless, some conditions within the signed commercial agreements should protect local
retailers from the irruption of big international companies. A key trait related to the sector is the
increasing indebtedness and purchasing power. The latest figures from the consumer credit
segment indicate an increase in consumers’ purchasing power. In particular, credit card utilization
increased by 16%, meaning that the segment has been growing double-digit in the last three years.
Finally, there is an opportunity to regionalize Ecommerce. Panama has the ambition of becoming
an e-commerce hub for Central America and started to make progress towards this goal by
welcoming a growing internet user base and local ecommerce initiatives.
Future Perspectives
a. Commerce will continue to be important to the country’s GDP, particularly with
Panama serving as an attractive market for foreign investors due to its strategic
location, its economic development, international banking center, transport
connectivity and untapped business opportunities. It is possible that innovative ways of
engaging clients will emerge, particularly an opportunity for Ecommerce, for which
Panama has the ambition of becoming an e-commerce hub for Central America.
Nevertheless, the “mall” consumer culture in Panama is still predominant and the space
for e-commerce is not expected to cannibalize the existing trend.
b. Commerce in the Colon Free Zone is not anticipated to improve substantially as it is
likely that it will use the next year or so determining a new strategy to address the
challenges it has faced in the past few months which have significantly impacted the
area. In particular, this refocused strategy will be important to ensure the zone’s
relevance and value-added role in the market.
c. Due to attractiveness in margins, which are relatively higher than the rest of the region,
there may a wave of international chains purchasing interesting local chains as a
method of expansion.

133
Annex 5: Comparison Between ACP and ANAM Water Management Models
ANAM ACP
Legal Framework
for WRM
Law 35 (1966) – ‘the water law’ - supported water resource
management on a sector-by-sector basis (this law is pending revision)
Law 41 (1998) –Created ANAM to manage environmental issues, to
protect, conserve, and recover the environment, and to promote a
sustainable use of natural resources
When ANAM was created, other institutions such as MINSA,
IDAAN, MOP, and MIDA among others were already
involved in water resource management creating conflicting
overlap in responsibilities.
Law 44 (2002) - Establishes an administrative regime for the
management, protection and conservation of watersheds; proposes the
creation of watershed committees and integrative management plans
Treats water as one of many natural resources that is to be
protected and conserved in the context of watershed
*A law that reflects modern water management concepts (water use
regulations, water pollution controls, water related conflicts) has yet to
be fully developed in Panama
Title XIV of the Panamanian Constitution establishes
the ACP and gives it “exclusive charge of the
operation, administration, management, preservation,
maintenance, and modernization of the Canal, as well
as its activities and related services, pursuant to legal
and constitutional regulations in force, so that the
Canal may operate in a safe, continuous, efficient, and
profitable manner.”105
The Canal is financially autonomous.
An Administrator and a Deputy
Administrator head the ACP under the
supervision of an 11-member Board of
Directors; the members have overlapping
terms to ensure their independence from the
country's administrations.
Law 19 (1997) establishes the ACP to assume the
responsibilities of the US Panama Canal Commission
(US PCC) as well as the conservation and
management of the PCW (which was not included in
the US PCC’s mission)
Agreement 16 establishes the Inter-Institutional
Commission for the PCW.106
105 ACP, http://www.pancanal.com/eng/acp/acp-overview.html 106 USAID, “Evaluation of USAID’s Strategic Objective for the Panama Canal Watershed 2000 to 2005,” June 2005.

134
Institutional Set-up
for WRM
Within ANAM, the Department for Water Resource Management sits
in the Management Unit on Integrated Watershed Management (see
Annex 1).
The UNESCO-supported Inter-Institutional Water Resources Council
(CONAPHI) includes 13 institutions and Panama aims to coordinate and
lead water resource management.
ANAM’s 2010-2030 Plan for Integrated Water Resource Management
includes a diagnostic of water resources management and recommends
key activities in the short and medium terms based upon the identified
gaps and areas of weakness. ANAM has made limited progress on
implementing targeted aspects of the Plan.
The ACP heads the Inter-Institutional Commission for
the Panama Canal Watershed (CICH), which includes
the Ministry of Housing, the Ministry of Agriculture,
the Ministry of Justice and Governance, the Authority
for the Inter-Oceanic Region as well as non-profit
organizations. The CICH is responsible for
coordinating all initiatives in the PCW.107 The ACP,
through the CICH, is carrying out its Plan for
Sustainable Development and Integrated Water
Resource Management. The ACP also has an Executive
Vice Presidency for Environment, Water and Energy.
Monitoring Capacity ANAM carries out water balances at ten watersheds and assesses water
quality in 95 rivers. ANAM currently does not have the financial or
technical capacity to monitor water balances or water quality across the
country and is reliant on government funding to extend its water
resource management activities. 108
ETESA is responsible for operating and maintaining the national
network of meteorological and hydrological stations. In 2011, ETESA
had 95 active stations to measure rainfall, temperature and relative
humidity among other factors.109
The ACP and its predecessor, the Canal Commission,
have conducted extensive monitoring activities
associated with Canal operations over the last two
decades. Monitoring activities have been mainly
associated with key environmental and social
conditions central to the management of Canal
operations and the quantity and quality of hydrologic
resources. As such many of the traditional monitoring
activities have focused on the Canal area watershed
and have included monitoring of such environmental
aspects as vegetation cover, hydrological conditions,
and water quality as well as social aspects related to
land use and settlements. Most of these long-term
environmental monitoring programs are key
components of ACP responsibilities established in the
Organic Law for the adequate management use, and
conservation of the Canal Watershed water resources.
Quality of Water In the 95 rivers that ANAM monitors, 34% are classified as
contaminated or slightly contaminated.110 The main source of
contamination is domestic sewage.
In 2013, the quality of the water in the PCW received a
ranking of 87 in the Global Water Quality Index,
positioning the quality of the water between good and
excellent.
Sustainability Measures
Watershed
Management Plans
Watershed management plans for four watersheds
Implementation strategy for one of the watersheds111 (2010 data)
Plan for Sustainable Development and Integrated
Water Resource Management “to promote watershed
107 Inter-American Development Bank, Panama Canal Expansion Program, Social and Environmental Report, September 2008.
http://idbdocs.iadb.org/wsdocs/getdocument.aspx?docnum=1650393 108 ANAM, National Plan, 2010-2030.

135
management in order to raise the standard of living of
the PCW’s inhabitants without compromising the
Canal’s future needs and constant water production in
the amount and quality necessary for running the
waterway and human consumption.” 112
Reforestation Reforested 300 hectares around targeted watersheds113 Reforested and maintaining more than 6,200 hectares
in the PCW114
Community
Involvement
Capacity building exercises for 200 community groups/cooperatives
Developed management plans for thirty farms along the Pacora
River115
The ACP through the CICH supports a range of
community-based social and environmental
development projects to protect the PCW. For example,
in conjunction with the National Lands Administration
Authority, the ACP has helped over 3,500 producers
and residents in the PCW receive land titles. This
activity has facilitated land-use planning in the PCW.
The ACP has also played an active role in building the
capacity of residents to protect the PCW. For instance,
in collaboration with the Institute for Professional
Formation and Human Resources Development and the
Ministry of Education, the ACP carried out
conservation and job-training programs for more than
5,666 residents.
In regard to agriculture, the ACP has worked with the
Ministry of Agriculture Development of Panama
(MIDA) to train more than 1,100 producers on
sustainable agricultural and livestock practices. The
ACP has also worked with MIDA to introduce green
agroforestry models for shade-grown coffee and cacao
production in the PCW.
The ACP receives international and national support
for these programs, but also allocates a portion of its
annual budget towards community initiatives. In
addition to annual financial commitments, the USAID
109 GWP Report 2011 110 ANAM, National Plan for Integrated Water Resource Management, 2010-2030. 111 ANAM, National Plan, 2010-2030. 112 World Business Council for Sustainable Development, Panama Canal Sustainable Development Program, 2005. 113 ANAM, National Plan, 2010-2030. 114 ACP 2013 Annual Report 115 ANAM, National Plan, 2010-2030.

136
assisted in the establishment of a Fund for the
Conservation and Recuperation of the Canal Watershed
to ensure long-term conservation. This fund supports
projects in the following areas: reforestation, agro-
forestry, natural habitat management, reduction of
sources of pollution, basic community sanitations,
liquid and solid waste control, soil conservation,
ecotourism, land titling and unified cadastre, and
development of sustainable agricultural techniques.116
Climate Change With the support of National and international funds, ANAM has
undertaken several small-scale adaptation and mitigation programs,
including:
A program to capture rainwater in areas that do not have ample
water resources (Guna Yala and Ngäbe Buglé among other
areas)
Climate change vulnerability studies and installing equipment
to monitor the impact of climate change in two watershed
From the IFC’s August 2008 Environmental and Social
Review of the Panama Canal:
As part of the expansion project design
process, the ACP conducted extensive
statistical modeling to evaluate the potential
availability of water for navigation and
potable use during droughts that might occur
due to climate change influences within the
next 17 years. The data analysis included
historical rainfall and stream flow patterns,
including three very significant ENSO events
(i.e., extreme droughts), which occurred over
the last 30 years of operation. Using a 99%
confidence interval, the evaluation concluded
that sufficient water will be available for both
Canal operation and potable use for growth in
population through the year 2025.117 The ACP is working with the National Civil Defense
System and local communities to build risk
management capacity.
Knowledge Gaps /
Areas for
Development
In 2010, ANAM highlighted the following knowledge gaps/areas for
development:
Limited knowledge on underground water
Lack of hydraulic infrastructure for extended dry periods
Lack of up-to-date knowledge on water-stressed areas
Unreliable information on water uses
Unknown number of illegal users
In addition to a continued commitment to on-going
activities, areas for further development include:
Mitigating contamination of connecting
rivers, especially in urban and peri-urban
areas
Preparing for floods and extended dry seasons
116 IFC, Environmental and Social Review of the Panama Canal, 2008. 117IFC, Environmental and Social Review of the Panama Canal, August 2008.

137
Lack of guidelines on water use in watershed management
plans
Lack of capacity to monitor compliance with environmental
norms on water resource management
Need to ensure that institutions utilize hydrogeological
information before accessing underground water
No national campaign on the importance to conserve and
protect water; no evidence of optimization of water
Unknown ecological cost of water
Lack of a functioning information system to connect the
knowledge of the various institutions involved in water
resource management