pancreatic cancer organoids recapitulate disease and allow
TRANSCRIPT

Pancreatic cancer organoids recapitulate diseaseand allow personalized drug screeningElse Driehuisa,b, Arne van Hoecka,c, Kat Moored, Sigrid Koldersa,b, Hayley E. Franciese, M. Can Gulersonmezf,Edwin C. A. Stigterf, Boudewijn Burgeringf, Veerle Geurtsa,b, Ana Gracaning, Gergana Bounovad, Folkert H. Morsinkh,Robert Vriesg, Sylvia Bojg, Johan van Esa,b, G. Johan A. Offerhaush, Onno Kranenburgi, Mathew J. Garnette,Lodewyk Wesselsd, Edwin Cuppena,c,j,k, Lodewijk A. A. Brosensh, and Hans Cleversa,b,l,1
aOncode Institute, University Medical Center Utrecht, 3584 CX Utrecht, The Netherlands; bHubrecht Institute, Royal Netherlands Academy of Arts andSciences and University Medical Center Utrecht, 3584 CT Utrecht, The Netherlands; cCenter for Molecular Medicine, University Medical Center Utrecht, 3584CG Utrecht, The Netherlands; dDivision of Molecular Carcinogenesis, The Netherlands Cancer Institute, 1066 CX Amsterdam, The Netherlands; eWellcomeSanger Institute, Hinxton CB10 1SA, United Kingdom; fDepartment of Molecular Cancer Research, Center Molecular Medicine, Oncode Institute, UniversityMedical Center Utrecht, Utrecht 3584 CM, The Netherlands; gHubrecht Organoid Technology, Utrecht 3584 CM, The Netherlands; hDepartment ofPathology, University Medical Center Utrecht, Utrecht 3584 CM, The Netherlands; iUtrecht Platform for Organoid Technology, Utrecht Medical CenterUtrecht, Utrecht 3584 CM, The Netherlands; jHartwig Medical Foundation, 1098 XH Amsterdam, The Netherlands; kCenter for Personalized CancerTreatment,University Medical Center Utrecht, Utrecht 3584 CM, The Netherlands; and lPrincess Maxima Center, Utrecht 3584 CS, The Netherlands
Contributed by Hans Clevers, November 4, 2019 (sent for review July 5, 2019; reviewed by Anirban Maitra and Hugo Vankelecom)
We report the derivation of 30 patient-derived organoid lines(PDOs) from tumors arising in the pancreas and distal bile duct.PDOs recapitulate tumor histology and contain genetic alterationstypical of pancreatic cancer. In vitro testing of a panel of 76therapeutic agents revealed sensitivities currently not exploitedin the clinic, and underscores the importance of personalizedapproaches for effective cancer treatment. The PRMT5 inhibitorEZP015556, shown to target MTAP (a gene commonly lost inpancreatic cancer)-negative tumors, was validated as such, butalso appeared to constitute an effective therapy for a subset ofMTAP-positive tumors. Taken together, the work presented hereprovides a platform to identify novel therapeutics to target pan-creatic tumor cells using PDOs.
pancreatic cancer | organoids | personalized medicine | cancer | biobank
Pancreatic ductal adenocarcinoma (PDAC) accounts for >7%of all cancer deaths. With an overall survival rate of only 8.5%,
PDAC is one of the deadliest forms of cancer, for which treatmentoptions are limited (1). In addition, distal cholangiocarcinomas(dCCs), that originate from the distal bile duct at the site whereit passes through the pancreas, were recently described to bemolecularly more similar to pancreatic tumors than to those ofthe liver (2).Currently, PDAC is treated with either gemcitabine/nab-
paclitaxel or FOLFIRINOX (5-fluorouracil, leucovorin, irinotecan,and oxaliplatin), combined with surgery when possible (3, 4).Despite these interventions, response rates remain poor, withoverall survival of only 6 to 11 mo in patients ineligible for sur-gery (3, 4). As alterations in therapeutically targetable molecularpathways are known to contribute to disease pathogenesis (5–8),agents targeting these pathways hold promise to improve thetreatment of these tumors. However, variable responses to thesetherapeutics are expected, and biomarkers to predict response totherapy are lacking. Thus, tools to identify the most effective che-motherapeutic regimens for individual patients, as well as models todevelop additional drug treatment strategies, are urgently needed.Organoid technology allows for the establishment of patient-
derived cultures with much higher efficiency than classical 2Dcell lines (9). This has resulted in the generation of a range oftumor-derived organoid biobanks that recapitulate tumor char-acteristics and can be used to address basic and translationalresearch questions (5, 6, 10–15). We and others have previouslyreported the establishment of patient-derived organoids (PDOs)derived from PDAC (5, 6, 16). Using slightly different protocols,these studies show that PDOs can be established from PDACwith a success rate of 70 to 73%. Here we report an additionalpancreas tumor biobank and show the feasibility of this model
for personalized drug screening. Organoids derived from severalnon-PDAC tumor types, such as pancreatic acinar cell carcinomaand distal cholangiocarcinoma, are also included. Organoidswere established from tumor-adjacent normal epithelium whenavailable, allowing for the direct comparison of normal and tu-mor cells from the same patient.
Patient-Derived Organoids Can Be Established fromDifferent Pancreas Tumor Types and Recapitulate theTissue of the Original TumorTissues from biopsies or surgical resections were obtained anddigested as described previously (16). Tumor cells were sub-sequently grown in 2 types of media, designated tumor medium 1(TM1) and tumor medium 2 (TM2). TM1 contains all compo-nents of complete pancreatic medium (CM) except EGF and
Significance
We describe a biobank of patient-derived pancreatic cancerorganoids, characterized by whole-genome DNA sequencing,RNA sequencing, and histology. The organoid biobank will bemade publicly available and thus can serve as a resource forothers. Pancreatic cancer organoids have been described pre-viously; however, here we expose organoids to extensive drugscreens to reveal unique drug sensitivity profiles for individualorganoid lines. These findings underscore the importance ofpersonalized approaches when using targeted agents to treatcancer in the clinic.
Author contributions: E.D., M.C.G., E.C.A.S., B.B., G.B., R.V., S.B., J.v.E., O.K., M.J.G., L.W.,E.C., and H.C. designed research; E.D., A.v.H., S.K., H.E.F., M.C.G., V.G., A.G., F.H.M., S.B.,G.J.A.O., and L.A.A.B. performed research; E.D., A.v.H., K.M., S.K., M.C.G., E.C.A.S., G.B.,E.C., and L.A.A.B. analyzed data; and E.D., A.v.H., K.M., H.E.F., M.C.G., G.J.A.O., L.A.A.B.,and H.C. wrote the paper.
Reviewers: A.M., University of Texas MD Anderson Cancer Center; and H.V., Universityof Leuven.
Competing interest statement: H.C. is an inventor listed on several patents related toorganoid technology. H.C. is the (unpaid) Chief Scientific Officer of Hubrecht OrganoidTechnology, a cofounder of Surrozen, and a scientific advisory board member for Kallyope,Merus, and Decibel. H. Clevers is a nonexecutive board member of Roche and Genentechand a scientific advisor for Life Sciences Partners. E.D. is an inventor on a patent related toorganoid technology.
Published under the PNAS license.
Data deposition: The DNA and RNA sequences described in this work have been depositedin the European Genome-phenome Archive (https://www.ebi.ac.uk/ega/studies/EGAS00001000369; accession no. EGAS00001003369).1To whom correspondence should be addressed. Email: [email protected].
This article contains supporting information online at https://www.pnas.org/lookup/suppl/doi:10.1073/pnas.1911273116/-/DCSupplemental.
www.pnas.org/cgi/doi/10.1073/pnas.1911273116 PNAS Latest Articles | 1 of 11
CELL
BIOLO
GY
Dow
nloa
ded
by g
uest
on
Oct
ober
13,
202
1

PGE2, whereas TM2 lacks PGE2, WNT, and the TGF-β in-hibitor A83-01. After initial tumor digestion and plating inextracellular matrix, samples were cultured in both media. Iforganoids grew out on both media, both cultures were main-tained in parallel and compared later. In total, over the courseof 3 y, 83 tumor samples were received. Fifty-two grew out inat least 1 of the 2 tumor media (outgrowth efficiency of 62%).Of these 52 PDOs, 31 were analyzed by whole-genome se-quencing (WGS) and are described in this study (Fig. 1A and SIAppendix, Table S1). Available organoids are cataloged byHubrecht Organoid Technology (www.hub4organoids.eu) andcan be requested using their assigned HUB codes (SI Appendix,Table S1). With the exception of PDO 30 and 31, which wereestablished from biopsies, all other PDOs were established from
surgical resections. The outgrowth efficiency of organoids frombiopsies was 31%. For 12 of the 31 established PDOs, tumorsamples grew out on both TM1 and TM2 (SI Appendix, Table S1indicates the samples established on each TM). Sato et al. (5)reported that the dependence on WNT signaling of PDOs corre-lates with a basal tumor subtype that is characterized by GATA6-dependent gene expression. In line with these findings, we ob-served an inverse correlation between GATA6 expression andWNT dependency in PDOs (SI Appendix, Fig. S1A). This suggeststhat medium composition may have a selective impact on PDOoutgrowth. In cases where tumor material grew out on both media,no difference in GATA6 expression profile was observed betweenthe 2 lines, indicating that the medium itself does not directly af-fect the expression of GATA6. This is illustrated by the gene
B
PDO28PDO28
T4 PDO4 PDO4
100 μm
T11 PDO11 PDO11
TUMOR ORGANOID ORGANOIDH&E H&E BrightfieldC
PDO8
PDO24 PDO24
PDO8
100 μm
ORGANOIDBrightfield
T23 PDO23 PDO23
A
Total=3063.33% PDAC10.00% CC6.67% ACC3.33% Adenosquamous PDAC10.00% IPMN-derived PDAC6.67% Papilla of Vater AC
E F
complete medium
0
10
20
30
40
50
fold
cha
nge
in g
ene
expr
essi
on
rela
tive
to c
ompl
ete
med
ium
- Noggin-TGF- inh
0
10
20
30
complete medium
- Noggin-TGF- inh
ID1
ID3
fold
cha
nge
in g
ene
expr
essi
on
rela
tive
to c
ompl
ete
med
ium
PDO 8PDO 10PDO 23
100 μm
COMPLETE MEDIUM -Noggin/ TGF-B inh
PDO23 PDO23
PDO10 PDO10
PDO8 PDO8
100 µm
ORGANOID ORGANOIDTISSUESMAD4 immunostaining
T23
T10
T8TP53 immunostaining
T11
PDO11
OR
GA
NO
IDTU
MO
R
D
Fig. 1. Patient-derived organoids can be established from different pancreatic tumor types and recapitulate the tissue of the original tumor. (A) Pie chartdepicting the characteristics of the tumor biobank described in this work. ACC, acinar cell carcinoma; CC, cholangiocarcinoma; IPMN, intraductal papillarymucinous neoplasm. (B) Brightfield images of 3 PDO cultures, shown in 2 magnifications. (C) Brightfield images of H&E staining of tumor tissue and cor-responding organoids showing organoid morphology in culture. (D) IHC staining for TP53 in tumor tissue and corresponding organoids of patient 11. TheTP53 staining is consistent with TP53 mutation status of the tumor and organoids and is corresponding in tumor tissue and organoids. (E) IHC for SMAD4 intumor tissue and brightfield images of corresponding organoid lines, grown in either complete medium or medium lacking A83-01 and Noggin. SMAD4mutant cells can be functionally selected in organoid cultures by removing TGF-β inhibitors A83-01 and Noggin. (F) qPCR for BMP target genes ID1 and ID3.Induction of BMP signaling by the removal of Noggin and A83-01 resulted in up-regulation of ID1 and ID3 in SMAD4 wild-type PDO 8 and PDO 10 but not inSMAD mutant PDO 23. Expression is shown relative to organoids grown in complete medium. This experiment was performed in technical triplicate.
2 of 11 | www.pnas.org/cgi/doi/10.1073/pnas.1911273116 Driehuis et al.
Dow
nloa
ded
by g
uest
on
Oct
ober
13,
202
1

expression heatmap, in which most of the organoid pairs clustertogether, indicating similarities in gene expression levels (SIAppendix, Fig. S1B).When available, corresponding tumor-adjacent normal tissue
was processed to establish wild-type organoids. We successfullyestablished these matched normal control organoids for 5 patients,corresponding to 7 of the established tumor organoid lines (as insome cases, tumor organoids could be established on both TM1and TM2). Morphology of tumor organoids differed from cystic(with either a clear or filled lumen) to dense structures (Fig. 1B).Comparison of hematoxylin and eosin (H&E) staining of PDOsand corresponding tumor tissue showed morphological similaritiesbetween PDOs and tumor tissue with cellular atypia, includingaberrant location of the nuclei, according to pathological assess-ment (Fig. 1C).
Organoid Culture Media Composition Functionally Selectsfor Oncogenic Mutations in PDOsThe TP53 status of a subset of PDOs and corresponding tumortissue was determined by immunohistochemistry (IHC). Accu-mulation of mutant TP53 protein can occur due to conformationalchanges that result in increased protein half-life (17); therefore,TP53 IHC staining is used as a clinical parameter to determineTP53 mutation status (18). TP53 IHC staining in organoids cor-related with the corresponding tumor tissue results (exampleshown in Fig. 1D, where tissue is indicated by “TUMOR” andpatient-derived organoid is indicated by “PDO”). Loss of SMAD4is commonly observed in pancreatic tumors (19). Using IHC, theSMAD4 status of a subset of tumors was assessed. Tumors 8 and10 stained positive for this marker, indicative of wild-type protein,whereas tumor 23 showed loss of SMAD4 expression (Fig. 1E). Inorganoids, positive SMAD4 IHC was never observed. This may beexplained by the presence of Noggin and A83-01 in the culturemedium, resulting in inhibition of BMP/TGF-β signaling in theorganoids. Although not by IHC, we found that loss of SMAD4function could be detected in culture. Withdrawal of A83-01 andNoggin from the medium resulted in up-regulation of the TGF-βtarget genes ID1 and ID3 in SMAD4 wild-type PDO 8 and 10 cells,and resulted in growth cessation after 2 wk in culture. In contrast,SMAD4-mutant PDO 23 was unaffected by Noggin/A83-01 with-drawal and did not show up-regulation of TGF-β target genes (Fig.1 E and F). Thus, despite the absence of positive SMAD4 IHC inorganoids, we conclude that the molecular differences betweenSMAD4 wild-type and mutant organoid lines are retained in cul-ture. We confirmed molecularly that the SMAD4 mutation statusof the PDOs indeed fits with their response to Noggin/A83-01withdrawal. This finding highlights how culture conditions can al-ter cell behavior and underscores that these conditions should becarefully considered depending on the application.We conclude that PDOs retain morphological characteristics
of the tissue of origin. Organoids can be manipulated in cultureby pharmacologic inhibition or removal/addition of certaingrowth factors to select for cells with tumor-specific genetic alter-ations. This holds potential to avoid overgrowth of contaminatingwild-type cells in tumor samples, a notorious problem when estab-lishing tumor-derived organoids.
Anecdotal Expansion of Precancerous Cells Found in“Healthy” PancreasThe selection pressure created by the addition or removal ofgrowth factors allows for enrichment of rare tumor-like cells,which can be present in normal pancreas. For example, orga-noids established from normal pancreatic tissue (of a patientwith pancreatic metastasis of ovarian cancer) could be culturedfor at least 15 passages on TM1, lacking EGF. This suggestedthat these cells were independent of EGF ligand for downstreamEGFR signaling. Indeed, these organoids were found to carry anactivating G12R KRAS mutation, suggesting a (pre)neoplastic
pancreatic lesion (SI Appendix, Fig. S2A). As this mutation wasnot present in both the ovarian carcinoma tumor tissue andorganoids derived thereof, the organoid line was most likelyestablished from a pancreas-derived neoplastic clone, such aspancreatic intraepithelial neoplasia (PanIN), a precursor of PDAC.The established organoid line responded to Nutlin-3 treatment,indicative of TP53 wild-type status (SI Appendix, Fig. S2B). Indeed,this precancerous lesion was detected upon pathological assess-ment of the biopsy specimen (SI Appendix, Fig. S2C), highlightingthe strength of organoid cultures and the artificial selection pres-sures created by the culture medium to both detect and expandrare (pro)tumorigenic cells.
PDOs Contain Genetic Alterations Typical for Tumor Types from WhichThey Are Derived. Thirty-one PDOs were analyzed by WGS.Matching germ line DNA was available for 26 of these PDOs,allowing accurate detection of somatic events. PDO 27 con-tained a low number of mutations and displayed a stable kar-yotype. In addition, no oncogenic mutations were detected inthis PDO. Therefore, we assumed that PDO 27 was derivedfrom wild-type cells present in the primary resection specimenand excluded this sample from further analysis. Oncogenicevents (protein altering point mutations, indels, amplifications,and deep deletions) were characterized in 202 genes previouslyfound to be associated with pancreatic cancer (5–8) (Fig. 2A,Dataset S1, and SI Appendix, Fig. S3). The 5 PDOs for whichno germ line DNA was available were functionally annotatedwith COSMIC. The most commonly altered gene, KRAS, wasmutated in 22 of the 25 lines (88%), of which 30% werep.G12D, 23% were p.G12V, 13% were p.G12R, 13% werep.Q61H, and 6% were p.G13D. In the 3 PDOs without a KRASmutation, we detected a p.V600E mutation in BRAF in PDO11 and 25 and a p.G12D NRAS mutation in PDO 22. TP53 wasmutated or lost in 84% (21 of 25) of the PDOs. Loss ofCDKN2A was detected in 80% of the lines (20 of 25). Othercommonly found genetic alterations included loss of SMAD4,EEF2A mutations, MYC amplifications, activating mutations inPIK3CA, and ARID1A inactivation.Organoids derived from non-PDAC tumors included PDOs 1,
2, 22, and 26. PDO 1, derived from a squamous adenocarcinoma,was the sole PDO carrying mutations in only 1 gene (TP53) inthe panel of genes analyzed. PDO 22, derived from an acinar cellcarcinoma, was found to be mutated in CDKN2A and SMAD4.Finally, cholangiocarcinoma-derived PDO 2 and PDO 16 carriedmutations in PDAC driver genes, including TP53, CDKN2A,EEF2, SMAD4, GNAS, and KRAS.Next, we compared the genetic landscape of PDOs derived
from the same patient but established in different culture media(SI Appendix, Fig. S4). All 8 PDO paired sets of organoids showed3 to 5 shared nonsynonymous mutations in cancer genes, whichlikely reflect the clonal driver events. However, every PDO alsoharbored unique genomic events in cancer genes, including sub-stantial nonsynonymous mutations in PDOs 3, 4, and 5; variationson a structural level, such as ERBB2 amplification in PDO 6 butnot in PDO 7; and MYC amplification in PDO 9 but not in PDO10. Likewise, PDO 13 underwent a whole genome duplication,whereas PDO 12 did not, explaining the amplification events ofGNAS and ERBB2 observed in PDO 13. Overall, none of thematched PDOs was genetically identical to its counterpart. Thisindicates that the different tumor media can be used to captureintratumor heterogeneity, which may be of interest in light of drugresistance mechanisms. The finding that none of the matchedPDOs was genomically identical to its counterpart underscores therelevance of (intentional or unintentional) in vitro selection thatcan result in enrichment of specific tumor clones. This is in linewith the described genetic heterogeneity of PDAC.DNA copy number analysis revealed aneuploidy in all PDOs
with the exception of PDO 25 (SI Appendix, Fig. S5). Of these, 7
Driehuis et al. PNAS Latest Articles | 3 of 11
CELL
BIOLO
GY
Dow
nloa
ded
by g
uest
on
Oct
ober
13,
202
1
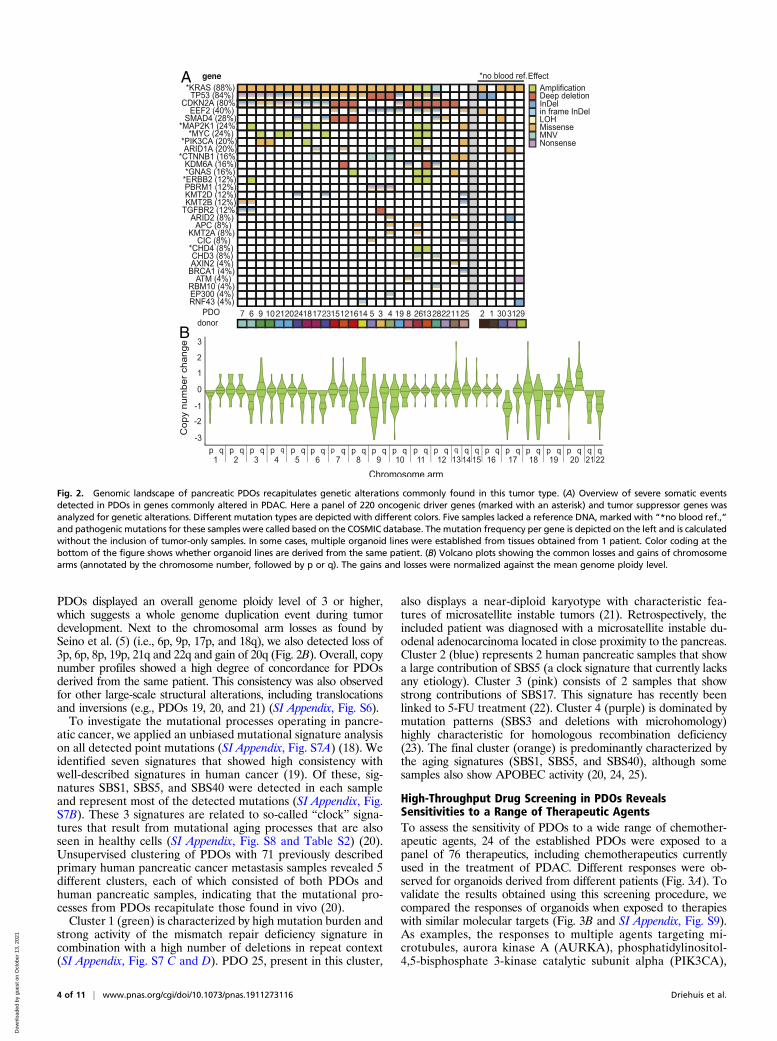
PDOs displayed an overall genome ploidy level of 3 or higher,which suggests a whole genome duplication event during tumordevelopment. Next to the chromosomal arm losses as found bySeino et al. (5) (i.e., 6p, 9p, 17p, and 18q), we also detected loss of3p, 6p, 8p, 19p, 21q and 22q and gain of 20q (Fig. 2B). Overall, copynumber profiles showed a high degree of concordance for PDOsderived from the same patient. This consistency was also observedfor other large-scale structural alterations, including translocationsand inversions (e.g., PDOs 19, 20, and 21) (SI Appendix, Fig. S6).To investigate the mutational processes operating in pancre-
atic cancer, we applied an unbiased mutational signature analysison all detected point mutations (SI Appendix, Fig. S7A) (18). Weidentified seven signatures that showed high consistency withwell-described signatures in human cancer (19). Of these, sig-natures SBS1, SBS5, and SBS40 were detected in each sampleand represent most of the detected mutations (SI Appendix, Fig.S7B). These 3 signatures are related to so-called “clock” signa-tures that result from mutational aging processes that are alsoseen in healthy cells (SI Appendix, Fig. S8 and Table S2) (20).Unsupervised clustering of PDOs with 71 previously describedprimary human pancreatic cancer metastasis samples revealed 5different clusters, each of which consisted of both PDOs andhuman pancreatic samples, indicating that the mutational pro-cesses from PDOs recapitulate those found in vivo (20).Cluster 1 (green) is characterized by high mutation burden and
strong activity of the mismatch repair deficiency signature incombination with a high number of deletions in repeat context(SI Appendix, Fig. S7 C and D). PDO 25, present in this cluster,
also displays a near-diploid karyotype with characteristic fea-tures of microsatellite instable tumors (21). Retrospectively, theincluded patient was diagnosed with a microsatellite instable du-odenal adenocarcinoma located in close proximity to the pancreas.Cluster 2 (blue) represents 2 human pancreatic samples that showa large contribution of SBS5 (a clock signature that currently lacksany etiology). Cluster 3 (pink) consists of 2 samples that showstrong contributions of SBS17. This signature has recently beenlinked to 5-FU treatment (22). Cluster 4 (purple) is dominated bymutation patterns (SBS3 and deletions with microhomology)highly characteristic for homologous recombination deficiency(23). The final cluster (orange) is predominantly characterized bythe aging signatures (SBS1, SBS5, and SBS40), although somesamples also show APOBEC activity (20, 24, 25).
High-Throughput Drug Screening in PDOs RevealsSensitivities to a Range of Therapeutic AgentsTo assess the sensitivity of PDOs to a wide range of chemother-apeutic agents, 24 of the established PDOs were exposed to apanel of 76 therapeutics, including chemotherapeutics currentlyused in the treatment of PDAC. Different responses were ob-served for organoids derived from different patients (Fig. 3A). Tovalidate the results obtained using this screening procedure, wecompared the responses of organoids when exposed to therapieswith similar molecular targets (Fig. 3B and SI Appendix, Fig. S9).As examples, the responses to multiple agents targeting mi-crotubules, aurora kinase A (AURKA), phosphatidylinositol-4,5-bisphosphate 3-kinase catalytic subunit alpha (PIK3CA),
A
B
Fig. 2. Genomic landscape of pancreatic PDOs recapitulates genetic alterations commonly found in this tumor type. (A) Overview of severe somatic eventsdetected in PDOs in genes commonly altered in PDAC. Here a panel of 220 oncogenic driver genes (marked with an asterisk) and tumor suppressor genes wasanalyzed for genetic alterations. Different mutation types are depicted with different colors. Five samples lacked a reference DNA, marked with “*no blood ref.,”and pathogenic mutations for these samples were called based on the COSMIC database. The mutation frequency per gene is depicted on the left and is calculatedwithout the inclusion of tumor-only samples. In some cases, multiple organoid lines were established from tissues obtained from 1 patient. Color coding at thebottom of the figure shows whether organoid lines are derived from the same patient. (B) Volcano plots showing the common losses and gains of chromosomearms (annotated by the chromosome number, followed by p or q). The gains and losses were normalized against the mean genome ploidy level.
4 of 11 | www.pnas.org/cgi/doi/10.1073/pnas.1911273116 Driehuis et al.
Dow
nloa
ded
by g
uest
on
Oct
ober
13,
202
1
and topoisomerase-1 (TOP1), are shown (Fig. 3B). In general,a similar response was observed for agents targeting the samebiological process or molecular pathway. As such, these resultsindicate that observed in vitro responses are indicative for truebiological vulnerabilities and are not the consequence of technicalvariability. For many of the PDOs tested, drugs could be identifiedfor which the individual PDO was more sensitive than all otherPDOs tested (Fig. 4A and SI Appendix, Fig. S10). Again, multipledrugs targeting the same molecular pathway were often foundamong the most effective drugs. Taken together, these find-ings support the hypothesis that specific targeted therapies willbe effective in only a subset of patients, and, as such, a per-sonalized approach will be required to select the right drug foreach individual patient.
In Vitro Response of PDOs Indicates Correlation with ClinicalPatient Responses in a Limited Number of PatientsClinical data on given treatment and therapy response was suf-ficient to assess therapy response in only 4 of the patients. Mostpatients did not receive treatment at all, or were given treatmentin the adjuvant setting (where assessment of therapy response isdifficult, since there is no detectable disease at the start of treat-ment). All 4 patients were treated with gemcitabine. Patient 1developed distant metastasis during treatment with this chemo-therapeutic agent. Indeed, PDO 1 was highly resistant to treatmentwith gemcitabine in vitro. In contrast, PDO 28 was among themost sensitive PDOs on treatment with gemcitabine. Patient 28was found to have stable disease with a decrease in distant livermetastasis after gemcitabine treatment, although later, the patientdeveloped distant metastasis and eventually succumbed to thedisease. In addition, patients 25 and 31 also presented with stabledisease after undergoing gemcitabine treatment. PDO 25 andPDO 31 were among the intermediate responders in our in vitroassays. Although the numbers are small, an overall correlationcould be observed between in vitro PDO response and clinicalpatient response (Fig. 4B). An overview of relevant patient in-formation in given in SI Appendix, Table S3.
DNA Status as a Predictor for In Vitro Drug ResponseIn addition to single-agent therapy screens, a number of tar-geted agents were combined with chemotherapeutics that arecurrently given to pancreatic cancer patients. Since both DNAstatus and drug response data of PDOs were available, we setout to correlate mutation status with drug response inan unbiased fashion, using both an elastic net model andTANDEM 2-step model. Among the strongest associations de-tected was the response to the HER2/EGFR inhibitor lapatinibcombined with gemcitabine. The response to this combination ofagents was measured as the difference between the predictedand observed area under the fitted dose–response curve (deltafAUC). This predicted AUC is based on the additive effect ofboth single agents. As such, a higher delta fAUC values indicateincreased sensitivity. Depending on the mutation status ofMAP3K1 and PIK3R1, response to these agents differed signifi-cantly between different PDOs (Fig. 4C). PDOs carrying aber-rant copy numbers of these kinases downstream of the EGFRreceptor (which is the target of lapatinib) showed increasedsensitivity to these agents. Other relevant associations were thosedetected between the response to the AKT-inhibitor MK-2206 combined with gemcitabine and the mutation status ofFGFR1 and CDKN2A (Fig. 4D). Since AKT is located down-stream of the PI3K family kinases, it is not surprising that herethe amplification of MAP3K1 and PIK3R1 did not pop up as apotential biomarker. Moreover, these results indicate the mutationstatus of these genes might serve as a potential biomarker to predictthe response to these therapies. A full report of the analysisperformed and the potential biomarkers identified is providedin Dataset S2.
Loss of MTAP Results in Sensitivity to PRMT5 InhibitionWe next focused on a specific therapeutic agent: the selective pro-tein arginine methyltransferase 5 (PRMT5) inhibitor EZP01556(26). The chromosome 9p21 locus is homozygously deleted in∼15% of all human cancers, including pancreatic cancer (27).This locus carries the gene cyclin-dependent kinase inhibitor 2A(CDKN2A), encoding the tumor suppressor alternative readingframe (p19-ARF) and inhibitor of CDK4 (p16-INK4) (28, 29).On CDKN2A deletion, nearby genes, such as methylthioadenosinephosphorylase (MTAP), are often codeleted. Indeed, MTAP isdeleted in 80 to 90% of the CDKN2A− tumors (30).MTAP plays acrucial role in the methionine salvage pathway by recycling itssubstrate 5′-methylthioadenosine (MTA), ultimately resulting inregeneration of methionine and adenosine (31). A recent searchfor therapeutic vulnerabilities in MTAP-deficient cells resultedin the identification of PRMT5 as a synthetic lethal gene inMTAP−
cells (32–34). The activity of PRMT5, responsible for methylationof a large number of substrates, including histones (35), is inhibitedby high levels of MTA (32). As MTA accumulates inMTAP− cells,exploring the potential of PRMT5 inhibition in MTAP− tumorsseems promising (36–38).CDKN2A and MTAP status of the PDOs were determined by
DNA and RNA sequencing (Fig. 5 A and B). DNA and RNA datawere concordant for all lines except PDO 8 and 11, where thechromosomal breakpoint was found within the MTAP gene body.RNA status was in concordance with the result of MTAP IHCperformed on a subset of the PDACs (SI Appendix, Fig. S11).Importantly, tumor 11 showed a positive MTAP immunostaining,whereas based on the detected DNA alteration, this detectedMTAPprotein is predicted to be nonfunctional. To quantify the response toEZP015556, the area under the curve (AUC) of all exposed PDOswas calculated. Indeed, MTAP− organoid lines showed increasedsensitivity to PRMT5 inhibition (Fig. 5C). The average IC50 was19.16 μM for MTAP+ lines and 0.68 μM for MTAP− organoid lines.Interestingly, a subset of MTAP+ PDOs also showed sensitivity toPRMT5 inhibition. MTAP+ PDOs 6, 9, 19, 20, 24, and 25 showedAUC values comparable to those of MTAP− organoid lines. Theseresults indicate that PRMT5 inhibition may prove effective inMTAP−
and in a subset of MTAP+ tumors. As such, these observations un-derscore the need for functional testing to identify potentially relevanttherapies.
Wild-Type MTAP Expression Decreases EZP015556 Sensitivityin MTAP+ LinesTo test the causal role of MTAP dysfunction in PRMT5 inhibitorsensitivity, a lentiviral doxycycline-inducible MTAP expressionvector was introduced in both MTAP− and MTAP+ EZP015556-sensitive organoid lines (SI Appendix, Fig. S12A). Functionalityof the construct was confirmed both by quantitative PCR(qPCR) for MTAP transcripts and by detection of GFP, whoseexpression was controlled by the same promotor as MTAP in theconstruct (SI Appendix, Fig. S12 B and C). Induction of MTAPexpression did not change the response of insensitive MTAP+
lines, but reduced EZP015556 sensitivity in MTAP− organoidlines, thereby confirming the causal role of MTAP deletion forEZP015556 sensitivity. Moreover, the induction of MTAP expres-sion decreased EZP015556 sensitivity in MTAP+-sensitive PDOs,suggestive of defective MTAP function in these lines (Fig. 5D).
PDOs Sensitive to PRMT5 Inhibition Are Marked by ElevatedMTA LevelsTo test whether the mechanism of increased EZP015556 sensi-tivity was similar in both MTAP− and MTAP+ lines, MTA levelswere assessed using proteomics. As reported previously, elevatedMTA levels were detected in MTAP− cells when compared toEZP015556-insensitive MTAP+ lines (36–38). In MTAP+ linessensitive to EZP015556, MTA was detected at levels comparable
Driehuis et al. PNAS Latest Articles | 5 of 11
CELL
BIOLO
GY
Dow
nloa
ded
by g
uest
on
Oct
ober
13,
202
1

A B
Fig. 3. High-throughput drug screening in PDOs reveals sensitivities to a range of therapeutic agents. (A) A total of 76 compounds were tested in 24 PDOs.The z-scores of obtained IC50 values are depicted in the heatmap. High values (indicating resistance) are depicted in red, and low values (indicating sensitivity)are in blue. An “X” indicates that the data generated for this compound/PDO combination are not present. Compounds are ordered alphabetically.(B) Response of PDOs to compounds targeting the same biological process or pathway, highlighting similar responses observed among the different com-pounds. High values (indicating resistance) are depicted in red, and low values (indicating sensitivity) are in blue.
6 of 11 | www.pnas.org/cgi/doi/10.1073/pnas.1911273116 Driehuis et al.
Dow
nloa
ded
by g
uest
on
Oct
ober
13,
202
1

to that of MTAP− lines (Fig. 5E). MTA levels could be restoredby overexpression of wild-type MTAP (Fig. 5F). These resultsconfirm a comparable mechanism of action of EZP015556 inboth subtypes of PDOs. Indeed, a correlation was observed be-tween MTA levels and EZP015556 sensitivity (Fig. 5G). Thesefindings suggest that MTA levels could be a better marker thanMTAP mutation status to predict response to PRMT5 inhibition.
DiscussionHere a biobank of 30 characterized pancreatic tumor organoidswas used to explore the translational potential of organoidtechnology. This was done in 2 ways. First, established organoids
and corresponding primary tissue were histologically assessedand compared for molecular characteristics. Second, after ge-netic characterization, the established PDOs were exposed to arange of therapeutic agents to identify therapies that effectivelykilled the pancreatic tumor cells.Morphology of primary tissue and corresponding organoids
revealed similarities. The expression levels of markers currentlyused in diagnostics were compared between organoids andcorresponding primary tissue. It was found that SMAD4 ex-pression was not detectable by IHC in organoids. As mentionedpreviously, this is likely due to the presence of BMP/TGF-β–inhibiting molecules Noggin and A83-01 in the organoid
A C
D
B
Fig. 4. Individual PDO drug responses indicate clinically relevant therapeutic vulnerabilities and reveal potential biomarkers for therapy response. (A) For PDO 5,PDO 6, and PDO 22, therapeutic compounds are arranged frommost effective to least effective. Enrichment of compounds that target the same biological processor pathway is observed. Inhibitors targeting the same target are shown in identical colors, with color-coding as in Fig. 3B. (B) Correlation between gemcitabineresponse of PDOs and corresponding patients. For patient clinical response, green indicates a response to gemcitabine treatment, and a black box indicates re-sistance to treatment. Sensitivity to chemotherapy is indicated by the z-score of IC50 values. (C) Response of PDOs treated with lapatinib and gemcitabine, depictedin delta fAUC, plotted for samples either with (red) or without (blue) copy number alteration ofMAP3K1 and PIK3R1. (D) Response of PDOs treated with MK-2206and gemcitabine, depicted in delta fAUC, plotted for samples either with (red) or without (blue) copy number alteration of FGFR1 or CDKN2A.
Driehuis et al. PNAS Latest Articles | 7 of 11
CELL
BIOLO
GY
Dow
nloa
ded
by g
uest
on
Oct
ober
13,
202
1

A
B
C
D
E F G
Fig. 5. PRMT5 inhibition is effective in a subset of PDOs. (A) Detection of CDKN2A and MTAP gene body loss in the 25 tumor-derived PDOs for whichreference DNA was available. Dark green indicates the presence and light green indicates the absence of gene-coding DNA. For both genes, both alleles areshown. (B) Expression levels of CDKN2A and MTAP as detected by RNA sequencing in PDOs. The heatmap shows log2 values of normalized counts. Redindicates a high value; blue, a low value. (C) Heatmap showing the AUC values of the response to EZP015556 of all tested PDOs and corresponding MTAP DNAstatus. Low AUC, indicating sensitivity to PRMT5 inhibition, is depicted in blue. High AUC, indicating low sensitivity to PRMT5 inhibition, is depicted in red.MTAP mutation status is indicated in the row below, with black indicating loss of MTAP and white indicating MTAP wild-type status. (D) Induction of MTAPexpression in MTAP+ (dark blue), MTAP− (light blue), and MTAP+ EZP01556-sensitive (red) lines. Cells are exposed to EZP015556 either in combination withdoxycycline-mediated induction (square symbols, dashed lines) or without (round symbols, solid lines). The experiment was performed in technical triplicate.DOX, doxycycline. (E) MTA levels detected in PDOs, shown in pmol/106 cells. MTA levels were measured in 3 MTAP+ PRMT5 inhibition-resistant lines (blue), 2MTAP− PRMT5-sensitive lines (green), and 3 MTAP+ PRMT5 inhibition-sensitive lines (red). (F) In MTAP+ PRMT5 inhibition-sensitive PDO 20, MTA levels weremeasured in a clone infected with the inducible MTAP overexpression construct. MTA levels were measured in both the absence (red bar) and presence (whitebar, red outline) of doxycycline, resulting in expression of wild-type MTAP protein. (G) Correlation plot showing correlation (significant, P = 0.0079, Pearsoncorrelation) between MTA levels (x-axis) and sensitivity to EZP015556, depicted by the AUC (y-axis).
8 of 11 | www.pnas.org/cgi/doi/10.1073/pnas.1911273116 Driehuis et al.
Dow
nloa
ded
by g
uest
on
Oct
ober
13,
202
1

medium. This result emphasizes the effect that medium compo-sition can have on cell behavior, a fact that is often overlooked.Despite the absence of SMAD4 staining, we showed that SMAD4wild-type organoids can be distinguished from SMAD4 mutantorganoids using functional selection. These findings highlight theimportance of using the correct technique to compare organoidsand primary tissue to assess translative potential and show thatIHC might not always be appropriate.To assess the potential of this system to identify or validate
effective therapies for pancreatic cancer, the generated PDObiobank was exposed to a library of both classical chemotherapiesand targeted agents. Although highly dependent on the quality andquantity of the primary material, the average time to establishenough organoids for such an extensive screening procedure isexpected to be 2 to 3 mo. However, this time can likely be reducedby decreasing the number of compounds tested (e.g., focusing onlyon those therapies currently used in first-line treatment).For most PDOs, we could identify multiple compounds that
showed effective tumor killing. Importantly, different drugs killedPDOs derived from different patients. No single therapy could beidentified that uniformly resulted in effective tumor killing for allPDOs, indicating that a “personalized” approach is required whenusing targeted therapies. To identify which therapy is most effec-tive for each individual patient, functional tests such as those de-scribed in this study might prove useful. Results indicating thatin vitro organoid responses can predict clinical outcome have beenpublished but require further validation before functional testingcan be applied in the clinic (6, 13, 39). It will be interesting tosee if this correlation holds true in pancreatic cancer and if so,whether organoids can be used to guide therapy decisions inthe clinic.For 4 patients, the available clinical data actually allowed for
such a comparison of the response to treatment of both the patientand the matching PDO. PDO 1, derived from tumor material of apatient presenting with progressive disease under gemcitabinetreatment, was indeed among the most resistant PDOs in our as-says. The 3 other patients were found to have stable disease afterreceiving gemcitabine treatment. Indeed, matching PDOs showedhigh or intermediate sensitivity to in vitro gemcitabine exposure.Although these results are encouraging, it should be kept in mindthat numbers are small. Moreover, interpretation of clinical dataof patients with pancreatic tumors is difficult, as complications arecommon and progression is quick. In the future, larger correlationstudies should be performed to validate the predictive potential ofpatient-derived pancreatic organoids.Finally, we used pancreatic cancer organoids to confirm that
PRMT5 inhibition effectively targetsMTAP− tumors. Our resultsindicate that a subset ofMTAP+ tumors also might be susceptibleto PRMT5 inhibition. Further research is needed to unravel themechanisms underlying this sensitivity, but our initial results in-dicate that this is caused by lack of function of the endogenousMTAP protein. Potentially, expression analysis of organoids thatare undergoing treatment with PRMT5 inhibitors will result inelucidation of the underlying mechanisms. Regardless, these find-ings highlight the fact that genetic testing might not always be suf-ficient to identify therapy responders. Clinical trials with PRMT5inhibitors are currently ongoing (NCT03573310, NCT02783300,and NCT03614728). It will be of interest to see if the MTAP (orCDKN2A) status of the tumors can be correlated to patientresponse.
ConclusionHere we report the establishment of a biobank of PDOs grownfrom pancreatic cancer and distal cholangiocarcinoma andcharacterized by histology, RNA sequencing, DNA sequencing,and drug response. Organoids retain histological features ofprimary tumors and carry genetic alterations commonly found inthis tumor type. High-throughput drug screening using a panel of
76 compounds identified a range of targeted therapies with ef-ficacy in PDOs. In line with personalized medicine approaches,therapy responses differed among the PDOs. The establishedPDO model was used to validate PMRT5 inhibition as a po-tential therapeutic approach for PDAC. We show that PRMT5-inhibitor EZP015556 can be effective in both MTAP− and asubset of MTAP+ PDOs, both of which are characterized by highMTA levels.
MethodsHuman Material for Organoid Cultures. The collection of patient data andtissue for the generation and distribution of organoids was done in accor-dance with the guidelines of the European Network of Research EthicsCommittees following European, national, and local law. The Biobank Re-search Ethics Committee of University Medical Center Utrecht (TCBio) ap-proved the biobanking protocol (12–093 HUB-Cancer) under whichthis research was performed. All donors participating in this study pro-vided signed informed consent. Available organoids are cataloged atwww.hub4organoids.eu and can be requested at [email protected].
Tissue Processing. Patient material was collected in Advanced DMEM/F12 (LifeTechnologies; 12634-034), supplemented with 1× GlutaMAX (adDMEM/F12;Life Technologies; 12634-034), penicillin-streptomycin (Life Technologies;15140-122) and 10 mM Hepes (Life Technologies; 15630-056) (desig-nated +/+/+ hereinafter). For collection of patient material, 100 μg/mL Primocin(InvivoGen; ant-pm1) was added. Material was cut into small fragments.Random pieces of ∼5 mm3 were stored at −20 °C for DNA isolation or fixedin formalin for histopathological analysis. Fragments were incubated at37 °C in 1 mg/mL collagenase (Sigma-Aldrich; C9407). Digested tissue wassheared using 5-mL pipettes. Cell suspension was diluted with 10 mL of +/+/+and strained over a 100-μm EasyStrainer filter (Greiner; 542000) andcentrifuged at 300 × g. The resulting pellet was resuspended in ice-cold 70%10 mg·mL−1 cold Cultrex growth factor reduced BME type 2 (Trevigen; 3533-010-02) in organoid medium. Droplets of ∼10 μL were plated in preheatedsuspension culture plates (Greiner; M9312). Plates were inverted and main-tained at 37 °C to let the BME solidify. After 30 min, prewarmed organoidmedium was added to the plates. For the first week, 10 μM rho-associatedkinase (ROCK) inhibitor (Y-27632; Abmole Bioscience; M1817) was added tothe medium.
Organoid Culture. Organoids were grown in +/+/+ supplemented with dif-ferent subsets of growth factors, depending on whether wild-type or tumororganoids were established. For organoids derived from wild-type tissue,medium consisted of Wnt3a-conditioned medium (50% vol/vol), plus +/+/+containing 1× B27 supplement (Life Technologies; 17504-044), 1,25 mMN-acetyl-L-cysteine (Sigma-Aldrich; A9165), 10 mM nicotinamide (Sigma-Aldrich; N0636), 50 ng/mL human EGF (PeproTech; AF-100-15), 500 nM A83-01, 100 ng/mL human FGF10 (PeproTech; 100-26), 1 μM prostaglandin E2(Tocris Bioscience; 2296), 10 nM gastrin (R&D Systems; 3006), 4% (vol/vol)RSPO, and Noggin (produced via the r-PEX protein expression platform atU-Protein Express BV). This medium was termed complete medium (CM).
Tumor organoids were grown in parallel in 2 types of tumor organoidmedia, tumormedium 1 (TM1) and tumormedium 2 (TM2). TM1was identicalto CM, the only difference being the absence of EGF and PGE2. The differencebetween TM2 and CM was the absence of PGE2, A83-01, and Wnt3a-conditioned medium.
For passaging, organoids were collected, washed, and disrupted either bymechanical shearing or digestion with TrypLE Express (Life Technologies;12605-010). After passaging, organoid fragments were replated in fresh BME,and 10 μMY-27632 was added to prevent cell death. The organoid passagingprocedure is described in detail in SI Appendix.
RNA Isolation and RNA Sequencing. Total RNA was isolated from organoidsthat had been passaged 4 to 6 d earlier using the Qiagen RNeasyMini Kit. Thequality and quantity of isolated RNA were checked and measured using theBioanalyzer 2100 RNA Nano 6000 Kit (Agilent; 5067-1511). Library prepa-ration was performed with 500 ng of total input RNA using the TruseqStranded Total RNA Kit with Ribo-Zero Human/Mouse/Rat Sets A and B(Illumina; RS-122-2201 and RS-122-2202). Library quality was checked usingthe Agilent High-Sensitivity DNA Kit (5067-4626) and the Qubit dsDNA HSAssay Kit (Thermo Fisher Scientific; Q32854). Libraries were pooled to afinal concentration of 2 nM. Library pools (1.0 to 1.4 pM) were loaded andsequenced on an Illumina NextSeq system with 2 × 75-bp high output.Samples were sequenced to an average depth of 22.2 ± 7.2 million
Driehuis et al. PNAS Latest Articles | 9 of 11
CELL
BIOLO
GY
Dow
nloa
ded
by g
uest
on
Oct
ober
13,
202
1

fragments. After quality control, mapping and counting analyses wereperformed using our in-house RNA analysis pipeline v2.1.0 (https://github.com/UMCUGenetics/RNASeq), based on best practices guidelines(https://software.broadinstitute.org/gatk/documentation/article.php?id=3891).
RNA Isolation, cDNA Synthesis, and qPCR.Organoids were collected from tissueculture plates and washed twice in 10 mL of +/+/+. RNA was extracted using TheQiagen RNeasy Mini Kit according to protocol. RNA was measured with aNanoDrop spectrophotometer (Thermo Fisher Scientific). For cDNA synthesis,GoScript Reverse Transcriptase (Promega; A5003) was used according to pro-tocol. qPCR reactions were performed in 384-well format using IQ SYBR Green(Bio-Rad; 1708880). More details are provided in SI Appendix.
IHC Staining. Tissue and organoids were fixed in 4% paraformaldehyde,followed by dehydration, paraffin- embedding, sectioning, and standard H&Estaining. Staining on tissue was performed at the University Medical CenterUtrecht using the following antibodies: anti-SMAD4 antibody (Santa CruzBiotechnology; mouse monoclonal, clone B-8, catalog no. sc7966, diluted1:300, 1 h at room temperature), anti-TP53 antibody (Thermo Fisher Scien-tific; mouse monoclonal, clone D07+BP53-12, catalog no. MS-738, ARS pH 9,diluted 1:2,000, 1 h at room temperature) or anti-MTAP antibody (Abcamab126770, rabbit monoclonal, clone ERP689, catalog no. ab126770, ARS pH6, diluted 1:1,000, overnight incubation at 4 °C). More details on stainingprocedures are given in the SI Appendix.
SMAD4 Signaling Detection. To detect the presence of SMAD4, organoidswere cultured for 2 wk in CM lacking A83-01 and Noggin. Suring this 2-wkperiod, organoids were passaged once. After 14 d, organoids were col-lected for RNA isolation and cDNA synthesis as described elsewhere.
DNA Isolation and KRAS PCR of PDOs. DNA was isolated according to proto-col, using the ReliaPrep gDNA Tissue Miniprep System (Promega; A2052)according to protocol. qPCR for exon 2 of human KRAS was performedusing forward primer 5′-ACACGTCTGCAGTCAACTGG-3′ and reverse primer5′- TAACTTGAAACCCAAGGTAC-3′, with GoTaq DNA Polymerase (Promega;M3008) according to protocol at an annealing temperature of 58 °C. A 1%Agarose gel was used to purify the qPCR product, and gel extraction wasperformed using the QIAquick Gel Extraction Kit (Qiagen; 28706). DNA wassequenced (using both forward and reverse sequencing primers) byMacrogen.
DNA Isolation and WGS of Organoid Lines. Organoids were dissociated andDNA was isolated using the QiaSymphony DSP DNA Mini Kit (Qiagen;937236). Libraries were prepared using the Illumina TruSeq DNA NanoLibrary Prep Kit (20015964). Paired-end sequencing of the organoid lineswas performed (2 × 150 bp) on the generated libraries with 30× coverageusing the Illumina HiSeq X Ten sequencing system at the Hartwig MedicalFoundation.
Somatic Mutation Calling. This procedure is described in detail in SI Appendix.
High-Throughput Drug Screens. A total of 24 PDOs were screened in the drugscreening facility of the Sanger Institute. In short, organoids were dissociatedinto single cells and plated in 384-well plates 4 d later. Test compounds wereadded 24 h later. After 72 h, cell viability was determined using a CellTiter-Glocell viability assay (Promega). Details on organoid drug screening and cellviability calculations are provided in SI Appendix.
Drug Screen Analysis and z-Score Calculation. IC50 values were normalized to az-score, using the formula z = (x − μ)/σ, where x is the IC50 value of the PDOof interest, μ is the average IC50 for all PDOs tested, and σ is the standard ofthe IC50 values for all PDOs tested. All calculations were performed withthese values to visualize differences in drug response between PDOs, incontrast to differences in IC50 values between different compounds.
PRMT5 Inhibitor Drug Screens. For exposure to EZP015556, cells were plated inBME droplets and exposed to a gradient of this compound for 14 d. Themedium was refreshed every 3 to 4 d. Readout was performed as previouslydescribed, using CellTiter-Glo. Technical details and cell viability calculationsare provided in SI Appendix.
Organoid Infection with MTAP Lentivirus. MTAP lentivirus was produced inHEK293 cells (SI Appendix). For infection, organoids were collected and thendisrupted into small clumps/single cells using TrypLE. After washing with
10 mL of +/+/+, the organoid pellet was resuspended in 150 μL of virus sus-pension, 1 μg/mL polybrene was added, and the mixture was transferredto a 48-well plate. After a 1-h centrifugation (600 × g, 32 °C), cells wereleft to incubate for 6 h with the virus. Then the organoid pellet was col-lected, washed twice with 10 mL of +/+/+, and plated as usual. After re-covery (3 to 5 d), organoids were cultured in the presence of 1 μg/mLpuromycin (InvivoGen; 58-58-2) to select for infected organoids. Infectedorganoids were expanded as usual. When ready, organoids were exposedto PRMT5 inhibitor as described previously in either the presence or ab-sence of 3 μg/mL doxycycline.
Sample Preparation for Liquid Chromatography-Mass Spectrometry Measurements.Organoids were passaged and cultured for 7 d. On the day of collection,2 U/mL dispase was added to the wells and left to incubate for 40 min at37 °C. Subsequently, organoids were washed 3 times in ice-cold PBSand then resuspended in 1 mL of +/+/+. A 10-μL sample was taken for cellcounting and transferred to a tube containing 1 mL of TrypLE. After a5-min incubation, cells were counted. The remaining intact organoidswere collected for metabolomic analysis. For this, organoid samples werequenched in 500 μL of dry-ice cold methanol/water solution (80%/20%;vol/vol; dry-ice cold), and then stored at −80 °C. Details on liquidchromatography-mass spectrometry sample preparation and measure-ments are provided in SI Appendix.
Identification of Synergistic Drug Combinations and Associated Biomarkers. Acombination drug screen was performed using 9 drugs (MK-2206, trametinib,linsitinib, lapatinib, mk-1775, taselisib, 5-fluorouracil, sorafenib, andSCH772984) in combination with 1 of 2 anchor drugs (gemcitabine andtrametinib), for a total of 11 unique combinations. Library compounds werescreened using a 7-point dose–response curve with a half-log dilution seriescovering a 1,000-fold range over a 72-h period, together with an anchorcompound at fixed concentration. Drug combination synergy is measured asthe difference between the expected and observed areas under the fitteddose–response curve (delta fAUC). The area under the curve is calculatedusing trapezoidal integration (AUC) and integrating the curve using theestimated parameters (fAUC). Synergy is present when the median deltafAUC across biological replicates is positive.
We implemented a drug response model to integrate multiple moleculardata types (SNPs/indels, copy number, andmRNAexpression) when predictingdrug combination synergy using TANDEM (40). TANDEM differs from con-ventional models by using a 2-step approach that first fits an elastic net topredict synergy based on copy number and mutation data, then fits a secondelastic net model to predict the residuals from the first model. This approachmaximizes the interpretability by emphasizing genetic perturbation of up-stream pathways. Features selected by TANDEM were ranked according tomagnitude of the elastic net coefficient, scaled by the variance in predictedoutcomes. The features depicted represent a selection from the top-rankedgenetic events (mutations and copy number aberrations). Full details on thecomplete analysis are provided in SI Appendix.
Data Availability. The organoid DNA and RNA sequencing data have beendeposited at the European Genome-phenome Archive (https://www.ebi.ac.uk/ega/studies/EGAS00001000369; accession no. EGAS00001003369). WGS dataof metastatic pancreatic cancer patients were obtained from the HartwigMedical Foundation and are available under data request number DR-010. ThisWGS data are freely available for academic use from the Hartwig MedicalFoundation through standardized procedures; a request form is available athttps://www.hartwigmedicalfoundation.nl.
ACKNOWLEDGMENTS. We thank all the employees of U-PORT UMCUtrecht for patient inclusion and tissue acquisition, Kim Boonekamp forher help with MTAP experiments, Fjodor Yousef Yengej for his help withqPCR experiments, Jens Puschhof and Maarten Geurts for their valuableinput on drug screen analysis, and the Genomics of Drug Sensitivity inCancer screening team. This publication and the underlying study weremade possible partly on the basis of the data that the Hartwig MedicalFoundation and the Center of Personalized Cancer Treatment madeavailable to the study. This work was funded by the Oncode Institute(partly financed by the Dutch Cancer Society), the gravitation programCancerGenomiCs.nl from the Netherlands Organization for ScientificResearch, and a Stand Up to Cancer International Translational CancerResearch Grant, a program of the Entertainment Industry Foundationadministered by the American Association for Cancer Research (SU2C-AACR-DT1213) and a ZonMw grant (116.006.103). M.J.G. received fundingfrom the Wellcome Trust (206194) and Cancer Research UK (C44943/A22536). The research of L.A.A.B. is funded by the Dutch DigestiveFoundation (MLDS CDG 14-020).
10 of 11 | www.pnas.org/cgi/doi/10.1073/pnas.1911273116 Driehuis et al.
Dow
nloa
ded
by g
uest
on
Oct
ober
13,
202
1

1. N. Howlader, A. Noone, M. Krapcho, D. Miller, K. Bishop, C. Kosary et al., “SEERCancer Statistics Review, 1975–2014” (National Cancer Institute, 2016).
2. R. B. Schmuck, C. V. de Carvalho-Fischer, C. Neumann, J. Pratschke, M. Bahra, Distalbile duct carcinomas and pancreatic ductal adenocarcinomas: Postulating a commontumor entity. Cancer Med. 5, 88–99 (2016).
3. T. Conroy, F. Desseigne, M. Ychou, O. Bouche, R. Guimbaud, Y. Becouarn et al.,FOLFIRINOX versus gemcitabine for metastatic pancreatic cancer. N. Engl J Med. 364,1817–1825 (2011).
4. D. D. Von Hoff, T. Ervin, F. P. Arena, E. G. Chiorean, J. Infante, M Moore et al., In-creased survival in pancreatic cancer with nab-paclitaxel plus gemcitabine. N. EnglJ Med. 369, 1691–1703.
5. T. Seino et al., Human pancreatic tumor organoids reveal loss of stem cell niche factordependence during disease progression. Cell Stem Cell 22, 454–467.e6 (2018).
6. H. Tiriac et al., Organoid profiling identifies common responders to chemotherapy inpancreatic cancer. Cancer Discov. 8, 1112–1129 (2018).
7. M. H. Bailey et al., Comprehensive characterization of cancer driver genes and mu-tations. Cell. 173, 371–385.e18 (2018). Erratum in: Cell 174, 1034–1035 (2018).
8. D. Tamborero et al., Cancer Genome Interpreter annotates the biological and clinicalrelevance of tumor alterations. Genome Med. 10, 25 (2018).
9. J. Drost, H. Clevers, Organoids in cancer research. Nat. Rev. Cancer. 18, 407–418 (2018).10. N. Sachs et al., A living biobank of breast cancer organoids captures disease hetero-
geneity. Cell 172, 373–386.e10 (2018).11. M. van de Wetering et al., Prospective derivation of a living organoid biobank of
colorectal cancer patients. Cell 161, 933–945 (2015).12. G. Vlachogiannis et al., Patient-derived organoids model treatment response of
metastatic gastrointestinal cancers. Science 359, 920–926 (2018).13. E. Driehuis et al., Oral mucosal organoids as a potential platform for personalized
cancer therapy. Cancer Discov. 9, 852–871 (2019).14. S. H. Lee et al., Tumor evolution and drug response in patient-derived organoid
models of bladder cancer. Cell 173, 515–528.e17 (2018).15. O. Kopper et al., An organoid platform for ovarian cancer captures intra- and in-
terpatient heterogeneity. Nat Med. 25, 838–849 2019).16. S. F. Boj et al., Organoid models of human and mouse ductal pancreatic cancer. Cell
160, 324–338 (2015).17. S. Bosari et al., p53 gene mutations, p53 protein accumulation and compartmental-
ization in colorectal adenocarcinoma. Am. J. Pathol. 147, 790–798 (1995).18. W. A. Freed-Pastor, C. Prives, Mutant p53: One name, many proteins. Genes Dev. 26,
1268–1286 (2012).19. P. Bailey et al.; Australian Pancreatic Cancer Genome Initiative, Genomic analyses
identify molecular subtypes of pancreatic cancer. Nature 531, 47–52 (2016).20. F. Blokzijl et al., Tissue-specific mutation accumulation in human adult stem cells
during life. Nature 538, 260–264 (2016).21. A. M. Taylor et al.; Cancer Genome Atlas Research Network, Genomic and functional
approaches to understanding cancer aneuploidy. Cancer Cell 33, 676–689.e3 (2018).
22. S. Christensen et al., 5-Fluorouracil treatment induces characteristic T→G mutations inhuman cancer. Nat Commun. 10, 4571 (2019).
23. H. Davies et al., HRDetect is a predictor of BRCA1 and BRCA2 deficiency based onmutational signatures. Nat. Med. 23, 517–525 (2017).
24. L. B. Alexandrov et al., Clock-like mutational processes in human somatic cells. Nat.Genet. 47, 1402–1407 (2015).
25. M. Jager et al., Deficiency of nucleotide excision repair explains mutational signatureobserved in cancer. bioRxiv 221168; https://doi.org/10.1101/221168 (November 15,2018).
26. E. Chan-Penebre et al., A selective inhibitor of PRMT5 with in vivo and in vitro potencyin MCL models. Nat. Chem. Biol. 11, 432–437 (2015).
27. R. Beroukhim et al., The landscape of somatic copy-number alteration across humancancers. Nature 463, 899–905 (2010).
28. T. Kamijo et al., Tumor suppression at the mouse INK4a locus mediated by the al-ternative reading frame product p19ARF. Cell 91, 649–659 (1997).
29. M. Serrano, G. J. Hannon, D. Beach, A new regulatory motif in cell-cycle controlcausing specific inhibition of cyclin D/CDK4. Nature 366, 704–707 (1993).
30. H. Zhang, Z. H. Chen, T. M. Savarese, Codeletion of the genes for p16INK4, methyl-thioadenosine phosphorylase, interferon-alpha1, interferon-beta1, and other 9p21markers in human malignant cell lines. Cancer Genet. Cytogenet. 86, 22–28 (1996).
31. V. Zappia, F. Della Ragione, G. Pontoni, V. Gragnaniello, M. Carteni-Farina, Human 5’-deoxy-5’-methylthioadenosine phosphorylase: Kinetic studies and catalytic mecha-nism. Adv. Exp. Med. Biol. 250, 165–177 (1988).
32. G. V. Kryukov et al., MTAP deletion confers enhanced dependency on the PRMT5arginine methyltransferase in cancer cells. Science 351, 1214–1218 (2016).
33. K. J. Mavrakis et al., Disordered methionine metabolism in MTAP/CDKN2A-deletedcancers leads to dependence on PRMT5. Science 351, 1208–1213 (2016).
34. K. Marjon et al., MTAP deletions in cancer create vulnerability to targeting of theMAT2A/PRMT5/RIOK1 axis. Cell Rep. 15, 574–587 (2016).
35. V. Karkhanis, Y. J. Hu, R. A. Baiocchi, A. N. Imbalzano, S. Sif, Versatility of PRMT5-induced methylation in growth control and development. Trends Biochem. Sci. 36,633–641 (2011).
36. A. P. Stevens et al., Direct and tumor microenvironment-mediated influences of 5′-deoxy-5′-(methylthio)adenosine on tumor progression of malignant melanoma. J.Cell. Biochem. 106, 210–219 (2009).
37. K. Limm et al., Deregulation of protein methylation in melanoma. Eur. J. Cancer 49,1305–1313 (2013).
38. I. Basu et al., A transition state analogue of 5′-methylthioadenosine phosphorylaseinduces apoptosis in head and neck cancers. J. Biol. Chem. 282, 21477–21486 (2007).
39. G. Vlachogiannis et al., Patient-derived organoids model treatment response ofmetastatic gastrointestinal cancers. Science 359, 920–926 (2018).
40. N. Aben, D. J. Vis, M. Michaut, L. F. A. Wessels, TANDEM: A two-stage approach tomaximize interpretability of drug response models based on multiple molecular datatypes. Bioinformatics 32, i413–i420 (2016).
Driehuis et al. PNAS Latest Articles | 11 of 11
CELL
BIOLO
GY
Dow
nloa
ded
by g
uest
on
Oct
ober
13,
202
1