[panel on research_and_development_priorities_for_(book_fi.org)
TRANSCRIPT

Panel on Research and Development Priorities for the U.S. Census Bureau’s State and Local Government Statistics Program
Committee on National Statistics
Division of Behavioral and Social Sciences and Education
State and LocaL Government StatiSticS
at a croSSroadS
THE NATIONAL ACADEMIES PRESS 500 Fifth Street, N.W. Washington, DC 20001
NOTICE: The project that is the subject of this report was approved by the Govern-ing Board of the National Research Council, whose members are drawn from the councils of the National Academy of Sciences, the National Academy of Engineer-ing, and the Institute of Medicine. The members of the panel responsible for the report were chosen for their special competences and with regard for appropriate balance.
This study was supported by Contract No. YA132305CN0031 between the Na-tional Academy of Sciences and the United States Census Bureau. Support of the work of the Committee on National Statistics is provided by a consortium of federal agencies through a grant from the National Science Foundation (award number SBR-0453930). Any opinions, findings, conclusions, or recommendations expressed in this publication are those of the author(s) and do not necessarily reflect the views of the organizations or agencies that provided support for the project.
Library of Congress Cataloging-in-Publication Data
State and local government statistics at a crossroads : panel on research and development priorities for the U.S. Census Bureau’s state and local government statistics program / Committee on National Statistics. — 1st ed. p. cm. Includes bibliographical references. ISBN 978-0-309-11136-2 (paperback) — ISBN 978-0-309-11137-9 (pdf) 1. State governments—United States—Statistics. 2. Local government—United States—Statistics. I. National Research Council (U.S.). Committee on National Statistics. JK2408.S788 2007352.7'52130973--dc22 2007037284
Additional copies of this report are available from the National Academies Press, 500 Fifth Street, N.W., Lockbox 285, Washington, DC 20055; (800) 624-6242 or (202) 334-3313 (in the Washington metropolitan area); Internet, http://www.nap.edu
Printed in the United States of America.Copyright 2007 by the National Academy of Sciences. All rights reserved.
Suggested citation: National Research Council. (2007). State and Local Government Statistics at a Crossroads. Panel on Research and Development Priorities for the U.S. Census Bureau’s State and Local Government Statistics Program. Committee on National Statistics, Division of Behavioral and Social Sciences and Education. Washington, DC: The National Academies Press.

The National Academy of Sciences is a private, nonprofit, self-perpetuating society of distinguished scholars engaged in scientific and engineering research, dedicated to the furtherance of science and technology and to their use for the general welfare. Upon the authority of the charter granted to it by the Congress in 1863, the Acad-emy has a mandate that requires it to advise the federal government on scientific and technical matters. Dr. Ralph J. Cicerone is president of the National Academy of Sciences.
The National Academy of Engineering was established in 1964, under the charter of the National Academy of Sciences, as a parallel organization of outstanding en-gineers. It is autonomous in its administration and in the selection of its members, sharing with the National Academy of Sciences the responsibility for advising the federal government. The National Academy of Engineering also sponsors engineer-ing programs aimed at meeting national needs, encourages education and research, and recognizes the superior achievements of engineers. Dr. Charles M. Vest is presi-dent of the National Academy of Engineering.
The Institute of Medicine was established in 1970 by the National Academy of Sciences to secure the services of eminent members of appropriate professions in the examination of policy matters pertaining to the health of the public. The Insti-tute acts under the responsibility given to the National Academy of Sciences by its congressional charter to be an adviser to the federal government and, upon its own initiative, to identify issues of medical care, research, and education. Dr. Harvey V. Fineberg is president of the Institute of Medicine.
The National Research Council was organized by the National Academy of Sci-ences in 1916 to associate the broad community of science and technology with the Academy’s purposes of furthering knowledge and advising the federal government. Functioning in accordance with general policies determined by the Academy, the Council has become the principal operating agency of both the National Academy of Sciences and the National Academy of Engineering in providing services to the government, the public, and the scientific and engineering communities. The Coun-cil is administered jointly by both Academies and the Institute of Medicine. Dr. Ralph J. Cicerone and Dr. Charles M. Vest are chair and vice chair, respectively, of the National Research Council.
www.national-academies.org

* Until July 2006.
v
PANEL ON RESEARCH AND DEvELOPMENT PRIORITIES FOR THE U.S. CENSUS BUREAU’S STATE AND
LOCAL GOvERNMENT STATISTICS PROGRAM
RICHARD P. NATHAN (Chair), Nelson A. Rockefeller Institute of Government, Albany, New York
JOHN L. CZAJKA, Mathematica Policy Research, Inc., Washington, DCJOHN L. KNAPP, Business and Economics Section, Weldon Cooper
Center for Public Service, University of VirginiaYOLANDA K. KODRZYCKI, Federal Reserve Bank of BostonDAVID A. MARKER, Westat, Rockville, MarylandDAVID YOUNG MILLER, Graduate School of Public and International
Affairs, University of Pittsburgh ROBERT P. PARKER, Consultant and Bureau of Economic Analysis and
Government Accountability Office (Retired), Washington, DCROBERT P. STRAUSS, H. John Heinz III School of Public Policy and
Management, Carnegie Mellon University
THOMAS J. PLEWES, Study DirectorCARYN E. KUEBLER, Associate Program OfficerDONALD J. BOYD, ConsultantLANCE HUNTER,* Program Assistant MICHAEL SIRI, Senior Program Assistant
vi
COMMITTEE ON NATIONAL STATISTICS 2007
WILLIAM F. EDDY (Chair), Department of Statistics, Carnegie Mellon University
KATHARINE ABRAHAM, Joint Program in Survey Methodology, University of Maryland
ROBERT BELL, AT&T Research Laboratories, Florham Park, New Jersey
WILLIAM DuMOUCHEL, Lincoln Technologies, Inc., Waltham, Massachusetts
JOHN HALTIWANGER, Department of Economics, University of Maryland
V. JOSEPH HOTZ, Department of Economics, University of California at Los Angeles
KAREN KAFADAR, Department of Mathematical Sciences, University of Colorado at Denver and Health Sciences Center
DOUGLAS MASSEY, Department of Sociology, Princeton UniversityVIJAY NAIR, Department of Statistics and Department of Industrial and
Operations Engineering, University of Michigan–Ann Arbor JOSEPH NEWHOUSE, Division of Health Policy Research and
Education, Harvard UniversitySAMUEL H. PRESTON, Population Studies Center, University of
PennsylvaniaKENNETH PREWITT, School of International and Public Affairs,
Columbia UniversityLOUISE RYAN, Department of Biostatistics, Harvard UniversityNORA CATE SCHAEFFER, Department of Sociology, University of
Wisconsin–MadisonALAN ZASLAVSKY, Department of Health Care Policy, Harvard
University Medical School
CONSTANCE F. CITRO, Director
vii
Contents
Preface ix
Acronyms and Abbreviations xiii
Executive Summary 1
1 Introduction 11 Importance of the State and Local Government Sector, 12 Role of the Governments Division, 14 Issues for the Panel, 16 Outline of the Report, 18
2 The Government Statistics Program in Context 19 Historical Data Collection, 20 Governments Division Portfolio Today, 23 Classification of Governments, 26 Effects of Program Cutbacks, 32
3 Data Users and Uses 38 Federal Government Users, 39 Public Interest Groups, 51 Research Institutions and Academic Researchers, 53 Data Users as Data Disseminators, 58 Conclusions and Recommendations, 61
viii CONTENTS
4 Data Quality and Statistical Methods 69 Dimensions of Quality, 70 Sample Frame Development and Design, 71 Data Collection Methods, 74 Nonresponse, 78 Estimation, 84 Data Processing, 86 Revision Policies, 87 Cognitive Testing of Questionnaires, 89 Redesign of the Quarterly Tax Survey, 90 Planning for Improvements in Statistical Methodology, 92 5 Dissemination and Analysis 94 Timeliness, 94 Governments Division Website, 100 In-House Analyses, 104
6 Challenges for the Future 107 Strategic Planning, 108 Building the User Community and Obtaining User Input, 113 Role of Standards, 116 Conclusion, 123
References 125
Appendixes
A Governments Division Census and Surveys 129
B Reimbursable Programs 137
C Letters on the Taxable Property Value Survey 146
D Summary of Presentations of Public Interest and Other User Groups 151
E Meeting and Workshop Agendas 157
F Biographical Sketches of Panel Members and Staff 162
ix
Preface
State and local governments play crucial roles in the daily lives of citizens and in the national economy. Knowledge about the finances, employment, and programs of state and local governments is vital for
many purposes and many groups. Statistics about state and local govern-ments have been collected by the national government since before the Civil War. An in-depth Census of Governments was established by law in 1950 to be conducted every five years; the first such census was conducted 50 years ago in 1957. The panel on Research and Development Priorities for the U.S. Census Bureau’s State and Local Government Statistics Program was created on this 50th anniversary to carry out the first impartial outside review of the role and work of the Governments Division. The division conducts the quinquennial Census of Governments and publishes annual reports on state and local finances. Its work in defining the 80,000-plus governmental units for which data are provided constitutes the gold stan-dard for understanding the character and operations of American federal-ism and the activities of states and localities, which account for 12 percent of the gross domestic product and directly employ 1 in 7 workers in the national labor force.
Our panel of eight members, established by the Committee on National Statistics of the National Research Council, began its work late in 2005 to assess and report on research and development priorities for the state and local government statistics program. We were tasked with the job of identifying issues for the Census of Governments and the annual and quarterly surveys of governments with regard to goals, content, statistical
x PREFACE
methodology, data quality, and data products. We were also tasked with considering data uses and users and the relevance and adequacy of the census and survey content and products for meeting current and emerging data needs. It was a bigger job than we expected and took us longer than we planned. To a person, we consider our work vitally important and are proud to share the results of our deliberations, in the course of which we reached out to a wide range of experts on and users of census data on state and local governments.
The principal fact-finding activity of the panel was a workshop held June 22–23, 2006. To plan our work and the content of the workshop, the panel met in January 2006 to hear from senior Census Bureau representa-tives on the status of state and local government statistics programs. The panel is grateful for the participation of Thomas L. Mesenbourg, associate director for economic programs; Stephanie H. Brown, chief of the Govern-ments Division; Henry S. Wulf, assistant division chief for recurring pro-grams; and Carma R. Hogue, chief of the statistical support and consulting staff, Economic Statistical Methods and Programming Division. They pro-vided informative and frank discussion of the status of the programs both in the planning meeting and at the workshop. Their willing cooperation with our many requests for information to assist in framing the issues and arriv-ing at recommendations is commendable. Special thanks go to Henry Wulf, who was the primary liaison between the panel and the Census Bureau. He went out of his way on many occasions to respond to questions posed by the panel and to provide helpful materials as our review progressed.
In preparing for the workshop, the panel solicited the comments of a number of user organizations to ensure that the workshop presenta-tions were representative of the majority of public uses. We express our appreciation to the following individuals, who represented their organiza-tions in person and by phone in an informal meeting with several of the panel members to discuss how they use the state and local government statistics: Ron Alt and Harley Duncan, Federation of Tax Administrators; Keith Brainerd, National Association of State Retirement Administrators; Christiana Brennan, National League of Cities; Jackie Byers, National As-sociation of Counties; Eric Lupher, Citizens Research Council of Michigan and a member of the Governmental Research Association; Stacey Mazer, National Association of State Budget Officers; Evelina Moulder, Inter-national City/County Management Association; Richard Raphael, Fitch Ratings; and Ron Snell, National Council of State Legislatures; and Audrey Curry Wall, Council of State Governments.
The workshop was the panel’s primary data-gathering activity. Its ob-jective was identifying issues for the Census of Governments and the an-nual and quarterly surveys of governments with regard to goals, content, statistical methodology, data quality, and data dissemination. The two-day
PREFACE xi
workshop also considered data uses, the needs of users, and the relevance and adequacy of the census and survey content and products for meeting current and emerging data needs. The agendas of the planning meeting and the workshop appear in Appendix E.
In addition to hearing presentations from senior Census Bureau offi-cials, the panel organized several topical sessions and heard from experts in the relevant fields. Recognizing the growing influence of standardized finan-cial reporting among state and local governments, the panel benefited from a summary of recent Government Accounting Standards Board issuances from Ken Schermann of the board. During lunch, Anne Jordon, managing editor of Governing Magazine, outlined the important and extensive use of state and local statistics in the preparation of this publication. Dennis Fixler, Bureau of Economic Analysis, and Paul Smith, Board of Governors, Federal Reserve System, addressed the important federal government uses of the data. In two sessions, Evelina Moulder, Michael Pagano, George Palumbo, Andrew Reschovsky, Phyllis Resnick, and Kim Rueben gave sub-stance and depth to the panel’s understanding of the importance of state and local government statistics for public interest groups and the academic research community. Tracey Gordon of the Public Policy Institute of Cali-fornia, Kim Rueben of the Urban Institute, and Bill Shobe of the University of Virginia addressed dissemination issues. The panel is deeply appreciative of the work that went into preparing for these presentations and the will-ingness of all who shared their views.
Following the workshop, members of the panel met with staff of the Census Bureau’s Governments Division to clarify several issues of statistical methodology, before deliberating and preparing this report with its recom-mendations for priority areas for R&D to improve the government statistics program. In summary, this report is the product of a series of focused open sessions and a good deal of discussion with data users and Census Bureau staff, which enabled the panel members to refine understanding of key is-sues in state and local government statistics.
The panel is grateful for the excellent work of the staff of the Commit-tee on National Statistics and the National Research Council for support in developing and organizing the workshop and this report. Tom Plewes, study director for the panel, was ably assisted by Caryn Kuebler of the Commit-tee on National Statistics staff in supporting the work of the panel. Caryn drafted the workshop summary, on which much of this report is based, and also provided research support. Donald J. Boyd, deputy director of the Center for Policy Research at the Nelson A. Rockefeller College of Public Affairs and Policy, University at Albany, provided key advice and critical assistance in the fine-tuning of the panel’s ideas, and his contribution is gratefully acknowledged. Lance Hunter and Michael Siri provided admin-istrative support to the panel. We are especially thankful for the personal
xii PREFACE
participation of Constance F. Citro, director of the Committee on National Statistics, in the conduct of the workshop and in the preparation of this report. Her sage advice benefited the report in numerous ways.
This report has been reviewed in draft form by individuals chosen for their diverse perspectives and technical expertise, in accordance with pro-cedures approved by the NRC’s Report Review Committee. The purpose of this independent review is to provide candid and critical comments that assist the institution in making its report as sound as possible, and to en-sure that the report meets institutional standards for objectivity, evidence, and responsiveness to the study charge. The review comments and draft manuscript remain confidential to protect the integrity of the deliberative process.
The panel wishes to thank the following individuals for their review of this report: Christopher Briem, University Center for Social and Urban Research, University of Pittsburgh; William F. Eddy, Department of Statis-tics, Carnegie Mellon University; Ronald Fisher, Honors College, Michigan State University; Daniel Kasprzyk, Mathematica Policy Research, Washing-ton, D.C.; John L. Mikesell, School of Public and Environmental Affairs, Indiana University; Kim Rueben, the Urban Institute, Washington, D.C.; and David L. Sjoquist, Fiscal Research Center, Georgia State University. Although the reviewers listed above have provided many constructive com-ments and suggestions, they were not asked to endorse the conclusions or recommendations, nor did they see the final draft of the report before its release. The review of this report was overseen by Barbara A. Bailar, Con-sultant, Washington, D.C. Appointed by the National Research Council, she was responsible for making certain that the independent examination of this report was carried out in accordance with institutional procedures and that all review comments were carefully considered. Responsibility for the final content of the report rests entirely with the authoring panel and the institution.
Richard P. Nathan, Chair Panel on Research and Development Priorities for the U.S. Census Bureau’s State and Local Government Statistics Program
xiii
Acronyms and Abbreviations
ACIR Advisory Commission on Intergovernmental RelationsACS American Community SurveyAEA American Economics AssociationAES Annual Public Employment SurveyAFS Annual Survey of State and Local Government FinancesAMA American Marketing AssociationASA American Statistical Association
BEA Bureau of Economic Analysis
CAFR Comprehensive Annual Financial ReportCDP Census designated placeCMS Centers for Medicare and Medicaid ServicesCNSTAT Committee on National StatisticsCOFOG United Nations Classification of Functions of GovernmentCOG Census of GovernmentsCOPAFS Council of Professional Associations on Federal StatisticsCPAN Community Policy Analysis Network
DHS Department of Homeland Security
EPA Environmental Protection AgencyESMPD Economic Statistical Methods and Programming Division
xiv ACRONYMS AND ABBREVIATIONS
FIPS Federal Information Processing StandardsFRB Board of Governors, Federal Reserve System FTA Federation of Tax Administrators
GAAP Generally accepted accounting principlesGASB Government Accounting Standards BoardGDP Gross domestic productGID Governments Integrated DirectoryGRA Governmental Research Association GSP Gross state product
HUD Department of Housing and Urban Development
ICMA International City/County Management Association IT Information technology
NACO National Association of Counties NAICS North American Industry Classification SystemNASBO National Association of State Budget Officers NASRA National Association of State Retirement Administrators NCES National Center for Education StatisticsNCSL National Conference of State Legislatures NHEA National health expenditure accountsNIPA National income and product accountsNLC National League of Cities NRC National Research CouncilNSF National Science Foundation
OMB Office of Management and Budget
PAA Population Association of AmericaPI Personal income
R&D Research and developmentRSS Really simple syndication
SHA System of Health AccountsSIAM Section on Intergovernmental Administration and
Management, Society of Public AdministrationSIC Standard Industrial Classification SystemSIPP Survey of Income and Program ParticipationSNA System of National AccountsStEPS Standard Economic Processing System

ACRONYMS AND ABBREVIATIONS xv
TPV Taxable Property Values Survey
VIUS Vehicle Inventory and Use Survey

�
Executive Summary
The U.S. Census Bureau’s Governments Division provides informa-tion on the revenues, expenditures, employment, and operations of the 50 states and the District of Columbia, as well as more than
87,000 local governments—counties, towns and townships, cities, school districts, and special districts. Together with the federal government, on which the Governments Division also provides data, these state and local jurisdictions collectively make up the enduring and complex U.S. system of government. The data collected in the division’s quinquennial Census of Governments and annual and quarterly surveys serve two major user com-munities: (1) federal agencies that produce key economic time series, such as the contribution of state and local governments to the gross domestic product, and the many public and private sector decision makers and ana-lysts who use these time series and (2) researchers, analysts, public interest groups, the media, and the public who want information on individual state and local governments to understand their functioning, the relationships among them, and their impacts on people and communities.
The Governments Division and the Census Bureau’s Economic Direc-torate, of which the division is a part, are engaged in strategic planning activities and initiatives to modernize data collection and processing proce-dures. These efforts are being conducted in an environment of constrained resources, which, over the past 15 or more years, have resulted in cutbacks in data collection and dissemination by the division. The Census Bureau asked the National Research Council, through its Committee on National Statistics, to establish a panel of experts to review the division’s core pro-

� STATE AND LOCAL GOVERNMENT STATISTICS AT A CROSSROADS
grams and to recommend priority areas for research and development to move the government statistics program forward in ways that are cost-effective and responsive to users.
The panel concludes that the Governments Division is at a crossroads. One path is to continue to cut back on its data series, which could erode state and local government response to requests for information and user support of its programs. The other path is to plan for ways to improve survey efficiency; build its user base; enhance the timeliness, relevance, and quality of its data series; and add back valuable explanatory material and other assistance to public- and private-sector users. The panel strongly supports moving forward in a positive direction, which will require the unstinting support of senior Census Bureau management.
In the panel’s view, the best approach is to develop a two-track strategic plan. We recommend that senior management of the Economic Directorate should charge the division to develop one track that plans how to adapt in the most cost-effective and user-responsive manner to an environment in which resources may remain constrained and a second track that looks for opportunities to build the division’s user community and develop its program for the future. Senior management of the Economic Director-ate should also empower the division to establish an advisory group for continuing user input and should encourage it to work proactively with standards-setting bodies.
Furthermore, the Economic Directorate should continue to strengthen its efforts to bring modern survey design, data processing, and statistical estimation methods to all of its programs, including the state and local gov-ernment statistics program. The statistical methods underpinning state and local government surveys require continuous attention and the commitment of scarce human, technological, and financial resources. In this report, the panel has outlined some steps that can be taken in the near term to shore up the statistical infrastructure for the state and local governments pro-gram that are not excessively resource-intensive and that could well have an immediate payoff. These steps are critical to keep the division’s data in the mainstream of international and national thinking and to maintain its well-earned reputation as an honest broker and provider of invaluable information for measurement of state and local government activity.
MAJOR CONCLUSIONS AND RECOMMENDATIONS1
The panel’s major conclusions address:
1 Findings and recommendations are numbered by chapter (3-1, 3-2, etc.).
EXECUTIVE SUMMARY �
• The value of the state and local government statistics data.• The consensus among users that the data represent the highest stan-
dard for consistent comparable analysis of governmental finances across governments and over time.
• The benefits to users when the program provides both aggregate statistics and information based on the analysis of micro-level data.
• Users’ priority needs for more timely data, additional data to track important changes in governmental financing and expendi-ture structures, and avoiding gaps in basic time series.
The panel’s major recommendations address:
• A process for working with users to evaluate and agree on opti-mal changes to the Governments Division data to improve their relevance.
• The necessity to maintain basic time series and the use of methods to bridge transitions when data contents are modified.
• Research on the effects of periodic survey redesign and changes in sample size on the accuracy of the data, especially for measures of changes.
• Priority research on improving timeliness by releasing partial data or preliminary estimates, or both.
• Adding value to the data that are released on the division’s website through the addition of explanatory and analytical materials and other means.
• A two-track strategic planning process, in which one track postu-lates continued constrained resources and the other track outlines a path to build support for the state and local government statistics program that, over time, will enable it to serve the full range of user needs.
Some of these recommendations may be implemented in the near term with relatively low costs, such as recommendations for documentation of nonresponse and improvements in imputation, and they should be consid-ered “low-hanging fruit” in a research and development program leading to program improvements. Others, such as research leading to improving timeliness, must proceed on a more deliberate basis, supported by advice from expert and user groups, and within the structure of the strategic plan that we recommend.
� STATE AND LOCAL GOVERNMENT STATISTICS AT A CROSSROADS
value of State and Local Government Statistics
Conclusion 3-1: The data on state and local governments from the Census Bureau’s Governments Division are of broad national interest and importance.
• The data serve a democratic nation built on principles of decentral-ization and local control by maintaining a comprehensive source of information on state, regional, and local governments that assists those institutions and public interest organizations—and through them, the public—to understand how individual governments com-pare with other governments on such important measures as tax burdens and expenditures on education, security, health, and other public services.
• The data are necessary for comparative research and policy analy-sis of levels and trends on a wide range of important topics, such as the changing nature of local and regional government institu-tions, including the emergence of new forms of local governance; intergovernmental grants and transfers of funds; the layering of governmental functions among types of governmental units; the effects of changes in the economy on revenues, expenditures, and government borrowing and indebtedness; and the burdens of prop-erty and other taxes.
• The data are essential for economic time series that are widely used for public- and private-sector decision making, such as the national income and product accounts, the regional accounts, the flow of funds accounts, and the national health expenditure accounts.
Conclusion 3-2: Virtually all users of the Census Bureau’s Governments Division data, including federal agencies, public interest groups, and academic researchers, view the data as authoritative and valuable be-cause of the unsurpassed consistency of the data over time and across governments and the use of carefully specified standards and definitions for classifying governments and governmental activities.
Conclusion 3-3: The Census Bureau’s Governments Division data serve two main communities: users of aggregate estimates (macrodata) for key economic time series, which include the federal agencies that pro-duce these time series, primarily the Bureau of Economic Analysis and the Federal Reserve Board, and users of data for individual state and lo-cal governments (microdata) for research, policy analysis, and compar-ative rankings. While these two groups of users differ in some respects
EXECUTIVE SUMMARY �
in their views of priority needs from the division, both groups benefit when the full range of needs is considered in establishing priorities.
Conclusion 3-4: Users are in broad agreement about priority improve-ments they would like made in the Census Bureau’s Governments Di-vision data on state and local government finances and employment. Improving the timeliness of the data is of the highest importance, fol-lowed closely by improvements in the detail provided and in the clas-sification structure and avoidance of gaps in time series.
Relevance and Historical Continuity
Recommendation 3-1: Over the next two to three years, the Govern-ments Division should seek input for and widely circulate a working paper that describes potential improvements to the detail and classifica-tion of the division’s data on state and local government finances and employment, the issues that each may raise, and the pros and cons of changes. Based on feedback from users, the division should develop a plan with well-justified priorities for improvements to be made in the 2012 Census of Governments and subsequent annual surveys.
This would be a large undertaking involving considerable effort by the Governments Division and by many users, but the benefits could be substantial.
Recommendation 3-2: The Governments Division should give priority to maintaining basic time series on state and local government finances and employment. It should avoid gaps and interruptions in basic time series, which undermine the ability of users to make consistent com-parisons over time and across jurisdictions. When new or modified content is introduced, the division should use such methods as over-lapping series or bridges between new and old series to assist users in making the transition.
Data Quality and Statistical Methods
Recommendation 4-1: With respect to future modifications of its meth-odologies, the Governments Division should conduct research to deter-mine the effects of any redesigns of its surveys or changes in sample sizes on the accuracy of the data, especially the accuracy of measures of change. The division should provide information to users, including
� STATE AND LOCAL GOVERNMENT STATISTICS AT A CROSSROADS
standard errors and confidence intervals, to help them assess the effects of redesigns and changes in sample sizes on the accuracy and usefulness of time series.
Timeliness
Recommendation 5-1: The Governments Division should give high priority to a program of research on the benefits and costs of adopt-ing earlier release procedures for the annual finance survey and other surveys by such methods as releasing preliminary estimates or releasing estimates as they are compiled. The research should include evaluation of the ability of preliminary releases to replicate prior-year data and analysis of preliminary-to-final differences attained by using different estimation techniques.
Data Dissemination and Analysis
Recommendation 5-3: The Governments Division should add value to the data that are released on its website by providing simple derived measures, such as per capita expenditures and taxes, more explanatory material, and comparative contextual analyses—for example, of trends by type of government and region. The division should also facilitate wider dissemination of its data by regularly issuing press releases that include statistical comparisons with previous data.
Strategic Planning
Conclusion 6-1: The current strategic planning for the Census Bureau’s Economic Directorate is predicated on the likelihood of continued constrained budget resources and the need to give highest priority to providing data to support the national income and product accounts and other key economic time series. Consequently, the Governments Division is compelled to give priority to the publication of aggregated data on state and local government finances over the analysis of data on individual governments, intergovernmental relations, and the struc-ture and operations of governments.
Recommendation 6-1: The Governments Division should include two tracks in its strategic plan: one track that plans for an environment of constrained resources and a second track that identifies ways to build

EXECUTIVE SUMMARY �
support over time for enhancing the division’s data series and the infor-mation provided to users on the Census Bureau website. The Economic Directorate and, by extension, senior Census Bureau management, should support the Governments Division’s planning efforts in this re-gard and should make available some resources to begin implementing one or more aspects of the second track of the division’s plan.
OTHER CONCLUSIONS AND RECOMMENDATIONS
Additional conclusions and recommendations of the panel, most of which are summarized below, address the following issues:
• The need to revisit methods to collect information on taxable property values in a cost-effective manner, given the importance of property taxes to local government finances.
• The accuracy and transparency of the Governments Division data, needed improvements in methods and documentation for aspects of data collection and processing, and methodological issues for the redesign of the quarterly tax survey.
• The need for continuous improvement of the Governments Divi-sion website (currently under way).
• The establishment of an advisory group for the Governments Divi-sion to provide ongoing input to its programs.
• The importance of close coordination with the increasingly impor-tant work of the Government Accounting Standards Board.
Taxable Property values
Recommendation 3-4: In view of the importance of consistent, com-parable, objective data on property tax valuation and other features of property taxation by state and local governments, the Governments Division should carry out a program of research and testing to explore conceptually sound and cost-effective means of collecting these data, which could be in conjunction with, or independent from, the Census of Governments.
Data Quality and Statistical Methods
Summary of conclusions: The panel reviewed the coverage of the uni-verse of general governments in the Census of Governments and annual and quarterly surveys and found that it appears to be complete for virtually all analytical purposes. However, the panel concluded that the documentation
� STATE AND LOCAL GOVERNMENT STATISTICS AT A CROSSROADS
of nonresponse, particularly item nonresponse, in Governments Division surveys is inadequate to inform users or to help the division plan effective means to increase response and improve accuracy of the data.
Summary of recommendations: In addition to Recommendation 4-1 for a program of research to determine the effects of the periodic redesign of its surveys and changes in sample sizes on the accuracy of the data, especially the accuracy of measures of change, the panel recommends the following:
• An evaluation of data received from states that have central col-lection to ensure that high response rates are associated with high accuracy of the data.
• More complete documentation of unit and especially item nonre-sponse for the Governments Division censuses and surveys of state and local governments.
• The publication of unit response rates that are weighted by a mea-sure of size, such as total expenditures, in addition to unweighted rates.
• Research on barriers to response to the division’s Census of Gov-ernments and annual and quarterly surveys, such as differences in accounting systems among governments and from the definitions used by the division.
• A review of the procedures used by other agencies that have con-ducted nonresponse analysis to determine their applicability to the state and local government statistics programs.
• Experimental studies of nonresponse bias. • A review of the programs for editing and imputation of data to
determine their costs and benefits compared with other methods. • An evaluation of the effectiveness of a model-based approach or
other method of borrowing strength in yielding improved estimates for small domains from state and local government surveys.
• The provision of information that users need to correctly calculate the precision of estimates of change between specific pairs of years from the division’s surveys.
• A review of revision policies and regular reporting of typical re-vision levels when initial data are released from the division’s surveys.
• Assessment of the results of the cognitive redesign of the 2005 annual finance survey to determine the cost-benefit trade-off of conducting a similar labor-intensive pretesting process for other questionnaires.
• The utilization of the redesign of the quarterly tax survey as a test-bed for developing a probability sample of local governments based
EXECUTIVE SUMMARY �
on property tax values, for streamlining questionnaires, and for developing cost-effective variance estimation, editing, and imputa-tion procedures.
Further details on these findings and recommendations are provided in Chapter 4.
Data Dissemination and Analysis
Summary of recommendations: In addition to Recommendation 5-3 on adding value to the data that are released on the Governments Division website, the panel recommends that the division should continue to give high priority to the redesign and continuous improvement of its website and provides specific suggestions for desirable features to be added.
Working with Users and Standards-Setting Bodies
Conclusion 6-2: The Governments Division lacks vehicles for obtaining continued input from data users and methodological researchers with relevant experience and expertise. Such input is necessary to guide the development of statistical programs that are intended to provide data for public use. Summary of recommendations: In addition to Recommendation 6-1 for
a two-track strategic plan, the panel recommends that the Census Bureau empower the Governments Division to organize a panel of experts in public administration and finance under the auspices of a relevant professional association or consortium of organizations that would meet regularly to review the division’s program. In view of the increasing importance of the work of the Government Accounting Standards Board, the panel recom-mends that the Governments Division seek to obtain status as an orga-nizational member of the Governmental Accounting Standards Advisory Council.


1
Introduction
The United States of America owes its existence to an agreement en-tered into over 200 years ago by formerly separate states to form a federal system of shared sovereignty between the states and the new
national government. In the U.S. Constitution, the states retain sovereignty over many functions and areas of government, which they, in turn, can devolve to counties, cities, and other local government entities. In the early life of the new republic, officials of the national government recognized the need for information on the expenditures, revenues, employment, and other characteristics of the state and local governments. The 1840 census compiled information on public schools by state, and succeeding censuses asked for increasing amounts of information on state and local govern-ments. Since 1957, the Census of Governments has been compiled every 5 years in conjunction with the nation’s Economic Census.
This evolving program of compilations of information on governments is the responsibility of the U.S. Census Bureau’s Governments Division. The division conducts the Census of Governments and related annual and quarterly surveys and maintains and updates a comprehensive directory of state and local governments. The division provides data on major aspects of the finances of the federal government and state and local governments. Its principal role in the economy and for the public sector is the provision of data on the characteristics, finances, and employment of state and local governments. These data are the basis for much needed standardization in the definitions of the structure and activities of state and local governments. The definitions have great value and are extensively used for understanding
��
�� STATE AND LOCAL GOVERNMENT STATISTICS AT A CROSSROADS
state and local government in the American economy. The Governments Division also provides data on federal government finances, presented in important ways that relate to the state and local portion of the U.S. public sector. The division also conducts special surveys for other federal agen-cies on particular aspects of state and local government operations on a reimbursable basis.
As part of an internal strategic planning initiative and to respond to a performance assessment of the division by the U.S. Office of Management and Budget, the Census Bureau requested that the Committee on National Statistics establish a group of experts to review the division’s basic program of censuses and surveys. The Panel on Research and Development Priorities for the U.S. Census Bureau’s State and Local Government Statistics Program was established in 2005 and charged to make recommendations of priority areas for research and development to move the state and local govern-ment statistics program forward in the face of several challenges, including constrained budget resources.
Topics for the panel to consider include the goals, content, statistical methodology, data quality, and data products from the Census of Govern-ments, the annual surveys of government finances, employment, and public employee retirement systems, and the quarterly survey of government taxes. A key element of the panel’s information gathering was a workshop that convened statistical experts, data users, and Governments Division staff. This report presents the panel’s conclusions and recommendations.
IMPORTANCE OF THE STATE AND LOCAL GOvERNMENT SECTOR
State and local governments play a major role in the U.S. economy and in the lives of Americans from birth to death (U.S. Census Bureau, 2005). Spending by the nation’s 87,525 state and local governments (states, coun-ties, cities, townships, school districts, and special districts) collectively accounts for 12 percent of gross domestic product and is more than all of the federal government’s nonmilitary expenditures—$1.9 trillion com-pared with $1.5 trillion in fiscal year 2004. State and local governments employ 1 in 7 workers—more than 18 million jobs in all, and seven times as many civilian workers as the federal government employs. Since 2001, state and local governments have employed more workers than the entire manufacturing sector. If governments were ranked along with corporations in the Fortune �00, then every state and 12 local governments (3 counties, 7 cities, and 2 school districts) would be in the Fortune �00 on the basis of their revenues and expenditures, and California and New York would rank in the top 10.
INTRODUCTION ��
State and local governments touch the lives of Americans in many ways:
• State and local governments educate the nation’s children: 5.9 mil-lion public school teachers and other school staff educate 48 mil-lion children in 96,000 public elementary and secondary schools (U.S. National Center for Education Statistics, 2005).
• Through Medicaid and related programs, state governments (with federal assistance) provide health care coverage for about one-half of poor children and one-quarter of poor adults. Medicaid finances half of all nursing home expenditures and pays for more than one-third of all births (Holahan et al., 2003).
• State and local governments prepare the future workforce, educat-ing about three-quarters of the 17.3 million students in degree-granting institutions of higher education (U.S. National Center for Education Statistics, 2005).
• State and local governments protect the public’s safety, financing and operating the nation’s police forces and maintaining custody over 92 percent of the nation’s 2.2 million prison and jail inmates. (U.S. Bureau of Justice Statistics, 2007).
• Approximately 97 percent of the public road system is under the control of state and local governments.1 The state and local share of total public transit funding is about 75 percent (U.S. Department of Transportation, 2007).
• States and local governments administer the nation’s public welfare programs. With financial assistance from the federal government, states decide whether and how to provide training, child care, and other assistance that may help the needy find jobs and become self-sustaining, and they decide whether to provide cash assistance and other kinds of benefits.
• State and local governments are the front line of homeland secu-rity. In addition to hiring, training, and paying police, they protect water supplies, transit systems, and other networks; they provide emergency response; and they guard the nation’s public health against long-standing and emerging threats.
• Finally, in some locations, such services as hospital care, electric power and other utilities, and even alcoholic beverage sales are provided by government entities rather than private companies.
1 Calculated from U.S. Bureau of Transportation Statistics, Highway Profile, Inventory, for the Year 2000. Available: http://www.bts.gov/publications/national_transportation_statistics/ 2002/html/table_highway_profile.html.
�� STATE AND LOCAL GOVERNMENT STATISTICS AT A CROSSROADS
State and local governments are remarkably diverse. States differ widely in expenditure levels, revenue sources, and expenditure streams: the five highest spending states spend over 40 percent more per capita on state and local government services than the five lowest spending states; Oregon relies on its income tax for 70 percent of its state tax revenue, yet nine states have no broad-based income tax at all; state funding accounts for 90 percent of elementary and secondary education expenditures in Hawaii, but only 30 percent in Nevada.2 States also exhibit diverse patterns of local government organization: some states are organized primarily into county and city governments, while other states have large numbers of independent townships, municipalities, and school districts. Special districts cover a multitude of functions, such as water and sewer authorities, transportation authorities, and the like, and new forms of special districts keep evolving to meet public needs.
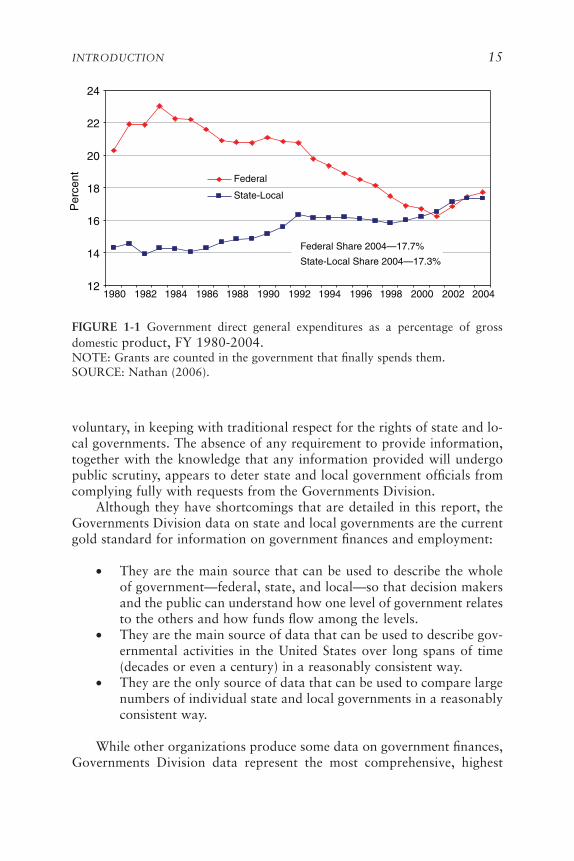
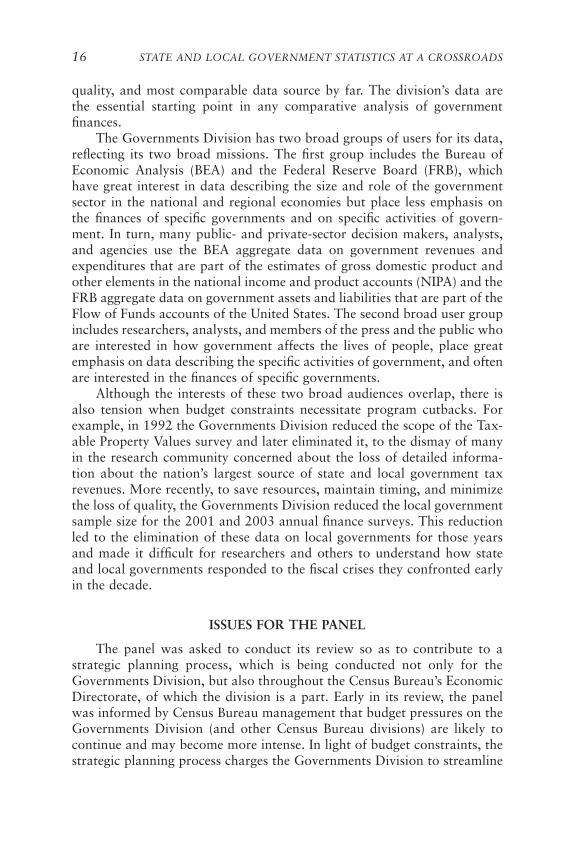
State and local government is a growth industry. The federal govern-ment has devolved significant authority to state and local governments in many areas, especially in programs that serve the poor, at the same time that it has scaled back its own direct spending in these areas. The state and local sector has grown dramatically for at least the last five decades, nearly doubling relative to the total U.S. economy between 1950 and 2000. Figure 1-1 shows that state and local government spending on goods and services (including spending of grants from the federal government) now is about the same as direct purchases of goods and services by the federal govern-ment (excluding spending to make grants to state and local governments).
ROLE OF THE GOvERNMENTS DIvISION
The Governments Division in the U.S. Census Bureau has a dual mis-sion of reporting on the size and scope of the state and local government sector at an aggregate level and reporting on the functions of individual governments. It faces unique challenges in accomplishing this dual mission. Unlike other data collected by the U.S. Census Bureau and other federal statistical agencies, any data obtained on governments through censuses or surveys are in the public domain and are not confidential. Moreover, while U.S. law mandates that individuals participate in the decennial census and that business enterprises participate in the Economic Census, state and local government participation in the Census of Governments is entirely
2 Per capita expenditure and income tax comparisons are based on analysis of Census Bureau government finance data for 2004. The per-capita spending comparison is for the fifth high-est state relative to the fifth lowest state. If, instead, the median of the five highest states is compared with the median of the five lowest states, then the top five actually spend 70 percent more per capita than the bottom five. The state share of education funding was obtained from U.S. National Center for Education Statistics (2005).
INTRODUCTION ��
voluntary, in keeping with traditional respect for the rights of state and lo-cal governments. The absence of any requirement to provide information, together with the knowledge that any information provided will undergo public scrutiny, appears to deter state and local government officials from complying fully with requests from the Governments Division.
Although they have shortcomings that are detailed in this report, the Governments Division data on state and local governments are the current gold standard for information on government finances and employment:
• They are the main source that can be used to describe the whole of government—federal, state, and local—so that decision makers and the public can understand how one level of government relates to the others and how funds flow among the levels.
• They are the main source of data that can be used to describe gov-ernmental activities in the United States over long spans of time (decades or even a century) in a reasonably consistent way.
• They are the only source of data that can be used to compare large numbers of individual state and local governments in a reasonably consistent way.
While other organizations produce some data on government finances, Governments Division data represent the most comprehensive, highest
12
14
16
18
20
22
24
1980 1982 1984 1986 1988 1990 1992 1994 1996 1998 2000 2002 2004
Federal
State-Local
Federal Share 2004—17.7%
State-Local Share 2004—17.3%
1-1
Per
cent
FIGURE 1-1 Government direct general expenditures as a percentage of gross domestic product, FY 1980-2004. NOTE: Grants are counted in the government that finally spends them.SOURCE: Nathan (2006).
�� STATE AND LOCAL GOVERNMENT STATISTICS AT A CROSSROADS
quality, and most comparable data source by far. The division’s data are the essential starting point in any comparative analysis of government finances.
The Governments Division has two broad groups of users for its data, reflecting its two broad missions. The first group includes the Bureau of Economic Analysis (BEA) and the Federal Reserve Board (FRB), which have great interest in data describing the size and role of the government sector in the national and regional economies but place less emphasis on the finances of specific governments and on specific activities of govern-ment. In turn, many public- and private-sector decision makers, analysts, and agencies use the BEA aggregate data on government revenues and expenditures that are part of the estimates of gross domestic product and other elements in the national income and product accounts (NIPA) and the FRB aggregate data on government assets and liabilities that are part of the Flow of Funds accounts of the United States. The second broad user group includes researchers, analysts, and members of the press and the public who are interested in how government affects the lives of people, place great emphasis on data describing the specific activities of government, and often are interested in the finances of specific governments.
Although the interests of these two broad audiences overlap, there is also tension when budget constraints necessitate program cutbacks. For example, in 1992 the Governments Division reduced the scope of the Tax-able Property Values survey and later eliminated it, to the dismay of many in the research community concerned about the loss of detailed informa-tion about the nation’s largest source of state and local government tax revenues. More recently, to save resources, maintain timing, and minimize the loss of quality, the Governments Division reduced the local government sample size for the 2001 and 2003 annual finance surveys. This reduction led to the elimination of these data on local governments for those years and made it difficult for researchers and others to understand how state and local governments responded to the fiscal crises they confronted early in the decade.
ISSUES FOR THE PANEL
The panel was asked to conduct its review so as to contribute to a strategic planning process, which is being conducted not only for the Governments Division, but also throughout the Census Bureau’s Economic Directorate, of which the division is a part. Early in its review, the panel was informed by Census Bureau management that budget pressures on the Governments Division (and other Census Bureau divisions) are likely to continue and may become more intense. In light of budget constraints, the strategic planning process charges the Governments Division to streamline
INTRODUCTION ��
programs and to facilitate more accurate and complete reporting by better aligning data collection with the accounting standards and practices of gov-ernmental units. The process also charges the division to rank its activities into four priority categories from most to least important: (1) benchmark measures, (2) principal economic indicators, (3) annual sectoral-level sta-tistics, and (4) the remaining programs and infrastructures.
This rank ordering gives most priority to the data items needed for the national income and product accounts and flow of funds estimates, which are key outputs from the federal statistical system that have major conse-quences for public- and private-sector decision making. The panel fully un-derstands the importance of high-quality data for aggregate estimates of the state and local government sector. However, we are concerned that down-grading the importance of collecting and analyzing detailed information on government activities at the level of individual governments undercuts the ability of decision makers and the public to understand the complex web of federal, state, and local government interconnections. Regular, in-depth assessment of these connections is essential for sound policy making in a range of key areas, including health care, transportation, education, public safety, and others. Such assessment is also needed for making sound decisions regarding how to finance the provision of public services. Finally, the availability of disaggregated information is important for evaluating, improving, and maintaining the accuracy of the aggregate information that provides vital inputs to the national income and product accounts and flow of funds estimates.
The panel urges the leaders of the Census Bureau to initiate both short-term and long-term studies, as specified in this report, of the priori-ties and balance of the Governments Division’s work. These studies should reflect the distinctive character and purposes of the division’s dual role of providing inputs to national economic indicators and detailed information on state and local government activities. While adequate budget resources may not be available in the near term for the division to serve both roles fully, research and development should address both roles and lay out a plan for implementing improvements to each over the long run. Some of the panel’s recommendations—such as on the need to establish a working group of experts to advise the Governments Division on ways to keep its data as relevant and accurate as possible and the need for proactive dis-semination of the division’s data—are essential to laying the groundwork for the executive branch and Congress to understand and support a strong government statistics program.
In keeping with the panel’s charge, the bulk of the panel’s recommen-dations suggest research and development activities designed to produce improvements in the basic government statistics program. In addition, some recommendations call for immediate program improvements that can pro-

�� STATE AND LOCAL GOVERNMENT STATISTICS AT A CROSSROADS
ceed without further research and development. The panel’s findings and recommendations are presented throughout the next five chapters.
OUTLINE OF THE REPORT
Following this introduction, Chapter 2 provides a brief history of the collection of state and local government data by the federal government, a description of the current base and reimbursable Governments Division program, issues relating to defining and classifying governments (a central role of the division), and a discussion of the effects of constrained budgets on the division’s core or base programs.
Chapter 3 discusses the issues addressed by data users from whom the panel obtained input, including the Bureau of Economic Analysis, the Fed-eral Reserve Board, public interest groups, and research institutions. Data users provided feedback on the current uses and potential uses of the data, as well as on their strengths and weaknesses.
Chapter 4 examines data accuracy and statistical methodology for the Census of Governments and the annual and quarterly surveys, includ-ing issues of sample frame development and design, data collection, unit nonresponse, editing and imputation, estimation, data processing, revision policies, and cognitive testing of questionnaires.
Chapter 5 discusses the dissemination and analysis practices of the Gov-ernments Division, which are the primary concerns of many data users.
Chapter 6 addresses strategic issues and challenges facing the Govern-ments Division and its managers in the Census Bureau as they look toward the future.
Background materials appear in the appendixes. Appendix A is a brief description of the products issued by the Governments Division. Appendix B is a table describing the current reimbursable programs conducted by the Governments Division. Appendix C reproduces two letters on the Tax-able Property Value Survey. Appendix D summarizes the presentations of public interest and other user groups at the panel’s workshop. Appendix E provides the planning meeting and workshop agendas. Appendix F presents biographical sketches of panel members and staff.
2
The Government Statistics Program in Context
Providing information on government activity—revenues, spending, functions, employment, and other aspects—is a critical task of a dem-ocratic government. Such information is essential for decision makers
in all branches of government, as well as for private-sector decision making, research and evaluation, and, ultimately, accountability to the public. For a federal system, such as the United States, it is important to have not only information on the national government, but also information that can be compared for the large number of state and local governments.
For over 160 years, the primary duty of enumeration of state and lo-cal government activity in the United States has been the responsibility of the federal government’s experts in conducting censuses and surveys. The U.S. government tapped the Census Bureau to identify and catalogue state and local governmental bodies and collect data on them to measure their activities.
Enumerating governments and measuring their activities involve a com-plex set of data collection, processing, and estimation tasks. The current Census Bureau programs, located in the Governments Division, cover three major subjects—government organization, public employment, and public finances. The information is collected in the quinquennial Census of Gov-ernments and several annual and quarterly surveys, each using separate collection forms and procedures, depending on the subject matter and level of government addressed.
These censuses and surveys form the base or core programs of the Governments Division portfolio. The designation of programs as base pro-
��
�0 STATE AND LOCAL GOVERNMENT STATISTICS AT A CROSSROADS
grams stems from two related ideas: (1) these undertakings have the longest history as Census Bureau programs and (2) in general, they have been the genesis of major reimbursable programs, whereby the Census Bureau re-ceives financial support from external sponsors to develop more detailed surveys pertaining to specific pieces of its base programs.
The Governments Division and the Census Bureau generally are of the view that core or base programs must be supported and continued, although not necessarily at their current frequency or level of detail. In fact, the inclusion of programs as base programs is subject to change over time as priorities and sources of funding change. Some useful pieces of the base portfolio have been eliminated following congressional budget cuts (see discussion below).
This chapter provides context in which to examine the current Gov-ernments Division portfolio. It first briefly lays out the history of federal data collection on state and local governments and then describes the base and reimbursable programs as they are currently implemented. It discusses issues in the classification of governments, which is a critical function of the Governments Division in light of the dynamic nature of American gov-ernmental entities, the activities they perform, and the flows of financing among them.
The chapter concludes by describing cutbacks in the Governments Division programs in response to constrained budgets and the risk that these cutbacks pose to the division’s dual missions. As noted in Chapter 1, these missions are (1) to provide aggregate information for the state and local governments component of the national accounts and other key financial series and (2) to provide individual government-level information to support analyses of the operations and finances of and the relationships among various levels and types of governments in the U.S. federal system. Both missions are critical to informed decisions in such areas as fiscal and monetary policy, retirement security, income support, transportation policy, among many others, as well as to informed debate about the proper role of each level and type of government and to public accountability.
HISTORICAL DATA COLLECTION
Census Data Beginning in 1840
The first collection by the federal government of information about state and local governments occurred in a limited fashion as part of the 1840 population census, which included questions on numbers and types of schools and numbers of pupils by state. (U.S. Census Bureau, 1982, 1992). A few queries on state and local government taxable wealth, prop-erty taxes collected, and indebtedness were included as part of the 1850
THE GOVERNMENT STASTISTICS PROGRAM IN CONTEXT ��
population census, and questions on these topics grew in number in suc-ceeding censuses through 1890. Collection of information on governments was separated from the population census in 1902 in the newly created permanent Census Office. The information sought on governments at that time included types and number of local governments in each state; federal, state, and local revenues and expenditures; assessed valuations; tax levies; and public debt. States were to report data that included all local units of government, although separate figures were presented only for counties. In addition, the Census Office published estimates of national wealth by state and class of property, reflecting the heavy dependence on property taxes to support state and local government expenditures.
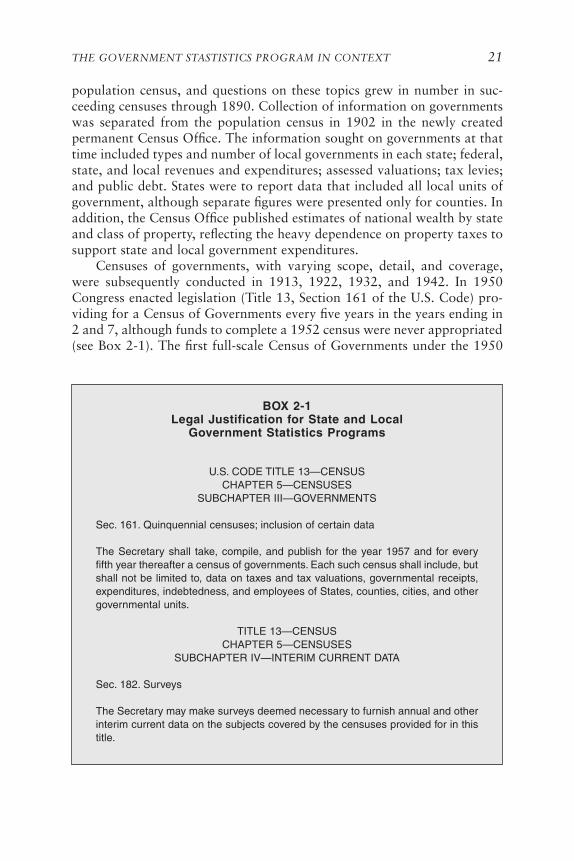
Censuses of governments, with varying scope, detail, and coverage, were subsequently conducted in 1913, 1922, 1932, and 1942. In 1950 Congress enacted legislation (Title 13, Section 161 of the U.S. Code) pro-viding for a Census of Governments every five years in the years ending in 2 and 7, although funds to complete a 1952 census were never appropriated (see Box 2-1). The first full-scale Census of Governments under the 1950
BOX 2-1 Legal Justification for State and Local
Government Statistics Programs
U.S. CODE TITLE 13—CENSUSCHAPTER 5—CENSUSES
SUBCHAPTER III—GOVERNMENTS
Sec. 161. Quinquennial censuses; inclusion of certain data
The Secretary shall take, compile, and publish for the year 1957 and for every fifth year thereafter a census of governments. Each such census shall include, but shall not be limited to, data on taxes and tax valuations, governmental receipts, expenditures, indebtedness, and employees of States, counties, cities, and other governmental units.
TITLE 13—CENSUSCHAPTER 5—CENSUSES
SUBCHAPTER IV—INTERIM CURRENT DATA
Sec. 182. Surveys
The Secretary may make surveys deemed necessary to furnish annual and other interim current data on the subjects covered by the censuses provided for in this title.
�� STATE AND LOCAL GOVERNMENT STATISTICS AT A CROSSROADS
legislation was conducted in 1957, and a census has been conducted every five years since that time in conjunction with the Economic Census, which covers private-sector businesses.
Intercensal Data Beginning in 1898
As early as 1898, the need for up-to-date information on state and lo-cal government finances led to the collection of data in noncensus years. Annual statistics on state government finances date back to 1915 in an unbroken time series to the present, except for a few years (1920, 1921, 1933–1936) when budget constraints precluded data collection. Annual statistics on city government finances date back even earlier—to 1902—and were skipped only in 1914 and 1920, although coverage has been selective and varied. Until 1931, statistics were provided only for cities with at least 30,000 people, rising to 100,000 people from 1932 to 1941, and dropping back to 25,000 people from 1942 through 1955. Since 1956, nationwide statistics include all municipalities (sample-based estimates are used for smaller units), but figures are published separately only for cities that meet a minimum population size (50,000 people since 1960). Data on county finances were provided from the results of mail sample-based surveys from 1943 through 1946; beginning in 1972, annual data have been published on counties with at least 100,000 people.
Other annual series on state and local government finances are part of the Governments Division portfolio, including a survey of state and local public employee retirement systems and extensive reporting, since 1978, of public school system finances in a program funded by the U.S. Department of Education. Beginning in 1962, state and local tax revenues have been reported on a quarterly basis, as have the finances of about 100 major public employee retirement systems since 1968.
Annual data on state and local government payroll and employment date back to 1940 for employment other than school-based employment and back to 1946 for employment including educational institutions, except that no data were collected for 1996. Since 1951, data have been collected separately on full-time and part-time employees, and, since 1952, employ-ment has been classified by function for all levels of government.
Over the decades, the Governments Division has conducted special surveys and analyses in addition to those briefly sketched above. Topics covered have included labor-management relations, environmental quality control finances, and property tax assessment, among others. The spe-cial surveys have generally been funded by other agencies of the federal government.
THE GOVERNMENT STASTISTICS PROGRAM IN CONTEXT ��
GOvERNMENTS DIvISION PORTFOLIO TODAY
Basic Programs1
The Census of Governments is the flagship operation of the Govern-ments Division of the Census Bureau. It is the major source of informa-tion about state and local governments in the United States. The Census of Governments is conducted in three distinct but interrelated phases—a precensus directory survey to produce an updated list of local governments and other selected data necessary to identify the kind of governmental body and to produce the Governments Integrated Directory (GID); a census of finances of all state and local governments to extend the annual finance survey of 13,000 governmental units to the universe of more than 87,000 governments; and a census of public employment that extends the annual survey of public employment, which surveys about 10,000 state and local governments, to the universe of 87,000 governments.
The two annual surveys of governments are the Annual Finance Survey (AFS) and the Annual Employment Survey (AES). Each of these surveys has multiple components. The AFS collects data on state and local govern-ment finances, public elementary and secondary education expenditures, and public employee retirement systems. The AES collects data for federal civilian agencies and state and local governments for March of each year on full-time and part-time employment, part-time employee hours worked, full-time-equivalent employment, and payroll statistics by type of govern-ment and governmental function, such as elementary and secondary edu-cation, police protection, financial administration, and public welfare. The annual Survey of Governmental Organizations is one of the base programs. It establishes the government universe and is indispensable for conducting the base employment and finance surveys.
On a quarterly basis, the Governments Division updates some of its annual collections. The Quarterly Survey of State and Local Government Taxes provides current information on tax revenues of state and local gov-ernments, which are an important indicator of fluctuations in their financial condition. The Quarterly Survey of Public Employee Retirement System Finances provides detailed information on the composition of financial as-sets of the 100 largest systems, which amount to one of the most significant groups of institutional investors in the economy.
Programs are part of the base because of the value of the statistics they produce to the user community. Major aggregate statistics (e.g., total revenue, total expenditure, total employment, total payroll) define the base by virtue of their importance in supplying adequate information for key
1 The programs in this section are described in greater detail in Appendix A.
�� STATE AND LOCAL GOVERNMENT STATISTICS AT A CROSSROADS
economic measures, such as those produced by the Bureau of Economic Analysis (BEA). This definition extends to subtotals as well (e.g., total tax revenue, total expenditures for current operations) which are needed by BEA in producing the national accounts.
It is important to understand that the national accounts serve as the in-tegrator of economic statistics in the federal statistical system. The national accounts influence the content not only of statistical programs conducted by such agencies as the Census Bureau, the Bureau of Labor Statistics, the National Agricultural Statistics Service, and others, but also of administra-tive records programs, such as the Internal Revenue Service Statistics of Income reports. The role of national accounts in shaping economic statistics programs is recognized internationally and laid out in the Handbook of Statistical Organization, Third Edition (United Nations Statistical Divi-sion, 2003).
Reimbursable Programs
In addition to the programs funded in the annual and periodic budgets of the Census Bureau, the Governments Division obtains funding from other government agencies through so-called reimbursable programs. The reimbursable programs are projects for which the Governments Division acts as a contractor to conduct survey work. The sponsors, usually other federal government agencies, seek Census Bureau assistance to capitalize on the agency’s expertise in government organization and experience in dealing with and measuring the universe of public agencies.
There are three major sponsors of reimbursable surveys—the National Center for Education Statistics, the Bureau of Justice Statistics, and the Of-fice of Management and Budget; Appendix B lists all current reimbursable programs. The reimbursable work changes from year to year and evolves as sponsor needs change. While several of the reimbursable survey programs have lasted more than two decades, others have come and gone as inter-est in the topics and the availability of resources have waxed and waned. Reimbursable programs that the Governments Division no longer conducts include collection of environmental expenditures for the U.S. Environmen-tal Protection Agency, election administration costs for the U.S. General Accounting Office (now the U.S. Government Accountability Office), and taxation and other data for the U.S. Department of the Treasury. The data for the Treasury Department were collected to support federal fund al-locations to state and local governments under the State and Local Fiscal Assistance Act of 1972. This legislation was the basis for general revenue sharing, a program that transferred more than $7 billion annually to states and localities before being terminated in 1986.
The base programs may serve as a springboard for new reimbursable

THE GOVERNMENT STASTISTICS PROGRAM IN CONTEXT ��
programs. A good example is a recently begun survey of state government research and development (R&D) expenditures sponsored by the National Science Foundation (NSF) Division of Science Resources Statistics. A key reason why NSF wanted the Governments Division to do the survey was its knowledge of state government structure and its ability to collect ex-penditure information that is similar to that collected by another division of the Census Bureau on private-sector R&D expenditures for the NSF-sponsored Survey of Industrial Research and Development (National Re-search Council, 2005).
The Governments Division reports many benefits—tangible and in-tangible—accruing as a result of the reimbursable programs.2 First and foremost, they provide about half of the Governments Division’s current funding. The reimbursable activities bear some program overhead costs, allowing the base programs to extend their own resources and provide services that they would otherwise not be able to do.
The reimbursable programs also support the base programs in the fol-lowing ways:
• Testing. The reimbursable programs serve as a test bed for the base program operations. The reimbursable programs are smaller and easier to change. The base programs take advantage of work done in different reimbursable programs. A recent example is the introduction of automated editing techniques that were first used in reimbursable programs and later adopted by the base programs.
• Data currency. The reimbursable programs shine light on aspects of state and local government economic activity that the Govern-ments Division may consider adopting in the base programs. If users show interest through reimbursable surveys, the division may decide to incorporate certain aspects of a reimbursable program into the base program to maintain the currency and relevance of the base program data.
• Data accuracy. The reimbursable programs serve as an indepen-dent check on the accuracy of the base program information.
• Strengthening analyst capabilities. The reimbursable programs afford opportunities for staff analysts to work on different surveys and thereby enhance their skills and knowledge.
• Learning through partnerships with other agencies. The Govern-ments Division has learned a considerable amount about different data collection, processing, and analysis techniques that may be useful for its base programs. The division has become aware of
2 Communication with Henry Wulf, U.S. Census Bureau, Governments Division, October 18, 2006.
�� STATE AND LOCAL GOVERNMENT STATISTICS AT A CROSSROADS
ways to make its base programs more useful because of relation-ships it has developed with other federal statistical and program agencies through reimbursable work.
Governments Division as Honest Broker
The Governments Division faces difficult issues concerning the clas-sification of what is and what is not a government, as discussed in the next section. It also—as discussed in Chapters 3 and 4—faces difficult issues of accounting for revenues, expenditures, and employment of each recognized governmental unit. In the process of identifying governmental organizations and collecting information about them, the division does more than simply collect and release the data. It serves as the official enumerator of these governments and their impact on the American people, and it plays the role of honest broker by providing consistency of definitions and accounting treatment across governments according to a set of published rules.
As an honest broker, the Governments Division sets the boundary between government and private entities; aggregates the various funds (general fund, bond funds, enterprise funds, federal funds, etc.) into consoli-dated accounts for each government; ensures consistent treatment of sub-ordinate units and special districts and classifies like transactions together, even if they have different names in different governments; provides con-sistent annual time series across governments by combining data reported for fiscal years ending in different months; and serves as the authoritative source of information on the geography of state and local entities. These tasks are both valuable and complex, given the proclivity of general- and special-purpose local governments to change their geographic profiles and organizational structures as they consolidate, separate, annex, and other-wise evolve into different bodies over time.
CLASSIFICATION OF GOvERNMENTS
The task of classifying governments, largely a responsibility of the Governments Division, is a bedrock function of the division. The classifica-tion function is necessary to define governmental units, and thus to build the lists of governmental units that would be in scope for the census and surveys. This task is an ongoing operation and is fraught with challenges for the staff of the Governments Division who decide on the classifications. As discussed below, the task has become more difficult over time as new, alternative forms of government have emerged and grown and others have faded.
THE GOVERNMENT STASTISTICS PROGRAM IN CONTEXT ��
Historical Trends
Government organization in the United States has been described as inherently messy, an apt descriptor over the course of the nation’s history. Beginning as a federal system with 13 states in 1790 under the newly rati-fied Constitution, the national government annexed lands, organized ter-ritories, and admitted states in a dynamic process that added 35 more states between 1791 and 1912 and then 2 more states—Alaska and Hawaii—in 1959. Each state, in turn, has sovereign authority to establish local gov-ernments within its boundaries and to delimit their functions. The states in different parts of the country have organized themselves, their subunits of government, and their division of responsibilities in a wide variety of ways for historical, geographic, political, and economic reasons. In New England, cities and towns are the dominant governing bodies; in southern states, counties provide most key functions; in other states, counties, cities, and towns all have important functions, some of which (such as providing police protection) overlap.
Moreover, the governmental arrangements established by the states and the relationships among the federal government, the states, and local governments have continued to evolve. In the nearly five decades since the last state was admitted to the Union and the first modern Census of Gov-ernments was conducted, striking changes have occurred in the numbers, functions, and relationships of governments.
Consider just the numbers of functioning governmental units by type (U.S. Census Bureau, 2005):
• Total. The total number of units decreased from 116,807 in 1952 to 87,576 in 2002, in which year Illinois had the largest number of units (6,903) and Hawaii the smallest (19). The overall decline masks different trends by type of government.
• Counties. The number of counties remained relatively stable: there were 3,052 counties in 1952 and 3,034 counties in 2002, in which year Texas had 254 counties, Delaware had 3, and Connecticut and Rhode Island had none.
• Towns and townships. The number of towns and townships (ad-ministrative subdivisions of counties) also remained about the same: there were 17,202 townships and towns in 1952 compared with 16,504 in 2002. The distribution by state varied markedly: only 20 states had this type of functioning government in 2002, with the largest number in Minnesota (1,793) and the smallest number in Rhode Island (31).
• Municipalities. The number of municipalities (political units in-corporated for local self-government) increased by about 20 per-
�� STATE AND LOCAL GOVERNMENT STATISTICS AT A CROSSROADS
cent—from 16,807 in 1952 to 19,429 in 2002. Illinois had the largest number of municipalities in 2002 (1,291) and Rhode Island had the smallest number (8).
• School districts. The number of independent school districts de-creased dramatically from 67,355 in 1952 to 13,506 in 2002. Most of the decline occurred between 1952 and 1972 as districts were combined to achieve efficiencies and economies of scale to cope with the baby boom generation of elementary and second-ary school students. In 2002, Texas and California each had over 1,000 school districts. In Hawaii, Maryland, North Carolina, and Virginia, the counties and independent cities and even some towns operate school districts.
• Special districts. In contrast to school districts, special districts, such as water boards, transit authorities, housing authorities, and development commissions, grew steadily from 12,340 in 1952 to 35,052 in 2002. Increasingly, general-purpose governments have spun off responsibility for provision of public services to single-function or multiple-function districts, authorities, commissions, boards, and other entities. Governments have also increasingly sought to privatize functions and to develop collaborative schemes for discharging functional responsibilities with other public and nonpublic organizations.3 Special districts have also arisen as a result of essentially new activities, such as those associated with transportation and economic or community development.
In sum, state and local governmental units in the United States are not as simple and stable as they may appear. Even at the familiar and rec-ognizable level of states, counties, municipalities, and townships, units of government are diverse, fragmented, layered, and changing. From area to area, they perform different functions in different ways. The Governments Division of the Census Bureau must create statistical coherence and order out of this messy situation.
Defining Governmental Units
The Governments Division, in its role as the official arbiter of the definition of governments and the source of identification of governmental entities for statistical purposes, has developed and publishes a set of defi-nitions and standards for sorting out, classifying, and counting entities as governments. In addition, the international guidelines underlying the gov-
3 The growth in privatization and collaboration has been termed “new governance” by Lester M. Salamon (Salamon, 2005).
THE GOVERNMENT STASTISTICS PROGRAM IN CONTEXT ��
ernment finance statistics of the International Monetary Fund (IMF) and the national income and product accounts (NIPAs) of the BEA also provide definitions of governments that the Census Bureau must consider.
The Governments Division defines governmental entities by using a set of detailed guidelines. One basic definition of a governmental unit is recognized for Census Bureau reporting:
A government is an organized entity which, in addition to having govern-mental character, has sufficient discretion in the management of its own affairs to distinguish it as separate from the administrative structure of any other government. (U.S. Census Bureau, 1992, p. 3–2)
In other words, to be recognized as a government for Census Bureau pur-poses, an entity must possess all three of these critical attributes: existence as an organized entity, governmental character, and substantial autonomy (U.S. Census Bureau, 1992, p. 3-3). The power to tax automatically classi-fies an entity as a government, although entities that do not have this power may still be classified as a government.
The task of defining a government has ramifications beyond the mainly statistical purposes for which the definition was promulgated. For example, the U.S. Department of Labor defines “public agencies” for regulatory purposes under the Family and Medical Leave Act as units of government defined by the Census of Governments.
The way in which the Census Bureau defines governmental organiza-tions “puts everything in its place and provides a place for everything” (Wulf, 2005, p. 2). When it comes to general-purpose forms of govern-ment—counties, municipalities, towns, and townships—the task is fairly straightforward. They are relatively easy to identify and count because they are fairly stable; only 72 more local governments of these types were reported in 2002 than had been identified in 1997. These relatively stable forms of government account for a large share of local government expendi-tures—57 percent of direct expenditures by local governments in 2002—but they are a much smaller share of the number of governments, accounting for only about 39,000 of the 87,500 units of government as defined and measured by the Governments Division.
The majority of governments are those that historically have changed the most and are continuing to change in numbers and scope; they are a hodgepodge of special-purpose governments, including school districts—13,506 in 2002 and continuing to decline in number—together with a wide variety of other kinds of special districts—35,052 in 2002 and continuing to grow in number.
It is at the boundaries of the definition of special-purpose local govern-ments that the issue of distinguishing public- and private-sector activities
�0 STATE AND LOCAL GOVERNMENT STATISTICS AT A CROSSROADS
increasingly strains traditional definitions. Three examples of governmental look-alikes—charter schools, residential community associations, and busi-ness improvement districts (BIDS)—help make the point about the complex-ity of the government classification problem and the need for the continued efforts of the Governments Division to address classification issues in order to ensure that government-like organizations are included when warranted in the tallies of governmental units. The strict interpretation of classification standards often leaves these special governing bodies uncounted.
Charter Schools
Charter schools are a fast-growing part of the American educational landscape. In the 16 years since 1991, when Minnesota became the first state to pass a charter school law, the charter school movement has ex-panded rapidly. Today, over 1 million students are enrolled in more than 3,600 charter schools in 40 states plus the District of Columbia and Puerto Rico (Center for Education Reform, 2006). Charter schools exhibit a rich variety of organizational forms, which vary from state to state, not only because the individual charters set out unique mission and goal statements, but also because state charter laws, which significantly influence the devel-opment of charter schools, vary (U.S. Charter Schools, 2007).
These new and growing types of educational establishments pose chal-lenges when the Census Bureau attempts to classify them as public or private, and to ensure that they are counted by the Governments Division or , if not, as private businesses. The standard Census Bureau rules are not always definitive in making the classifications. The criteria are “problematic in the case of charter schools” (Wulf, 2005). As organized entities, charter schools are most often creatures of other governmental units rather than independent purveyors of governmental functions. Their autonomy in terms of fiscal and administrative independence varies widely. A recent study in California classified 318 charters by their degree of autonomy, finding that some were “low-autonomy” charters in that they received “several important services” from their district or county office of education, had collective bargaining arrangements that were the same or almost the same as that of their district, and were “locally funded” (receiving funds through the local school district); others were “high-autonomy” schools, receiving from their parent school districts “oversight only, no direct services or sup-port”; and the majority were in a “mid-autonomy” category, in that they had indicators of both low and high autonomy, such as having a collective bargaining agreement that was somewhat different from one their district had with its teachers (U.S. Charter Schools, 2007). The classification of these schools on the basis of autonomy is a subjective exercise, varying by state and circumstance.

THE GOVERNMENT STASTISTICS PROGRAM IN CONTEXT ��
A federal district court case in Ohio involving a suit against a charter school indicates not only the limits of an “independence” test for auton-omy, but also the kinds of nuance that must be considered in the context of the local situation for an appropriate classification of these new and growing forms of educational entities. The court applied four legal tests to determine when private conduct may be considered “state action”: (1) the public function test, (2) the state compulsion test, (3) the symbiotic relation-ship/nexus test, and (4) the “entwinement” test.4 The court concluded that “free, public education, whether provided by public or private actors, is an historical, exclusive, and traditional state function” and that the education was funded by taxpayers, as is currently the practice under Ohio’s com-munity school law. It interpreted the “entwinement” test as when private conduct is “so entwined with governmental policies or so impregnated with a governmental character as to become subject to the constitutional limi-tations on state actors.” The judge concluded that the charter school had been granted the authority to provide free public education to all students in a nondiscriminatory manner. Since only local school districts and charter schools had been granted this authority in Ohio, the charter school was so “entwined with governmental policies” that the court was forced to con-sider it and other such schools as “public actors subject to the constitutional limitations on state actors.”
Residential Community Associations
Residential community associations, which are nonprofit organizations that provide municipal-like services for groups of private residences, are ubiquitous. These civic associations, homeowner associations, citizens as-sociations, cooperatives, and planned communities provide services closely associated with services traditionally provided by the public sector, such as sanitation, streets, parks, maintenance, and security (Wulf, 2005, p. 3). The Community Associations Institute estimated that, in 2006, some 286,000 associations represented 23.1 million homes with over 57 million people belonging to them (Community Associations Institute, 2007). Clearly, it is important to classify these entities appropriately.
The residential community associations illustrate the subjectivity of government classification. They are organized entities; they have a govern-mental character because they were created by governments and have pub-
4 A charter school, the Riverside Community School in Cincinnati, fired one of its teachers in 2001. The teacher sued for violation of her civil rights, and the school attempted to dismiss the suit by arguing that it was a private school and not a unit of government. The U.S. Dis-trict Court judge ruled that an Ohio “community school” is a “state actor,” and therefore is bound by the same rules that apply to the government (U.S. District Court for the Southern District of Ohio, 2002).
�� STATE AND LOCAL GOVERNMENT STATISTICS AT A CROSSROADS
lic responsibility; and they enjoy some autonomy. Nonetheless, the Census Bureau holds that residential community associations are not governments, since they cannot be legislated out of existence and they are protected by the right of citizens to freely associate (Wulf, 2005, p. 4). This example indicates the challenges posed by new and growing entities with govern-ment-like powers and the need to continually update the decision rules for identification of governmental organizations.
Business Improvement Districts
Since the early 1970s, downtowns and other commercial areas across the United States have been using business improvement districts as a mechanism for revitalization. The districts experienced a substantial expan-sion in the 1990s. Business Improvement Districts are a type of governance tool, in that they allow for an assessment on property within a defined area. Revenues from this assessment are then directed back to the area to finance a wide range of services, including such things as security, maintenance, marketing, economic development, parking, and special events. They are usually created by specific enabling legislation, but sometimes they are formed by voluntary coalitions of businesses in an area. They have elected governance of one form or another. They represent significant levels of public expenditures and sometimes create public debt. These public-private hybrids fundamentally contain the same combination of public and private elements as other structures of local governance and are ultimately subject to public control (Briffault, 1999).
Little is systematically known about these bodies, as a whole. They generally do not qualify as special districts because, like the residential community associations, they do not meet the current standard defining a government. Whatever their classification and categorization, they are an important feature of governance that needs to be understood, and under-standing starts with information.
EFFECTS OF PROGRAM CUTBACKS
The need for Governments Division data increased under the provisions of the State and Local Fiscal Assistance Act of 1972 (General Revenue Shar-ing). This program required the Governments Division data on state and local taxes to determine allocations of federal funds to 39,000 eligible local governments. Following the program’s demise in 1988, constrained budgets led to significant cutbacks in the base programs of the division.
THE GOVERNMENT STASTISTICS PROGRAM IN CONTEXT ��
Programmatic Cutbacks, 1988–1997
During the first decade after the demise of General Revenue Sharing, cutbacks accrued in the Census of Governments, special surveys, and ana-lytical reports:
• Taxable property values. This survey provided important informa-tion relating to the property tax, which was the largest state and local government property tax at the time that data collection was discontinued. The data from the survey were the only nationwide, state-by-state, and county-by-county information on the ratios of property assessments to sales prices, and it did so every five years from 1957 to 1992. The Census Bureau discontinued the Taxable Property Values survey while conducting the 1992 Census of Gov-ernments because of budget constraints and the survey’s declining response rates.
• Labor-management relations. This survey provided data on state and local employees who belong to employee organizations, labor relations policies, contractual agreements between governments and employee bargaining units, employees covered by contractual agreements, and employee bargaining units. Although the survey extended citizens’ understanding of the public sector, it did not fill a clear federal need and so it was not considered by the Census Bureau to be crucial to its mission.
• Popularly elected officials. This survey produced data on the num-ber and demographic characteristics of elected officials in the na-tion. The report produced from the survey was popular, but the Governments Division considered the survey to be peripheral to the task of providing economic data. This survey and the report from it were discontinued after 1992.
• State payments to local governments. The practice of discontinuing research reports actually began in 1982 when this report, which described in detail the flow of intergovernmental funds between states and their local governments, was dropped. The surveys still collect the information, but as is the case now with most Govern-ments Division data, no detailed analyses are produced and no user-friendly data are provided except for highly aggregated totals. Users who wish to see details or understand changes over time must access detailed data files and conduct their own analyses, an approach used for other Bureau programs.
• Analytic reports. After 1992, the Governments Division stopped producing most of its descriptive and analytic reports, such as the separate report series entitled Government Finances, City Finances,
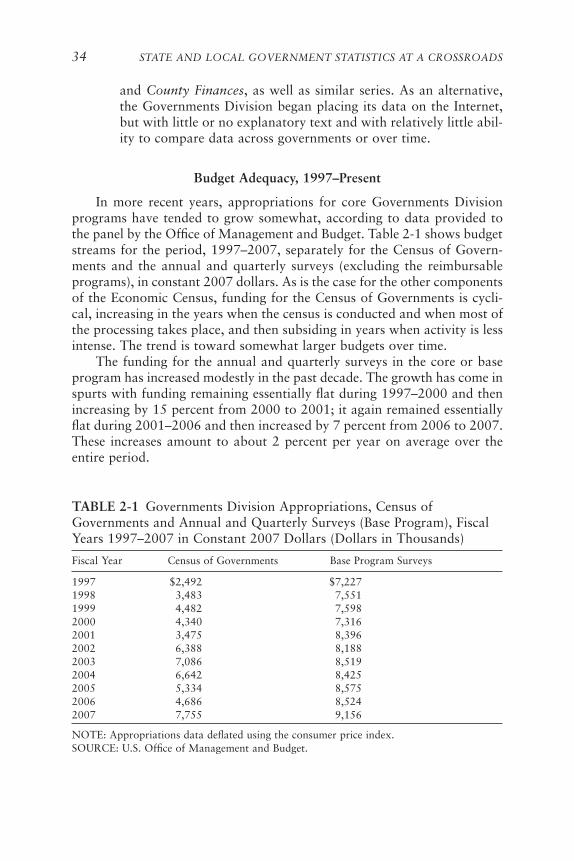
�� STATE AND LOCAL GOVERNMENT STATISTICS AT A CROSSROADS
and County Finances, as well as similar series. As an alternative, the Governments Division began placing its data on the Internet, but with little or no explanatory text and with relatively little abil-ity to compare data across governments or over time.
Budget Adequacy, 1997–Present
In more recent years, appropriations for core Governments Division programs have tended to grow somewhat, according to data provided to the panel by the Office of Management and Budget. Table 2-1 shows budget streams for the period, 1997–2007, separately for the Census of Govern-ments and the annual and quarterly surveys (excluding the reimbursable programs), in constant 2007 dollars. As is the case for the other components of the Economic Census, funding for the Census of Governments is cycli-cal, increasing in the years when the census is conducted and when most of the processing takes place, and then subsiding in years when activity is less intense. The trend is toward somewhat larger budgets over time.
The funding for the annual and quarterly surveys in the core or base program has increased modestly in the past decade. The growth has come in spurts with funding remaining essentially flat during 1997–2000 and then increasing by 15 percent from 2000 to 2001; it again remained essentially flat during 2001–2006 and then increased by 7 percent from 2006 to 2007. These increases amount to about 2 percent per year on average over the entire period.
TABLE 2-1 Governments Division Appropriations, Census of Governments and Annual and Quarterly Surveys (Base Program), Fiscal Years 1997–2007 in Constant 2007 Dollars (Dollars in Thousands)
Fiscal Year Census of Governments Base Program Surveys
1997 $2,492 $7,2271998 3,483 7,5511999 4,482 7,5982000 4,340 7,3162001 3,475 8,3962002 6,388 8,1882003 7,086 8,5192004 6,642 8,4252005 5,334 8,5752006 4,686 8,5242007 7,755 9,156
NOTE: Appropriations data deflated using the consumer price index. SOURCE: U.S. Office of Management and Budget.
THE GOVERNMENT STASTISTICS PROGRAM IN CONTEXT ��
Despite these trend increases in allocations, the Census Bureau has continued to make programmatic cuts (see below). The panel takes these cuts as a strong indication that resources are inadequate in light of the complexity of the data collection, processing, and analytical tasks of the Governments Division and the increasing difficulties of obtaining responses from governmental units, as discussed in Chapter 4.
The panel is aware that other statistical agencies, including other divi-sions in the Census Bureau, have experienced flat or only modestly increas-ing budgets in recent years. The panel’s charge, however, is to assess the adequacy of the budget for the Governments Division when viewed against the needs for the division’s data.
The Governments Division has made the following cutbacks in its programs since 1997:
• Temporary reduction in sample size for the 2001 and 2003 an-nual finance surveys. In the period leading up to the 2001 Annual Finance Survey, the Governments Division investigated ways to restructure the processing and editing of the survey to improve its timing and quality, as it was not meeting adequate standards for either measure. Internal budget constraints required the Govern-ments Division to finance these improvements by cutting the sur-vey program in other ways; it did not have the ability to request additional funds. After consulting with BEA, the Federal Reserve Board, the Census Advisory Committee of Professional Associa-tions, and the Council of Professional Associations on Federal Statistics, the Governments Division developed a reduced sample of local governments for survey fiscal years 2001 and 2003, which would produce only national totals instead of the usually larger sample that yielded local government totals by state. As a result, the Governments Division did not produce state-by-state totals for local government finances in 2001 or 2003, although they were available for the surrounding years of 2000, 2002, and 2004 and also for later years. Many outside users, particularly in the research community, consider the lack of state-level data on local govern-ments in 2001 and 2003 to be a major loss (see Chapter 3).5
• Reduction in data on special districts. After 2002, the Govern-ments Division no longer collects data on service areas of special districts.
• Reduction in debt data detail. In the redesign of the 2005 Annual
5 This discussion draws heavily on Governments Division Responses to CNSTAT Panel Questions for June ��-��, �00� Meeting, as contained in “06-05_Responses to CNSTAT panel questions for June 2006 meeting_Indiv pgs_V35.doc,” Answer A.6.
�� STATE AND LOCAL GOVERNMENT STATISTICS AT A CROSSROADS
Finance Survey, the Governments Division eliminated many debt classification categories to the local government component of the survey, and scaled back details in other areas. Prior to 2005, many categories had been restricted to federal and state governments only or to large local governments. As such, estimates of U.S. totals of government finances for these classification categories did not represent true aggregates of the financial transactions of all levels of government. As part of the redesign, the Governments Division enhanced internal consistency in debt categories and simplified the classification categories across levels and types of governments, but in doing so it reduced the number of categories used to classify state and local government regular debt statistics from 66 to 8, with many of the former categories combined into broader group-ings. Perhaps the most significant element of this change is that the redesigned debt data now track only two broad purposes of debt: private purposes and unspecified public purposes. By contrast, earlier surveys provided separate information on debt incurred for elementary and secondary education, higher and other education, water supply systems, electric power systems, natural gas supply systems, and public mass transit systems (U.S. Census Bureau, 2006b).
• Cutbacks in published detail. A database showing which county areas were believed to be served by each special district was posted to the Governments Division web site for years prior to 2002, but not for 2002. Although this information is included in the 2002 Census Bureau volume on government organization, users have to look up the specific entity in order to find it.6 The database for 2002, however, remains available from the Governments Division upon request.
• Privatization and other forms of contracting out government ser-vices. The 1987 and 1992 Censuses collected and published data on whether or not local governments provided certain services and, if so, whether they were partially or totally contracted out (although it is not possible to tell whether the services were contracted out to a private provider or to another government.) These data were collected but no longer published beginning with the 1997 Census of Governments and dropped with the 2007 census.
• Delaying statistical improvements. Due the lack of resources, the
6 The Census Bureau does conduct an annual Boundary and Annexation Survey that captures important shifts in physical space, but it applies only to general-purpose governments and cannot be used to address this user issue (see http://www.census.gov/geo/www/bas/bashome.html).
THE GOVERNMENT STASTISTICS PROGRAM IN CONTEXT ��
Governments Division has delayed making statistical improvements in the surveys and census. The impact of these delays is discussed in Chapter 4.
The decisions about which surveys and reports to scale back or elimi-nate reflected the best judgment of the Governments Division and the Eco-nomic Directorate regarding where cuts could be made without adversely affecting the division’s main missions. In particular, it seems clear that the division chose to favor the first of its two main missions: providing aggre-gate information for the national accounts and other key financial series required by BEA and the Federal Reserve Board to satisfy the information needs of the federal government for fiscal and monetary policy. The Eco-nomic Directorate has asserted the primacy of serving these needs, and the panel does not dispute their importance. We argue throughout this report, however, that the Governments Division’s second mission is also important in determining program content. Policy makers, researchers, and the public need detailed information about individual governments, the relationships among them, and the detailed functions and activities of government. Moreover, such detailed information is an important element in evaluating and validating the quality of the key financial aggregates. We take up these issues in more detail in Chapter 3 and Chapter 6.
3
Data Users and Uses
There is a wide variety of uses and users of the Governments Division’s state and local government statistics. Not only do consumers use the data that emanate from the quinquennial Census of Governments
and the related annual and quarterly surveys, but they also use the data that are developed under reimbursable arrangements with other federal agencies. In keeping with the panel’s charge, in this chapter we consider the uses of data from the division’s base programs, which comprise the ongoing Census of Governments and related surveys. The chapter focuses on three major groups of users—federal government agencies, public inter-est groups, and academic users—each of which was represented in the data users meeting and the workshop held by the panel. It also discusses issues for data users that came to light from panel members’ own experience. The chapter concludes with the panel’s conclusions and recommendations for responding to user needs.
One important application of the Governments Division data is not discussed here, except in the context of uses by state and local govern-ment public interest groups. Individual state and local governments must determine how they measure up to other governmental bodies in terms of tax burden, expenditures by function, employees, payrolls, and revenues. In general, the Governments Division data are the only national source of data on local government organization, finances, and employment, as well as the most comprehensive and comparable source of data on state govern-ment organization, finances, and employment.
��
DATA USERS AND USES ��
FEDERAL GOvERNMENT USERS
The Governments Division data on state and local government finances and employment, along with the other Economic Census and current eco-nomic survey data collected by the Census Bureau, serve as primary sources for computations of critically important economic time series. The Bureau of Economic Analysis (BEA) uses the government statistics data as input to the gross domestic product (GDP) and other components of the national income and product accounts (NIPAs), as well as to the regional economic accounts. The Federal Reserve Board (FRB) uses the data as input to its quarterly and annual flow of funds accounts, which show not only the stock but also changes in the assets and liabilities of households, businesses, farms, major financial sectors, foreign borrowers and investors, the federal government, and state and local governments, as well as information on the instruments used by these sectors in their borrowing, lending, and invest-ing transactions. The Centers for Medicare and Medicaid Services (CMS) of the U.S. Department of Health and Human Services use the government statistics data as input to the annual national health expenditure accounts. Uses of the data by BEA, FRB, and CMS are discussed separately below.
In addition to their use for these essential economic time series, the state and local government data have other uses by federal agencies that accord them political sensitivity and importance. In the years from its estab-lishment as an independent, bipartisan intergovernmental agency in 1959 to 1997, the U.S. Advisory Commission on Intergovernmental Relations (ACIR) was a major user of state and local government statistics to sup-port its studies of key aspects of intergovernmental interaction. The ACIR served as a repository of experience and information on intergovernmental structure, finance, process, and practice and conducted studies to identify emerging governmental issues, trends, and turning points. The state and local data were essential for the work of the ACIR, and, for a time, the interface between the ACIR staff and the Governments Division staff was exceptionally close and symbiotic.
The ACIR also utilized and added value to the Census Bureau’s state and local government data in the preparation and publication of an an-nual volume entitled Significant Features of Fiscal Federalism. The volume, which was published by the nongovernmental American Council on In-tergovernmental Relations for a short time after the demise of the ACIR, provided significant analytical and comparative information from BEA and the Office of Management and Budget that enriched the Government Division’s data. The ACIR also published a series of reports on distressed communities that appeared under various titles. The distressed community reports contained a statistical analysis of the characteristics of governments and the populations of central cities and suburbs and relied heavily on Governments Division data.
�0 STATE AND LOCAL GOVERNMENT STATISTICS AT A CROSSROADS
Although there is no longer the equivalent of an ACIR to drive demand for and use of the state and local governments data, several federal agen-cies use these data in defining units of government under federal legislation, assessing the impact of public policies and in formulas for local reimburse-ments and grants that govern the transfer of billions of dollars, so the stakes are still high for accurate, objective data.
The U.S. Department of Housing and Urban Development (HUD) uses the data in its State of the Cities Data System (U.S. Department of Housing and Urban Development, 2007). HUD also has used Governments Division quarterly data on state and local government property tax revenues as an input to computation of operating cost adjustment factors for calculating rent adjustments under various housing programs. The U.S. Department of Labor (DOL) uses the data to administer the Family and Medical Leave Act and the Fair Labor Standards Act, specifically to determine under the Fair Labor Standards Act if an agency is a “public agency.” The data are also used by congressional committees, the Congressional Budget Office, the Congressional Research Service, and various executive branch agencies to assess the effects of legislative proposals on state and local governments and for specific analyses of federal actions.
Bureau of Economic Analysis
The Census Bureau considers as the most important applications of the Governments Division data to be the Bureau of Economic Analysis uses.1 BEA is an agency of the U.S. Department of Commerce. Along with the Census Bureau, it is part of the department’s Economics and Statis-tics Administration. BEA produces the gross domestic product, balance of payments, state and local personal income, gross domestic product by state, input-output accounts, and other economic statistics. BEA conducts research and analysis, develops and implements estimation methodologies, and disseminates statistics to the public. It collects some source data itself but relies heavily on other agencies, in particular, the Census Bureau, for most source data. BEA uses the data from the state and local government statistics programs as a primary source for the state and local components of the NIPAs and the regional economic accounts and for elements of other economic statistics, such as input-output accounts.2
BEA underscored the importance of the Governments Division data to
1 Statement by Thomas Mesenbourg, associate director for economic programs, U.S. Census Bureau, at the panel’s June 2006 workshop.
2 In addition to detail from the input-output accounts, Tables III-1 to III-5 of BEA Method-ology Paper 5 identify the other primary data sources currently used to prepare the state and local estimates in the NIPAs (U.S. Bureau of Economic Analysis, 2005).
DATA USERS AND USES ��
the panel by noting the size of the state and local government component of the national accounts. Consumption expenditures and gross investment by state and local governments, not including government transfers, currently account for 12 percent of GDP and 63 percent of total government expen-ditures, including federal defense and nondefense components.3 The state and local government component exceeds not only the federal government component, but also such components as exports.4
The state and local government data, however, because of their lack of timeliness, are also one of the major sources of revision in the GDP esti-mates. Over the period 1983–2002, the average revisions to the estimates of state and local government purchases of goods and services were typi-cally larger than the average revisions to all other eight major components. Only the equipment and software investment and the export components had larger revisions (Fixler, 2004).
The BEA time series estimates of GDP and other elements of the NI-PAs are widely cited in the media and used by many analysts and decision makers in the public, private, and academic sectors. Government agency users of the BEA aggregate estimates of state and local government expen-ditures include state and local governments, the Congressional Budget Of-fice, the Board of Governors of the Federal Reserve, the U.S. Department of the Treasury, the U.S. Office of Management and Budget, and the U.S. Government Accountability Office. Thus, much of the use of Governments Division data is indirect. For example, the FRB uses the NIPA data on net saving, real investment, and consumption expenditures as the basis of its review of economic and financial developments in its semiannual Monetary Policy Report to Congress.
The reason that the FRB and other agencies seek out BEA time series rather than rely on the original Governments Division data is because of the value added by BEA. Most importantly, BEA translates the source data into the national accounts structure and concepts and transforms them to a calendar-year basis. BEA also provides updated quarterly estimates as the source data are released, and it derives price indexes and real constant dollar measures for the state and local government component on the same basis as other BEA series.
One of the two main regional account series is the gross domestic product for states (formerly called the gross state product). This series is the sum of the value added for all industries in the state, which equals the sum of compensation of employees, plus taxes on production and imports less subsidies, plus gross operating surplus (the balance available to the
3 Based on presentation by Dennis Fixler, U.S. Bureau of Economic Analysis, at the panel’s June 2006 workshop.
4 U.S. Census Bureau, Statistical Abstract of the United States: �00� (2005:Table 650).
�� STATE AND LOCAL GOVERNMENT STATISTICS AT A CROSSROADS
state that allows it to reimburse bond holders, among others). It relies on the Census of Governments and the annual and quarterly finance surveys as primary data sources for taxes on production and imports for all industries and for gross operating surplus for government enterprises.
The other major regional account series produced by BEA comprises the state personal income estimates. This series uses data from the Census of Governments and the surveys of annual government finances, tax collec-tions, employment, and public employee retirement systems. BEA’s industry accounts also use the Governments Division data for the state and local highway construction component of gross output and for the commodity composition of intermediate purchases for the input-output accounts.
BEA Adjustments to Governments Division Data
BEA must adjust the Governments Division data because information developed for purposes of fiscal and financial decision making does not conform precisely to the accounting and conceptual basis for the national economic accounts (see Box 3-1). One adjustment has to do with the cal-endar—the national accounts are on a calendar-year basis but state govern-ment financial data are on a fiscal-year basis, typically July 1 to June 30, and local governments have a wide variety in the timing of their fiscal years. To convert the more standard fiscal years to calendar years, BEA must use a 2-year average for the most part.
BEA further modifies the state and local government data on receipts and expenditures to account for coverage differences, netting and grossing differences, and timing and other differences.5 These adjustments, in total, are quite consequential. In 2003, the adjustments for accounting and con-ceptual differences amounted to about a 30 percent reduction in state and local government revenues and expenditures from the original Governments Division estimates.
BEA Uses of Employee Retirement, Employment, and Other Data in Producing Personal Income Data
In response to an inquiry from the panel, BEA explained its need for data from the Governments Division public employee retirement system survey. Employer contributions to state and local government retirement systems are used for the estimates of compensation of the employees com-ponent of GDP and state personal income. Moreover, state personal income
5 These adjustments are presented in NIPA Table 3.19. Details are presented in Methodology Paper 5: Government Transactions (U.S. Bureau of Economic Analysis, 2005).
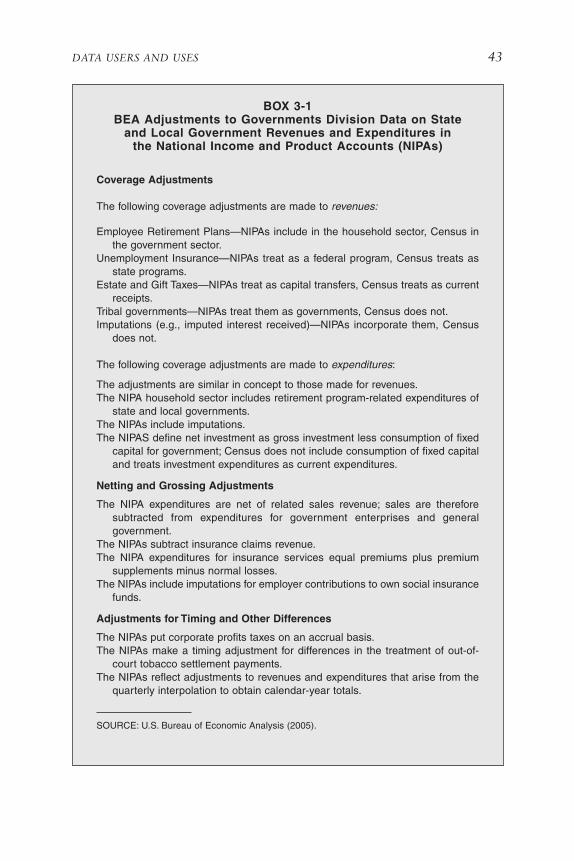
DATA USERS AND USES ��
BOX 3-1 BEA Adjustments to Governments Division Data on State
and Local Government Revenues and Expenditures in the National Income and Product Accounts (NIPAs)
Coverage Adjustments
The following coverage adjustments are made to revenues:
Employee Retirement Plans—NIPAs include in the household sector, Census in the government sector.
Unemployment Insurance—NIPAs treat as a federal program, Census treats as state programs.
Estate and Gift Taxes—NIPAs treat as capital transfers, Census treats as current receipts.
Tribal governments—NIPAs treat them as governments, Census does not.Imputations (e.g., imputed interest received)—NIPAs incorporate them, Census
does not.
The following coverage adjustments are made to expenditures:
The adjustments are similar in concept to those made for revenues. The NIPA household sector includes retirement program-related expenditures of
state and local governments. The NIPAs include imputations. The NIPAS define net investment as gross investment less consumption of fixed
capital for government; Census does not include consumption of fixed capital and treats investment expenditures as current expenditures.
Netting and Grossing Adjustments
The NIPA expenditures are net of related sales revenue; sales are therefore subtracted from expenditures for government enterprises and general government.
The NIPAs subtract insurance claims revenue. The NIPA expenditures for insurance services equal premiums plus premium
supplements minus normal losses. The NIPAs include imputations for employer contributions to own social insurance
funds.
Adjustments for Timing and Other Differences
The NIPAs put corporate profits taxes on an accrual basis. The NIPAs make a timing adjustment for differences in the treatment of out-of-
court tobacco settlement payments. The NIPAs reflect adjustments to revenues and expenditures that arise from the
quarterly interpolation to obtain calendar-year totals.
SOURCE: U.S. Bureau of Economic Analysis (2005).

�� STATE AND LOCAL GOVERNMENT STATISTICS AT A CROSSROADS
estimates are used directly to allocate over $215 billion of federal funds for Medicaid and other programs that use the Medicaid funding formula.
Aside from retirement system survey data, the only other local gov-ernment statistics that BEA uses in producing personal income estimates are the data on locally imposed taxes on individual income, motor vehicle licenses, and personal property. These items do not have a substantial im-pact on state personal income, and the national estimates are derived from samples, not complete accounts. For local income taxes, BEA might be able to get data online from the states that are affected if the tax data were not available from the Governments Division, but the availability of annual and interim financial reports varies dramatically across local governments.
BEA also uses the Governments Division employment data in the mea-surement of GDP to allocate compensation across functions of government and to estimate full-time-equivalent employment for state and local govern-ments, which is used to estimate real compensation. The regional program uses the Census of Governments and the Annual Survey of Employment to derive state-level estimates of the employment and wages and salaries of students and their spouses who are employed by public institutions of higher education in which the students are enrolled. There is no other na-tional or state source for information on student workers at state institu-tions of higher education. In 2004 the national wage estimate for student workers was about $5 billion.
BEA Suggestions to Enhance the Governments Division Data
BEA would like to receive the Governments Division data on a more timely basis. BEA also reported to the panel that the following enhance-ments to the Governments Division data would be helpful:
• the addition of information on defined-contribution retirement plans of state and local government workers;
• more data on social benefit programs; • industry detail for tax data; and • data on intangible capital, such as innovative property (e.g., R&D)
and economic competencies as well as software and other informa-tion technology.
In some instances, BEA could take some reductions in data without harming the estimates. For example, although BEA considers data from the school system finance survey that the Governments Division conducts for the U.S. Department of Education to be critical, some of the details in
DATA USERS AND USES ��
the survey could be reduced without harm to the measurement of GDP.6 This survey covers units that account for about one-half of total spending by local governments.
FRB
The FRB flow of funds accounts measure financial flows across sectors of the economy, tracking funds as they move from sectors that serve as sources of capital, through intermediaries (such as banks, mutual funds, and pension funds), to sectors that use the capital to acquire physical and financial assets. In constructing these accounts, the FRB needs inputs that are consistent and timely, much in the same way that BEA needs data for the national accounts (Teplin, 2001).
The FRB uses three of the Governments Division surveys for its flow of funds accounts—the Annual Survey of State and Local Government Fi-nances, the Annual Survey of State and Local Government Public Employee Retirement Systems, and the Quarterly Survey of Finances of Selected Pub-lic Retirement Systems.7
Annual Survey of State and Local Government Finances
Many of the inputs to the flow of funds accounts representing state and local government finances (excluding retirement plans) are taken directly from the national income and product accounts and not from the Census Bureau sources. With the exception of some differences in the definition of saving, the adjusted NIPA data fit into the FRB framework.
However, information on the assets and liabilities of state and local governments are not readily available, so the FRB must benchmark its quarterly estimates of total financial assets of state and local governments to the Governments Division annual survey. The FRB uses year-to-year growth in the “cash and security holdings, other than insurance trust funds” ag-gregate value for all state and local governments as the benchmark growth rate measure for state and local government assets in its accounts. To this measure of state and local government assets, the FRB adds NIPA estimates of taxes receivable and its own estimate of trade receivables. Because of the time lag in the release of the annual Governments Division survey data, the FRB projects the growth rate and revises it once the actual growth rate becomes available.
The FRB makes extensive use of the Comprehensive Annual Financial
6 BEA, Response to Panel Questions, July 26, 2006.7 Discussion of the FRB uses of the Governments Division data is based on Paul Smith’s
presentation at the panel’s June 2006 workshop.
�� STATE AND LOCAL GOVERNMENT STATISTICS AT A CROSSROADS
Reports (CAFRs) provided by state and local governments to the Single Audit Reporting Program in the Governments Division to determine how to allocate assets across categories. For this purpose, the agency takes a sample of the largest governments and sorts through their reports, including footnoted information, to determine portfolio allocations.8
Annual Survey of State and Local Government Public Employee Retirement Systems
The FRB uses most of the asset categories for investments and cash on hand and on deposit that are available at the aggregate, national level from the Governments Division survey of public employee retirement systems. It benchmarks total asset levels to the survey estimates after subtracting real property assets and adjusting corporate bonds from market to book value. The FRB uses the CAFRs for the largest 100 retirement funds to better adjust the asset categories.
Quarterly Survey of Finances of Selected Public Employee Retirement Systems
The FRB uses the quarterly growth rates for asset categories in order to move its time series forward between annual Governments Division sur-veys. The categories in the quarterly surveys are broader than the annual survey; the FRB therefore adjusts the quarterly data in two steps. After the FRB adjusts the quarterly estimates to be consistent with the annual estimates, it uses prior adjustments to make the annual estimates consis-tent with the flow of funds accounts. The FRB extrapolates estimates until quarterly survey estimates become available.
FRB Suggestions to Enhance the Governments Division Data
The FRB expressed interest to the panel in the addition of data items to the survey of state and local government finances to include more detail by asset categories, estimates of total assets held in pooled accounts and how these assets are invested, and greater access to the Governments Divi-sion electronic CAFR database. The FRB would also like the Governments Division to change the asset categories in the public employee retirement
8 CAFRs are provided to the Governments Division by state and local governments as part of the federal single audit process for recipients of federal grants. This program, including the division’s information clearinghouse role, is overseen by the Office of Management and Budget and reimbursed by major grant-making federal agencies (see http://www.census.gov/econ/overview/go1400.html). CAFRs are also required for compliance with standards of the Governmental Accounting Standards Board (GASB) as discussed in Chapter 6.
DATA USERS AND USES ��
systems annual and quarterly surveys to match the flow of funds categories. The pooling of investment funds by state and local governments makes it difficult for the FRB to determine how much is in the investment accounts and where the money is invested.
It would also like the division to conduct separate annual and quar-terly surveys of state and local government defined-contribution retirement plans, for which information is currently missing from the flow of funds ac-counts. The FRB has, in fact, developed an idealized form for such a survey and has discussed it with the Governments Division. From the perspective of the FRB, this initiative needs to continue, as the Governments Division survey collects data only on defined-benefit plans. Finally, like the BEA, the FRB would like more timely data from the division.
Centers for Medicare and Medicaid Services
Since 1964, the U.S. Department of Health and Human Services has published an annual series of estimates of total national health expenditures. These estimates, termed national health expenditure accounts (NHEAs), are compiled with the goal of measuring the total amount spent by residents of the United States to purchase health care goods and services during the year. Also included are the amounts invested in medical sector structures and equipment and in noncommercial research to secure the provision of health services in the future.
The NHEAs, which are produced by the National Health Statistics Group in the Centers for Medicare and Medicaid Services, are generally compatible with the NIPAs, although they provide a more complete picture of the health care sector of the nation’s economy in one set of statistics. Three primary characteristics of the NHEAs flow from this framework. First, the NHEAs are comprehensive because they contain in a unified structure all of the main components of the health care system. Second, the accounts are multidimensional, encompassing not only expenditures for medical goods and services, but also the sources of funds that finance these expenditures. Third, the accounts are nationally consistent because they apply a common set of definitions that allow comparisons among categories and over time.
The NHEAs measure expenditures on health care goods and services by type of service provider and by source of funds.9 Service providers are clas-
9 Memorandum from Stephen Heffler and Arthur Sensenig, National Health Statistics Group, Office of the Actuary, Centers for Medicare and Medicaid Services to Thomas J. Plewes, July 27, 2006. The appendix to this memorandum contains an introduction to the national health expenditure accounts, which includes a table of the most recent NHEA estimates. Also in-cluded in the Appendix is the description of the government public health activity estimates and the methodology used to prepare them.

�� STATE AND LOCAL GOVERNMENT STATISTICS AT A CROSSROADS
sified by establishment—for example, hospital services, physician services, and nursing homes. The source of funds classification is broadly broken down into private and public sources of funds, and the public source of funds category is further broken down into federal sources and state and local sources. In more detailed NHEA tables, estimates by source of funds are further broken down into specific federal, state, and local types of pro-grams—Department of Veterans Affairs, Department of Defense, Medicare, Medicaid, etc. (U.S. Centers for Medicare and Medicaid Services, 2007).
Uses of Governments Division Data for the NHEAs
Governments are involved not only in funding care for individual citizens, but also in organizing and delivering publicly provided health ser-vices, such as epidemiological surveillance, inoculations, immunization or vaccination services, disease prevention programs, the operation of public health laboratories, and other such functions. In the NHEAs, spending for these activities is reported in a category called “government public health activities,” which accounted for 21 percent of total health expenditures in 2004.
State and local government public health activity expenditures are primarily for the operation of state and local health departments. CMS estimates state and local government spending for health departments by using data from the Census of Governments and from the Annual Survey of State and local Government Finances. The most recent year’s estimates are prepared by extrapolating the prior year’s estimates by the change in total state and local government expenditures. Federal payments to state and local governments are deducted to avoid double-counting, as are ex-penditures made through the Maternal and Child Health Program and the Crippled Children’s Program.
The National Health Statistics Group in CMS is also an indirect user of many other state and local government statistics from the Governments Division. It uses BEA estimates that are based on the division’s data as input to estimates of other categories in the NHEAs, such as hospital care.
CMS Suggestions to Enhance the Governments Division Data
CMS’s suggestions and concerns regarding the Governments Division data for the most part center on the Government Finance and Employment Classification Manual, which is produced by the Governments Division and used to code its federal and state and local government statistics. The version of the Manual available on the division’s website at the time of CMS’s input to the panel was dated December 2000; in October 2006, the
DATA USERS AND USES ��
Governments Division published a revised manual that was implemented in its annual surveys beginning in 2005 (U.S. Census Bureau, 2006b).
CMS identified four basic issues with the expenditure classifications in the Manual (2000 version) that impede its ability to produce needed esti-mates: limited functional detail for health services; functional codes that do not match international codes; the overly broad definition of function code 32 (other health, now “health”); and the treatment of medical transporta-tion. These issues remain with the 2006 version of the Manual. Because of the Manual’s coding structure, CMS must rely on other sources—primarily the federal budget—to estimate expenditures of government health care providers by function and type of service. The situation is even more prob-lematic for state and local health care expenditures because there are so few viable alternative sources.
Limited functional detail. On one hand, the functional groupings of gov-ernment expenditures in Chapter 5 of the 2006 Manual do not include an aggregate “medical” or “health care” functional grouping. On the other hand, the available specific codes are limited in number and overly broad in scope. There are only seven relevant codes:
1. Code 28, federal veterans’ health—includes federal payments for health care services to veterans other than in hospitals.
2. Code 32, health (formerly “other health”)—includes a wide range of services (see below).
3. Code 36, hospitals (combines the previous code 36 for other public hospitals together with code 38 for “other hospitals”)—includes most payments for health care services in public and private hos-pitals, excluding federal veterans’ hospitals.
4. Code 37, federal own hospitals—veterans.5. Code 39, federal other hospitals—veterans.6. Code 74; public welfare, vendor payments for medical care—in-
cludes Medicaid and other means-tested medical assistance. 7. Code 79, public welfare, other—includes a wide range of services,
such as energy, day care, housing, and other means-tested public as-sistance, along with some health care services, such as the costs of administering medical and case assistance and payments to public hospitals other than under Medicaid.
There are no other functional groupings identifying health care or medical services. CMS stated to the panel that this level of detail is not sufficient to produce estimates of government medical care spending by function, by provider type, or by nature of service.
In part, the problem of limited functional detail would be overcome
�0 STATE AND LOCAL GOVERNMENT STATISTICS AT A CROSSROADS
if the Census Bureau functional codes were to match international codes. CMS expressed concern that the two-digit function codes in Chapter 4 of the Manual do not appear to be compliant with the Classification of Func-tions of Government (COFOG) maintained by the United Nations Statistics Division in that they do not have sufficient detail. The COFOG 2-digit division code 07 (health) is not replicated in the Manual (2-digit division codes are the highest level of aggregation in COFOG), nor are the COFOG groups (3-digit codes) and classes (4-digit codes) that pertain to health. At a minimum, 3-digit COFOG detail for health would be needed for CMS to produce sufficiently detailed estimates of government public health activity by function and nature of service from the Governments Division data.
Definition of function code 32: health. The definition of function code 32 is “Provision of services for the conservation and improvement of public health, other than hospital care, and financial support of other govern-ments’ health programs.” The long list of examples includes some functions that are not recognized as health care in other classification schemes—the System of National Accounts (SNA), the System of Health Accounts (SHA), the COFOG system, and the definitions in the NHEAs. Among the func-tions that are not universally recognized as health care are
• rabies and animal control;• abatement of mosquitoes, rodents and other vermin;• functions of the Environmental Protection Agency (EPA) at the
federal level;• health-related inspection and regulation (e.g., inspection of restau-
rants, water supplies, food handlers, nursing homes, etc.);• environmental activities in support of regulation of air and water
quality; and• cleanup of hazardous waste sites.
Medical transportation. In the Manual, ambulance services are included in two separate function codes, depending on whether the service is organized as part of a fire department (included in function code 24, local fire pro-tection) or as an independent service (included in function code 32, other health). Lack of specific detail, as well as inclusion of the same function in two different codes in the Manual, makes it impossible for CMS to estimate expenditures on medical transportation provided by governments. It is important to be able to break out expenditures for medical transportation provided by governments, since CMS estimates that this function costs between $35 and $70 billion annually.

DATA USERS AND USES ��
Implications of Classification Issues
Lack of detailed data on state and especially local government expen-ditures on government public health care services, antiterrorism spending, and medical transportation is seen as a problem, not only for CMS, but also for the public health community. Insufficient detail leaves the public health community without a uniform metric for assessing state and local public health infrastructure, severely limiting and complicating the task of emergency planning. The lack of data affects the reliability of estimates of surge capacity, public health expenditures for pandemic flu preparedness, and similar purposes.
Since the terrorist attacks on September 11, 2001, and the anthrax attacks in fall 2001, public health issues have grown in importance, and CMS has received more requests for information on per capita spending on public health by county or state in order to make estimates of surge capacity, public health expenditures for pandemic flu preparedness, and similar purposes. CMS is limited in its ability to respond to these requests because, as stated above, the Governments Division data are not detailed enough to break out public health and antiterrorism efforts from all other health expenditures.
PUBLIC INTEREST GROUPS
Public interest groups use the Governments Division data on state and local government organization, finances, and employment as the basis for tracing changes in the well-being of their constituents, for analyzing general government trends, and for research, advocacy, and lobbying purposes. Seven organizations invited by a subgroup of the panel participated in a May 2006 meeting to express their thoughts on the work of the Govern-ments Division: the Federation of Tax Administrators; the Governmental Research Association; the International City/County Management Asso-ciation; the National Association of Counties; the National Association of State Budget Officers; the National Association of State Retirement Administrators; and the National League of Cities. The National Confer-ence of State Legislatures, which was also invited but could not attend the meeting, provided comments afterward. The panel’s June 2006 workshop included additional presentations from the Governmental Research As-sociation, the International City/County Management Association, and the National League of Cities. Each organization differs in its needs and uses of the Governments Division data. Appendix E is a summary of their presentations on data needs and uses.
Since the Governments Division data do not meet all the needs of public interest groups, some groups have designed their own surveys to capture
�� STATE AND LOCAL GOVERNMENT STATISTICS AT A CROSSROADS
additional information. While they acknowledge that the quality of their data is not as high as that from the Governments Division, they often collect data at finer levels of detail and, for the most part, are able to make data available in a timely manner.
The International City/County Management Association (ICMA), a professional association of appointed local officials, including county man-agers; city, town, and village managers; department heads; and other local government officials, rarely uses the Census Governments Division data directly.10 However, ICMA does use the Governments Division’s surveys and data to develop the samples for their own surveys.
In order to obtain more current data, ICMA conducts five to seven an-nual surveys of their constituency, which includes all county governments and municipal governments (cities, towns, and villages) representing popu-lations of 2,500 or more. A primary reason driving ICMA to develop its own surveys is to allow for comparison across governments, because local governments want to benchmark and make very specific comparisons. For example, two areas of interest for comparisons are revenues and expendi-tures for solid waste management and parks and recreation. The response rates for ICMA surveys are low—generally between 20 and 40 percent. Lo-cal governments have a low response rate and commission forms of govern-ment generally do not respond. Most of the data are released in September following the end of the previous fiscal year for which they are collected, and the ICMA tries to maintain longitudinal consistency, although ques-tions are sometimes added to address current policy issues.
The National League of Cities (NLC) also conducts surveys of its own—notably the Annual City Fiscal Conditions Survey, which has been conducted annually since 1987.11 The NLC uses its survey to supplement the revenues and expenditure data from the Governments Division. A sec-ond purpose of the survey is to capture the items that reflect the biggest concerns for politicians and policy makers in agreeing on a budget, which typically involve the general fund budget. The questions in the NLC survey are similar to those on the Governments Division surveys, although they are more detailed. NLC surveys have some problems with accuracy and response rates, since the surveys are self-reported and voluntary. The over-all response rates for the Annual City Fiscal Conditions Survey have been between 30 and 50 percent, although for larger municipalities the response rates have been about 70 to 80 percent. About 70 percent of all municipal
10 Based on presentations by Evelina Moulder, director of survey research and information management, International City/County Management Association, during the panel’s meeting with data users, May 9, 2006, and its workshop, June 22, 2006.
11 Based on presentations by Christiana Brennan, National League of Cities, during the panel’s meeting with data users, May 9, 2006, and by Michael Pagano, National League of Cities and the University of Illinois at Chicago, at the panel’s workshop, June 22, 2006.
DATA USERS AND USES ��
spending is represented in the responses received, and supplemental infor-mation is collected from budgets that are posted online. About 80 percent of respondents use the NLC electronic portal to complete the survey, al-though the NLC sends a paper version to all cities in the sample.
The National Association of Counties conducts surveys only to obtain specific information not gathered elsewhere. It recently collected special data for its report on counties in crisis.
The National Association of State Budget Officers relies on its own fiscal survey and final expenditure report in order to break down the “all other” category from the Governments Division, which accounts for about one-third of all state government expenditures. The categories for the this expenditure report differ from the Governments Division categories. Finally, the National Association of State Retirement Administrators, the National Conference of State Legislators, and the Federation of Tax Ad-ministrators conduct surveys on public pensions, annual state expenditures, and taxes, respectively.
RESEARCH INSTITUTIONS AND ACADEMIC RESEARCHERS
Researchers in universities and public policy institutes use the Gov-ernments Division data for purposes similar to those of public interest groups—to conduct policy research and to communicate current issues of state and local government finance and organization to policy makers and the media. Academic researchers also use the data for in-depth analyses of the factors that affect the finances and employment of state and local gov-ernments, including the consequences of economic growth and decline.
At its June 2006 workshop, the panel heard from four groups of researchers: (1) a group at Canisius College that analyzes overlapping governmental entities, particularly special districts that span counties and states, which are difficult to capture; (2) the Urban Institute–Brookings Institution Tax Policy Center, which is building a database of rankings to help users compare and contrast governments on a variety of dimensions; (3) researchers at the University of Wisconsin–Madison, who focus on in-tergovernmental grants; and (4) the panel’s own members, who identified research uses and data needs in several areas. Some research users, including the Urban Institute, are both users of and disseminators of data on state and local governments, which gives them additional valuable perspectives (see the following section). It should be recognized that these policy and academic users who made presentations are simply illustrative of a much broader group of academics and others who rely on these data and use them in the study of public administration and political science. The views of these users are also important and should be considered by the Census Bureau as it develops a research and development program for the future.
�� STATE AND LOCAL GOVERNMENT STATISTICS AT A CROSSROADS
The researchers who made presentations uniformly attested that the Governments Division data are valuable. They especially appreciated the fact that all of the information collected on state and local governments is available at the same place, which facilitates linking the states to their local governments. Such linkages are important because the responsibilities of different levels of government vary across states. Having an annual series on state and local government finances is crucial to measuring the effects of policies and general equilibrium effects from other economic conditions. The aforementioned gap in 2001 and 2003 state and local revenue data from the Governments Division came at a time of recession. While some analysts believe that property taxes acted as a savior for many state and local governments during that time, there are no data to support that theory because of the gap. Having this information on an annual basis, even in the aggregate, is critical for research on state and local governance.
Research on Governmental Organization
Researchers at Canisius College use the Governments Division data for analysis of such issues as central city and suburban fiscal disparities. They also use state and local governments data as input to the urban public fi-nance component of the Department of Housing and Urban Development’s State of the Cities Data System. The system includes information on 21,000 governments in 101 metropolitan areas. Researchers credit the fiscal infor-mation from the Governments Division for consistently defined categories for the ability to compare across states and time.
Prior to 1997, researchers who wanted information on government organization mainly used three Governments Division publications—the Government Organization Compendium, the Government Finance and Employment Classification Manual, and the Governments Integrated Di-rectory. Currently, this information is available electronically in public use formats of the individual unit file and the county area file. The Govern-ments Division data are critical to making meaningful comparisons among governmental units and consistent determinations between independent and subordinate governments with classifications that are consistently applied across states, even when the rationales within states vary. The only way to make comparisons across states and over time is with Governments Divi-sion data.
For the types of analysis conducted by researchers at Canisius College in support of the HUD data system, a central issue is that multiple govern-ment and fiscal entities typically overlie any given city or suburban area. The city is a fiscal artifact, as central cities and overlying governments of-ten are linked fiscally to county governments, school districts, and special districts. For example, in Columbus, Ohio, 14 school districts span the

DATA USERS AND USES ��
Columbus metropolitan area, which includes the city, a couple of counties, and several special districts. Moreover, the special districts that span coun-ties and sometimes states will not necessarily be identified in geographic area breakouts.
Examining the work that has been done with Governments Division data reveals several areas warranting improvement. For example, the Gov-ernments Division allocates all of the activity of multistate and multicounty special districts to one county area (a geographic concept). For example, the Washington Metro Transit Authority, which spans Washington, D.C., Northern Virginia, and suburban Maryland, is allocated to Washington, D.C. Some users would find it very helpful to have computerized informa-tion on the counties that are served by a special district. For survey years after 2002, the Governments Division stopped collecting data on service areas of special districts out of concern that special districts have become more complex and in recognition of the difficulty of equating the service area of a district with the counties in its legal jurisdiction. For example, the Intermountain Power Public Authority in Utah sells power to the city of Los Angeles. Given complexities like this and the Governments Division’s limited budget, it has stopped collecting these data. The disappearance of these data has made the analysis conducted by Canisius College for the HUD data system more difficult.
Uses and Misuses of Rankings
The Urban Institute–Brookings Institution Tax Policy Center database of state and local government information (described below) is designed to rank state and local governments on a wide range of dimensions, such as tax burden or per pupil expenditures on education. Some workshop partici-pants argued that rankings can be misleading and there is a risk they could be misused. Others suggest that rankings would be useful analytical tools if accompanied with the actual data that are ranked, and measures of central tendency, such as median, mean, and interquartile range. In reality, there is recognition that politicians, the media and the public like rankings and many use them to make decisions. It is therefore important that there are respected analysts and researchers, like those at the Urban Institute, who compile rankings as accurately, as promptly and with as many appropriate caveats as possible. Some participants go further to suggest that having rankings published by the Governments Division would give the rankings and the data behind them even more credibility, although they recognize that there would be a concern about the political and controversial nature of such a publication.
In its role as honest broker, the Governments Division could potentially contribute to improving the rankings that are often made of government fi-
�� STATE AND LOCAL GOVERNMENT STATISTICS AT A CROSSROADS
nancial data, such as percentages of personal income. The choice of income series influences the rankings. It would be helpful if the Governments Divi-sion would specify the appropriate series for ranking purposes, elaborate its strengths and weaknesses, and indicate whether researchers should use the data as originally published or as revised.
More generally, researchers who compile rankings need consistent and timely annual state and local data. Other issues related to compiling rank-ings are interstate consistency for user fees versus taxes and comparing state support for public higher education.
Other Research Needs
According to researchers at the University of Wisconsin–Madison, the Governments Division data on revenues and expenditures would be en-hanced if important background information were included on the effects of intergovernmental grants, including those made by states in funding public education and unconditional grants from states to municipal gov-ernments. Background information in the form of metadata, which is ac-companying data about the data, would also be helpful to inform analyses of the relationship between state aid and changes in economic and fiscal conditions. One example comes from the state of New Hampshire, which in 2000 passed legislation that required school districts to levy a minimum property tax; that tax was then treated by the Governments Division as an increase in the state property tax. Without this background information, the Governments Division data could be taken to indicate a large increase in the state’s share of education funding.
More generally, panel members, as well as other researchers, com-mented on important changes and trends in state and local government finances and employment for which the current Governments Division data provide too little detail for analysis. For example, state and local govern-ments have played an increasingly important role in financing and deliver-ing social services, and the federal government has made major changes to federal-state responsibilities in this area. States often go beyond what the federal government supports or requires by spending money on “state-only” child care programs or child welfare programs. It is possible to measure spending by states on very broad functions, such as public welfare, by us-ing data from the Census of Governments and the annual surveys. It is also possible to measure spending by states on specific federally funded social service programs, such as the Child Care Development Block Grant, by us-ing data from the relevant agency, which is the Administration for Children and Families of the U.S. Department of Health and Human Services in this case. It is not possible, however, to measure spending on important areas of public welfare—what might be called subfunctions—using either data

DATA USERS AND USES ��
source. Thus, it is not possible to know total state spending on child care (regardless of whether it is for a specific federal or state program). This is an example of an important public policy area for which the Governments Division data fall short.
As another example, many policy researchers—and the press and the public—are interested in the extent to which state and local governments have privatized functions previously conducted by government workers. This, too, is an important policy area about which the Governments Divi-sion data can provide no current information. This is unfortunate, since the data were once available—the 1987 and 1992 censuses included data on whether or not local governments provided certain services and, if so, whether they were partially or totally contracted out (although it was not possible to tell whether the services were contracted out to a private pro-vider or to another government). These data were discontinued with the 1997 Census of Governments.
Finally, there is widespread interest among public finance analysts for reinstating the data on taxable property values and assessment–sales price ratios that used to be collected in the Taxable Property Value (TPV) Survey. This survey was initiated with the 1957 Census of Governments in response to the directive in the U.S. Code (Title 13, Section 161) that each quinquen-nial Census of Governments includes “data on taxes and tax valuations of states, counties, cities, and other governmental units.” The TPV provided the only nationwide, state, and selected county assessment–sales price ratio statistics on a five-year basis, from 1957 to 1992.
Most of the surveys in that time provided an inventory of the assessed values and numbers of locally assessed real property parcels and their distribution within six use categories, data on de facto assessment levels, and coefficients of dispersion for individual assessment jurisdictions, plus effective property tax rates for hundreds of such places.12 The TPV had two parts, one on the assessed values for local general property taxation and the other on the taxable real property assessment–sales price ratios. The first part provided information on real property and personal property taxa-tion, types of properties that are currently lumped together under property taxation. The TPV survey had the strength of national internal consistency, which permitted unbiased comparisons of actual assessment levels across state and local jurisdictions.
The Census Bureau discontinued the TPV while conducting the 1992 Census of Governments because of significant budget restraints and the survey’s declining response rates. In addition, there was a change in defini-tion of a “representative sale” that confounded data collection and analysis.
12 National Tax Association, letter to Dr. Kenneth Prewitt, director, U.S. Census Bureau, March 23, 1999. This letter is included in this report as Appendix C.
�� STATE AND LOCAL GOVERNMENT STATISTICS AT A CROSSROADS
In responding to outside inquiries, the Census Bureau reported that it was “actively involved in research and testing new survey methodologies and technologies. It may develop that these efforts, in combination with appro-priate funding levels and improved cooperation for voluntary participation in our public sector surveys, will create a climate in which we can consider reactivating taxable property values in the future.”13 In the eight years that have passed since the TPV letter exchange, nothing has been done to test the collection of TPV, or to resolve issues with the definition of a representative sale (see Appendix C).
Until the discontinuation of data on market values, researchers could calculate effective property tax rates relative to the property value. With the current antiproperty tax climate in many states, the decisions to limit property taxes are being made without reliable data. These data on effec-tive tax rates are needed for tax limitation decisions and for wide-ranging analyses of household and business finances and economic behavior.
DATA USERS AS DATA DISSEMINATORS
Several public policy organizations have taken the initiative to develop databases of state and local government statistics for internal and external uses. The panel heard from three of them about their efforts and the uses they make of the Governments Division data. The organizations repre-sented are the Urban Institute–Brookings Institution Tax Policy Center, the Public Policy Institute of California, and Governing Magazine.
Urban Institute–Brookings Institution Tax Policy Center
The Urban Institute has made a significant commitment to creating a data resource for the occasional user of state and local government financial information—for example, if users are interested in property tax revenues across all states over time, they can get that information from the Urban Institute instead of having to go to the Governments Division and look up the information state by state.14 The Urban Institute–Brookings Institution Tax Policy Center has been working on a data query system that is geared to neophyte users, people who are new to the Governments Division data and may be intimidated by them, although it will serve many of the needs of more sophisticated users as well. The Tax Policy Center engages in pub-
13 U.S. Census Bureau, letter to Robert D. Ebel, National Tax Association, May 3, 1999.14 The work of the Urban Institute in developing this database was presented to the panel
by Kim Rueben, senior research associate at the Urban Institute–Brookings Institution Tax Policy Center. This system can be accessed from the Tax Policy Center web page (http://www.taxpolicycenter.org/home/).
DATA USERS AND USES ��
lic outreach and has frequent interaction with reporters looking for such information as state rankings.
The Urban Institute data query system allows users to access informa-tion by state for each type of government and for the nation as a whole. The data are displayed in nominal or inflation-adjusted dollars and can be expressed in total dollars, per capita, percentage of personal income, percentage of general revenues, or percentage of total expenditures. Users can export the data to Excel, comma delimited, or HTML files. The system will link to the Governments Division website for metadata, such as data definitions, technical notes, and standard errors.
Public Policy Institute of California
The Public Policy Institute of California (PPIC) makes state and local government data available in a table format with the dual goal of providing historical information in a flexible format and increasing the profile of its research.15 Given its research areas, most of the data and research projects are based on comparisons involving California governments. The institute plans to include a tutorial on its web site with instructions for creating and using the tables and for using the Governments Division information as metadata. Through its efforts to increase the awareness of local policy makers who are unaware that their budgets are the basis for the Census of Governments data, PPIC (and similar organizations in other states) may indirectly improve compliance with Census Bureau requests for statistics.
Governing Magazine
While Governing Magazine is not an academic institution, its readers represent the same interests as those of users of the Urban Institute and PPIC data systems.16 The magazine provides one of the major sources of information tailored to the needs of users of state and local government information. The magazine uses Census Bureau data, from both the De-mographic Directorate and the Economic Directorate, with supplemental information from a daily review of about 75 local newspapers to publish a ranking of the 1,000 largest jurisdictions by revenue and a listing of the nation’s billion dollar governments in terms of revenue, including all 50 states, 15 cities, 25 counties, and 8 special districts. These rankings illumi-
15 The work of PPIC was presented by Tracey Gordon at the panel’s June 22, 2006, workshop.
16 Discussion of Governing Magazine based on Ann Jordan’s presentation at the panel’s June 22, 2006, workshop.
�0 STATE AND LOCAL GOVERNMENT STATISTICS AT A CROSSROADS
nate state and local governance in ways that the raw data from the Census Bureau cannot.
For example, where a government falls on the list is not only a func-tion of population or economic activity within the jurisdiction, but also a function of the responsibilities within that government. A special district government, Port Authority of New York and New Jersey, has greater expenditures than four states and two major cities, Baltimore and Boston. When comparing expenditures and other economic activity, it is important to tabulate data by several types of governmental organizations.
The biggest frustration for Governing Magazine in using the Gov-ernments Division data is the timing of the data—for example, the 2006 Sourcebook published by the magazine used numbers for the 2003–2004 fiscal year. Given the age of the data, they often reflect the effects of poli-cies made on some prior elected official’s watch, and this fact is not always made clear by the media or candidates for political office. The magazine is aware of and uses similar data from other sources, such as the National Association of State Budget Officers, the National Conference of State Legislatures, and the Rockefeller Institute of Government; however, these sources collect more data on tax revenues than on spending, and they provide limited information on local governments. The consistency of the Governments Division data is the major reason why the magazine continues to use it as a primary source.
In addition to the issue of timeliness, Governing Magazine would like to see more data on technology expenditures. Most of the magazine’s advertisers are engaged in information technology (IT), and the magazine has made an effort to apprise companies in all industries of the purchasing power of governments using expenditure data from the Governments Divi-sion. However, these data lack detailed information on IT expenditures. IT data are difficult to collect since these expenditures weave throughout departments and do not hold a single line item in a budget.
The Governments Division has an effort under way to determine fea-sible methods for collecting accurate information on IT expenditures. The division has communicated with the Association of State Chief Information Officers and determined that there is commonality among the state govern-ments in how IT expenditures are reported. It appears that the best place to start in collecting this information is to work with the largest governments, but the division stresses the need for standards in this area. In addition to setting standards, the division would need to review the results of the In-formation and Communication Technology Survey recently conducted as a supplement to the Census Bureau’s Annual Capital Expenditures Survey. A review of the supplementary information would help the division under-stand better the IT infrastructure and to determine the best way to collect
DATA USERS AND USES ��
information on IT. Additional field and cognitive testing and focus groups would be needed as well.
CONCLUSIONS AND RECOMMENDATIONS
Based on the foregoing discussion, gleaned from meetings with data users and reflecting the expertise and experience of its members, the panel makes four overall conclusions on the topics of usefulness of the Govern-ments Division data; the trust by users in the data; the importance of uses of aggregate time series and of micro-level data; and the priority needs of data users. The panel’s recommendations in this chapter address two of users’ three main priorities: providing needed detail and classifications, and maintaining time series. The third—and highest—priority for users is improving the timeliness of the information, which the panel addresses in Chapter 5.
Overall Conclusions
Conclusion 3-1: The data on state and local governments from the Census Bureau’s Governments Division are of broad national interest and importance.
• The data serve a democratic nation built on principles of de-centralization and local control by maintaining a comprehensive source of information on state, regional and local governments that assist those institutions and public interest organizations—and through them, the voting public—to understand how individual governments compare with other governments on such important measures as tax burdens and expenditures on education, security, health, and other public services.
• The data are necessary for comparative research and policy analy-sis of levels and trends on a wide range of important topics, such as the changing nature of local and regional government institu-tions, including the emergence of new forms of local governance; intergovernmental grants and transfers of funds; the layering of governmental functions among types of governmental units; the effects of changes in the economy on revenues and expenditures; and the burdens of property and other taxes.
• The data are essential for economic time series that are widely used for public- and private-sector decision making, such as the national income and product accounts, the regional accounts, the flow of funds accounts, and the national health expenditure accounts.
�� STATE AND LOCAL GOVERNMENT STATISTICS AT A CROSSROADS
The panel notes that the full extent of the use of the Governments Divi-sion data is not easily documented or measured. The reason is that many uses of the data are indirect. The large numbers of users of measures of state and local government expenditures, revenues, assets, and debts in the NIPAs, the flow of funds, and the national health expenditure accounts, who are dependent on the Governments Division data, are often unaware of the fact that Governments Division data play an important role in the development of the measure of interest.
Conclusion 3-2: virtually all users of the Census Bureau’s Governments Division data, including federal agencies, public interest groups, and academic researchers, view the data as authoritative and valuable be-cause of the consistency of the data over time and across governments and the use of carefully specified standards and definitions for classify-ing governments and governmental activities.
The importance of maintaining the Government’s Division role in pro-ducing model data on state and local government finances and employ-ment cannot be overstressed. The panel returns to this point in Chapter 6 in discussing management issues and challenges for the division and the Census Bureau.
Conclusion 3-3: The Census Bureau’s Governments Division data serve two main communities: users of aggregate estimates (macrodata) for key economic time series, which include the federal agencies that pro-duce them, primarily the Bureau of Economic Analysis and the Federal Reserve Board, and users of data for individual state and local govern-ments (microdata) for research, policy analysis, and comparative rank-ings. While these two groups of users differ in some respects in their views of priority needs from the division, both groups benefit when the full range of needs is considered in establishing priorities.
Management of the Census Bureau’s Economic Directorate stressed repeatedly to the panel that the Bureau of Economic Analysis is the most important user for the Governments Division data, followed by the Federal Reserve Board. While fully supporting the needs of these two agencies and other agencies that produce important economic time series, such as the Centers for Medicare and Medicaid Services, in the panel’s view, the Gov-ernments Division needs to better balance its offerings to reflect the needs of other users as well.
Ideally, there is interplay between uses of macrodata and microdata from a statistical agency. In the case of statistics on state and local govern-ments, microdata analyses can bring to light anomalies in the data, such
DATA USERS AND USES ��
as those that may stem from differing accounting classifications between reporting units of government that require investigation. The correction of these reporting anomalies may improve the aggregate estimates. Microdata analyses can also identify important structural shifts in the provision of government services and sources of revenue that may have implications for the kinds of aggregate estimates that are produced for the NIPAs and other key economic time series. In turn, macrodata series are important for microdata users to provide the broad context for their analyses.
Conclusion 3-4: Users are in broad agreement about priority improve-ments they would like made in the Census Bureau’s Governments Di-vision data on state and local government finances and employment. Improving the timeliness of the data is of the highest importance, fol-lowed closely by improvements in the detail provided and in the clas-sification structure and avoidance of gaps in time series.
The panel addresses improving the relevance of the detail and classifi-cation structure and maintaining time series below; it addresses timeliness in Chapter 5.
Level of Detail and Classification Issues
Federal agencies, public interest groups representing state and local gov-ernments, and the research community all have a wish list for improvements in the level of detail and classification of governments and governmental functions. As examples, the research community and public interest groups want more disaggregated data on state and local government finances and greater attention to the information on cities and special districts, while the Centers for Medicare and Medicaid Services want data for health expen-ditures that are more detailed and consistent with international classifica-tions. Not satisfied with the data available from the Census Bureau, some public interest groups conduct special surveys to obtain additional detail beyond that available from the Governments Division.
A common theme underlying many user requests is the need for the Governments Division to adapt its classification structure and provide even more detailed information that illuminate important changes in types of expenditures and revenues and the provision of services by state and local governments. They ask, in other words, that the Census Bureau take ad-ditional steps to maintain the relevance of the data.
There are a number of examples of the need for data to maintain relevance. Both BEA and FRB agree on the need to have information on defined-contribution employee benefit plans in addition to the long-provided information on defined-benefit plans. The growth of defined-
�� STATE AND LOCAL GOVERNMENT STATISTICS AT A CROSSROADS
contribution plans has been explosive in the private sector, and the public sector is moving, although more slowly, in this direction as well. As another example, the Governments Division expenditures data would be much more useful for tracking trends in the devolution of federal responsibility to the states if the data identified not only very broad functions, such as public welfare, but also subfunctions, such as day care and job training services. Employment data would be more relevant if there were information on the privatization of government services formerly performed by govern-ment workers, a need that is understandable in light of the perceived trend toward outsourcing.
Balancing Relevance with Budgetary and Burden Considerations
Given the wide variety of data desired, satisfying all of the specific requests for new and disaggregated data to maintain the relevance of state and local government statistics might well overwhelm the Governments Division’s budget. The panel recognizes that it is far easier to point out shortcomings in the data than to determine how they might best be cor-rected, or to accept the trade-offs that might be required in a constrained budget environment. Seemingly simple solutions do not always work as expected: for example, eliminating some details so that others can be added may not save much money, because if the details are in state and local gov-ernment computers, the marginal expense of collection may be trivial and there may be a reprogramming cost for not collecting them. Moreover, it may not be possible to save money by reducing sample sizes, because the Governments Division already appears to have done much of what may be possible here, and the savings from dropping governments in the annual surveys may be exceeded by reenlistment costs when they are included again in the 5-year censuses.
Yet another consideration when adding new detail is the effect on re-spondent burden. For example, the data in the expenditure matrix of the finance survey are the most difficult to collect. The division has suggested collapsing the matrix to include fewer functions than the current 25, such as combining police and fire into a general public safety function or pro-viding total expenditures and not object expenditures for certain functions. Although this shortening of the list of data items would reduce burden, it would also interrupt the continuity of historical data series, provide less detailed information, and eliminate key information on functions used for a variety of analytical purposes and for BEA’s calculations of gross domestic product. Shortening the list of data items would also move the functional detail available for state and local governments further away from the clas-sifications recommended in international guidelines (see Chapter 6).
DATA USERS AND USES ��
Long Lead Times and Maintaining Continuity
One reason for the difficulty in implementing changes to maintain the relevance of the data is the long lead times that face the Governments Divi-sion when it seeks to make changes. The division is constrained to a fixed 5-year cycle for reviewing and introducing modifications to the content and other aspects of the Census of Governments, and, in a cascading manner, to the current survey programs. Although it is possible to update the annual and quarterly surveys independent of changing the quinquennial census, this is rarely done because of the risk of introducing data discontinuities between the census and the surveys.
These long lead times constrain the Governments Division to continu-ing to collect the same data for some time even though there is evidence that more relevant data could be collected. For example, as this report was writ-ten in 2007, the next opportunity to incorporate changes in the Census of Governments will be in 2012. In order to make those changes, the revisions to data collection related to the organization phase must be decided by Oc-tober 2010, one year before the mail-out in October 2011; the revisions to data collected on the employment phase would have to be made by April 2011 to incorporate them in the October 2011 organization phase mail-ing; and the revisions to data collection on the finance phase would have to be decided in a window from January 2011 to October 2011, depend-ing on the content. Not all of these revisions are within the Governments Division’s control. Those relating to the annual education finance survey, for example, require negotiation with the sponsor, the National Center for Education Statistics.
Even when changes in data collection can be made, there is a challenge in avoiding discontinuities in the data series that would adversely affect the time series required by key data users. Several methods are available for bridging the gap between old and new series. For example, the experience of the Census Bureau in bridging the potentially substantial discontinu-ity in series between the Standard Industrial Classification System (SIC) and the North American Industrial Classification System (NAICS) in the late 1990s is instructive. Beginning with 1998 data, the Census Bureau released County Business Patterns data classified by industry according to the NAICS, replacing the SIC categories. In order to facilitate comparison to earlier years, the Census Bureau developed estimates of the discontinued SIC data series for several years (U.S. Census Bureau, 2000a).
Maintaining Relevance: Recommendation
The panel credits that the Governments Division has been responsive to changing user needs in some respects. For example, the recent update of the
�� STATE AND LOCAL GOVERNMENT STATISTICS AT A CROSSROADS
Classification Manual added revenues from lotteries to the list of allowable categories for local governments in addition to state governments, and the division is also preparing a strategic plan, which provides for user input on data series (see Chapter 6). The panel thinks that the division needs to go further by developing a continuous process of identifying, evaluating, and following through on the most important needs of its users in both the short and the longer terms.
To begin this process, the Governments Division should develop a roadmap that takes into account potential changes in the content and clas-sification system for the Census of Governments and annual surveys, the issues such changes raise, and the pros and cons of alternative changes with regard to relevance, historical continuity, burden, and needed resources. The roadmap should be based, in part, on input solicited from users and data providers. The feedback should be used to identify high-priority needs and preferred methods of response. This will not be an easy task and may consume considerable staff time over the next 2–3 years. It should have a goal of identifying changes that can be implemented not later than in the 2012 Census of Governments and subsequent annual surveys. If resources permit, implementation of priority changes could usefully begin with the annual surveys prior to the 2012 census to permit evaluation and the de-velopment of overlapping time series with new and old measures. A similar process should be repeated at regular intervals (see further discussion in Chapter 6).
Recommendation 3-1: Over the next two to three years, the Govern-ments Division should seek input for and widely circulate a working paper that describes potential improvements to the detail and classifica-tion of the division’s data on state and local government finances and employment, the issues that each may raise, and the pros and cons of changes. Based on feedback from users, the division should develop a plan with well-justified priorities for improvements to be made in the 2012 Census of Governments and subsequent annual surveys.
Maintaining Time Series
In the state and local government statistics program, as with all federal government statistical programs, there is a tension between ensuring rel-evance, and thus the analytical value of the data, and maintaining historical continuity of the data series. Historical continuity cannot be maintained un-less some things remain constant, yet some data may no longer be relevant, while added or modified data may be required to shed light on new issues of analytical and public policy importance, such as the role of information technology in government operations.

DATA USERS AND USES ��
In the past, the Governments Division has had to trade off historical continuity in data series, not necessarily to maintain currency but, rather, because of budget difficulties. For example, to generate cost savings to finance editing and processing improvements to the annual finance survey, the Census Bureau temporarily reduced the sample size for local govern-ments, for 2001 and 2003 only. The smaller sample was sufficient to de-velop estimates of local government finances for the nation as a whole, but it was not sufficient to develop estimates of local government finances for each of the states, resulting in the only breaks that have ever occurred in the history of these annual data series. The sample size reduction and as-sociated work to improve data processing required a carefully negotiated alteration in the production schedule, especially with several users in the Bureau of Economic Analysis.17
Not having state-by-state information for 2001 and 2003 was a mat-ter of great concern to researchers, who could not fully assess what was happening to the fiscal health of state and local governments during a time of recession or assess the different strategies adopted by governments to respond to revenue shortfalls. Many questions that could be answered with state-level data on local governments in prior recessions and recoveries could not be answered this time around, for example: Did state govern-ments that were particularly hard hit by the recession tend to cut back state aid to local governments? Which states were more likely to impose cutbacks, and did they vary by fiscal capacity, poverty level of the popula-tion, or region? How did state and local fiscal structures relate to response to the recession—for example, were expenditures during the recession more stable in states in which local governments relied more heavily on property taxes?
Recommendation 3-2: The Governments Division should give priority to maintaining basic time series on state and local government finances and employment. It should avoid gaps and interruptions in basic time series, which undermine the ability of users to make consistent com-parisons over time and across jurisdictions. When new or modified content is introduced, the division should use such methods as over-lapping series or bridges between new and old series to assist users in making the transition.
Taxable Property values
The demise of the Taxable Property Values Survey was of great con-cern to researchers and policy analysts in government finance. The panel
17 Correspondence with Henry Wulf, October 18, 2006.
�� STATE AND LOCAL GOVERNMENT STATISTICS AT A CROSSROADS
is cognizant of the major stumbling block to the reinstatement of the TPV Survey, namely, budget constraints. The Governments Division has esti-mated that the cost of resurrecting the survey is about $25 million, which represents virtually its entire budget. Nonetheless, the potential usefulness of the data for public- and private-sector decision making and for research to understand the finances and economic behavior of all sectors—govern-ment, household, and business—is great. The panel urges, as part of the division’s assessment of data needs and implementation strategies recom-mended above, that the Governments Division determine priority needs for this type of information and innovative methods that could be used to collect it. We recognize that collecting and categorizing this information is challenging. The basis for assessments has changed in many jurisdictions from fair market value to acquisition value and value-in-use, and differing governments may vary the basis of assessment for the same parcel. None-theless, the value of having the Governments Division collect such data is that the information provided would be consistent and comparable.
Recommendation 3-3: In view of the importance of consistent, com-parable, objective data on property tax valuation and other features of property taxation by state and local governments, the Governments Division should carry out a program of research and testing to explore conceptually sound and cost-effective means of collecting these data, which could be in conjunction with, or independent from, the Census of Governments.
4
Data Quality and Statistical Methods
Like most other government statistical agencies, both here and around the world, the U.S. Census Bureau defines quality as “fitness for use,” a definition crafted with an eye toward the needs of data users (U.S.
Census Bureau, 2006a). Following the lead of the U.S. Office of Manage-ment and Budget (2002), the Census Bureau defines fitness for use in terms of three attributes: utility (to the intended users); objectivity (whether the information is accurate, reliable, and unbiased and is presented as such); and integrity (the security or protection of the information from unauthor-ized access or revision). The Census Bureau further defines these attributes in terms of their dimensions or elements.
After a brief discussion of dimensions of quality, this chapter considers several issues of statistical methodology and reporting that affect the quality and usability of the data from the Census of Governments and annual and quarterly surveys of government finances and employment: sample frame development and design, data collection, unit nonresponse, editing and imputation, estimation, data processing, revision policies, and cognitive testing of questionnaires. For each of these topics, the panel makes rec-ommendations for the Governments Division’s research and development program. The last two sections of the chapter discuss the planned redesign of the Quarterly Tax Survey and the division’s infrastructure for improve-ments in statistical methodology.
��
�0 STATE AND LOCAL GOVERNMENT STATISTICS AT A CROSSROADS
DIMENSIONS OF QUALITY
It is generally accepted that there are several dimensions to data quality. A quality schematic proposed by Brackstone (1999) was subsequently re-fined by the Census Bureau. The dimensions of data quality adapted in the Census Bureau publication Definition of Data Quality include relevance, accuracy, timeliness, accessibility, interpretability, and transparency.1
Relevance—the degree to which data products provide information that meets user needs.
Accuracy—the coherence between an estimate and its true value, usu-ally characterized in terms of systematic (bias) and random (vari-ance) errors.
Timeliness—the length of time between the reference period of the information and when the information is delivered to users.
Accessibility—the ease with which users can identify, obtain, and use the information.
Interpretability—the availability of documentation to aid users in un-derstanding the data.
Transparency—the existence of evidence that users can employ to assess the accuracy of the data, including information on assump-tions, methods, and results presented in a manner that would allow a third party to reproduce the information, subject to constraints of confidentiality and privacy.
We address aspects of accuracy and transparency that apply to the Governments Division’s data collections generally, including the Census of Governments and the annual and quarterly surveys. The special case of the Quarterly Tax Survey, which has been undergoing a major redesign while the panel examined the state and local government statistics programs, is discussed separately.
The accuracy of data from a census or a survey begins with the develop-ment of concepts, methods, and design; continues with the necessary steps of data collection; and includes processing and editing, the development of estimates, and data analysis. The responsibility for several key aspects of accuracy for the Census Bureau’s data on state and local governments is split among two divisions in the Census Bureau’s Economic Directorate. Generally, the Governments Division is responsible for data collection and editing, and a branch of the Economic Statistical Methods and Program-ming Division selects samples of local governments for the annual and
1 Brackstone’s sixth dimension was “coherence,” which the Census Bureau replaced with “transparency.”
DATA QUALITY AND STATISTICAL METHODS ��
quarterly surveys and is responsible for imputation and estimation. The re-sponsibility for development and testing of questionnaires is shared among the two divisions. Despite this division of labor, the Governments Division has overall responsibility for ensuring the relevance, accuracy, timeliness, accessibility, and other aspects of the quality of the data.
SAMPLE FRAME DEvELOPMENT AND DESIGN
Frame Development and Coverage
It is not easy to build and maintain a complete roster of governments, since there is considerable churning among governmental units. Govern-ments may dissolve or be incorporated into larger units, and new govern-ments may be formed. Still, this should be a fairly manageable activity for the Governments Division, since the universe of governments is much smaller and substantially more stable than, say, the universe of businesses or households.
The list of state and local governments is maintained in the Govern-ments Integrated Directory. This list is updated periodically with infor-mation on newly established government units that meet Census Bureau definitions, and dissolved or inactive units. General-purpose govern-ments are updated on the basis of the annual Boundary and Annexation Survey, conducted by the Geography Division of the Census Bureau, and school districts are updated with a list maintained by the U.S. Depart-ment of Education’s National Center for Education Statistics. Updating the list of special districts is more complicated and involves several steps: a review of state legislation; a review of published bond and other finan-cial transactions; a mail survey of city and county clerks; and analysis of information provided to respondents to annual surveys.
This updated directory is further screened by the Directory Survey of Local Governments, conducted as part of the quinquennial Census of Gov-ernments, which both updates the directory and collects basic characteris-tics of the governmental unit. The survey produces an up-to-date list of all local governments, which is used for the census and as a sample frame for the design of the annual and quarterly surveys.
Since it is used in developing a list for the census and a sample frame for the surveys, the completeness of the directory is a quality issue. Based on the collective judgment of the staff of the Governments Division and the us-ers contacted by the panel, there is no significant problem with incomplete enumeration of governments in the directory. Two other issues were noted, however, both potentially affecting the quality of the Quarterly Tax Survey. First, there is concern about duplication and bad addresses in the universe listing of local tax collection agencies used to select the sample for the prop-
�� STATE AND LOCAL GOVERNMENT STATISTICS AT A CROSSROADS
erty tax component of the survey (Hogue, 2005a). Second, the adequacy of coverage of special districts in this same survey has been questioned as well. Special districts present a problem for sample selection because many of them have existed for relatively brief periods and have wide geographic boundaries, which can cross state lines. The best opportunity to address these concerns is during the redesign of the Quarterly Tax Survey, discussed later in this chapter, and the panel encourages the Census Bureau to take full advantage of this and similar opportunities to assess the quality of the sample frame for the survey.
Conclusion 4-1: Coverage of the universe of general governments in the Census of Governments and annual and quarterly surveys appears to be complete for virtually all analytical purposes.
Sample Design
About two years after each Census of Governments, the Census Bureau draws a new sample for the annual surveys. Table 4-1 lists the annual and quarterly surveys of state and local governments, the universes they cover, and their current or most recent sample sizes. The sample design methods employed for each of the surveys listed in Table 4-1 are discussed in Ap-pendix A. For example, the selection of the 13,000 state and local govern-ments for the Annual Survey of State and Local Government Finances is a “size-based sampling procedure . . . based on the size of its long-term debt, expenditure, population, or enrollment. All local governments above variable size cutoffs (such as a population of at least 50,000) or perform-ing key functions (such as mass transit) are selected with certainty.” Each sample consists of a fixed set of units that are surveyed for the next 5 years, supplemented with all identified births.
This 5-year cycle of sample redesign has, on occasion, been relaxed for varying reasons, mostly to do with budget shortfalls. The undesirable result is a floating redesign program. For example, the post-1992 census redesign of the Annual Finance Survey was conducted in 1993 using 1987 census information because the 1992 data had not yet been collected and edited. The next redesign was in 2000, based on 1997 census results. In 2001, a smaller sample was selected to allow more time for developing a new questionnaire and new editing processes. The post-2002 census redesign, conducted in 2004, returned to a larger sample.
These irregularly scheduled redesigns and fluctuating sample sizes can affect the consistency of time series and the level of detail provided and have been of concern to users (see Chapter 3). Whether they have affected the quality of the data in other ways, for example, by introducing system-atic biases, is not clear. In addition, samples are about half the size of what
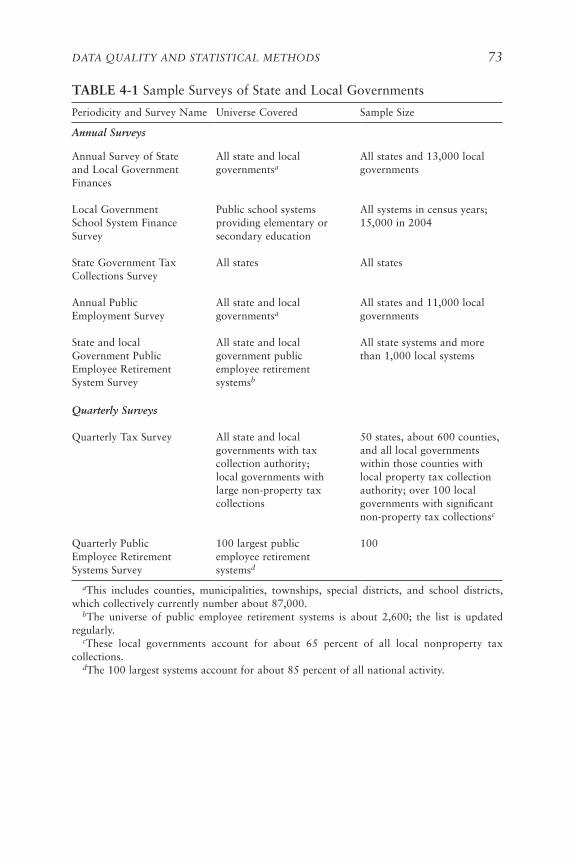
DATA QUALITY AND STATISTICAL METHODS ��
TABLE 4-1 Sample Surveys of State and Local Governments
Periodicity and Survey Name Universe Covered Sample Size
Annual Surveys
Annual Survey of State and Local Government Finances
All state and local governmentsa
All states and 13,000 local governments
Local Government School System Finance Survey
Public school systems providing elementary or secondary education
All systems in census years; 15,000 in 2004
State Government Tax Collections Survey
All states All states
Annual Public Employment Survey
All state and local governmentsa
All states and 11,000 local governments
State and local Government Public Employee Retirement System Survey
All state and local government public employee retirement systemsb
All state systems and more than 1,000 local systems
Quarterly Surveys
Quarterly Tax Survey All state and local governments with tax collection authority; local governments with large non-property tax collections
50 states, about 600 counties, and all local governments within those counties with local property tax collection authority; over 100 local governments with significant non-property tax collectionsc
Quarterly Public Employee Retirement Systems Survey
100 largest public employee retirement systemsd
100
aThis includes counties, municipalities, townships, special districts, and school districts, which collectively currently number about 87,000. bThe universe of public employee retirement systems is about 2,600; the list is updated regularly. cThese local governments account for about 65 percent of all local nonproperty tax collections. dThe 100 largest systems account for about 85 percent of all national activity.
�� STATE AND LOCAL GOVERNMENT STATISTICS AT A CROSSROADS
they were 20 to 30 years ago due to reductions in sample allotments to smaller units over time—a possible source of error. These cutbacks have raised questions for users as to the relevance and accuracy of the survey estimates and whether the decrease in sample sizes has limited the analytical capabilities of the data.
The Governments Division can provide users with better information for estimating the statistical significance of changes over time in the data given changing designs and sample sizes. If the division were to provide the standard errors and confidence intervals for estimates of change (for example, estimates of year-to-year increases or decreases in revenues and expenditures by type of governments), this information would provide guid-ance to data users on interpreting the significance of the changes.
Recommendation 4-1: With respect to future modifications of its meth-odologies, the Governments Division should conduct research to deter-mine the effects of any redesigns of its surveys or changes in sample sizes on the accuracy of the data, especially the accuracy of measures of change. The division should provide information to users, including standard errors and confidence intervals, to help them assess the effects of redesigns and changes in sample sizes on the accuracy and usefulness of time series.
Most of the samples for the Governments Division surveys are drawn using standard probability methods in which each governmental unit’s probability of inclusion can be calculated, estimates can be produced along with estimates of the sampling error, and inferences can be made about the population. The Annual State and Local Government Public Employee Re-tirement System Survey was converted to a probability basis in 2004. How-ever, nonprobability methods continue to be used to select the sample for the Quarterly Public Employee Retirement System Survey and a portion of the Quarterly Tax Survey. Converting these remaining two nonprobability samples to a probability basis, a priority goal for the Governments Divi-sion, should lead to improved estimates of national aggregates and would allow the estimation of variances, enabling the Governments Division to conform to Census Bureau statistical standards in this area.
DATA COLLECTION METHODS
States are sovereign governments, and local governments are their subdivisions (Keffer, 2006, p. 8). As a result, in contrast to other Census Bureau economic statistics data collections, there is no provision for man-datory reporting by state and local governments. In dealing with state and local governments, the Census Bureau does not have an opportunity to im-
DATA QUALITY AND STATISTICAL METHODS ��
pose accounting systems and standards across the board that would work to ensure that all data at all levels are defined, collected, and aggregated in the same way, although voluntary mechanisms, such as the Government Accounting Standards Board, are playing an important and growing role in standardization (discussed in Chapter 6).
Due to the sovereignty of the states and the traditions of data collec-tion devised by the Governments Division and the states over the years, reporting arrangements are unusually complex. As an example, the division now operates three separate collection systems for gathering the periodic Census of Governments and ongoing survey data: a division-managed mail-out/mail-back questionnaire for state and local governmental units in 22 states and the District of Columbia; direct collection from 48 large units, which is also managed by the division; and a central collection program, managed by the states, under which data on the state’s localities are col-lected and transmitted to the division by 28 states. To complicate matters further, in some cases the data are provided on paper; in other cases, the data are provided in standardized electronic formats; and in still other cases, the data are provided in nonstandardized electronic formats that are negotiated between the reporters and the Governments Division. It is clear that the division has leaned over backward to work with the differ-ing data processing systems maintained by the states and to accommodate the desires of many state governments to serve as intermediaries for their subordinate units of government in dealings with Washington. In so doing, the data collection system has built in layers of complexity that can affect the accuracy, timeliness, and relevance of the data.
Central collection states constitute both a source of strength and a potential weakness in the system. The Governments Division cultivates long-standing arrangements whereby local governments report to state governments, which in turn report to the division. These arrangements include a rich variety of procedures. Data collection can be by electronic filing, Internet response, or mail response.2
These pass-through arrangements ascribe an appropriate role to inter-vening sovereign units of government; they can reduce the burden on the Census Bureau, which would otherwise have to contact and follow up on many more governmental units; and they ensure that another level of qual-ity control can be brought to bear. Central collection states have far and away the best record of obtaining and forwarding complete responses for
2 There may be additional opportunities for consolidating reporting along the lines of the central collection procedures. For example, elementary and secondary education finance data are collected centrally in most states but in several, collection is by the state department of education. This suggests that state departments of education could serve as collection inter-mediaries and add value to the data.

�� STATE AND LOCAL GOVERNMENT STATISTICS AT A CROSSROADS
all units in their areas. Nonresponse for central collection states is virtually nonexistent, in contrast to states in which the Governments Division col-lects the data by mail-out/mail-back means. Table 4-2 shows the response rates for noncentral collection states for the 2004 Annual Finance Survey: the median rate for general governments (counties, cities, etc.) is 79 percent, while the median rate for special districts is only 62 percent.
Nonetheless, the arrangements layer the reporting in ways that com-plicate the ability of the Governments Division to change content, add new content, and edit the data. In central collection states, the Governments Division has limited ability to provide some of the kinds of quality control at the data source that, for other surveys, would be obtained in random
TABLE 4-2 Response Rates for Noncentral Collection States by General Purpose Governments and Special Districts, 2004 Annual Finance Survey
State General Purpose (%) Special Districts (%)
Alabama 68 62Arkansas 93 55Colorado 89 64Connecticut 73 52Delaware 76 57District of Columbia n/a 100Florida 93 60Hawaii 100 33Idaho 76 54Louisiana 100 90Maine 79 66Mississippi 61 53New Jersey 90 71New Mexico 61 42Ohio 89 91Oregon 86 79Rhode Island 79 51South Dakota 67 61Tennessee 83 72Texas 85 67Vermont 54 45Virginia 79 76West Virginia 69 62
Median 79 62
NOTE: The response rates are unweighted usable responses. In 2004, the national response rate was 88 percent. This list includes only states that do not collect data centrally and trans-mit a consolidated report to the Census Bureau. Omits elementary and secondary education finance data.SOURCE: Governments Division, U.S. Census Bureau.
DATA QUALITY AND STATISTICAL METHODS ��
reinterviews and other methods for understanding and controlling data quality. Finally, the Governments Division is at the mercy of the timing of the collection, summation, and verification activities of the state govern-ments. This is one reason for the delay in the publication of estimates from the surveys.
The Governments Division has not conducted a rigorous study of the impact on data quality of state central collection for the Annual Finance Survey. Division staff offered several observations to the panel on the basis of anecdotal and historical information:
• Local knowledge. State central collection provides a source of local knowledge and expertise to the Governments Division staff as they discuss data issues with the state agency contacts.
• State data review. State agencies often review the data for complete-ness and accuracy before providing the information to the Govern-ments Division.
• Greater detail. The detail requested by the states from their local governments normally far surpasses the detail needed for the Gov-ernments Division surveys. When states edit the data from local jurisdictions, they have access to more detailed categories than those established by the division. For example, if a state maintains 10 categories for reporting property taxes, editing is likely to take place among the 10 categories, whereas the Governments Division collects and edits only a single property tax total.
• Translation of categories. States provide a service by translating Governments Division categories into local accounting conventions called for by state and local laws. As more and more states and localities move to standardized accounting conventions, such as those in the Government Accounting Standards Board’s Statement 34 (see Chapter 6), the need for this service may diminish.
• Completeness. The unit and item response rates for central collec-tion states are exceptionally high—often in excess of 95 percent—reducing or eliminating the need for nonresponse imputation.
Although probably indicative of a high level of accuracy in the data from central collection states, the above observations are not a substitute for a rigorous evaluation that could help understand the implications of central collection and help the Census Bureau determine the efficacy of this collection methodology. Such an evaluation would need to take into account other dimensions of quality, such as the effects on timeliness of central collection compared with other collection modes and the ability to release preliminary estimates.

�� STATE AND LOCAL GOVERNMENT STATISTICS AT A CROSSROADS
Recommendation 4-2: The Governments Division should evaluate the data received from states that have central collection to ensure that high response rates are associated with high quality of the data. The divi-sion should rigorously assess the costs and benefits of central collection compared with other collection modes.
NONRESPONSE
In seeking to achieve high response rates, the Governments Division must confront two challenges. First, as discussed above, participation in the Census of Governments and the division’s annual and quarterly surveys is voluntary rather than mandatory. The voluntary aspect of the government surveys almost certainly contributes to unit nonresponse and may increase item nonresponse. Second, the data collected in the government surveys are not confidential, and, depending on the survey, many of the respond-ing governments are identified individually in publications and data files. The awareness that an entity’s responses will be subject to public scrutiny could dampen enthusiasm for responding, and lower response rates. The public and the media have a consummate interest in tax loads, payrolls, and other measures of the effectiveness of state and local governments, but those governments may not welcome such scrutiny.
Response Rates
Unit response rates vary across the government surveys and between census and noncensus years. While a few surveys achieve high response rates by any standard, nonresponse is generally higher among the Govern-ments Division surveys and especially the Census of Governments than among the other major economic surveys. For the Annual Finance Survey, the response rates in recent years have ranged between 87 and 90 percent in noncensus years, but the rate fell to 77 percent during the last census year, 2002.
Because governments vary in population size across orders of mag-nitude from a few hundred to millions of people and in annual revenues and expenditures from thousands to billions of dollars, the implications of a given response rate depend on how the likelihood of response varies by importance of the unit in the final estimate of the variable of interest. While the Governments Division regularly publishes unit response rates to its surveys, these typically include only unweighted rates. An exception is the 2005 Annual Survey of Public Employee Retirement Systems, for which the unweighted response rate among eligible governments was 92.5 percent, but the weighted response rate, based on the value of holdings and invest-
DATA QUALITY AND STATISTICAL METHODS ��
ments, was 99.5 percent.3 The difference in rates indicates that govern-ments with larger retirement systems were more likely to respond. If this is true generally, then the potential impact of unit nonresponse on estimated aggregates is not as great as the observed nonresponse rates might suggest. Clearly, it is important to see both types of rates.
Understanding of response is also affected by the use of third-party data to substitute for nonresponse. Sometimes, data that state and local governments have submitted in response to other surveys are used by the Governments Division to substitute when units of government fail to re-spond to the division’s surveys.
This situation raises an issue about the calculation of unit response rates. If a government fails to respond to one of the division’s surveys, but the same data are available from another source, should the government be counted as not responding or responding? The Governments Division will have to make a decision about the handling of such cases as it works to improve its documentation of unit response rates. In the panel’s view, the government in question is in fact a nonrespondent to the division’s survey, regardless of the quality of the substituted data. A response rate that treats this situation as nonresponse is useful for tracking response trends and assessing the cooperation of respondents. At the same time, there is value in calculating a second statistic that measures the end result: a completed survey. The panel contends that both types of response rates should be developed and made available.
While the Governments Division routinely publishes unit response rates, it has not historically calculated item nonresponse rates, except for the portion that is attributable to unit nonresponse and which is not ordi-narily counted as part of item nonresponse. In part, this practice reflects the ambiguous nature of nonresponse in some cases. For example, some respondents refer the Governments Division to their websites rather than reporting certain subsets of items. Is this nonresponse, or is the respondent providing information with which the division can extract a response that better fits what it is requesting?
The way in which the Census Bureau approaches the issue of item nonresponse plays a role here. Item nonresponse appears to be addressed only by analysts in the Governments Division as part of their editing func-tion. It has not been taken on as a quality issue by the statistical staff in another division, the Economic Statistical Methods and Programming Division (ESMPD), who have been assigned responsibilities with regard to understanding the nature of and adjusting for unit nonresponse. One consequence of this approach is that item nonresponse rates have not been calculated, and little is known about the character and effect of item non-
3 Available: http://www.census.gov/govs/retire05quality.html.
�0 STATE AND LOCAL GOVERNMENT STATISTICS AT A CROSSROADS
response for the state and local government surveys. The limited data that are available indicate that item nonresponse can be quite substantial for some of the data items and for some levels of government.
Conclusion 4-2: The documentation of nonresponse, particularly item nonresponse, in Governments Division surveys is inadequate to inform users or to help plan effective means to increase response and improve accuracy of the data.
Recommendation 4-3: The Governments Division should provide more complete documentation of unit and especially item nonresponse for its surveys of state and local governments.
The current practice in most government agencies is to publish unit response rates that are weighted by a measure of size, such as total expen-ditures, in addition to unweighted rates. The panel has suggested in this sec-tion that the Governments Division should also calculate two unit response rates as follows: (1) a rate that treats unit nonresponse by a governmental unit as such, even if similar data are substituted from another source and (2) a rate that treats the substitution of comparable third-party data as a response. The first rate tracks respondent cooperation; the second is more appropriate for assessing the accuracy of the data.
Barriers to Response
It is possible that some item nonresponse may be due to difficulties by governments in understanding the questions, in translating the question-naire into local data definitions, or in completing the questionnaire in the time allotted. Another source, not only of item nonresponse, but also of misreporting could be differences in accounting systems among govern-ments and mismatches of information that are recorded by governments with the information sought by the Governments Division. Turnover among the employees charged with completing the forms or the officials who set priorities may play a role as well. Other contributing factors to measure-ment error and item nonresponse could be differences in the timing and treatment of investment in schools and other major capital investments and contracting out of accounting and financial management functions. These kinds of issues have been identified with regard to collecting data from busi-nesses in other Committee on National Statistics reports, such as the report on the National Science Foundation’s surveys of research and development expenditures (National Research Council, 2005). One of the research and development expenditure surveys (the industry survey) is conducted for NSF by the Census Bureau. Compounding the difficulty of responding to
DATA QUALITY AND STATISTICAL METHODS ��
the Governments Division surveys is the extensive detail that is collected. For example, the Annual Finance Survey collects over 155 variables in measuring financial activity at the various governmental levels.
The challenges for data collection from governments are important to consider. A question is whether a record-keeping practices survey involv-ing an onsite review of a respondent’s accounting practices and available records would be useful to identify ways in which to tailor information requests to governmental unit record-keeping systems in order to elicit more complete and accurate responses. In addition, at the panel’s June 2006 workshop, it was suggested that some item nonresponse may be due to the one-size-fits-all approach of the surveys when, in fact, data items usually available for large governments may not be available for smaller govern-ments. It may be that the data are not collectable from small governments. In the past, the Governments Division has used shortened forms designed for smaller governments in recognition of these difficulties. These possible barriers to response are a topic that would benefit from further research.
Recommendation 4-4: The Governments Division should conduct re-search on barriers to response to its Census of Governments and annual and quarterly surveys, such as differences in accounting systems among governments and with the definitions used by the division. It should use the results to develop strategies to improve response.
Nonresponse Bias Analysis
The Governments Division has done little research to understand the errors and bias caused by unit nonresponse in its surveys. The Office of Management and Budget standards require agencies that have relatively high nonresponse to conduct nonresponse bias analyses, and other statis-tical agencies, such as the National Center for Education Statistics, have conducted nonresponse analysis with some success. The Governments Divi-sion, however, has not systematically examined the extent of bias that may be caused by unit or item nonresponse, whether nonresponders are similar to responders, and whether adjustments can be made using statistical or other techniques to correct for the biases. The availability of other sources of data for many state and local governments should make it easier for the division to study nonresponse bias than is often the case.
Recommendation 4-5: The Governments Division should review the procedures used by other agencies that have conducted nonresponse analysis to determine their applicability to the state and local govern-ment statistics programs and should conduct experimental studies of nonresponse bias.
�� STATE AND LOCAL GOVERNMENT STATISTICS AT A CROSSROADS
Compensating for Nonresponse
Across surveys of many types, the most commonly used methods of adjusting for unit nonresponse are based on weighting. These procedures involve a reallocation of the weights of nonresponding units to responding units. For item nonresponse, in contrast, methods involving weighting are rare. Instead, imputation of the missing fields is the preferred approach. Neither of these standard practices is followed in compensating for nonre-sponse to the major Governments Division surveys. The form of imputation used for item nonresponse in the Quarterly Tax Survey—namely, carrying forward previously reported values—generates a bias in that it dampens change in the data series.
Imputation for Unit Nonresponse
The design of most of the Governments Division surveys precludes weighting as a nonresponse adjustment method for a large number of sampled units. All of the states and many of the largest local governments are selected into the Governments Division samples with certainty. They represent themselves in the sample. Furthermore, the individual data from these self-representing units are often published, and the respondents are identified. Thus, the missing units must appear in the final database, and the data that are published must be credible.
Most of the units that are nonrespondents to a given survey have responded to previous surveys in that series or, as mentioned above, have provided the same types of data to other surveys, which are also pub-licly available. The availability of earlier or third-party data has fostered methods of imputation, which have been applied to self-representing and nonself-representing units alike.
The ESMPD is responsible for unit nonresponse imputations, which it carries out on a file provided by the Governments Division after that division’s analysts have completed all editing for item nonresponse. While the exact procedures vary across the surveys, most imputations use growth rates to extrapolate from values that were reported or imputed for the prior year. Growth rates are calculated for related groups of items from reported (not imputed) values between the prior year and the current year for units within an imputation cell. Typically, the median growth rate for a group of units is then applied to the prior-year value for each missing unit. This process is repeated for all sets of items. For units that were not in existence in the prior year, a different method is required. For these units, typically, only their population size, state, and type of government are known. To impute their missing data, a donor is chosen at random from the same imputation cell (typically using a hot-deck method), and a per capita value
DATA QUALITY AND STATISTICAL METHODS ��
for each item is taken from the donor and applied to the missing unit’s population size.
The unit nonresponse imputation methods are continuously evolving at the Census Bureau, and it is expected that further refinements are in store for the imputation procedures. In researching possible improvements in methodology, ESMPD could benefit by considering methods used in other agencies to impute missing units. For example, facing a similar problem, the National Center for Education Statistics imputes enrollment, finance, graduation rate, and student financial aid data for nonresponding institu-tions in the Integrated Postsecondary Education Data System (IPEDS).
Editing for Item Nonresponse
Item nonresponse is handled by analysts in the Governments Divi-sion. Missing items are filled in by call-backs to respondents and searches through other data sources. For example, debt is a commonly missing item in the Annual Finance Survey, but there are external sources of data on debt at all levels of government. Imputation generally is not used to com-pensate for item nonresponse, the Quarterly Tax Survey being a notable exception, in which missing items often are filled in with reported data for earlier quarters.
An intensive editing process is used to correct items for apparent misre-porting. After the Governments Division has completed editing, the edited file is transmitted to the ESMPD for imputation of missing units. The file contains no units with partial data, as all missing items are filled in before the file is sent. It would be very useful if both the Governments Division and ESMPD would report the amount of data that are edited and imputed, both unweighted and weighted by dollars.
Research on Nonresponse Adjustment Procedures
The currently used imputation methods for unit nonresponse may be the most accurate way to deal with unit nonresponse in the government surveys, but they tend to be very labor intensive, and staff resources in the ESMPD are scarce. If statistically based imputation were found to be as effective in correcting for unit nonresponse among nonself-representing units, this could free up resources to pursue quality improvements in other areas.
Likewise, by all accounts, the currently used editing procedures for item nonresponse produce substantial added value, but too little is known about how these edits affect overall data quality. This has not been systematically studied, even though internal memoranda from ESMPD have repeatedly recommended that the effects of editing be evaluated. Moreover, the edit-
�� STATE AND LOCAL GOVERNMENT STATISTICS AT A CROSSROADS
ing procedures are very resource-intensive. Conducting research to identify ways to reduce the time that Governments Division analysts spend on edit-ing without adversely affecting data quality could give them more time for analysis of the data, which could lead them to identify potential quality improvements elsewhere in the survey process.
Research in this area should consider the effects of different procedures for nonresponse adjustment on microanalytical uses of the data in addi-tion to the effects on uses of aggregate estimates. For example, the use of weighting to compensate for unit nonresponse could produce reasonably accurate estimates of aggregates at reduced cost, but it would result in less useful estimates for analysis of individual governments than imputation using third-party data or growth rates estimated from prior responses. The Census Bureau publishes estimates for individual governments, so, regard-less of the method used, published estimates should indicate the source of the data as survey response, third-party response, imputation, or editing by the use of growth rates. The information on the source of the data should be included in the metadata that should accompany the electronically pub-lished data (as discussed in Chapter 5).
Recommendation 4-6: The Governments and Economic Statistical Methods and Programming Divisions (ESMPD) should review their programs for editing and imputation of data to evaluate the costs and benefits compared with other methods. The review should investigate:
• the potential limitations of using prior-year data with an assumed growth rate for editing and imputing values for nonresponding governments and
• the merits of weighting as an alternative to imputation to compen-sate for unit nonresponse among nonself-representing localities.
ESTIMATION
Estimates for the annual and quarterly surveys are produced for a va-riety of domains—state totals and subtotals of local governments as well as national totals, depending on the survey.4 Two issues for estimation are the effectiveness of regression adjustments of direct sample estimates and providing information to calculate the precision of estimates of change within and across sample design periods.
4 A domain may also refer to a particular type of government function rather than all func-tions combined.
DATA QUALITY AND STATISTICAL METHODS ��
Regression Adjustments
To improve the precision of domains for a number of the surveys, the ESMPD applies a regression adjustment to the direct sample estimate. This is called the “simple unbiased estimate.” The regression adjustment is based on the relationship between the last Census of Governments estimate, using all of the units in a domain, and an alternative census estimate using census data for just those units that are included in the current sample. When the number of sample units in a domain is small (generally fewer than 20), the regression estimate is not used because the regression coefficients are too unstable. The estimates for these domains are the direct sample estimates, which are unbiased but less precise than they would be if a suitable regres-sion adjustment could be developed.
It is ironic that the domains for which the regression adjustment is not applied are those in which the direct sample estimates are the least precise. A research question that the Governments Division should explore is whether suitable regression coefficients could be developed for combina-tions of similar domains that would circumvent the sample size limitation. While the domains that are combined may not have identical “true” regres-sion coefficients, the bias that is introduced by combining them may be outweighed by the reduction in variance achieved with an increased sample size, yielding an overall reduction in mean squared error. This is the prin-ciple behind methods of “borrowing strength” that have gained popularity among statisticians in recent years (National Research Council, 2000). An alternative and perhaps more effective approach to borrowing strength in this situation would involve the application of model-based methods, which would allow the regression coefficients for small areas to vary but would derive them from a model estimated over the full sample.
The regression estimator encounters difficulties when there has been a break in the data series, such as recently happened when the Annual Fi-nance Survey was redesigned in 2005. The regression methodology links to prior-year or prior census data in computing the regressions. When there is a break in series, the ESMPD has selected a crosswalk method to link the prior results with the new data to determine if the regression estimator could be used for any of the new variables (Hogue, 2005b, p. 1)
Recommendation 4-7: The Governments Division and the Economic Statistical Methods and Programming Division (ESMPD) should eval-uate the effectiveness of a model-based approach or other method of borrowing strength in yielding improved estimates for small do-mains from state and local government surveys. Overall, the appli-cation of regression-based adjustments to direct sample estimates should be reviewed to determine which adjustments produce the most improvement.
�� STATE AND LOCAL GOVERNMENT STATISTICS AT A CROSSROADS
Computing Precision of Estimates of Change
After a redesign, each annual and quarterly survey sample includes the same sample units—adjusted by births, deaths, and mergers—for a period of 5 years. This design feature greatly increases the precision of estimates of change calculated for any combination of years within the 5-year period compared with a design that drew a completely new sample every year, but users may not recognize or be able to take advantage of this feature. By the same token, estimates of change that cross different sample designs will be less precise than estimates of change covering years in the same design.
Recommendation 4-8: The Governments Division should provide its users with the information needed to correctly calculate the precision of estimates of change between specific pairs of years from its surveys, including years that fall within a 5-year design period and years that cross periods.
DATA PROCESSING
The errors associated with data processing can be generated in any of a number of processing steps, and they range in type from simple record-ing errors during data entry to complex errors arising from misspecifica-tion of an edit or imputation. The solution to these errors is influenced by survey planning, resources, constraints, and technology (Federal Commit-tee on Statistical Methodology, 2001, p. 7-1). Such errors are linked to administrative and management processes, and they can be mitigated by the use of process control techniques and continuous quality improvement (Morganstein and Marker, 1997, pp. 475–500).
Possible improvements may occur as the Governments Division con-verts its surveys to the Standard Economic Processing System (StEPS), as part of an overall standardization of processing systems in the Economics Directorate. The conversion is scheduled to be completed in 2011. StEPS is a generalized processing system that is now used by other economic surveys at the Census Bureau. It has standard data set structures and modules that perform administrative functions, post-collection processes, and support for data collection technologies (Ahmed and Tasky, 1999). StEPS has the ad-vantage of standardizing processes and enforcing a discipline on the various survey operations to develop common approaches to instituting definitional and conceptual rigor into their operations.
The conversion to StEPS will require changes in the way data are col-lected, received, and processed, and it remains to be seen how successfully StEPS can facilitate electronic data collection from state and local govern-ments and how well it can handle the imputation and regression estimation
DATA QUALITY AND STATISTICAL METHODS ��
procedures currently employed by the ESMPD. Experience in previous installations suggests that StEPS is capable of handling complex estimation procedures, but these procedures must be programmed and require special output for analysts to confirm that they have worked correctly.
REvISION POLICIES
Because estimation is improved with the benefit of hindsight through the collection of additional data, the Governments Division revises its data series when new data are collected. With respect to all annual and quarterly series (except for the Quarterly Tax Survey), the revision policy is to adjust two survey cycles prior to the survey that is currently being completed. This policy means, for example, that when the division produces the fiscal year (FY) 2006 Annual Finance Survey data, it would revise the comparable FY 2005 and FY 2004 survey data. Similarly, for an employment survey, the division would revise the March 2005 and March 2004 data when the March 2006 series is released.
This two-cycle revision policy drives a fairly complex revision process. For example, the finance survey is a series of surveys, each building on an-other, so when the Governments Division changes one or more elements of a component survey, the change could affect a large number of statistical calculations and measures from that survey and related surveys, as well as the ratio estimators and the coefficients of variation. This possibility neces-sitates a staff-intensive process of review and a redissemination of survey results.
The revision process is even more complex when the Governments Division obtains improved data for, say, a special district in the form of an audited financial statement to replace data that were originally imputed. Depending on the extent of the difference between the imputed and actual data, the change might require recalculating all the imputations for that time period because the scarcity of special district data in specific imputa-tion cells means that the original imputations were developed using regional or national groupings.
Revisions provide an opportunity for the Governments Division to estimate the levels of such key sources of nonsampling error as nonresponse and misreporting. This information can be extremely important for users to understand the importance of new releases in historical context.
As an example, Figure 4-1 shows revisions to 12 quarters of the Quar-terly Tax Survey. Revisions can typically be expected to be anywhere from a downward 1.2 percent to an upward 5.8 percent, with an average upward change of 2.3 percent (using control limits of 95 percent). An average size of revision of this magnitude would suggest that users should be cautious in interpreting quarter-to-quarter changes on a current basis.
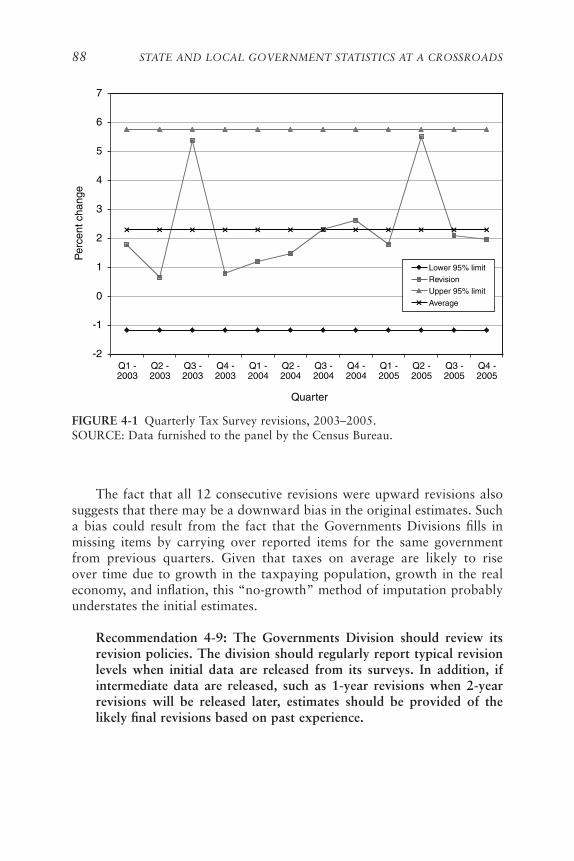
�� STATE AND LOCAL GOVERNMENT STATISTICS AT A CROSSROADS
The fact that all 12 consecutive revisions were upward revisions also suggests that there may be a downward bias in the original estimates. Such a bias could result from the fact that the Governments Divisions fills in missing items by carrying over reported items for the same government from previous quarters. Given that taxes on average are likely to rise over time due to growth in the taxpaying population, growth in the real economy, and inflation, this “no-growth” method of imputation probably understates the initial estimates.
Recommendation 4-9: The Governments Division should review its revision policies. The division should regularly report typical revision levels when initial data are released from its surveys. In addition, if intermediate data are released, such as 1-year revisions when 2-year revisions will be released later, estimates should be provided of the likely final revisions based on past experience.
-2
-1
0
1
2
3
4
5
6
7
Q1 -2003
Q2 -2003
Q3 -2003
Q4 -2003
Q1 -2004
Q2 -2004
Q3 -2004
Q4 -2004
Q1 -2005
Q2 -2005
Q3 -2005
Q4 -2005
Quarter
Per
cent
cha
nge
Lower 95% limit
Revision
Upper 95% limit
Average
4-1
FIGURE 4-1 Quarterly Tax Survey revisions, 2003–2005.SOURCE: Data furnished to the panel by the Census Bureau.
DATA QUALITY AND STATISTICAL METHODS ��
COGNITIvE TESTING OF QUESTIONNAIRES
Good questions can be understood and answered by respondents. They do not adversely affect cooperation (U.S. Census Bureau, 2006c, p. 2). In order to determine if questions are good, there are a number of prefield and field techniques that can be employed to identify if respondents have difficulty with regard to question content, order and context effects, skip instructions, and formatting. These techniques generally include respondent focus groups, exploratory and feasibility site visits, interviews that focus on the cognitive processes that respondents use to answer surveys (cognitive interviews), techniques for evaluating the usability of the questionnaires (usability techniques), expert reviews, respondent debriefings, and split-sample tests. Postfield evaluation methods include analysis of nonresponse rates, imputation rates, edit failures, and response distributions (U.S. Cen-sus Bureau, 2006d, p. 2).
The Governments Division has not often employed techniques for determining if their questions are good. The redesign of the 2005 version of the Annual Finance Survey is the only example in the Governments Di-vision domain of the use of modern prefield cognitive design techniques. The cognitive testing was a cooperative effort between the Governments Division experts and the survey design staff of the ESMPD. The analysts examined the content and determined detail that could be eliminated, and the questionnaire design team conducted cognitive interviews.
The ESMPD hailed this effort as a great success, and the Governments Division has plans to use cognitive testing for other surveys.5 However, in the implementation of the cognitive redesign of the 2005 survey, the Gov-ernments Division did not conduct a bridge sample to introduce the new questions. Consequently, it is difficult to differentiate actual change between 2004 and 2005 in the phenomena being measured (revenues, expenditures) from change due to the revision of the survey instrument.
In addition to assisting analysts in their understanding of the meaning of the information that is being provided by respondents, cognitive testing can help identify areas that may lead to errors in reporting. Information about the knowledge, experience, and record-keeping practices of the re-spondents would also be helpful in providing training and the kind of in-tensive interaction that now takes place between many of the respondents and Governments Division staff experts.
Although the success of the initial cognitive testing project was not measured, this use of sophisticated design and testing techniques is com-mended. However, the real impact of the pioneering cognitive testing of the
5 Presentation of Carma Hogue to the panel’s data-gathering workshop, June 2006.

�0 STATE AND LOCAL GOVERNMENT STATISTICS AT A CROSSROADS
Annual Finance Survey can be ascertained only through a careful analysis using some of the methods described above.
Recommendation 4-10: The Governments Division should carefully document and assess the results of the cognitive redesign of the 2005 Annual Finance Survey to determine the cost-benefit trade-off of imple-menting a policy calling for conducting a similar pretesting process for other questionnaires. In future redesigns, major revisions in survey instruments should be implemented using a bridge sample or other technique to isolate changes in the survey instrument from changes in the economic phenomena that are being measured.
REDESIGN OF THE QUARTERLY TAX SURvEY
The upcoming redesign of the Quarterly Tax Survey, officially known as the Quarterly Summary of State and Local Government Tax Revenue, offers a rare opportunity to make quality improvements in this survey and, at the same time, to test and develop improvements in other aspects of the survey that could contribute beneficially to other state and local govern-ment surveys (Hogue, 2005a). Accordingly, the upcoming redesign received some attention in the panel’s workshop.
The Quarterly Tax Survey now consists of three pieces: universal cover-age of state government taxes, a probability sample of county areas to ob-tain county property tax collections, and a nonprobability sample of local government nonproperty taxes. While the property tax sample is drawn at the county level, data must be collected in each county for all local areas with independent taxing authority. In recent years, the total number of respondents has been about nine times the number of counties sampled. The third component is based on the local governments that have the larg-est amounts of nonproperty tax collections; the sampled areas account for 65 percent of the nonproperty tax revenue collected by local areas. This nonprobability sample is updated on the basis of information from the last Census of Governments.
The Governments Division was twice forced to forgo the normal sam-ple selection updates for property tax collection under the Quarterly Tax Survey program because of limited resources. This means that in 2006, the division was still using a sample based on the 1992 Census of Governments. There is an opportunity to introduce a new sample design to coincide with the selection of a new sample in the near future.
An even more important change that the Census Bureau is considering is to convert the current nonprobability method used to select the sample for estimation of local nonproperty tax revenue to a probability methodol-ogy. One proposal would use the same sample of county areas to collect
DATA QUALITY AND STATISTICAL METHODS ��
both the property tax and nonproperty tax. There are both sample design and questionnaire design issues to be addressed in combining the two samples. Even if separate samples are maintained, substituting a probability sample for the current nonprobability sample would enable the Govern-ments Division to estimate total local tax revenue directly and more reliably than at present. Currently, the estimate of local nonproperty tax collections obtained from the nonprobability sample must be inflated to derive an es-timate of the total local revenue from this source, as no data are collected from areas accounting for about 35 percent of total local nonproperty tax revenue. Converting the nonprobability sample to a probability basis would also allow the estimation of variances for local nonproperty tax and total tax revenue, which has not been possible to date.
The Governments Division faces five other challenges regarding the new sample design:
1. Questionnaire redesign. As noted, the new sample could be de-signed to collect income and sales taxes from the same sample of county areas as the property tax sample. The forms would have to be redesigned to include sales, income, and property tax items and tailored to the respondent, since not all jurisdictions have all three types of taxes. This tailoring of the questionnaire to reflect local practices will present a challenge to survey designers, but it also constitutes a unique opportunity to consider further fine-tuning of data collection in this and other surveys so as to improve response rates and timeliness.
2. variance computation. The Governments Division has never cal-culated coefficients of variation for its estimates of local property taxes, nonproperty taxes, or total tax revenue. This is contrary to good statistical practice and violates Census Bureau standards, so a system must be designed to compute these coefficients in conjunc-tion with the sample redesign.
3. Adjustment for unit nonresponse. The current method of adjusting for unit nonresponse for state governments generally amounts, in effect, to applying the national growth rate for each item to the previously reported data for the state—assuming, in essence, that tax revenues and other amounts for the missing state would grow at the national rate. It is possible that this approach may result in acceptable estimates of national totals, serving users primarily in-terested in national data, but it clearly does not use all of the avail-able information and will not result in state-level estimates that are useful to those who care about state differences. For example, Western states tend to have faster growing populations and econo-mies than Northeastern states, so that, all else being equal, one
�� STATE AND LOCAL GOVERNMENT STATISTICS AT A CROSSROADS
would expect tax revenue in Western states to grow more quickly than in the Northeast, but the Governments Division adjustment method does not allow for this pattern. A method that takes into account regional differences might yield more accurate state-level estimates.
4. Imputation for item nonresponse. The current method of imputa-tion for item nonresponse in the Quarterly Tax Survey is to pull forward data for several years. The Governments Division recog-nizes that this is not statistically defensible and that the current method may be leading to underestimates of property taxes and other taxes, as noted earlier. A more reliable imputation procedure would reflect the growth of the variable being measured.
5. Editing. Editing now is done by three analysts. Automating and otherwise modernizing the editing procedures would assist in get-ting the data out in a more timely manner and in freeing the ana-lysts to actually analyze the data.
These challenges, in sum, suggest that a great deal of statistical methods research and development is needed to bring these Governments Division programs into compliance with Census Bureau standards and generally recognized good statistical practices. They will require a fairly significant investment of technical resources, the deployment of sophisticated statis-tical and survey methodology skills, and a commitment to conduct the necessary research and development on an ongoing basis. In view of the shortage of resources, it may be advisable for the Governments Division to start out by integrating the testing and development of new methods and procedures into the upcoming redesign of the Quarterly Tax Survey, to which it is already committed.
Recommendation 4-11: The Governments Division should use the re-design of the Quarterly Tax Survey to assess the quality of the sample frame, to develop a probability sample of local governments for non-property tax measurement, to streamline questionnaires, and to develop cost-effective variance estimation, editing, and imputation procedures that meet Census Bureau standards.
PLANNING FOR IMPROvEMENTS IN STATISTICAL METHODOLOGY
Taken as a whole, the panel’s recommendations in this chapter com-prise a tall order for the staff of the Governments Division and its sup-porting organizations in the Census Bureau, in particular, the ESMPD. The statistical methods underpinning federal government surveys require
DATA QUALITY AND STATISTICAL METHODS ��
continuous attention and the commitment of scarce human, technological, and financial resources. The panel has outlined some steps that can be taken in the short term to shore up the statistical infrastructure for the state and local governments program that are not excessively resource-intensive and that could well have an immediate payoff.
Any program of improvement begins with a plan. In this case, the strategic plan for the Governments Division can be enriched with time-phased activities to enhance statistical methods. Scheduled survey redesigns and recurring post–Census of Governments sample updating operations can be used as test beds for improving practices and procedures that can be widely applied across the various data collections. Outside advice and guidance can be obtained from advisory structures, such as the advisory group discussed in Chapter 6, and by regularly scheduling sessions with the American Statistical Association component of the Census Advisory Com-mittee of Professional Associations. A clear delineation of responsibility for statistical activities between the Governments Division and the supporting organizations, particularly for imputation and variance estimation func-tions, can be an early priority.
Finally, the payoff from a relatively small investment in professional staff training and development can be quite significant. While Governments Division staff participate in a wide variety of professional meetings, the ESMPD staff who provide statistical support to the Governments Division rarely have the opportunity to do so. Extending the opportunity to attend and actively participate in statistical conferences and workshops can pay exceptional dividends for maintaining the currency of methodological skills in the fast-changing world of survey methodology at a relatively low cost.
5
Dissemination and Analysis
The ultimate objective of the myriad tasks that the Census Bureau’s Governments Division undertakes in its state and local government statistics program is to provide useful and accurate data in a timely
and readily accessible format to data users. In this regard, the division receives mixed reviews. While its data are widely viewed as relevant and accurate, the long delays in dissemination of several of the data series re-duce their usefulness to the user community. Moreover, the knowledgeable Governments Division staff carries out very little data analysis, which could be helpful to users. The division has made great strides in improving elec-tronic access to the data, and much more in the way of enhancing access is on the drawing board. This chapter addresses the three areas of timeliness, website access, and in-house analysis for the state and local government data series.
TIMELINESS
All types of users with which the panel interacted—federal government agencies, nonprofit organizations representing state and local government interests, and academic researchers—said their greatest concern was the lack of timeliness of the data, and the panel agrees with this concern. The fact that information on state and local government finances is not available until the third annual revision to estimates of gross domestic product (GDP) that were initially released two years earlier is unacceptable, considering
��
DISSEMINATION AND ANALYSIS ��
the significant percentage of GDP that the state and local government sec-tor contributes.
It has been suggested that the voluntary nature of the state and local government surveys may contribute to the lack of timeliness. Other factors that may play a role in delaying data releases include the complexity of the information collected, some of which requires special gathering and tabu-lation; the difficulty of communicating with some of the small local and special governmental bodies that are asked to complete the questionnaires; data collection procedures, especially the joint Governments Division–state arrangements for central collection (see Chapter 4); and procedures to pro-cess the data once they are received.
Timeliness varies across the division’s surveys (see Table 5-1). For example, reports from the quarterly tax and retirement system surveys are fairly timely, but not so timely as quarterly reports from other divisions in the Economic Directorate, such as the Quarterly Financial Report (Manu-facturing) and the Quarterly Service Survey: the latter two reports come out 75 days after the end of the quarter, while the tax and retirement system survey reports come out 90 days and 120–150 days after the end of the quarter, respectively. The Governments Division has considered revising the structure of the quarterly tax survey to make it possible to release the data more quickly, in order to capture an “instant view” of what is happening to state and local government tax revenues.1 One approach would be to convert the current quarterly collection program into a monthly collection with less detail, taking into consideration the concern for timeliness as well as accuracy and completeness.
The annual state and local employment survey data are released about 12 to 13 months after the March reference date, which the Governments Division argues is a fairly reasonable time frame. A principal reason for the delay in getting the data processed and disseminated is the difficulty in obtaining responses to the survey—whether in paper or electronic for-mat—in a timely manner. The division has investigated ways to expedite the reporting of data. One interesting idea is to coordinate with major software vendors (e.g., Peoplesoft) to build the survey into the enterprise information systems that they install in state and local governments. This effort has not met with much success to date.
The survey with the greatest timeliness problem is the annual finance survey. The finance survey has several different data releases—for state and local public employee retirement systems, state finances, public elementary and secondary education finances, and state and local government finances. The state and local government finance survey, which typically is released by the Governments Division 21 months or more after the June ending
1 As stated by Henry Wulf during his presentation at the panel’s June 2006 workshop.
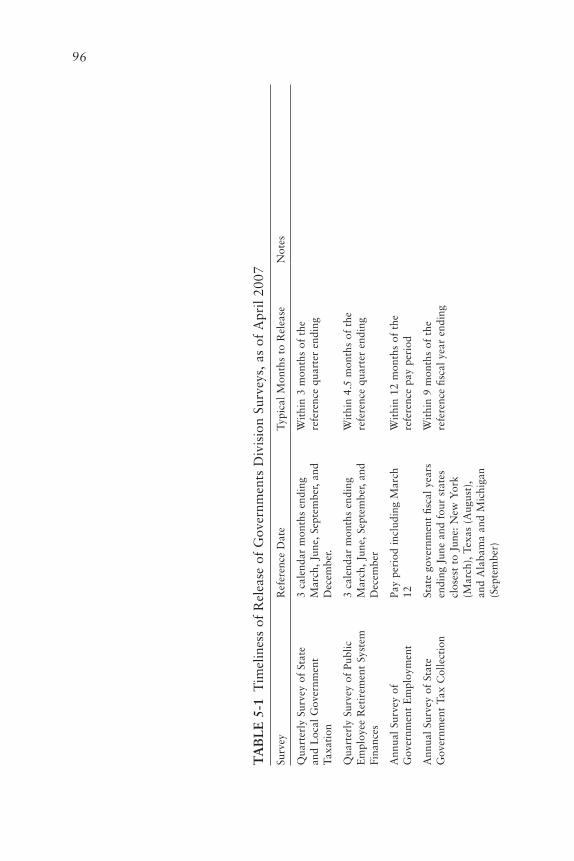
��
TA
BL
E 5
-1 T
imel
ines
s of
Rel
ease
of
Gov
ernm
ents
Div
isio
n Su
rvey
s, a
s of
Apr
il 20
07
Surv
eyR
efer
ence
Dat
eTy
pica
l M
onth
s to
Rel
ease
Not
es
Qua
rter
ly S
urve
y of
Sta
te
and
Loc
al G
over
nmen
t Ta
xati
on
3 ca
lend
ar m
onth
s en
ding
M
arch
, Ju
ne,
Sept
embe
r, an
d D
ecem
ber.
Wit
hin
3 m
onth
s of
the
re
fere
nce
quar
ter
endi
ng
Qua
rter
ly S
urve
y of
Pub
lic
Em
ploy
ee R
etir
emen
t Sy
stem
Fi
nanc
es
3 ca
lend
ar m
onth
s en
ding
M
arch
, Ju
ne,
Sept
embe
r, an
d D
ecem
ber
Wit
hin
4.5
mon
ths
of t
he
refe
renc
e qu
arte
r en
ding
Ann
ual
Surv
ey o
f G
over
nmen
t E
mpl
oym
ent
Pay
peri
od i
nclu
ding
Mar
ch
12W
ithi
n 12
mon
ths
of t
he
refe
renc
e pa
y pe
riod
Ann
ual
Surv
ey o
f St
ate
Gov
ernm
ent
Tax
Col
lect
ion
Stat
e go
vern
men
t fis
cal
year
s en
ding
Jun
e an
d fo
ur s
tate
s cl
oses
t to
Jun
e: N
ew Y
ork
(Mar
ch),
Tex
as (
Aug
ust)
, an
d A
laba
ma
and
Mic
higa
n (S
epte
mbe
r)
Wit
hin
9 m
onth
s of
the
re
fere
nce
fisca
l ye
ar e
ndin
g
Ann
ual
Surv
ey o
f Pu
blic
E
mpl
oyee
Ret
irem
ent
Syst
em
Fina
nces
Stat
e an
d lo
cal
gove
rnm
ent
fisca
l ye
ars
endi
ng b
etw
een
July
1 a
nd J
une
30 (
e.g.
, Ju
ly
1, 2
005,
to
June
30,
200
6).
Exc
epti
ons
incl
ude
som
e go
vern
men
ts o
utsi
de t
his
refe
renc
e pe
riod
(e.
g.,
Texa
s,
Ala
bam
a, a
nd M
ichi
gan
stat
e go
vern
men
ts),
whi
ch
are
incl
uded
wit
h th
e cl
oses
t re
fere
nce
peri
od
(e.g
., Se
ptem
ber
30,
2006
, M
ichi
gan
stat
e da
ta i
nclu
ded
wit
h Ju
ly 1
, 20
05,
to J
une
30,
2006
, go
vern
men
ts d
ata)
Wit
hin
15 m
onth
s of
the
re
fere
nce
fisca
l ye
ar e
ndin
gD
ata
coul
d sp
an n
earl
y 2
year
s.
For
exam
ple,
tot
als
for
fisca
l ye
ars
endi
ng b
etw
een
July
1,
2005
, to
Jun
e 30
, 20
06,
incl
ude,
at
the
extr
emes
, go
vern
men
ts w
ith
fisca
l pe
riod
s of
A
ugus
t 1,
200
4, t
o Ju
ly 3
0, 2
005,
an
d go
vern
men
ts w
ith
fisca
l pe
riod
s of
Jul
y 1,
200
5, t
o Ju
ne 3
0, 2
006.
In
eff
ect,
the
dat
a re
flect
eco
nom
ic
cond
itio
ns t
owar
d th
e la
tter
hal
f of
th
e re
fere
nce
peri
od,
beca
use
abou
t 40
per
cent
of
gove
rnm
ents
hav
e fis
cal
year
s th
at e
nd i
n D
ecem
ber
and
40
perc
ent
have
fisc
al y
ears
tha
t en
d in
Ju
ne.
Ann
ual
Surv
ey o
f St
ate
Gov
ernm
ent
Fina
nces
Sam
e as
Ann
ual
Surv
ey o
f St
ate
Gov
ernm
ent
Taxa
tion
W
ithi
n 18
mon
ths
of t
he
refe
renc
e fis
cal
year
end
ing
Dat
a co
uld
span
nea
rly
2 ye
ars
as
abov
e.
Ann
ual
Surv
ey o
f St
ate
and
Loc
al G
over
nmen
t Fi
nanc
esSa
me
as A
nnua
l Su
rvey
of
Publ
ic E
mpl
oyee
Ret
irem
ent
Syst
em F
inan
ces
Wit
hin
23 m
onth
s of
the
re
fere
nce
fisca
l ye
ar e
ndin
gD
ata
coul
d sp
an n
earl
y 2
year
s as
ab
ove.
SOU
RC
E:
U.S
. C
ensu
s B
urea
u, G
over
nmen
ts D
ivis
ion
staf
f.
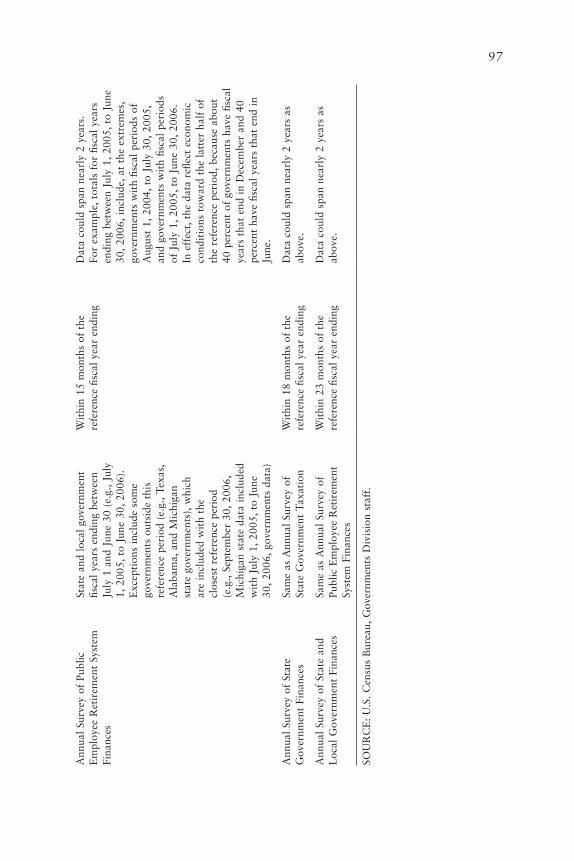
�� STATE AND LOCAL GOVERNMENT STATISTICS AT A CROSSROADS
period, is the slowest of the finance surveys. This lack of timeliness has a negative impact on the national accounts. In producing the national income and product accounts, the Bureau of Economic Analysis (BEA) prepares annual estimates based on the Census of Governments and the annual fi-nance survey. Because of the data lag, the data are fully applicable only for the third annual revision of GDP. In producing the second and first annual revisions, BEA uses other data that are available at the time of the produc-tion of the estimate and extrapolates from other components. The quarterly estimates are based on some quarterly data (compensation, construction, certain social benefits, and tax receipts) and are otherwise interpolated from annual estimates.
A complicating factor that exacerbates the timing problem is the varia-tion in fiscal years between states and localities. For example, the 2004 annual finance data were posted to the Governments Division website in August 2006, 26 months after the close of the typical state government fis-cal year ending June 2004. However, for many local governments, the time lag was longer. The 2004 annual finance survey includes fiscal years ending between July 2003 and June 2004, which means that the survey includes FY 2003 data for many local governments. For a local government with a calendar fiscal year, the data were released 32 months after the December 2003 fiscal year end. For a local government with a fiscal year ending in September 2003, the time lag was 35 months.2,3
The Governments Division has taken steps to speed the processing of the estimates once they are received in the Census Bureau. By late 2005, the division fully implemented E-Basic, a 4-year project to reengineer how the division compiles, edits, and adjusts finance data for all state governments, and began expanding it to the largest local governments. Among other ac-complishments, E-Basic developed a highly flexible computer application
2 Many users undoubtedly are not aware that the 2004 finance data actually are for the 2003 fiscal year for many local governments. As a result, they may not understand that the lag is as long as it is, and probably more important, they may believe they are analyzing different time periods than is the case. The Governments Division discloses the time periods covered in its documentation, although perhaps not as prominently as needed.
3 Audited financial statements and associated Comprehensive Annual Financial Reports (CAFRs)—standardized reports that are used by rating agencies and bond markets to deter-mine the solvency of the governmental unit—are based on detailed data that often overlap with the detailed data governments provide to the Governments Division in support of the annual finance survey. CAFRs usually are available sooner than Governments Division data, but not always dramatically so. While CAFRs often are expected or required to be released by state and local governments no later than 90 days after the close of a fiscal year, and many governments achieve this, even large governments sometimes take 9 months or more to release their CAFRs. Smaller local governments sometimes take much longer than this to release their CAFRs. Furthermore, the supporting details needed by the Governments Division are not always available in usable form until after CAFRs are released.

DISSEMINATION AND ANALYSIS ��
that can process the idiosyncratic and detailed record-keeping systems of different state governments, enabling division analysts to cease focusing on detailed transactions and instead concentrate on the overall accounting systems. This has meant that in analyzing expenditures for a typical state in a given year, an analyst would have to code only 400 new items instead of 30,000. E-Basic has reduced the completion time for processing individual state data by 75 percent, from approximately four weeks to one. The proj-ect team won a Census Bureau director’s innovation award for developing and implementing E-Basic. With this new system in place, the key obstacle to timeliness now appears to be the slowness of data availability from state and local governments.
E-Basic has speeded up data processing for the core of state govern-ment, but other elements of the process can delay processing and release of data. A government, as defined by the Governments Division, usually is much more than the core government that typical users think about. Large governments usually contain several or many component units with inde-pendent accounting and financial reporting systems, such as universities, transportation authorities, and other entities, and they are not included in the E-Basic system. Even when data from the core entity are received and processed quickly by the Governments Division, it can be many months or more before data for the component units are obtained and processed.
The Governments Division has several options under consideration to deal with the lags in availability of the finance survey data. The division has considered releasing data as they are processed, thus changing the process-ing system to release groups of 10 or 15 states. This approach would still delay the production of a final national total until data from all govern-ments were available or unless the national total could be provisionally estimated and released as a preliminary estimate. Another approach would be to make greater use of preliminary estimates, so that estimates for the nation and all states could be released more quickly, with some of the esti-mates consisting of provisional figures. Preliminary releases might provide opportunities for users to help the Governments Division find errors and anomalies in the data before the final data are disseminated. In addition to staggered releases of partial data and preliminary estimates, the division has considered increased use of unaudited data. Although the division cur-rently accepts unaudited data, state governments are reluctant to provide unaudited data because they do not want two sets of data released to the public.
To guide decisions on methods of releasing preliminary or partial data from the annual finance survey, the division will need to conduct research on the costs and benefits of alternative estimation and dissemination meth-ods. In the case of preliminary estimates, such research will require mod-eling with prior-year data to simulate the effects of preliminary estimates
�00 STATE AND LOCAL GOVERNMENT STATISTICS AT A CROSSROADS
developed using different estimation methods. As part of this work, the division should investigate the methods used by other statistical agencies that release preliminary or partial data in response to user needs and how those agencies inform users of the properties and appropriate use of pre-liminary and final estimates. A small representative national sample could also be considered.
Recommendation 5-1: The Governments Division should give high priority to a program of research on the benefits and costs of adopt-ing earlier release procedures for the annual finance survey and other surveys by such methods as releasing preliminary estimates or releasing estimates as they are compiled. The research should include evaluation of the ability of preliminary releases to replicate prior-year data and analysis of preliminary-to-final differences attained by using different estimation techniques.
GOvERNMENTS DIvISION WEBSITE
The Governments Division has made a major commitment to using the Internet as the primary means of disseminating its data to the public, but developing a useful website for users with different needs and levels of experience and expertise is a challenging task. To gain a general sense of useful strategies for addressing the Internet access needs of researchers who require detailed data, the panel heard from the Weldon Cooper Center for Public Services at the University of Virginia, which has worked on ways to make the data from various federal agencies available in easy-to-use formats on the Internet.4
Considerations in Facilitating Researcher Access
The Cooper Center notes that researchers who use federal data face the challenge that there is no standard way of storing or transferring data.Different agencies store data and metadata in different ways, making it dif-ficult for them to release data in standard ways that facilitate transferring the data into statistical programs for analysis purposes. (Metadata—the contextual background information that is necessary to interpret a data-set—inform users of who created the dataset, when it was created, how the underlying data were generated, the statistical assumptions built into the sample design and estimation for the data, and similar information.) The Census Bureau publishes data in portable document format (PDF), which
4 Discussion of the work of the Cooper Center is based on William Shobe’s presentation at the panel’s June 2006 workshop.
DISSEMINATION AND ANALYSIS �0�
makes it hard to transfer the data into statistical programs and to map to metadata sources.
In the view of the Cooper Center, agencies should avoid assuming that they know how their data will be used. There are researchers who may not know what data they want and need until they know what is available, which makes the ability to conduct creative searches of data and metadata important. Toward this end, the Governments Division should provide the widest array of data sources and focus on distribution rather than layout of its data. It is important for researchers to be able to extract the data they need as efficiently as possible, without language barriers between the database and their computer system or dependencies on one operating sys-tem. Automatic feeds, such as really simple syndication (RSS), a popular online technology that publishers use to distribute their content to other sites and services, could allow researchers to subscribe to periodic data and automatically update their models as soon as data are released. This type of arrangement would lower transaction costs for researchers.
Currently, the Governments Division data are generally found behind a “20-click labyrinth,” meaning that researchers must spend considerable time selecting the series, data items, and format they want each time the data are updated. The metadata are often not attached to the data, requir-ing researchers to copy and paste text from another webpage. Although Excel and comma delimited files are easier to manipulate than PDF files, they still require human intervention. A direct process that allows research-ers to download the data directly into their analytical software would not require human intervention.
Improving the Governments Division Website
The Governments Division has begun to address data dissemination in terms of website development as part of a broader Census Bureau ef-fort. The Census Bureau has established a Web Council with an executive guidance group, in order to facilitate making data more accessible in a consistent way across all programs. Part of the greater Census Bureau plan is to allow users to access the data from individual programs more easily without needing to understand the bureau’s organizational structure. The Census Bureau’s outreach in this area has been extensive—for example, it is working with and learning from the Australian government as it develops a national data network.
The Governments Division is one of the early programs going through the process of coordinated website development at the Census Bureau. Given its early start, the division has the opportunity to be a part of setting the standards in this area for the Census Bureau as a whole.
The division sees three groups of users who are asking for data from
�0� STATE AND LOCAL GOVERNMENT STATISTICS AT A CROSSROADS
the Internet—the sophisticates who know exactly what they need, the neophytes who are sophisticates in other fields but do not understand state and local governments, and the occasional users who have a general under-standing from having used the data before and need to ask questions and obtain specific information. The website development is striving to meet four criteria—simple, streamlined, easy, and accurate—to satisfy these three user groups. Metadata are to accompany all information.
The proposed redesign for the Governments Division Internet site is an adaptation of a Bureau of Justice Statistics Internet site (http://www.ojp.usdoj.gov/bjs/) that incorporates many features that users are requesting. For data access, the Governments Division has selected an extraction sys-tem to provide three dimensions easily—geographic (national, state areas, individual governments), temporal (the most recent available year or data for several years), and data detail (totals or components of aggregates). High-end users can download the detail. Medium- and low-end users will see a table shell with sufficient labeling and warnings that they can populate with data they can manipulate for analysis. The division is in the process of evaluating whether a table function or a build-a-data-set function will be more useful; it has not made decisions on what types of files will be downloadable (e.g., SPSS or SAS). The build-a-data-set capabilities have been employed to the benefit of researchers by both the Bureau of Labor Statistics and the Bureau of Economic Analysis, which now provide the capability of generating panel data on their websites.
As a government agency, the Governments Division faces several stric-tures on the development of its website. The division needs to follow Census Bureau rules concerning the statistical validity of data, and the downloading and table generating components of the system must provide metadata whenever appropriate. The division also must follow Census Bureau rules concerning the look and feel of the website. Finally, the site must be Section 508 compliant, that is, it must provide data accessibility for people with disabilities.
The website improvement project is being conducted in three phases:
• Phase I: In this first phase, the Governments Division continued to redesign the look, feel, usability, and navigation capabilities of its website. A major milestone was the introduction of metadata to accompany releases of data. The division also plans to introduce new user tools for data dissemination on the site, such as Build-a-Table and Build-a-Data Set. This phase is likely to be completed in 2007.
• Phase II: The Governments Division plans to introduce new search capabilities and new methods to enhance navigating through the website. The end of this phase will see the introduction of new
DISSEMINATION AND ANALYSIS �0�
user tools, such as graphing and data comparison capabilities. This phase is likely to be completed several months after Phase I is completed.
• Phase III: Work in the final phase will consist of putting complete production capabilities on the website that are designed to ease navigation, increase usability, and make metadata more accessible. Any remaining access tools will be added at the end of this phase, which is expected to be completed about six months after Phase II.
Recommendations
The panel fully supports the project to improve the Governments Divi-sion website so as to facilitate access to its data and associated metadata. Users now expect data to be available on the Internet, and a well-designed website can facilitate access, thereby building a user community and the support for an agency’s data programs.
The panel is pleased that attention is being paid to how to provide access on the Governments Division website, not only to files of detailed data for individual governments, but also to table-generating capabilities for users who need selected information in table format. The panel urges the division to think creatively about the design and linkage capabilities of the site. For example, the site should permit ready links to other Census Bureau websites that provide detailed population and private-sector busi-ness data for states, counties, cities, towns, townships, and school districts. The site should also include mapping capabilities, graphical analysis tools, and tabulation systems to facilitate comparisons over time and among governmental jurisdictions.
The panel understands the requirements for the Governments Division website to conform to Census Bureau standards and protocols. However, the panel thinks that some flexibility in website design for specific units, such as the Governments Division, should be encouraged to accommodate special features and data needs that are particular to the unit. In addition, the Governments Division website should be made easier to find from the Census Bureau’s home page and other pages than at present. At the mo-ment, the governments data are lumped in with economic and industry data, presumably because the Governments Division is located in the Eco-nomic Directorate. Yet the user communities for the data on state and local governments are different from those on private-sector businesses, so that every effort should be made to clarify the access paths to the state and local government data. As the Governments Division completes the shift away from paper-based dissemination to web-based access, care must be taken
�0� STATE AND LOCAL GOVERNMENT STATISTICS AT A CROSSROADS
to ensure that the data are complete and available.5 Finally, there must be provision for user feedback about the pluses and minuses of the website and for continuing improvements in the design and content of the site and in data access tools and links to other relevant data.
Recommendation 5-2: The Governments Division should continue to give high priority to the redesign and continuous improvement of its website. There should be clear access to the site from the Census Bureau’s home page and other access points. Desirable features of the site include:
• metadata (information about the data) that are complete and easy to access, including use of hot links to information on definitions and measures of error of the type that has traditionally appeared in Governments Division publications;
• the capability to crosslink and combine state and local government data with data from other sources, initially with data from other Census Bureau data series on population and industry for states and local areas and, in the future, when issues of data comparabil-ity are resolved, with data from other federal agencies; and
• graphical analysis and mapping tools to facilitate comparisons over time and among jurisdictions.
IN-HOUSE ANALYSES
Despite the fact that the Governments Division staff have a wealth of expertise on such topics as state and local government organization, finance trends, and employment trends, and that the staff possess a depth of analytical skills that are honed in the difficult tasks of data editing and imputation, the division does little analysis of its own data for public con-sumption. Like its sister organizations in the Economic Directorate, the division usually releases Census of Governments and survey results without descriptive analysis or graphics. For the Governments Division, this practice dates back to the early 1990s, when most descriptive and analytical reports were dropped and the division began placing data on the Internet with little or no explanatory text and giving readers relatively little ability to compare data among governments or over time.
In fact, the division has increasingly turned to web-based dissemina-tion. The 2002 Census of Governments will be the last printed version.
5 Currently, state and local government finance data are not available online for years prior to 1991-1992.
DISSEMINATION AND ANALYSIS �0�
The release of data to the public has become even more of a low-key op-eration, with new releases of data announced in limited distribution news alerts that inform users of the availability of new information rather than press releases that announce the new information and provide analytical highlights.6
This practice of releasing data to the public devoid of fanfare, major findings, analytical commentary, or key contacts on the staff means that the Governments Division and the Economic Directorate generally leaves it to data users to cull through the division’s website and to draw inferences and meaning from the flood of state and local government data that are issued on an annual and quarterly basis. As a result, although many data users obtain their state and local government information directly from the Governments Division and develop their own analyses, many others are turning to a cottage industry that has emerged in the private sector and among a few public interest groups for information that is tailored to their needs and interests.
The panel learned in discussions with major data users that much of the needed value-added information from the Governments Division could be quite simple and straightforward to provide and could even be largely automated. Users generally want simple derived measures, such as comparisons over time, time series presented in inflation-adjusted dollars, per capita amounts, and amounts in relation to personal income that the Census Bureau could comfortably provide. Other derived measures, such as rankings, are less obviously candidates for development by the Govern-ments Division, since they are often the subject of political rather than analytical interest. It is worth noting that Statistics Canada press releases provide these types of value-added information to users and offer an ex-ample that the Governments Division should consider.7 In addition, the division staff could prepare accompanying text regarding trends over time and among governments—such as trends in different regions of the coun-try—that would provide context for users. Occasionally, the staff could prepare longer analytical pieces, similar to those that are prepared by the Bureau of Labor Statistics staff in the Monthly Labor Review and by BEA staff in the Survey of Current Business.
6 The release of the long-awaited state and local government finances data for 2003–2004 is a case in point. The data were announced with only a Census Bureau publication called a “Tip Sheet” and a reference to the downloadable Internet tables in an advisory on May 31, 2005.
7 Statistics Canada press releases are located on its website at http://www.statcan.ca/menu-en.htm.

�0� STATE AND LOCAL GOVERNMENT STATISTICS AT A CROSSROADS
Recommendation 5-3: The Governments Division should add value to the data that are released on its website by providing simple derived measures, such as per capita expenditures and taxes, more explanatory material, and comparative contextual analyses—for example, of trends by type of government and region. The division should also facilitate wider dissemination of its data by regularly issuing press releases that include statistical comparisons with previous data.
6
Challenges for the Future
In carrying out its two missions of enhancing understanding of state and local government organization and operations and measuring their contribution to the national economy, the Census Bureau’s Govern-
ments Division has struggled to maintain a balance in its programs while modernizing them over time. In the quinquennial Census of Governments, there has been a loss of programs, such as the taxable property value survey, because resources were devoted to key economic time series. With these exceptions, the census describes individual state and local governments and the relationships among them, and also provides detailed measures of their economic activity. For the quarterly and annual programs, except for the loss in detail in 2001 and 2003, the Governments Division has generally managed to preserve the ability to provide needed data for key economic time series, but has been forced to eliminate some value-added features, and has reduced service to users of information on individual governments and intergovernmental relationships. The reduction or elimination of analysis, background information, and derived measures from data releases on the Internet has undercut the usefulness of the information for a broad spec-trum of users. At the same time, the division has recognized the need for and begun a program of modernizing its data collection, processing, and dissemination procedures.
At this time, the state and local government statistics program presents significant challenges for leadership, not only at the division level, but also the directorate and most senior management levels of the Census Bureau. Among these challenges are the need to develop a strategic view of the
�0�

�0� STATE AND LOCAL GOVERNMENT STATISTICS AT A CROSSROADS
future, the need to build the user community and respond to user demands for data with which to understand important changes in state and local governmental structure and operations, and the need to take account of evolving standards for government financial accounting. These exist in a resource-constrained environment that must also provide the means for im-proving the quality and cost-effectiveness of data operations. Compounding these challenges is that, unlike many other activities of the Census Bureau, the state and local governments program involves voluntary data collection from both state government respondents that are sovereign entities and the local governments that are creatures of those sovereign entities.
STRATEGIC PLANNING
The state and local government statistics program is part of a larger set of Census Bureau economic programs that establish their context. As part of the Census Bureau’s Economic Directorate, the state and local govern-ment statistics program functions within a well-defined set of practices and rules for administration and data collection, including the requirement that all parts of the economy are subject by law to a full-scale census every five years. The government statistics program is small, representing only about 7 percent of the Economic Directorate budget for censuses and surveys each year over the past 10 years.
Despite the importance of government statistics and all of the other economic statistics programs, these programs, like many other federal statistical programs, are facing increasing budget pressures. Compound-ing the budget problem is the need to generate funds on a cyclical basis to ramp up, and then back down, for the quinquennial Economic Census and Census of Governments. At present the Economic Directorate requires increased funds for the 2007 census cycle. To cope proactively with a dif-ficult budget climate, the directorate is conducting a systematic review of current programs to determine priorities. It is also seeking to streamline programs to the extent possible and to facilitate more efficient and higher quality reporting by better aligning data collection with government and corporate accounting standards and practices.
Program Review by the Economic Directorate
Setting Priorities
The economic statistics programs have been ranked in terms of how they relate to four areas. In order of priority from first to last, the four areas are (1) benchmark measures, (2) principal economic indicators, (3)
CHALLENGES FOR THE FUTURE �0�
annual sectoral-level economic statistics, and (4) the remaining programs and infrastructure.
The leadership of the Economic Directorate has stressed that meeting the needs of the Bureau of Economic Analysis (BEA) for information to sup-port the national income and product accounts (NIPAs) will always be the top priority for the Census Bureau’s economic statistics programs. Bench-mark measures include statistics from the Economic Census and Census of Governments that are used in the national accounts and other composite measures of economic activity, such as the index of industrial production, productivity measures, and the producer price index. Principal economic indicators, such as the source data for gross domestic product, closely fol-low the benchmark measures in the priority ranking. The Annual Survey of Manufacturers and the Annual Retail Survey are examples of the third priority of annual sectoral-level economic statistics.
Rankings on User Feedback, Quality, and Cost
In addition to identifying priority areas, the Economic Directorate is ranking 22 of the current economic statistics programs on six dimen-sions—two each for user feedback, data quality, and cost efficiency. The primary user feedback has come from BEA and the Federal Reserve Board (FRB), which ranked almost all of the economic surveys as critically impor-tant. The directorate has plans to expand feedback in the future to other users, and the National Association for Business Economics has offered assistance.
The Economic Directorate has formed a separate staff to carry out quality audits of all of the economic statistics programs over a 5-year cycle. It is expected that the Governments Division programs will be audited un-der this new program. These Economic Directorate quality audits evaluate how well the Census Bureau is following Office of Management and Budget quality standards, whether the sample designs are appropriately probabi-listic, and how well procedures and processes are documented. The audits also determine whether there is adequate internal control of collection, pro-cessing, and other procedures and whether a reliable tracking system exists for verification and validation of data at each step of processing. Response rates and standard errors are used to determine data quality. In essence, the quality audits address most of the same key aspects of survey quality that have been addressed in this report.
The directorate continues to refine the methodology to account for issues that have arisen, such as the fact that newer programs have fallen lower in rankings because, with start-up costs, they are not as cost-efficient as more established programs. The audit program is transparent and avail-
��0 STATE AND LOCAL GOVERNMENT STATISTICS AT A CROSSROADS
able to staff so they may learn from the review of other programs and im-prove their programs before the audit process.
Representatives of the program being reviewed have an opportunity to comment on the program’s evaluation, and continuous feedback on changes is encouraged. Most importantly, at the end of the audit process, program staff are asked to lay out what resources are needed for improve-ments. The final piece of the Economic Directorate’s improvement plans includes facilitating better reporting by following existing government and corporate accounting practices. Directorate staff have examined what items have the highest nonresponse and are working with accounting firms and the certified public accountants on staff to determine what some of the col-lection problems may be. Although cutting data items that are not being maintained in corporate or government accounting standards may be an unwelcome step for data users, such a step can potentially reduce follow-up resources from being used to collect hard-to-obtain or unavailable data.
Program Improvement by the Governments Division
The Governments Division has been developing its own strategic plan under the general rubrics outlined above for the Economic Directorate and addressing three areas for improvement: project management, documen-tation management, and knowledge management.1 The Census Bureau reports that project management training among the division’s managers has been completed, and the division has begun to offer that training to other staff. Documentation management—that is, managing materials that staff need to access on a regular basis— has begun to improve. Knowledge management is a special challenge.
As the division, like many government agencies, faces high rates of staff retirement, it has begun to address how knowledge will be passed from one generation of employees and managers to the next. The division is tackling knowledge management issues with a three-pronged approach.
First, the division evaluated its data storage and repository process and requirements for archiving documents and other materials related to the program using a web-based application, called the Document Manage-ment System, that supports project management, knowledge management, and cross-training. Second, the division reviewed its repository for storing programming code and, using a new tool called the Information Technol-ogy Repository, took steps to ensure that code is in a specific place and is quickly accessible to all staff. Third, the division is moving to the use of
1 Stephanie Brown, chief of the Governments Division, discussed the history and future plans of the division and addressed its strategic plan and the relationship to the planning process for the Economic Directorate at the panel’s first meeting in January 2006.
CHALLENGES FOR THE FUTURE ���
electronic records as a one-stop repository for its interagency agreements, budget documents, and similar materials. This step was given priority in part because the Census Bureau, in moving to a new headquarters building, has been reducing paper and increasing use of electronic records across the board.
In addition to these steps, the division provides training opportunities for newer staff. Also, it has developed a skills database to identify staff holding key knowledge and a division-specific wise elders program based on the Census Bureau-wide wise elders program. This program involves seminars on topics of interest given by retirees or employees with long experience.
As the division moves closer to meeting its goals in the areas of project, documentation, and knowledge management, the next step is to finalize its strategic plan. The division branch chiefs have developed branch-specific business plans that articulate the goals and objectives for each branch, and these will be linked back to the strategic plan. The division-wide strategic plan adopted five of the six goals from the Economic Directorate, which include improving the relevance, timeliness, and usefulness of its data; in-creasing the use and accessibility of the data; reducing burden and simpli-fying reporting; improving data processing systems; and undertaking staff development. A sixth Economic Directorate goal—promote innovative use of microdata—addresses microdata release for research purposes that are under confidentiality restrictions and does not apply to the Governments Division programs, in which all microdata are released. The strategic plan includes a section on marketing the division’s data to improve visibility and accessibility, increase the division’s sponsor base, promote the products among influential users, and develop relationships with educational institu-tions and think tanks. This initiative should help expand the reach of the Governments Division to fulfill the needs of users other than BEA and FRB for detailed data below the national level.
Conclusion and Recommendation
The panel supports the Governments Division’s actions to improve project, documentation, and knowledge management and the Economic Directorate’s across-the-board initiatives for all of its programs to obtain user feedback, undertake quality audits, and better align reporting systems with respondents’ accounting practices. There is much work to be done to modernize aspects of data collection, processing, and estimation for the Governments Division census and surveys.
The panel also supports the strategic planning efforts of the Gov-ernments Division and the Economic Directorate more broadly. We are concerned, however, that the directorate’s, and therefore the division’s,
��� STATE AND LOCAL GOVERNMENT STATISTICS AT A CROSSROADS
planning efforts are driven too much by the negative factor of constrained resources and the likelihood that resources will continue to be constrained. While pressures on budgets may indeed continue and may result in at least real—and possibly even nominal—cutbacks, the panel thinks that the Governments Division must develop and articulate a strategic plan that has two tracks: one for the situation of constrained resources and the other on the premise that increased awareness of the importance and usefulness of its data may result in additional resources becoming available. Without increased resources, the Governments Division cannot continue to provide as much of the rich detail on individual state and local governments that is needed for the many important research, policy making, and public under-standing purposes. Moreover, constraints on such detail can adversely affect the ability to maintain the quality of the high-priority data that are needed to inform key economic time series produced by federal agencies.
In this sense, the Governments Division is at a crossroads. It can con-tinue down the path of cutting back, not only on data series, but also on explanatory material and derived measures to accompany data releases on the Internet. Continuing to follow this path may cause users to turn to other data series of lesser quality and respondents to become even less willing to answer the division’s inquiries. The end result could be to undercut the division’s key role and stellar past performance as an honest broker that is the only source of consistent, comparable data for comparative analysis among governments and over time.
Alternatively, the Governments Division can begin to think construc-tively about ways to enhance its data series and the information it provides to users on the Internet. A welcome step in this direction is the inclusion in the division’s strategic plan of an initiative to market its data so as to increase their visibility and increase the division’s user base. For the divi-sion to take positive steps along these lines and in other ways to increase outreach to and feedback from users, it will need the wholehearted support of the Economic Directorate.
Conclusion 6-1: The current strategic planning for the Census Bureau’s Economic Directorate is predicated on the likelihood of continued constrained budget resources and the need to give highest priority to providing data to support the national income and product accounts and other key economic time series. Consequently, the Governments Division is compelled to give priority to the publication of aggregated data on state and local government finances over the analysis of data on individual governments, intergovernmental relations, and the structure and operations of governments.
The panel reiterates its recognition of the necessity of high-quality ag-
CHALLENGES FOR THE FUTURE ���
gregate estimates of state and local government finances and employment to feed the NIPAs and other key economic time series that are generated by the federal government. It cautions, however, that too narrow a focus on this use not only slights other important uses that require detailed information with which to understand the operations and finances of individual state and local governments along with the financial flows among governments at different levels, but also runs the risk that not enough detailed information will be collected to validate the key economic aggregates.
Recommendation 6-1: The Governments Division should include two tracks in its strategic plan: one track that plans for an environment of constrained resources and a second track that identifies ways to build support over time for enhancing the division’s data series and the infor-mation provided to users on the Census Bureau website. The Economic Directorate and, by extension, senior Census Bureau management, should support the Governments Division’s planning efforts in this re-gard and should make available some resources to begin implementing one or more aspects of the second track of the division’s plan.
BUILDING THE USER COMMUNITY AND OBTAINING USER INPUT
The panel has identified three high-priority interests of users of the Governments Division’s data: timeliness is the highest priority, followed closely by maintaining time series and providing more detail in areas in which important changes are occurring in the provision of services, sources of revenues, types of expenditures, and types of operations of state and lo-cal governments. The panel recognizes the impossibility of satisfying all of the specific requests of users for additional data and recommends that the division develop a working paper of options and solicit input over the next 2–3 years from users to identify preferred options to implement with the next Census of Governments in 2012 or before, if resources permit.
Given constrained resources, the options spelled out in the recom-mended working paper are likely to include a mixture of new detail and cutbacks in traditionally collected detail on topics that appear to be less relevant. It is also likely that, in providing their input, users will make a case for much more new detail than existing detail. In its assessment of user needs, the division will have to take practical account of resource limita-tions. In the end, the goal should be to identify a few areas that could be included in budget initiatives to put forward to the Census Bureau, the De-partment of Commerce, and the Office of Management and Budget. Simply the process of working with users should help build a base of support that can be helpful in justifying and obtaining resources for these initiatives.
��� STATE AND LOCAL GOVERNMENT STATISTICS AT A CROSSROADS
In addition to the recommended working paper, the panel thinks that the division should go even further by developing a continuous process of identifying, evaluating, and following through on the most important needs of its users in both the short and longer terms. Not only can such a process help guide the division’s program in the most beneficial way, but it can also help increase the user base for the division’s data and build support for additional budget resources. The division should not be diffident about seeking to build its base of users; by so doing, it will increase the return on taxpayer dollars that are invested in data collection and production.
Central to the division’s ability to reach out to and obtain input, not only from major federal users with whom it is in close contact, but also from public interest groups and research users, is to establish an ongoing advisory group. The Governments Division does not have its own advisory group. Instead, it must rely on the Census Bureau Advisory Committee of Professional Associations—consisting of members of the American Eco-nomic Association, the American Marketing Association, the American Statistical Association, and the Population Association of America—or the Federal Economic Statistics Advisory Committee, which the Census Bu-reau sponsors along with the Bureau of Labor Statistics and BEA. Neither of these advisory committees has membership drawn from the domain of public administration, public accounting, or financial policy. (The advisory committee to BEA has two public finance experts.)
Although topics related to government statistics can be vetted with either one of these two committees, the record shows that such vetting has rarely been done. The Federal Economic Statistics Advisory Committee, which was established in 1999, has never discussed the Governments Divi-sion program, and the long-standing Census Bureau Advisory Committee of Professional Associations has discussed the Governments Division program on only two occasions since 1995:
• In 1996, the division presented a paper to the advisory commit-tee that described the major aspects of the program and discussed briefly four possible areas for the committee to consider regarding future data needs for the public sector: contracting out, devolution, downsizing, and acquisition of capital goods. There is no indica-tion that the committee discussed the paper in open session.
• In 2000, a Governments Division staff member presented a plan to the advisory committee for temporarily restructuring the an-nual finance survey. The plan suggested developing a more limited sample of local governments for 2001 and 2003 that would pro-duce only national totals instead of the normally larger sample that yielded local government totals by state. The advisory committee concurred with the plan to gather only national totals as a useful
CHALLENGES FOR THE FUTURE ���
way of saving resources with a small compromise in data quality, provided that the switch would be only temporary, for a specified definite duration (U.S. Census Bureau, 2000b, pp. 32-33, 83).
It is not surprising that the Census Advisory Committee of Professional Associations has had little time to devote to state and local government statistics, given that it lacks members with relevant subject-matter expertise, that it meets only twice a year, and that it must of necessity focus on the major Census Bureau programs, such as the decennial census, the Economic Census, and the American Community Survey.
Conclusion 6-2: The Governments Division lacks vehicles for obtaining continued input from data users and methodological researchers with relevant experience and expertise. Such input is necessary to guide the development of statistical programs that are intended to provide data for public use.
The Governments Division needs a committee that is dedicated to its special issues and subject matter. The process of establishing federally chartered advisory committees is governed by the Federal Advisory Com-mittee Act (FACA). FACA guidelines limit new advisory committees to “the minimum necessary” and indicate that they must be “essential.” The Department of Commerce guidance echoes FACA, stipulating that advisory committees must be “essential to the conduct of the Departmental busi-ness.” It would be difficult to establish a new government statistics advisory committee under FACA, but there are other ways to accomplish the same goal. For example, some statistical agencies, such as the Bureau of Justice Statistics and the Energy Information Administration, have small groups of experts, constituted under the auspices of the American Statistical Associa-tion, who meet periodically to review their programs.
The Governments Division could follow this model by asking an in-terested professional association or other body, such as the Section on Intergovernmental Administration and Management of the Society of Pub-lic Administration or the National Academy of Public Administration, to establish a committee of experts in government administration and finance to meet regularly with division staff. Meetings at least twice a year would be needed to provide continuity and develop good working relationships between the division staff and the committee members. Under this model, the sponsoring organization establishes the committee with funding from the statistical agency for travel and meeting costs.
In addition, the Census Bureau could have the American Economics Association component of the Census Advisory Committee of Professional Associations add one or two experts in finance and plan to hear from the
��� STATE AND LOCAL GOVERNMENT STATISTICS AT A CROSSROADS
Governments Division periodically. The Census Bureau could also have the American Statistical Association (ASA) component establish a regular schedule for considering methodological issues from the Governments Divi-sion. The ASA component has members whose expertise in survey design, reducing nonresponse, adjusting for nonresponse, estimation, and other methodological topics is relevant to the division’s surveys, even though the members may not be familiar with the particular subject matter.
Recommendation 6-2: The Census Bureau should empower the Gov-ernments Division to organize a committee of experts in public admin-istration and state and local government finance under the auspices of a relevant professional association or consortium of organizations. The committee should meet regularly to review the division’s program. In addition, the Census Bureau should ensure that methodological issues for the Governments Division program are regularly brought before the American Statistical Association component of the Census Advisory Committee of Professional Associations and consider adding one or two experts in public finance to the American Economic Association component of that committee.
ROLE OF STANDARDS
Several sets of standards and guidelines currently exist for report-ing financial and other information on state and local governments. The International Monetary Fund and the United Nations set international standards for classifications and functions of governments which provide a template for BEA to use in developing gross domestic product estimates. At the national level, the Government Accounting Standards Board (GASB) produces standards and guidelines that state and local governments follow in reporting financial information and promulgates them in two standards that have direct bearing on the record-keeping practices of the reporting governments: GASB Statement 34 and Statement 44. The GASB standards and their impact are discussed in this section.
Although not covered in this section, the standards set by other federal agencies also influence the ability to standardize data between the Census Bureau and the other agencies. Users have reported difficulty in relating Department of Education K-12 finance information to that reported by the Governments Division, despite the fact that the division collects much of the education data for the Department of Education. Similar lack of standardization affects the ability to directly relate Governments Division data on health and social services spending to information about Medicaid and Temporary Assistance for Needy Families that are provided by other departments.
CHALLENGES FOR THE FUTURE ���
These standards that are set by outside bodies pose a challenge for the Governments Division and for the Economic Directorate as the Cen-sus Bureau seeks to determine the appropriate role for its staff to play in coordinating with standards-setting bodies, influencing their decisions, adopting their guidelines, and adjusting their collection and compilation procedures.
International Standards
The Government Finance Statistics Manual (GFS Manual) prepared by the International Monetary Fund (IMF) provides a comprehensive concep-tual and accounting framework for analyzing and evaluating fiscal policy of the general government and public sectors. The framework is harmonized with the corresponding international accounting standard to the extent consistent with the goal of supporting fiscal analysis. These accounting standards are the System of National Accounts ����,2 the Balance of Pay-ments Manual, �th ed.,3 and the Financial Statistics Manual.4 The GFS manual also draws heavily on the United Nations Classification of Func-tions of Government (COFOG).5
COFOG, a classification system developed by the Organisation for Eco-nomic Co-operation and Development and published by the United Nations Statistical Division, is primarily used in the U.S. government by BEA to organize the government consumption expenditures and gross investment estimates in the national income and product accounts. COFOG can be ap-plied to government expenses and the net acquisition of nonfinancial assets. Its three levels of detail are divisions, groups, and classes. The divisions can be considered as the broad objectives of government, and the groups and classes detail the means by which these broad objectives are achieved.6 BEA uses the COFOG classifications to organize the Census Bureau state and local government data into nine basic functions.
To date, the Governments Division has not made use of the IMF or COFOG standards in its data collections. The Center for Medicare and Medicaid Services has indicated a desire for the division’s surveys to recog-nize the detailed COFOG classifications in the area of public health. While the panel was not able to investigate the COFOG classification scheme in depth, it seems that the Governments Division should investigate the extent
2 Available: http://unstats.un.org/unsd/sna1993/introduction.asp3 Available: http://www.imf.org/external/np/sta/bop/BOPman.pdf4 Available: http://www.imf.org/external/pubs/ft/gfs/manual/.5 Available: http://unstats.un.org/unsd/cr/family2.asp?Cl=4.6 For further information on COFOG, see United Nations Statistical Division (2007).
��� STATE AND LOCAL GOVERNMENT STATISTICS AT A CROSSROADS
to which COFOG categories should be recognized in the Census of Govern-ments and annual surveys and at what level of detail.
GASB
The most important U.S. standards-setting body for classifying and accounting for state and local government finances is the GASB, which is a nongovernmental organization that has assumed responsibility for issuing standards for public-sector accounting. GASB is changing the nature of state and local government reporting, as governments increasingly look to it and want to be in compliance with generally accepted accounting prin-ciples (GAAP). GASB is one of three bodies that set such standards. The two other bodies designated by the American Institute of Certified Public Accountants to disseminate generally accepted accounting principles are the Financial Accounting Standards Board for the private sector and the Federal Accounting Standards Advisory Board for the federal government.7
GASB’s mission is “to establish and improve financial reporting stan-dards for state and local governments that they would use in their general purpose external financial reports, the objective of which is to provide in-formation that meets the needs of the users of those financial statements.”8 GASB follows generally accepted accounting principles to set standards for state and local government financial reporting, which have the potential to help the Governments Division with issues of classification at a broad level.
GASB users—those who prepare, audit, and use state and local govern-ment financial statements—fall into three groups: (1) the investor-creditor community; (2) executive, legislative, and oversight bodies; and (3) the citizenry, its representatives, and intermediaries, such as the media. Since GASB began in 1984, it has issued 47 statements, 6 interpretations, and 3 concept statements. Statements 34 and 44 pertain to financial reporting.
GASB Statement 34
Statement 34 is a recent and dramatic new statement that overhauls many of the principles for external reporting of financial condition by state and local governments. It encourages governments to make the transition from the traditional fund-based accounting model to an accrual-based
7 The National Center for Education Statistics establishes accounting standards for school district financial reporting.
8 At the panel’s June 2006 workshop, Ken Schermann, representing GASB, provided an overview of its role in setting standards for local and state government financial statements, specifically the roles of Statements 34 and 44.

CHALLENGES FOR THE FUTURE ���
model, while also retaining the traditional reporting. Statement 34 newly requires a government-wide statement and also that results on this state-ment be prepared on a full accrual basis. Prior to Statement 34, full accrual-basis reporting was used only for business-type activities of governments. This method adds new information while preserving the elements of the older model, including fund-based statements prepared on a modified ac-crual basis, recognizing revenues when they become available and measur-able and expenditures as they are made. The full accrual basis of accounting recognizes revenues as soon as they are earned and expenses as soon as a liability is incurred, regardless of the timing of related cash inflows and outflows, If the Governments Division were to adopt the full accrual basis used in the new government-wide statement, rather than the modified ac-crual approach used in the fund statements, the Governments Divisions state and local government finance data would change dramatically The Governments Division is concerned that the burden placed on governments to provide data in this format might be enormous, because all governments would not necessarily have full-accrual data at the level of detail required by the Governments Division.
In the process of developing Statement 34, GASB conducted user stud-ies, sponsored academic research, and followed due process, which included three standard proposing documents, task force meetings, 25 public hear-ings and user focus groups, and field tests in 20 state and local governments to develop the statement and the new financial reporting model. Statement 34 lays out the minimum requirements for a state or local government’s basic financial statements to be in compliance with generally accepted accounting principles. The new reporting method adds government-wide statements and a requirement to include the Management’s Discussion and Analysis (MD&A). The Comprehensive Annual Financial Report (CAFR) typically includes much more information than this required minimum, including required supplementary information and optional information. The data that state and local governments provide to the Governments Division in annual surveys and 5-year censuses are drawn from the same record-keeping systems that the CAFR draws on, but there are many differ-ences between the ways in which the CAFR summarizes, supplements, and presents this information and the ways in which the Governments Division summarizes, supplements, and presents the information.
The MD&A is unlikely to be a producer of data for statistical purposes; however, the government-wide statements, which focus on the government as a single economic unit rather than as a collection of independent funds with varying fiscal years, and on costs of services rather than expenditures, will affect data classification and collection by the Governments Division. The statement of activities and the statement of net assets use the economic resources and accrual-based measurements to provide the background in-
��0 STATE AND LOCAL GOVERNMENT STATISTICS AT A CROSSROADS
formation for these government-wide statements, offering a longer term perspective than the traditional reporting methods.
The statement of activities, or operating statement, is the centerpiece of the new model. The model starts with expenses rather than revenues and uses the net cost format, which shows the cost of services and how the government pays for them. The expenses are broken down by function or program rather than by fund, allowing comparison across governments re-gardless of the different fund accounting systems. Revenues are divided into four categories: charges for services, operating grants and contributions, capital grants and contributions, and general revenues, with a provision to identify special increases from transfers or other one-time sources. The statement of activities matches costs incurred to program-specific revenues raised, and the balance is the net cost, which is paid for through general revenues. Although this methodology involves more work on the part of a state or local government, GASB has found that the users of the financial statements are obtaining long-awaited information.
The statement of net assets is the new balance sheet, and it focuses on the residual difference between the government’s assets, including infra-structure, and liabilities. Although the historical component of infrastruc-ture is still inexact due to a lack of records, GASB expects this number to become increasingly accurate as older assets are replaced.
The Governments Division agrees that Statement 34 adds some in-formation without taking away what was already included in previous versions of CAFRs. The division has considered how to use some of the information as indicators to estimate other variables, given that some gov-ernments historically have chosen to send their financial documents rather than fill out the division’s surveys. If all 87,000 governments sent all of their financial documents, the division would have a great deal of informa-tion but also a tremendous workload in parsing out needed data from the reports, especially if they are in paper form. Furthermore, while these data might hold out the promise of helping to estimate national totals for total expenditures and total revenue, it is highly unlikely that they could provide any information on details, such as spending by function or revenue by major category. The division is also making an effort to determine if there is useful information from the government-wide statements that it is not currently collecting. For example, BEA is interested in the valuation of as-sets, which the division does not collect but which is included in Statement 34 requirements.
One major difference between GASB and Governments Division finan-cial reporting is that the former relies more on accrual accounting. This difference does not present a problem, however, because all accounting systems, including accrual-based systems, include detailed cash flow state-ments. The division makes use of the underlying cash data and largely
CHALLENGES FOR THE FUTURE ���
ignores the accrual-based overlays. BEA may have some interest in the full-accrual measures in the future—for example, it is studying increasing the use of accrual accounting for the national income and product accounts (U.S. Bureau of Economic Analysis, 2005).
Like the Governments Division, GASB has the objective of standardiz-ing the accounting of funds and enforcing consistency across governments. However, a major difference between the two is in the detail collected. The division collects data on more detailed functions than is required by GASB. Reliance solely on GASB classification would result in virtually complete elimination of detail, which would severely erode the quality of BEA es-timates and make Governments Division finance data nearly worthless to many other users.9 With that said, there are reasons for the Governments Division to coordinate with GASB and to seek changes that would serve both organizations (see below).
Insofar as it affects state central collection programs, GASB’s Statement 34 holds both potential promise and peril for the Governments Division data collection efforts. The promise is the availability of a wealth of new data on capital valuation; the peril is that, as the GASB standard increas-ingly defines the data that are available at the state and local level, there could be a loss of detail, primarily at the functional level, that would jeop-ardize the historical continuity and limit the usefulness of the Governments Division data (Wulf, 2005, p. 15).
GASB Statement 44
Statement 44 outlines requirements for optional reporting of a statisti-cal section of a government’s financial statement. The statistical section is composed of five parts: financial trends, revenue capacity, debt capacity, demographic and economic data, and operating information. Financial trend information typically comes from 10-year comparative financial state-ments and includes information on net assets, changes in net assets, fund balances, and changes in fund balances. Information on a government’s most significant own-source revenue is captured under the revenue capacity category. Four types of information that are comparable over the historical period are reported: revenue base, direct and overlapping rates, principal real property taxpayers (top 10 taxpayers), and levies and collections. Debt capacity information includes ratios of total debt outstanding, ratios of gen-eral debt outstanding, overlapping debt, debt limits, and pledged-revenue coverage. Two types of information are included in the demographic and economic data section and are generally obtained from other federal statis-tical sources: demographic and economic indicators and principal employ-
9 BEA, Response to Committee Questions, July 26, 2006.
��� STATE AND LOCAL GOVERNMENT STATISTICS AT A CROSSROADS
ers. Finally, government employment, operating indicators (demand or level of service), and capital asset indicators (such as volume, usage, or type) make up the operating information.
While GASB develops the standards, compliance is voluntary, and GASB has no method for enforcement. The enforcement of these standards comes from the users of the financial statements, such as state govern-ments and municipal bond rating organizations. GASB has commissioned an academic survey to find out how many and which states require GAAP reporting by which levels of government. Statement 44 is not required for GAAP compliance, but it is a requirement for a full CAFR. The CAFR is the bond rating community’s primary tool for determining the ability of the borrowing government to repay the debt.
Census Bureau Coordination with GASB
In view of the apparently growing influence of the GASB standards as the defining standard for the development and maintenance of state and local government financial records, it is important that the Governments Division stay in communication with the GASB rule-making process and play an active role to the extent possible. The body that ensures advisory representation in the GASB process is the Governmental Accounting Stan-dards Advisory Council (GASAC). The GASAC is responsible for consult-ing with GASB on technical issues on the board’s agenda, project priorities, matters likely to require the attention of GASB, selection and organization of task forces and such other matters as may be requested by GASB or its chairman. The council has more than 25 members who are broadly rep-resentative of preparers, attesters, and users of financial information. The federal government is officially represented on the GASAC by the Govern-ment Accountability Office. The assistant division chief of the Governments Division currently serves in an at-large seat on this body. It would be very helpful for the Governments Division to have a permanent seat as an orga-nizational member of the GASAC.
Recommendation 6-3: The Census Bureau’s Governments Division should continue to stay engaged in the Government Accounting Stan-dards Board standards-setting process in order to ensure maximum consistency between the GASB and Census Bureau definitions. To ensure close coordination with this activity, the division should seek to obtain status as an organizational member of the Governmental Ac-counting Standards Advisory Council.
The panel discussed the role of GASB in standards setting at length and how much benefit the GASB standards could offer the Governments
CHALLENGES FOR THE FUTURE ���
Division. In the short term, GASB rules do not appear likely to provide the division with much opportunity to streamline its data collection. One important reason for this is that GASB does not specify which spending functions governments should list in their CAFRs, and when governments do publish information by functions, GASB does not specify how those functions should be defined. Governments generally publish the categories they choose to, and they define them the way they think makes sense for their purposes. Consequently, there is neither uniformity nor comparability. The requirements for functional reporting in GASB Statement 34, as noted above, are in terms of very broad categories.
Still, having a standards-setting body with considerable prestige, if not outright authority, could create enormous opportunities for streamlining the Governments Division data collection over the longer term, particularly if GASB defines or suggests definitions for expenditure categories. There are many problems that would result from simply turning over definition-making authority to a third party, but that concern should not deter the Governments Division from exploring possible opportunities. If at some point in the future, it were possible to combine GASB and census catego-ries with technical methods that would allow governments to “tag” their data with these definitions when they first create them, delivery of data to the division in a form that is useful might become nearly automatic. The obstacles to this would be great, but the benefits would also be great.
Recommendation 6-4: The Census Bureau’s Governments Division should lead a long-term research effort, with the Government Account-ing Standards Board, the Government Finance Officers Association, and other organizations as appropriate, to explore the development of advisory guidelines and data definitions in a way that would allow the collection of reasonably uniform detailed finance data from a very large number of state and local governments on a regular basis.
CONCLUSION
The Governments Division’s data collections play a critical role not only for the national income and product accounts and other economic indicators, but also for important research and policy analysis uses that re-quire detailed, consistent, and comparable data for individual governments over time. Constrained resources have compelled the division to cut back progressively on its data collections and valuable background information for users. On the positive side, the division has begun to modernize its op-erations, improve its website, and develop systems for project, documenta-tion, and knowledge management. Moreover, the Economic Directorate of which the division is a part has undertaken welcome initiatives to evaluate
��� STATE AND LOCAL GOVERNMENT STATISTICS AT A CROSSROADS
all of its programs, to apply best statistical practices throughout the direc-torate, and to require strategic planning.
At this critical juncture, the Governments Division is poised to take either a limited view of its future or, as the panel strongly recommends, a proactive, positive view in which it seeks opportunities to build its user community and respond to user needs for more timely, relevant, and higher quality data. The division will require the unstinting support of the senior Census Bureau management and, in particular, the leadership of the Eco-nomic Directorate to move forward. Senior management should charge the division to develop a two-track strategic plan—one track that plans how to adapt to a constrained resources environment in the most cost-effective and user-responsive manner and a second track that looks to opportunities to develop grow the division’s program for the future. Senior management should also empower the division to establish an advisory group for con-tinuing user input and should encourage it to work proactively with stan-dards-setting bodies. These steps are critical to keep the division’s data in the mainstream of international and national thinking and to maintain the division’s well-earned reputation as honest broker and provider of impec-cable information for measurement of state and local government activity. Finally, the Economic Directorate should continue to strengthen its efforts to bring modern survey design, data processing, and statistical estimation methods to all of its programs, including the state and local government statistics program.
Progress toward implementing a forward-looking, opportunity-seeking strategic plan for the Governments Division may of necessity be slow and halting. Nonetheless, it should begin so that the federal agencies and the policy and research communities have the information they need to track the economic contributions of state and local governments and their chang-ing structures, operations, and relationships and how these affect the nation and its people.

References
Ahmed, S. and D. Tasky 1999 An Overview of the Standard Economic Processing System (StEPS). Washington,
DC: U.S. Census Bureau.Brackstone, G. 1999 Managing data quality in a statistical agency. Survey Methodology (25)2:139–149.Briffault, R. 1999 Government of our time: Business improvement districts and urban governance.
Columbia Law Review 99(2):365.Center for Education Reform 2006 National Charter School Data: New School Estimates 2006-2007. Available: htttp://
www.edreform.com/_upload/ncsw-numbers.pdf.Community Associations Institute 2007 Industry Data. Available: http://www.cafonline.org/about/facts.cfm.Federal Committee on Statistical Methodology 2001 Measuring and Reporting Sources of Error in Surveys. Statistical Policy Working
Paper 31, July. Available: http://www.fcsm.gov/01papers/SPWP31_final.pdf.Fixler, D. 2004 Revisions to the GDP Estimates in the U.S. Table 4. OECD Workshop on Revisions.
Table 4. Available: http://www.bea.gov/papers/index.htm.Hogue, C. 2005a Annual Finance Survey. Memorandum for the Record, U.S. Census Bureau, Decem-
ber 21, p. 1. 2005b Redesign of the Quarterly Tax Survey. Memorandum for the Record, U.S. Census
Bureau, December 21.Holahan, J., A. Weil, and J. M. Wiener. 2003 Which Way for Federalism and Health Policy? Health Affairs, Web Exclusive,
July:W3-318–319. Available: http://content.healthaffairs.org/cgi/reprint/hlthaff.w3.317v1.pdf.
���
��� STATE AND LOCAL GOVERNMENT STATISTICS AT A CROSSROADS
Keffer, G. 2006 What Are The Data Needs for The New Federalism? Census Advisory Committee,
U.S. Census Bureau, October 24, p. 8.Morganstein, D. and D. Marker 1997 Continuous quality improvement in statistical agencies. Pp. 475–500 in L. Lyberg,
P. Biemer, M. Collins, E.D. deLeew, C. Dippo, N. Schwarz, and D. Trewin (eds.), Survey Measurement and Process Quality. New York: John Wiley & Sons.
National Research Council 2000 Small-Area Income and Poverty Estimates: Priorities for �000 and Beyond. Con-
stance F. Citro and Graham Kalton, eds., Panel on Estimates of Poverty for Small Geographic Area. Committee on National Statistics, Commission on Behavioral and Social Sciences and Education. Washington, DC: National Academy Press.
2005 Measuring Research and Development Expenditures in the U.S. Economy. Panel on Research and Development Statistics at the National Science Foundation. Commit-tee on National Statistics, Division of Behavioral and Social Sciences and Education. Washington, DC: The National Academies Press.
Nathan, R. 2006 Rethinking the Politics of Federalism. Available: http://www.governing.com/manage/
mi/6ins0809.htm.Salamon, L. 2005 The New Governance: Getting Beyond the Right Answer to the Wrong Question in
Public Sector Reform. J. Douglas Gibson Lecture, School of Policy Studies, Queen’s University, February 3,
Teplin, A. 2001 The U.S. Flow of Funds Accounts and Their Uses. Federal Reserve Bulletin, July.
Available: http://www.federalreserve.gov/pubs/bulletin/2001/0701lead.pdf.United Nations Statistical Division 2000 Classifications of Expenditure According to Purpose. (Department of Economic and So-
cial Affairs, Statistics Division, Statistical Papers, Series M, No. 84, New York). Avail-able: http://millenniumindicators.un.org/unsd/cr/registry/regcst.asp?Cl=4&Lg=1.
2003 Handbook of Statistical Organization, Third Edition. New York: United Nations. 2007 Classification of Functions of Government (COFOG). Available: http://unstats.
un.org/unsd/cr/registry/regcst.asp?Cl=4&Lg=1&Top=1. U.S. Bureau of Economic Analysis 2005 Government Transactions, Methodology Papers: U.S. National Income and Product
Accounts, September. Available: http://www.bea.gov/bea/mp5.pdf.U.S. Bureau of Justice Statistics 2007 Prisoners in 2005, November 2006 (as revised 1/18/2007): Table 1. Available:
http://www.ojp.gov/bjs/abstract/p05.htm. U.S. Bureau of Transportation Statistics 2002 Highway Profile, Inventory, for the Year 2000. Available: http://www.bts.gov/publications/
national_transportation_statistics/2002/html/table_highway_profile.html.U.S. Census Bureau 1982 Historical Statistics on Governmental Finances and Employment, ���� Census of
Governments (vol. 6, no. 4). Washington, DC: U.S. Census Bureau. 1992 A brief history of Census Bureau data collection on governments. Government
Finance and Employment Classification Manual. Available: http://www.census.gov/govs/www/class_ch2.html.
2000a Bridge Between NAICS and SIC. 1997 Economic Census Core Business Statistics Series, EC97X-CS3, June. Available: http://www.census.gov/epcd/ec97brdg/97x-cs3.pdf.
REFERENCES ���
2000b Census Advisory Committee of Professional Associations, October 19–20, 2000 Meeting Minutes, pp. 32–36, 83.
2005 Statistical Abstract of the United States: 2006, October: pp. 271–272. Available: http://www.census.gov/prod/www/statistical-abstract.html
2006a Definition of Data Quality. Version 1.2. Census Bureau Methodology and Standards Council, January 5, p. 1.
2006b Government Finance and Employment Classification Manual (October). Available: http://www.census.gov/govs/www/class06.html.
2006c Pretesting questionnaires and related materials for surveys and censuses. Census Bureau Standard, Version 1.2, March 9, p. 2.
2006d Questionnaire testing and evaluation methods for censuses and surveys, supporting document A. Census Bureau Standard, Version 1.2, March 9, 2006, p. 2.
U.S. Centers for Medicare and Medicaid Services 2007 National Health Expenditure Data. Available: http://www.cms.hhs.gov/National
HealthExpendData.U.S. Charter Schools 2007 Charter Laws. Available: http://www.uscharterschools.org/pub/uscs_docs/o/charterlaws.
htm.U.S. Department of Housing and Urban Development 2007 State of the Cities Data Systems (SOCDS). Available: http://socds.huduser.org/.U.S. Department of Transportation 2007 Public Transit in the United States. Available: http://www.fta.dot.gov/publications/
reports/other_reports/publications_134.html.U.S. District Court for the Southern District of Ohio 2002 Riester v. Riverside Cnty. Sch., NO.C-1-01-850, United States District Court for the
Southern District of Ohio, Western Division, 257 F. Supp. 2d 968; 2002 U.S. Dist. LEXIS 26148, December 17, 2002, Decided, December 18, 2002, Filed.
U.S. National Center for Education Statistics 2005 Digest of Education Statistics. Available: http://nces.ed.gov/programs/digest/d05/
tables/.U.S. Office of Management and Budget 2002 Guidelines for Ensuring and Maximizing the Quality, Objectivity, Utility, and Integ-
rity of Information Disseminated by Federal Agencies, January 3.Wulf, H. 2005 Measuring Governmental Economic Activity: The Comparative Advantage of Us-
ing the Census Bureau’s Federal, State and Local Government Economic Statistics Program. Unpublished. U.S. Census Bureau, Washington, DC.

Appendix A
Governments Division Census and Surveys
In this appendix, the various census and survey programs that comprise the state and local government statistics programs are summarized. These program descriptions are based on information from the Census
Bureau’s Governments Division website: http://www.census.gov/govs.
CENSUS OF GOvERNMENTS
The Census of Governments provides comprehensive statistics about governments and governmental activities, covering all state and local gov-ernments in the United States. Local governments include counties, cities, townships, special districts, and school districts. Data are obtained on government organizations, finances, and employment.
The census provides the only source of periodic information that identi-fies and describes all units of government in the United States and reflects the use of nationally consistent definitions and classifications. Organization data include location, type, and characteristics of local governments and officials. Finances and employment data are the same as in comparable annual surveys and include revenue, expenditure, debt, assets, employees, payroll, and benefits. Government organization data and information are for March of the census base year (1992, 1997, etc.). Financial data are for the individual fiscal year that ended prior to July 1 of the census year. Employment data are for March of the census year. Every five years since 1957, for years ending in 2 and 7 (part of the Census Bureau’s periodic Economic Census). Reference periods for data vary by census phase.
���
��0 STATE AND LOCAL GOVERNMENT STATISTICS AT A CROSSROADS
There are three phases to the census:
• Phase I is a precensus directory survey of the more than 87,000 local governments. It includes extensive legal research on govern-ment structure by state as well as a mail-out/mail-back survey, and it produces an updated list of all local governments and selected data.
• Phase II covers all state and local governments, expanding the cen-sus year annual finance survey from about 14,000 to the more than 87,000 state and local governments. It uses in-house data compila-tions of source documents for many of the state and largest local governments, consolidated data submissions (usually electronic files) for about 55,000 local governments, Internet data collec-tion capabilities, and a mail-out/mail-back survey of the remaining governments.
• Phase III covers all of the federal civilian, state and local govern-ments and expands the census-year annual employment survey from about 10,000 to the more than 87,000 local governments. It relies on consolidated submissions from more than 30 state respon-dents and an Internet data collection capability, with the remainder obtained through a mail-out/mail-back survey.
Public releases include electronic files and Internet tables first, followed by printed reports. For the organization phase, releases are available within a year of the census year. The printed format includes Volume �. Govern-ment Organization. Finance phase releases begin about 16 months after the close of the census year. They include files covering the finances of state gov-ernments, local governments by type, and finances of individual government units. Internet tables cover state governments, state and local governments, and employee retirement systems of state and local governments. Printed releases include Finances of County Governments, Finances of Municipali-ties and Township Governments, Compendium of Government Finances, and Employee Retirement Systems of State and Local Governments.
Employment phase releases begin about 12 months after the census year. They include files covering employment and payroll of the federal government (civilian only), state governments, state and local governments by state and type, and employment of all individual governments. Internet tables cover federal employment, state employment, as well as state and lo-cal government employment by state. Printed releases include Employment of Major Local Governments, and Compendium of Public Employment.
APPENDIX A ���
ANNUAL SURvEY OF STATE AND LOCAL GOvERNMENT FINANCES
The annual survey provides current estimates of state and local govern-ment financial activity. The coverage includes all state and local governments in the United States. Local governments include counties, municipalities, townships, special districts, and school districts. The data obtained are the same as for the census and include revenue data (taxes, charges, interest, and other earnings); expenditure data (total by function, such as education and police protection, and by accounting category, such as current opera-tions and capital outlays); debt data (issuance, retirement, and amounts outstanding); and financial assets data (securities and other holdings, by type). Data collection begins each October and continues for about 12 months. This voluntarily reported data are for each government’s annual accounting period that ends on or before June 30 of the survey year, with the months covered varying by government. The survey has been conducted annually since 1952, and periodic surveys of government finances have been conducted since 1902.
It is a compilation of data from three sources: an enumeration of all 50 state governments, a survey of 13,000 selected nonschool local govern-ments (or of all 87,000 local governments for census years), and data from federal agencies. Collection methods vary by state and state agencies, and data from about 7,500 local governments are obtained in a mail-out/mail-back survey.
Local governments are selected for the survey in noncensus years by a size-based sampling procedure. The probability of a government’s selec-tion is based on the size of its long-term debt, expenditure, population, or enrollment. All local governments above variable size cutoffs (such as a population of at least 50,000) or performing key functions (such as mass transit) are selected with certainty. A new sample is usually selected every five years, the most recent one being in fiscal year 2004. Also, for fiscal years 2001 and 2003, a subset of the sample was used.
State and local government finance reports and data files are available about 12 months after the survey year. Tables provide summary data on financial activities covering state and local, state-only, and local-only gov-ernments. Finance reports include revenue by source, expenditure by func-tion, indebtedness, and financial holdings. In addition, downloadable files provide data in more detail, such as for individual governments.
��� STATE AND LOCAL GOVERNMENT STATISTICS AT A CROSSROADS
LOCAL GOvERNMENT SCHOOL SYSTEM FINANCE SURvEY (FORMERLY EDUCATION FINANCE SURvEY)
The Local Government School System Finance Survey provides statis-tics about the finances of elementary and secondary public school systems. The United States Code, Title 13, authorizes this data collection and re-sponses are voluntary. Partially funded by the National Center for Educa-tion Statistics, the survey provides current and comprehensive statistics on the financing of state public elementary and secondary education in the United States and helps determine whether funding systems have become more or less equitable over time. All public school systems that provide elementary or secondary education are covered, and private schools are excluded. The data collected include revenue by source (local property tax, monies from other school systems, private tuition and transportation pay-ments, school lunch charges, direct state aid, and federal aid passed through the state government), expenditure by function and object (instruction, support service functions, salaries, and capital outlay), indebtedness, cash and investments, direct state aid for 11 types of programs (such as general formula assistance, staff improvement, and special education); federal aid for Title I, Children with Disabilities, and Impact Aid programs; salaries and employee benefits by function; maintenance, transportation, and busi-ness activities; and spending for instructional equipment.
Reported data are for school system fiscal years, and collection begins approximately six months after the fiscal year ends and continues for the next nine months. Data has been collected annually since 1977. From 1957 to 1977, school expenditure data were collected and published as part of the annual public finance survey.
The methodology of this survey varies by year. In most fiscal years, a sample of school systems is selected as part of the larger sample of local governments used for the annual surveys of public finances and employ-ment. About 1,400 school systems that are financially dependent on a county or municipality or independent systems with enrollments of a least 10,000 are selected with certainty. Other systems are selected in propor-tion to the size of their contribution to total local government expenditure and debt. Every five years, or for years specified by the National Center for Education Statistics, all school systems are enumerated. Data for school systems are collected centrally from state education agencies, since these are part of more detailed data routinely collected for state education aid programs. A total of 23 states and the District of Columbia provide data for this program in Census Bureau format, and 27 states provide data in formats that must be converted by Census Bureau analysts.
Public Education Finances reports are released as part of the Census of Governments for years ending in 2 and 7. Reports and statistical tables
APPENDIX A ���
contain national and state aggregated data for major components of school system revenues, expenditures, debt, and assets. They also provide similar detail, per pupil, for school systems with enrollments larger than 15,000. Data files that contain full survey or enumeration data detail for each cov-ered school system are also available for download at the same site. Data for individual systems are public data and not subject to confidentiality limitations.
STATE GOvERNMENT TAX COLLECTIONS SURvEY
The Tax Collections Survey provides annual statistics on state govern-ment tax revenues for the 50 state governments. The United States Code, Title 13, authorizes this survey, and responses are voluntary. State govern-ments report tax revenues for more than 25 designated tax classifications, including sales and gross receipts, individual income, corporate income, motor fuels, motor vehicle licenses, and severance taxes. In each tax classi-fication, detail is specific to the revenue structure of each individual state.
Data collection begins in October and continues for about nine months. Data are reported for tax collections during the states’ preceding fiscal year. Most states provide data in a mail-out/mail-back survey, but several states provide data in diverse individual formats that must be converted by the Census Bureau. Forms are sent to agencies in each state that are responsible for tax collections (such as revenue departments and budget and finance offices), and up to 10 agencies in a state may be contacted.
State Government Tax Collections reports are released approximately nine months after the reference period. The reports contain national totals by type of tax with historical comparisons and state totals for major taxes, including detail where available. Additional statistics are provided on fis-cal years, population, and taxes per capita. Included are definitions for the designated tax classifications and footnotes explaining any major changes in state tax codes.
QUARTERLY TAX SURvEY
The Quarterly Tax Survey provides estimates of state and local gov-ernment tax revenues. All state and local governments in the United States that have tax collection authority are covered. Government tax authorities report tax revenues by type of tax. Most local governments report only property tax collections, and some report significant nonproperty revenues, such as income and sales taxes. State governments report data for more than 25 types of taxes, including personal income, sales, corporate income, motor fuel sales, motor vehicle license, and death and gift taxes.
Data are reported for tax collections during the preceding calendar
��� STATE AND LOCAL GOVERNMENT STATISTICS AT A CROSSROADS
quarter. Data collection begins one month after each quarter and continues for about three months. Data collection has been quarterly since 1962.
The survey is in two parts: a mail-out/mail-back data collection of all 50 states and over 100 local governments with significant nonproperty tax collections and a mail-out/mail-back survey of about 6,000 selected local property tax collection agencies. Actual tax data are collected for state-level taxes and local governments with significant nonproperty taxes.
Property taxes of local governments are estimated from a sample of 530 county areas, selected using a stratified sample procedure. All local tax collectors in county areas with population exceeding 200,000 and all cities and counties with quarterly tax revenue exceeding $60 million are selected with certainty. A random sample is taken within each remaining stratum. In each selected county area, all local property tax authorities receive a form, with the number of tax authorities in an area ranging from one to hundreds. Samples of local governments are reselected every five years. National estimates are a summation of state and weighted local government property tax data based on survey results. Imputation of nonproperty tax collections in smaller local governments is based on data collected from the annual finance survey.
Quarterly Summary of State and Local Government Tax Revenue reports are released 4 months after each quarterly reference period. The reports contain national totals by type of tax with historical comparisons and state totals for major taxes in the state governments. Revisions to his-torical data reflect the replacement of estimates with actual totals, and all data become final after one year.
ANNUAL PUBLIC EMPLOYMENT SURvEY
The Annual Public Employment Survey provides current estimates of state and local government employment and payrolls. All state and local governments in the United States are covered. Local governments include counties, cities, townships, special districts, and school districts.
This is the only source of public employment data by program function and selected job categories. Data on employees include number of full- and part-time workers, gross pay, and hours paid for part-time employees (to calculate full-time-equivalent employment). Data by function include 25 primary functions, such as education, hospitals, police protection, public welfare, and highways. Data for job categories are limited to major catego-ries, such as instructional employees in education and public safety officers in police protection. Computed statistics include full-time-equivalent em-ployment (adjusting the number of hours worked by part-time employees to full-time equivalents), and average earnings for full-time employees. The survey is conducted in noncensus years. Reported data are for each
APPENDIX A ���
government’s mid-March pay period. Data collection and processing begin late in March and continue for about seven months.
This survey is a compilation of data from 3 sources: an enumeration of all 50 state governments, a two-stage, stratified sample survey of about 11,000 selected local governments, and data from federal agencies. By co-operative agreement, data for state agencies in 30 states and school systems in 4 states are consolidated and submitted by a single state agency (usually in electronic format). Data for agencies in other states and about 10,000 selected local governments are obtained in a mail-out/mail-back survey. Based on the survey and prior census results, weighted-data estimates are made of employment by all local governments. The 11,000 sample con-sists of 4,900 local governments that are selected with certainty, based on population size by type of government or the performance of key govern-ment functions, and 6,100 additional governments are selected based on state area and size of financial activity. A new sample is selected every five years.
Public Employment reports provide U.S. and state area data about 10 months after the reference month (each March). Data content includes measures of full- and part-time employment, full-time-equivalent employ-ment, payrolls, average earnings, and selected historical data. Data are shown in total and by function. Similar content is included for each level of government. Reports consist of viewable tables and data files that users can download from the Internet.
STATE AND LOCAL GOvERNMENT PUBLIC EMPLOYEE RETIREMENT SYSTEM SURvEY
The Annual Public Employee Retirement System Survey provides cur-rent estimates of state and local government employment and payrolls. It includes all state and local government employee retirement systems providing defined benefit plans in the United States. Data are obtained on contributions from employees and employers, benefit and other payments, total assets and investment holdings, membership, and monthly beneficiary payments.
Data collection and processing begin in mid-October and continue for about eight months. Reported data are for each public employee retirement system’s annual accounting period that ends on or before June 30 of the survey year.
In census years, all public employee retirement systems are canvassed through a mail-out/mail-back survey. For the annual survey cycle, govern-ments with public employee retirement systems that are selected for the Annual Finance Survey sample are canvassed. State and local government public employee retirement reports and data files are available about 10
��� STATE AND LOCAL GOVERNMENT STATISTICS AT A CROSSROADS
months after the survey year. Tables provide summary data on financial activities covering state and local, state-only, and local-only governments. Retirement reports include receipts by source, payments, financial holdings, membership, and benefit payments. In addition, downloadable files provide data in more detail for individual governments.
QUARTERLY PUBLIC EMPLOYEE RETIREMENT SYSTEMS SURvEY
The Quarterly Public Employee Retirement Systems Survey provides summary data on the assets, revenue, and expenditure of the 100 largest public employee retirement systems. The data cover about 85 percent of national activity among such entities. Data are collected on the financial holdings and activities of these largest public employment retirement sys-tems that are identified based on the value of their assets, as shown in the most recent Census of Governments. The financial holdings data show as-sets in various types of securities, such as stocks, bonds, federal notes, and mortgages. Revenue data consist of earnings, as well as contributions from governments and employees. Expenditure data are primarily payments to beneficiaries and administrative costs. Data collection starts at the begin-ning of each calendar quarter and continues for about three months. Col-lection is by means of a mail-out/mail-back survey.
Quarterly Summary of Public-Employee Retirement Systems reports are published about four months after each calendar quarter. Summary tables show national financial transactions in the largest public employee retirement systems and trends for the past five years.
DIRECTORY SURvEY OF LOCAL GOvERNMENTS
The Directory Survey of Local Governments is one of three phases of the census. It identifies local governments for the Census of Governments, and provides selected data on local governments. All local governments in the United States, including counties, municipalities, townships, school districts and special districts, are covered. A government organization must be an identifiable entity, have a governmental character, be active at the start of the census year, and operate with substantial autonomy. The data collected include information on name and addresses, functions performed (such as education, health services, police protection), fiscal year endings, and areas served (such as partial, whole, or multicounty areas). This sur-vey is conducted every five years, just prior to the census and produces an updated list of all local governments and selected data.
For the organization phase, releases are available within a year of the census year. Public releases include electronic files and Internet tables first, followed by printed reports.
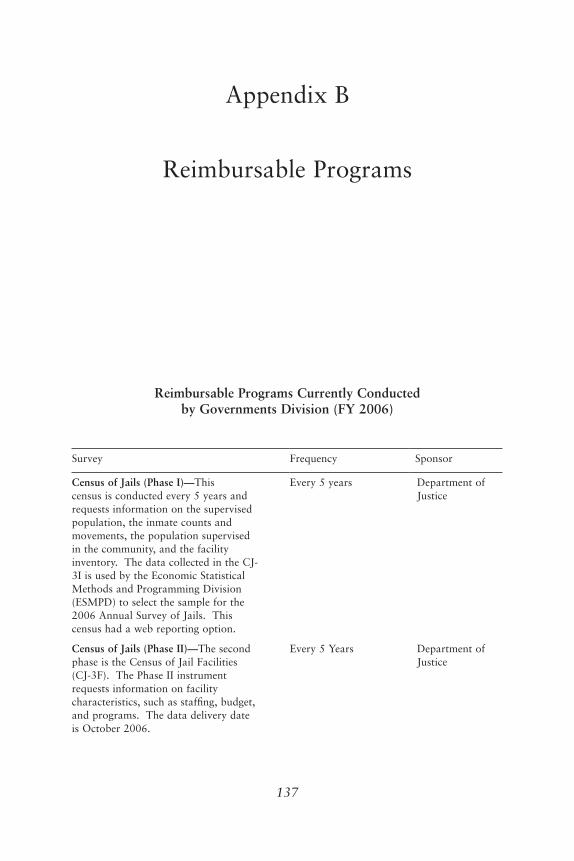
Appendix B
Reimbursable Programs
Reimbursable Programs Currently Conducted by Governments Division (FY 2006)
Survey Frequency Sponsor
Census of Jails (Phase I)—This census is conducted every 5 years and requests information on the supervised population, the inmate counts and movements, the population supervised in the community, and the facility inventory. The data collected in the CJ-3I is used by the Economic Statistical Methods and Programming Division (ESMPD) to select the sample for the 2006 Annual Survey of Jails. This census had a web reporting option.
Every 5 years Department of Justice
Census of Jails (Phase II)—The second phase is the Census of Jail Facilities (CJ-3F). The Phase II instrument requests information on facility characteristics, such as staffing, budget, and programs. The data delivery date is October 2006.
Every 5 Years Department of Justice
���
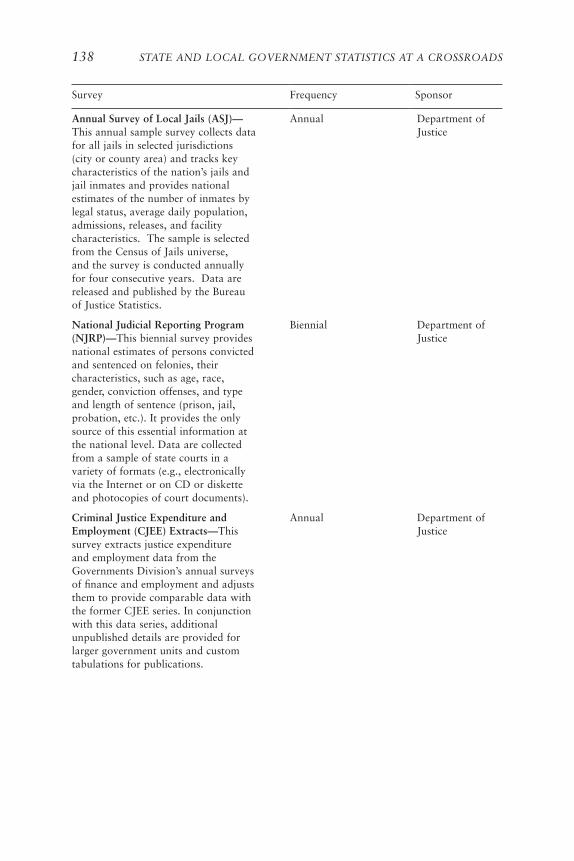
��� STATE AND LOCAL GOVERNMENT STATISTICS AT A CROSSROADS
Survey Frequency Sponsor
Annual Survey of Local Jails (ASJ)—This annual sample survey collects data for all jails in selected jurisdictions (city or county area) and tracks key characteristics of the nation’s jails and jail inmates and provides national estimates of the number of inmates by legal status, average daily population, admissions, releases, and facility characteristics. The sample is selected from the Census of Jails universe, and the survey is conducted annually for four consecutive years. Data are released and published by the Bureau of Justice Statistics.
Annual Department of Justice
National Judicial Reporting Program (NJRP)—This biennial survey provides national estimates of persons convicted and sentenced on felonies, their characteristics, such as age, race, gender, conviction offenses, and type and length of sentence (prison, jail, probation, etc.). It provides the only source of this essential information at the national level. Data are collected from a sample of state courts in a variety of formats (e.g., electronically via the Internet or on CD or diskette and photocopies of court documents).
Biennial Department of Justice
Criminal Justice Expenditure and Employment (CJEE) Extracts—This survey extracts justice expenditure and employment data from the Governments Division’s annual surveys of finance and employment and adjusts them to provide comparable data with the former CJEE series. In conjunction with this data series, additional unpublished details are provided for larger government units and custom tabulations for publications.
Annual Department of Justice
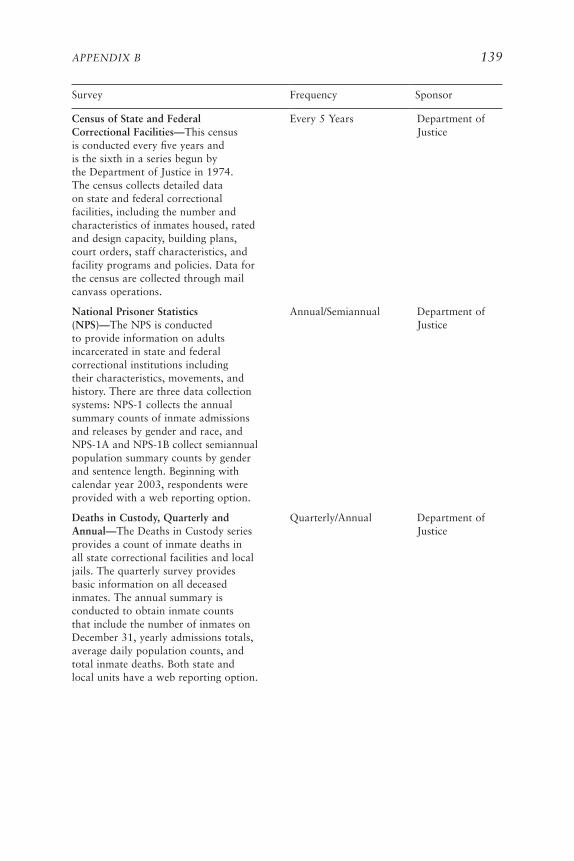
APPENDIX B ���
Survey Frequency Sponsor
Census of State and Federal Correctional Facilities—This census is conducted every five years and is the sixth in a series begun by the Department of Justice in 1974. The census collects detailed data on state and federal correctional facilities, including the number and characteristics of inmates housed, rated and design capacity, building plans, court orders, staff characteristics, and facility programs and policies. Data for the census are collected through mail canvass operations.
Every 5 Years Department of Justice
National Prisoner Statistics (NPS)—The NPS is conducted to provide information on adults incarcerated in state and federal correctional institutions including their characteristics, movements, and history. There are three data collection systems: NPS-1 collects the annual summary counts of inmate admissions and releases by gender and race, and NPS-1A and NPS-1B collect semiannual population summary counts by gender and sentence length. Beginning with calendar year 2003, respondents were provided with a web reporting option.
Annual/Semiannual Department of Justice
Deaths in Custody, Quarterly and Annual—The Deaths in Custody series provides a count of inmate deaths in all state correctional facilities and local jails. The quarterly survey provides basic information on all deceased inmates. The annual summary is conducted to obtain inmate counts that include the number of inmates on December 31, yearly admissions totals, average daily population counts, and total inmate deaths. Both state and local units have a web reporting option.
Quarterly/Annual Department of Justice
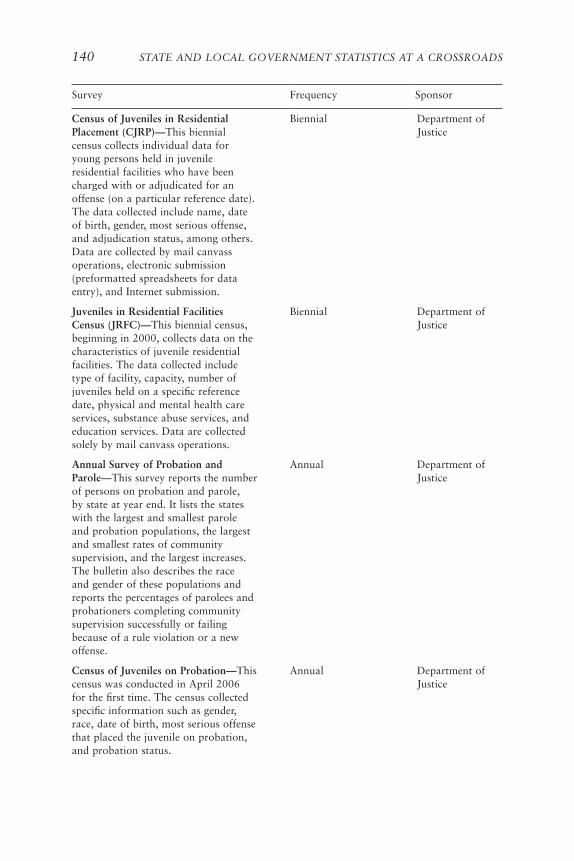
��0 STATE AND LOCAL GOVERNMENT STATISTICS AT A CROSSROADS
Survey Frequency Sponsor
Census of Juveniles in Residential Placement (CJRP)—This biennial census collects individual data for young persons held in juvenile residential facilities who have been charged with or adjudicated for an offense (on a particular reference date). The data collected include name, date of birth, gender, most serious offense, and adjudication status, among others. Data are collected by mail canvass operations, electronic submission (preformatted spreadsheets for data entry), and Internet submission.
Biennial Department of Justice
Juveniles in Residential Facilities Census (JRFC)—This biennial census, beginning in 2000, collects data on the characteristics of juvenile residential facilities. The data collected include type of facility, capacity, number of juveniles held on a specific reference date, physical and mental health care services, substance abuse services, and education services. Data are collected solely by mail canvass operations.
Biennial Department of Justice
Annual Survey of Probation and Parole—This survey reports the number of persons on probation and parole, by state at year end. It lists the states with the largest and smallest parole and probation populations, the largest and smallest rates of community supervision, and the largest increases. The bulletin also describes the race and gender of these populations and reports the percentages of parolees and probationers completing community supervision successfully or failing because of a rule violation or a new offense.
Annual Department of Justice
Census of Juveniles on Probation—This census was conducted in April 2006 for the first time. The census collected specific information such as gender, race, date of birth, most serious offense that placed the juvenile on probation, and probation status.
Annual Department of Justice
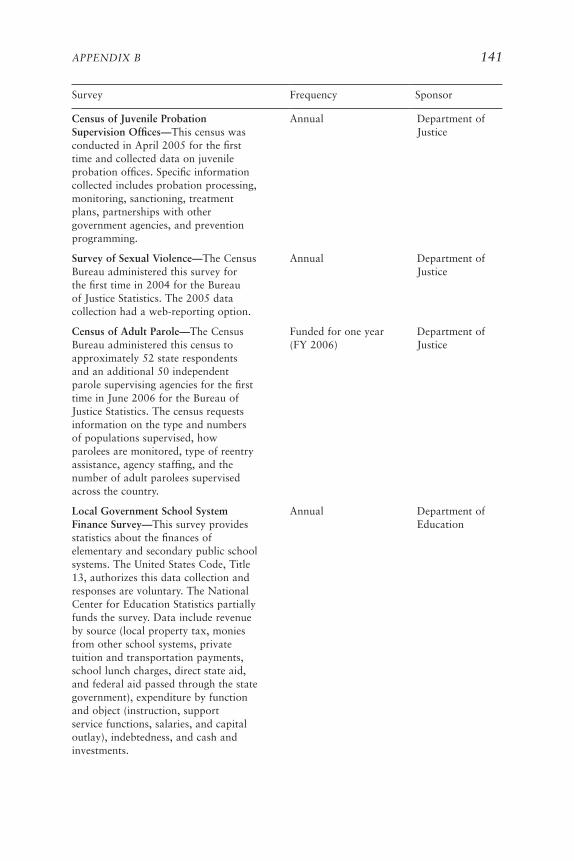
APPENDIX B ���
Survey Frequency Sponsor
Census of Juvenile Probation Supervision Offices—This census was conducted in April 2005 for the first time and collected data on juvenile probation offices. Specific information collected includes probation processing, monitoring, sanctioning, treatment plans, partnerships with other government agencies, and prevention programming.
Annual Department of Justice
Survey of Sexual violence—The Census Bureau administered this survey for the first time in 2004 for the Bureau of Justice Statistics. The 2005 data collection had a web-reporting option.
Annual Department of Justice
Census of Adult Parole—The Census Bureau administered this census to approximately 52 state respondents and an additional 50 independent parole supervising agencies for the first time in June 2006 for the Bureau of Justice Statistics. The census requests information on the type and numbers of populations supervised, how parolees are monitored, type of reentry assistance, agency staffing, and the number of adult parolees supervised across the country.
Funded for one year (FY 2006)
Department of Justice
Local Government School System Finance Survey—This survey provides statistics about the finances of elementary and secondary public school systems. The United States Code, Title 13, authorizes this data collection and responses are voluntary. The National Center for Education Statistics partially funds the survey. Data include revenue by source (local property tax, monies from other school systems, private tuition and transportation payments, school lunch charges, direct state aid, and federal aid passed through the state government), expenditure by function and object (instruction, support service functions, salaries, and capital outlay), indebtedness, and cash and investments.
Annual Department of Education

��� STATE AND LOCAL GOVERNMENT STATISTICS AT A CROSSROADS
Survey Frequency Sponsor
National Public Education Financial Survey—This survey includes education finance data for the 50 states, the District of Columbia, American Samoa, Guam, Northern Marianas, Puerto Rico, and the Virgin Islands. Data are obtained on employees, by program function, and for selected job categories. Data on employees include the number of full- and part-time, gross pay, and hours paid for part-time employees (to calculate full-time equivalent employment). Data by function include 25 primary functions, such as education, hospitals, police protection, public welfare, and highways. Data for job categories are limited to major categories, such as instructional employees in education and public safety officers in police protection.
Annual Department of Education
Medical Expenditure Panel Survey (MEPS)—Data are obtained on health insurance enrollment and premiums for active and retired employees. Economic Planning and Coordination Division coordinates the MEPS project, the private-sector data, and all deliverables. The Governments Division is responsible for collection and editing for all state governments, all local governments with 5,000 or more employees, and a sample of other local governments.
Annual Department of Health and Human Services
Public Libraries Survey—States report information about service measures, such as users of electronic resources, Internet terminals, reference transactions, public service hours, interlibrary loans, circulation, library visits, size of collections, staffing, operating revenues and expenditures, and number of service outlets. Data are collected by the 50 states, the District of Columbia, and five outlying areas with approximately 9,100 libraries and approximately 17,000 individual outlets.
Annual Department of Education
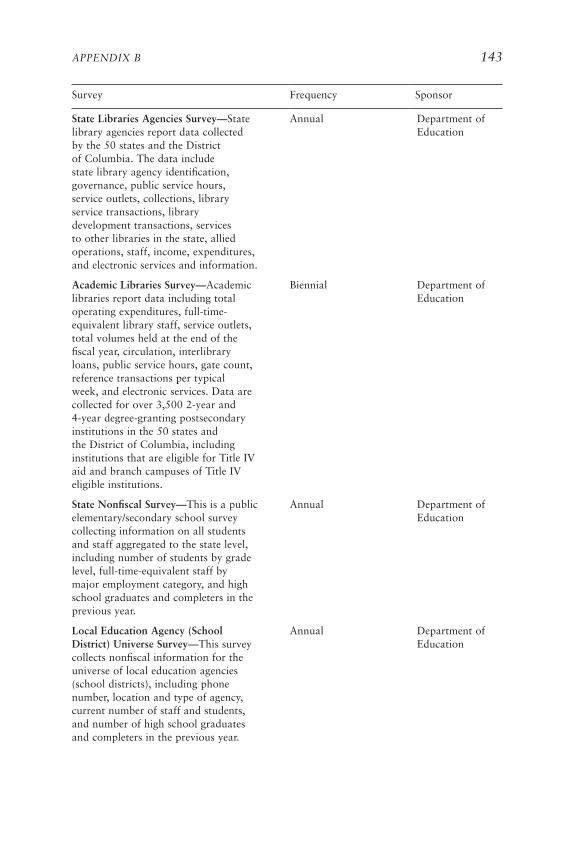
APPENDIX B ���
Survey Frequency Sponsor
State Libraries Agencies Survey—State library agencies report data collected by the 50 states and the District of Columbia. The data include state library agency identification, governance, public service hours, service outlets, collections, library service transactions, library development transactions, services to other libraries in the state, allied operations, staff, income, expenditures, and electronic services and information.
Annual Department of Education
Academic Libraries Survey—Academic libraries report data including total operating expenditures, full-time-equivalent library staff, service outlets, total volumes held at the end of the fiscal year, circulation, interlibrary loans, public service hours, gate count, reference transactions per typical week, and electronic services. Data are collected for over 3,500 2-year and 4-year degree-granting postsecondary institutions in the 50 states and the District of Columbia, including institutions that are eligible for Title IV aid and branch campuses of Title IV eligible institutions.
Biennial Department of Education
State Nonfiscal Survey—This is a public elementary/secondary school survey collecting information on all students and staff aggregated to the state level, including number of students by grade level, full-time-equivalent staff by major employment category, and high school graduates and completers in the previous year.
Annual Department of Education
Local Education Agency (School District) Universe Survey—This survey collects nonfiscal information for the universe of local education agencies (school districts), including phone number, location and type of agency, current number of staff and students, and number of high school graduates and completers in the previous year.
Annual Department of Education
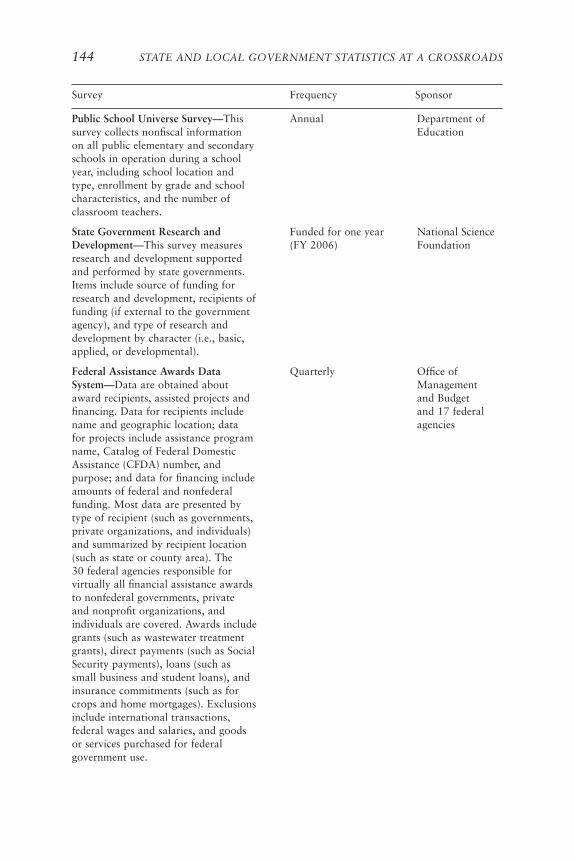
��� STATE AND LOCAL GOVERNMENT STATISTICS AT A CROSSROADS
Survey Frequency Sponsor
Public School Universe Survey—This survey collects nonfiscal information on all public elementary and secondary schools in operation during a school year, including school location and type, enrollment by grade and school characteristics, and the number of classroom teachers.
Annual Department of Education
State Government Research and Development—This survey measures research and development supported and performed by state governments. Items include source of funding for research and development, recipients of funding (if external to the government agency), and type of research and development by character (i.e., basic, applied, or developmental).
Funded for one year (FY 2006)
National Science Foundation
Federal Assistance Awards Data System—Data are obtained about award recipients, assisted projects and financing. Data for recipients include name and geographic location; data for projects include assistance program name, Catalog of Federal Domestic Assistance (CFDA) number, and purpose; and data for financing include amounts of federal and nonfederal funding. Most data are presented by type of recipient (such as governments, private organizations, and individuals) and summarized by recipient location (such as state or county area). The 30 federal agencies responsible for virtually all financial assistance awards to nonfederal governments, private and nonprofit organizations, and individuals are covered. Awards include grants (such as wastewater treatment grants), direct payments (such as Social Security payments), loans (such as small business and student loans), and insurance commitments (such as for crops and home mortgages). Exclusions include international transactions, federal wages and salaries, and goods or services purchased for federal government use.
Quarterly Office of Management and Budget and 17 federal agencies
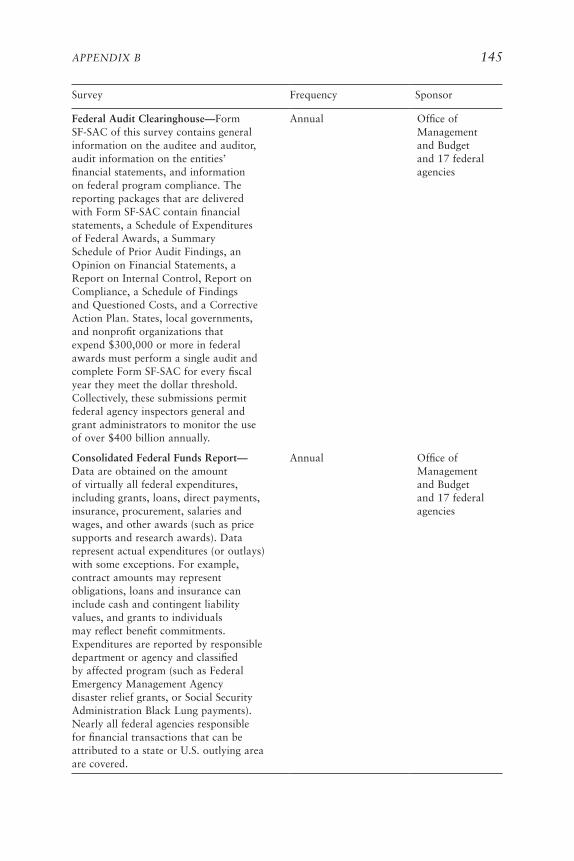
APPENDIX B ���
Survey Frequency Sponsor
Federal Audit Clearinghouse—Form SF-SAC of this survey contains general information on the auditee and auditor, audit information on the entities’ financial statements, and information on federal program compliance. The reporting packages that are delivered with Form SF-SAC contain financial statements, a Schedule of Expenditures of Federal Awards, a Summary Schedule of Prior Audit Findings, an Opinion on Financial Statements, a Report on Internal Control, Report on Compliance, a Schedule of Findings and Questioned Costs, and a Corrective Action Plan. States, local governments, and nonprofit organizations that expend $300,000 or more in federal awards must perform a single audit and complete Form SF-SAC for every fiscal year they meet the dollar threshold. Collectively, these submissions permit federal agency inspectors general and grant administrators to monitor the use of over $400 billion annually.
Annual Office of Management and Budget and 17 federal agencies
Consolidated Federal Funds Report—Data are obtained on the amount of virtually all federal expenditures, including grants, loans, direct payments, insurance, procurement, salaries and wages, and other awards (such as price supports and research awards). Data represent actual expenditures (or outlays) with some exceptions. For example, contract amounts may represent obligations, loans and insurance can include cash and contingent liability values, and grants to individuals may reflect benefit commitments. Expenditures are reported by responsible department or agency and classified by affected program (such as Federal Emergency Management Agency disaster relief grants, or Social Security Administration Black Lung payments). Nearly all federal agencies responsible for financial transactions that can be attributed to a state or U.S. outlying area are covered.
Annual Office of Management and Budget and 17 federal agencies

Appendix C
Letters on the Taxable Property Value Survey
���
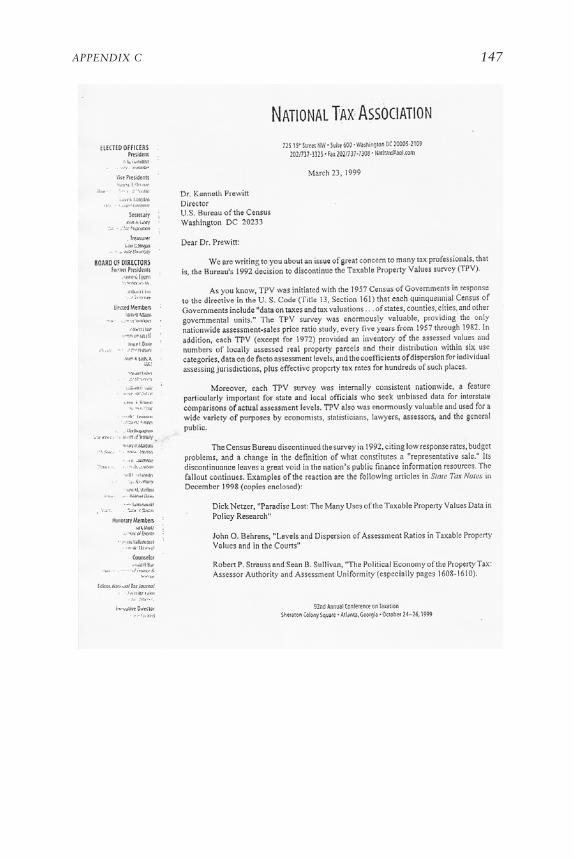
APPENDIX C ���
C - 2
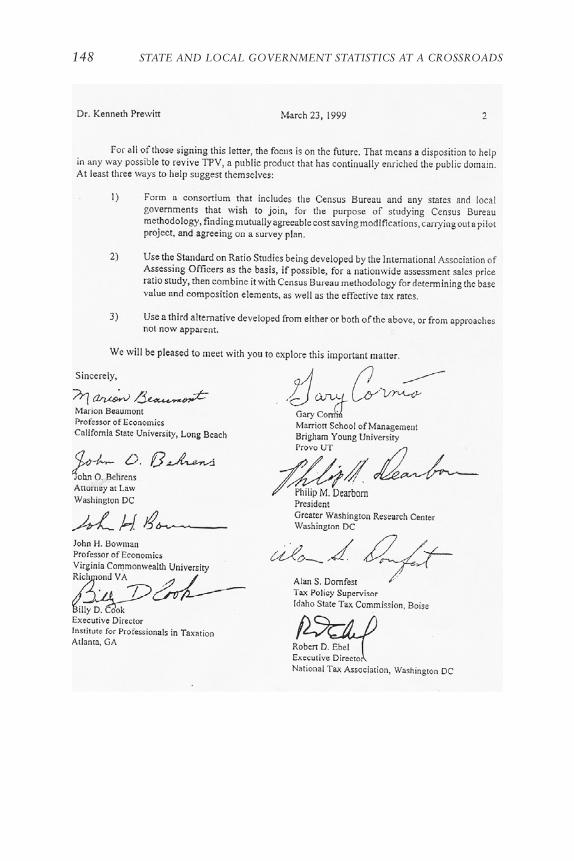
��� STATE AND LOCAL GOVERNMENT STATISTICS AT A CROSSROADS
C - 3
APPENDIX C ���
C - 4
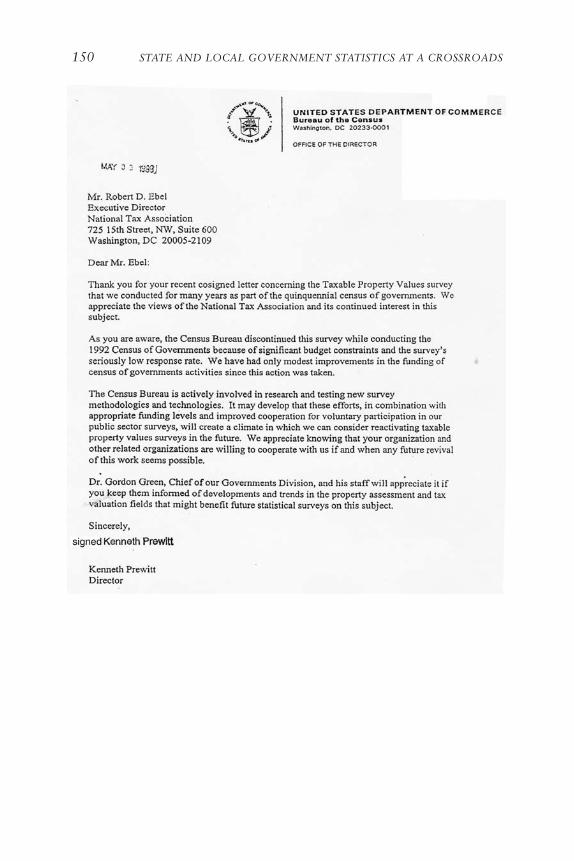
��0 STATE AND LOCAL GOVERNMENT STATISTICS AT A CROSSROADS
Appendix D
Summary of Presentations of Public Interest and Other User Groups
Public interest groups use the Governments Division data on state and local government organization, finances, and employment as the basis for tracing changes in the well-being of their constituents,
for analyzing general government trends, and for research, advocacy, and lobbying purposes. The panel benefited from the participation of several organizations which shared their concerns and suggestions in a meeting of a subgroup of the panel and in the workshop. Though each organization differs in its needs and uses of the Governments Division data, some com-mon themes were developed. This appendix summarizes their presentations on data needs and uses.
FEDERATION OF TAX ADMINISTRATORS
The Federation of Tax Administrators (FTA) finds the government finance series to be the best, most consistent data across states, and the federation uses this series widely.1 The main drawback is the slow release of the state and local data. FTA also cited the gaps in the 2001 and 2003 state and local data as a key concern (see Chapter 2) and stressed the im-portance of having consistent data across states and over time from the Governments Division.
1 Based on a presentation by Ron Alt, Federation of Tax Administrators, at the panel’s meet-ing with data users, May 9, 2006.
���
��� STATE AND LOCAL GOVERNMENT STATISTICS AT A CROSSROADS
GOvERNMENTAL RESEARCH ASSOCIATION
The Governmental Research Association (GRA),2 an association of 40–45 individual, primarily nonpartisan research organizations represent-ing a majority of the states, is interested in finding information that will help policy makers at the state and local government levels. Member or-ganizations represent all levels of government, including municipal, state, and regional groups.
It is the association’s understanding that all of its member organizations use the Governments Division data in their research. Due to small staff size (sometimes only one or two staff people) and the heavy workload of many of GRA members, however, only a few individual organizations responded to GRA’s solicitation for feedback.
The products the members use and the frequency with which they ac-cess the data suggest that they conduct many ranking studies to determine how their governments compare with similar governments. The responding organizations noted the importance of the consistency and standardization of the data from the Governments Division and particularly the useful-ness of the data from the Census of Governments and the annual financial reports. The data bring all the information into one source, include de-tailed footnotes, and provide a standard for interstate finance comparisons, which, for such small organizations, is vital for independent researchers in conducting research with minimal consultation with the Governments Division staff.
Members expressed concerns related to the timeliness and quality of the data. In terms of timeliness, a 2-year lag for annual surveys would seem rea-sonable for the type of work many members conduct. However, data with a 4-year lag were described as “ancient history.” In addition to timeliness, the groups noted five other areas needing improvement—comparability, ac-curacy, disaggregation, nonreporting, and financial reporting standards.
The represented GRA organizations are very interested in comparisons across governments. In particular, municipal spending line items vary widely across municipalities, and direct comparisons may be inaccurate if what underlies the numbers is not known. In some instances, the Governments Division provides tables of aggregate numbers for counties and municipali-ties that leave the researchers with more questions than answers. The Utah Foundation noted a case of the division’s data on education spending not matching the actual state spending on record. The foundation suggested that this discrepancy had to do with what is or is not included in each mea-
2 Based on presentations by Eric Lupher, Citizens Research Council of Michigan and a mem-ber of the Governmental Research Association, during the panel’s meeting with data users, May 9, 2006, and by Phyllis Resnick, director, New West Economics, and director, Govern-mental Research Association, during the panel’s workshop, June 22, 2006.
APPENDIX D ���
sure. The case in Utah and the difficulty in using the aggregate tables are examples for which disaggregated data would help to solve some discrepan-cies and enable more meaningful comparisons across governments.
The GRA offered suggestions related to time lags in the receipt of data and financial reporting standards. It noted that about half of the states have centralized reporting systems, which allow them to report informa-tion to the Governments Division and other data users in a timely manner. It suggested that the Governments Division provide incentives to promote central reporting. The GRA also suggested that the division should work with vendors of financial reporting software to standardize definitions and prepackaged reports. Finally, in terms of timeliness, the GRA users would be happy to have preliminary reports available. To them, there is a value to having the numbers earlier, even if they are not complete at the time of first delivery.
NATIONAL ASSOCIATION OF COUNTIES
The National Association of Counties (NACO) uses the Governments Division data in responding to information requests from policy makers and reporters; it also directs inquiries about county information to the division’s website.3 In its lobbying work and research, NACO uses virtu-ally all of the data products from the division; aggregate data are particu-larly helpful. It uses the data in electronic form but occasionally asks for special reports and information that cannot be accessed online. The most valuable product from the Governments Division for this group is the gov-ernment organization publication, which describes the scheme of govern-ments across the country. Accounting requirements, in addition to general governmental organization, vary among states. The aggregate charts and percentages, especially for employment data, are very helpful for NACO’s work. The value of the financial data from the Governments Division is their uniformity; the main problem is that the data are not specific enough, particularly the expenditure data.
NATIONAL ASSOCIATION OF STATE RETIREMENT ADMINISTRATORS
The National Association of State Retirement Administrators (NASRA) uses data from the Governments Division chiefly to get a global sense of
3 Based on a presentation of Jackie Byers, National Association of Counties, during the panel’s meeting with data users, May 9, 2006. The National Association of State Budget Of-ficers has similar uses of the data, based on a presentation of Stacy Mazer during the same meeting.
��� STATE AND LOCAL GOVERNMENT STATISTICS AT A CROSSROADS
retirement plans.4 Total expenditures and revenue are helpful, but it would benefit from having these items disaggregated by function and source.
In terms of drawbacks in the Governments Division products, the as-sociation noted that timeliness is an issue, although the data have been even less timely in the past than now. Quarterly or semiannual data would be helpful in NASRA’s work, but given that it takes about six months to com-plete a comprehensive annual financial report (CAFR), NASRA recognizes the difficulty of generating such data and noted that having them is not as vital as having annual data that are more timely.
NATIONAL CONFERENCE OF STATE LEGISLATURES
The National Conference of State Legislatures (NCSL) makes most use of the quarterly and annual financial surveys for trend analysis and inter-state comparisons.5 Many of its publications on fiscal policies, such as its 1999 study of user charges and its series of reports on local property taxes from 2002–2004, rely on the Governments Division tax surveys. The kind of analysis and reporting done in those publications would be impossible in the absence of the division’s data compilations. NCSL also uses the division’s data for less formal responses to questions from state legislators, legislative staff, and other NCSL staff on state and local revenues and ex-penditures. The long-standing presentation of tax and expenditure data has served the conference’s needs well. NCSL would like to have more timely data but understands the difficulty of collecting and presenting data, since the conference itself has been unable to present state tax legislation in less than eight months after state legislative sessions end.
State government expenditure data are essential. The NCSL is not confident that its own annual state expenditure surveys capture the data as accurately as the Governments Division surveys, partly because the divi-sion’s surveys are done after states have completed their reports and partly because the division’s surveys are much more structured and detailed than the NCSL surveys. For time series and trend analyses, the Governments Division data are irreplaceable. NCSL makes less use of local government expenditure data than of revenue data because its concern is state policy, which tends to affect local government revenues more directly than local government expenditures, but the division is the only comprehensive source of local government expenditure data.
The NCSL staff makes less use of the Census of Governments, the quar-
4 Based on a presentation by Keith Brainerd, National Association of State Retirement Ad-ministrators, at the panel’s meeting with data users, May 9, 2006.
5 Based on a submission from Ron Snell, director of services for the National Conference of State Legislatures, in response to panel questions.
APPENDIX D ���
terly financial surveys, and the retirement system surveys. In their view, it would be useful for the Governments Division to compare the current funding status of state retirement systems with their actuarial accrued li-abilities. NCSL noted that estimates of accrued liabilities would be a useful but difficult addition to the Governments Division data collection.
NATIONAL LEAGUE OF CITIES
The National League of Cities (NLC) uses the Census of Governments primarily for its financial analyses, mainly the data on revenues and expen-ditures of cities by state because the league finds the census to be the best data source.6 NLC offered four suggestions for improving how and what the Governments Division collects:
1. Show information for smaller cities, since the cutoffs for the pub-lished Census of Governments data (usually 25,000 population and sometimes 10,000) do not permit full coverage of NLC’s members.
2. Pick up the “general funds” of the cities in question. The reporting of city financial data is usually across a set of funds. All cities use what is called a general fund together with a series of other types of funds—enterprise funds, utility funds, internal service funds, etc. The Census of Governments uses a different definition under the title of “general revenues” or “general expenditures,” but the fund types get mingled across the Census of Governments defini-tions. According to NLC, the data would be more relevant if they included the general funds of the cities in question.
3. Put the state-by-state data online, at a greater level of detail. 4. Finally, identify whether gaps in the data for a city were attribut-
able to nonresponse and indicate when the city last responded, so that the researchers can directly link back to the most recent reported data.
NLC would like to see information on public officials—the number, their demographics and salaries, and so on—formerly published from the Census of Governments survey every five years become available once again. These data have not been published since 1992, and the information is no longer collected.
Researchers of local governments are challenged in making across-gov-
6 Based on presentations by Christiana Brennan, the National League of Cities, during the panel’s meeting with data users, May 9, 2006, and by Michael Pagano, National League of Cities and the University of Illinois at Chicago, at the panel’s workshop, June 22, 2006.

��� STATE AND LOCAL GOVERNMENT STATISTICS AT A CROSSROADS
ernment comparisons. They must understand the constraints under which government officials operate, specifically in the area of taxes and expendi-tures. NLC staff offered two examples of per capita tax measures as inac-curate indicators of tax burden on a population: Ohio, where commuter taxes are collected from people living outside the city in which they work, and Alaska, where taxes are paid by non-Alaskan citizens. Incorporating the Government Accounting Standards Board (GASB) Statement 34 guide-lines into the Governments Division reports might be helpful, as it would force researchers to think about the implications of problems in current budgets. The timeliness of the Governments Division data is an issue. The annual city fiscal conditions report is the closest the NLC is able to come to providing information on what is happening in the current budget year.
Appendix E
Meeting and Workshop Agendas
FIRST MEETING
January 26–27, 2006Room 110, The Keck Center
The National Academies500 Fifth Street, Washington, DC 20001
Closed Session
Thursday, January 26
12:00–1:00 p.m. Welcome and Panel Introductions Richard Nathan, Chair Michael Feuer, Executive Director, Division of Behavioral and Social Sciences and Education Constance Citro, Director, Committee on National Statistics
Bias and Conflict of Interest Discussion Kirsten Sampson Snyder 1:00–1:45 p.m. Overview of the Agenda Richard Nathan, Chair Begin Discussion of the Statement of Work Panel Discussion
1:45–2:00 p.m. Break
���

��� STATE AND LOCAL GOVERNMENT STATISTICS AT A CROSSROADS
Open Session
2:00–3:30 p.m. Status of the State and Local Government Statistics Programs of the Census Bureau
Thomas L. Mesenbourg, Associate Director for Economic Programs (invited) Stephanie H. Brown, Chief, Governments Division Henry S. Wulf, Assistant Division Chief for Recurring Programs, Governments Division 3:30–5:30 p.m. Discussion of State and Local Government Statistics
Program Issues Richard Nathan, Chair
5:30 p.m. Adjourn for the Day
6:30–8:00 p.m. Working Dinner
Closed Session
Friday, January 27
8:30–10:00 a.m. Working Session• Review information sharing exercise from prior
day; identify needed adjustments to approach• Discuss issues to be examined in workshop;
develop plans to address each; assign panel responsibilities
• Develop plans for workshop
10:00–10:15 a.m. Break
10:15 a.m.–12:00 p.m. Working Session Continues
12:00–1:00 p.m. Lunch
1:00–1:00 p.m. Working Session• Revisit adequacy of panel expertise• Determine if consultant assistance is needed• Discuss audience for final report• Develop outline of final report• Develop plans for future meetings
3:00 p.m. Adjourn

APPENDIX E ���
WORKSHOP AGENDA
June 22–23, 2006Room 109, The Keck Center
The National Academies500 Fifth Street, Washington, DC 20001
Thursday, June 22
Closed Session
8:00–9:00 a.m. Organizational Meeting of Panel Richard Nathan, Chair
Open Session
9:00–9:30 a.m. Welcoming Remarks: State and Local Government Statistics in a Changing Environment
Richard Nathan, Chair
9:30–10:30 a.m. Census Bureau Appraisal of Status of Programs Yolanda Kodrzycki, Moderator Thomas L. Mesenbourg, Associate Director for Economic Programs (invited) Stephanie H. Brown, Chief, Governments Division Henry S. Wulf, Assistant Division Chief for Recurring Programs, Governments Division
10:30–10:45 a.m. Break 10:45 a.m.– Discussion of Standards for State and Local Data12:30 p.m. David Miller, Moderator Ken Schermann, Government Accounting Standards Board Richard Raphael, Fitch Ratings

��0 STATE AND LOCAL GOVERNMENT STATISTICS AT A CROSSROADS
Open Discussion
12:30–1:30 p.m. Luncheon Speaker Anne Jordon, Managing Editor, Governing Magazine
1:30–2:30 p.m. Federal/National Users Bob Parker, Moderator Dennis Fixler, Bureau of Economic Analysis, U.S. Department of Commerce Paul Smith, Flow of Funds Section, Division of Research and Statistics, Board of Governors, Federal Reserve System 2:30–3:30 p.m. State and Local Government Users/Nonprofits
(NACO, NCSL, DEA, others) Bob Stauss, Moderator Phyllis Resnick, Director, New West Economics and Director, Governmental Research
Association Evelina Moulder, International City/County Management Association Michael Pagano, National League of Cities
3:30–3:45 p.m. Break
3:45–4:30 p.m. Research Community Users Yolanda Kodrzycki, Moderator Kim Rueben, Urban Institute George Palumbo, Canisius College Andrew Reschovsky, University of Wisconsin 4:30–5:30 p.m. “Open Mike” Time: Discussion of Data Uses Richard Nathan, Moderator
6:00–8:00 p.m. Working Dinner

APPENDIX E ���
Friday, June 23
Open Session
8:30–9:45 a.m. Dissemination and Education Issues John Knapp, Moderator Toward a More User-Friendly Web Site Bill Shobe, Weldon Cooper Center for Public Service, University of Virginia
Experience of the Urban Institute in Building a State and Local Government Database
Kim Rueben, Urban Institute
Open Discussion
9:45–10:00 a.m. Break
10:00–11:30 a.m. Methodological Issues David Marker and John Czajka, Moderators
Recent Progress in Statistical Methodology Carma Hogue, Census Bureau
Presentation of Issues in Statistical Methodology David Marker and John Czajka11:30 a.m.– Summation and Next Steps12:00 p.m. Dick Nathan, Moderator
Closed Session
12:00–1:00 p.m. Working Lunch
1:00–3:00 p.m. Preparation of Plans for Panel Report
3:00 p.m. Adjourn
Appendix F
Biographical Sketches of Panel Members and Staff
RICHARD P. NATHAN (Chair) is codirector of the Rockefeller Institute and distinguished professor of political science and public policy at the State University of New York at Albany. He has written and edited books on the implementation of domestic public programs in the United States and on American federalism. Prior to going to Albany, he was a professor at Princeton University. He served in the federal government as assistant direc-tor of the U.S. Office of Management and Budget, deputy undersecretary for welfare reform of the U.S. Department of Health Education and Wel-fare, and director of domestic policy for the National Advisory Commission on Civil Disorders (The Kerner Commission). He is a graduate of Brown University, and holds an M.P.A. and a Ph.D. from Harvard University. JOHN L. CZAJKA is a senior fellow at Mathematica Policy Research, Inc. His work has focused on development of administrative data files, small-area estimation, census taking, policy analysis, and the evaluation of estimates obtained from survey data. He has also directed many studies of health insurance coverage, including analyses of the dynamics of coverage over time and the impact of the State Children’s Health Insurance Program on trends in children’s coverage. His work for the Internal Revenue Service has improved the practice of statistics at the Statistics of Income Division, one of the federal government’s major statistical agencies. His research for such clients as the U.S. Department of Health and Human Services, the Internal Revenue Service, and the Social Security Administration has been widely cited. He is a past president of the Washington Statistical Society and
���
APPENDIX F ���
a fellow of the American Statistical Association. He has a Ph.D. in sociology from the University of Michigan.
JOHN L. KNAPP is senior economist and professor emeritus in the Business and Economics Section of the Weldon Cooper Center for Public Services at the University of Virginia. He is a past chair of the Council of Professional Associations on Federal Statistics, and he served as president of the Asso-ciation for University Business and Economic Research and of the Virginia Association of Economists. His areas of expertise include economic devel-opment, forecasting, regional economics, and state and local government finance. Major projects under way are a study of local tax rates of Virginia cities, counties, and towns; a study describing and analyzing Virginia’s sub-state areas based primarily on the Regional Economic Information System of the Bureau of Economic Analysis; an article on Virginia’s controversial plan to reimburse localities for foregone personal property taxes on mo-tor vehicles; a study of the economic impact of the University of Virginia; and VaStat, a statistical resource maintained on the web. A graduate of the University of Colorado, Boulder, he has an M.A. from Duke University and a Ph.D. from the University of Virginia.
YOLANDA KODRZYCKI is senior economist and policy adviser at the Federal Reserve Bank of Boston. She specializes in regional, labor market, and public-sector economics. Her research has examined such topics as the long-term implications of job loss, migration patterns of college graduates, causes of regional differences in educational attainment, privatization of government functions, and corporate tax policy at the national and state levels. She serves as an adviser to numerous organizations with an inter-est in the New England and national economies, and she is coeditor of Massachusetts Benchmarks, an economics magazine issued jointly by the University of Massachusetts and the Boston Federal Reserve. A graduate of Radcliffe College (Harvard University), she has a Ph.D. from the University of Pennsylvania.
CARYN E. KUEBLER (Associate Program Officer) is an associate program officer for the Committee on National Statistics. Prior to joining the com-mittee staff, she worked for the University of Chicago’s Cultural Policy Center on a nationally scaled research project measuring the relationship between the size and scope of a region’s creative sector and its economic growth potential. Her research interests include measuring consumer debt burden and income inequality, economic development, and cultural policy, including access to and protection of cultural and natural resources. She has a B.S. from Syracuse University and an M.P.P. from the University of Chicago.

��� STATE AND LOCAL GOVERNMENT STATISTICS AT A CROSSROADS
DAvID A. MARKER is a senior statistician and associate director of Westat with 24 years of experience in project management, quality control and improvement, survey research, sampling, survey evaluation, data analysis, imputation, modeling, and small-area statistics. Both the Terrorism Risk Insurance Program and the National Employer Health Insurance Survey, conducted by Westat, used the Census of Governments as one of the sam-pling frames. His primary field of study is survey sampling, both classical and Bayesian approaches. He has worked on studies in the area of quality control and improvement for the U.S. Department of Education, the En-ergy Information Administration, and the U.S. Environmental Protection Agency. He has also worked on studies in the fields of health, housing, energy, social services, and the environment, as well as in the commercial sector. He is a consultant in total quality management and has conducted training sessions for the Swedish, Norwegian, and Finnish governments on improving the quality of their data collection activities. He has also ap-peared as an expert witness before federal, state, and local governments. He has a Ph.D. in biostatistics from the University of Michigan.
DAvID YOUNG MILLER is interim dean of the Graduate School of Public and International Affairs and professor of public and urban affairs at the University of Pittsburgh. In this position, he has done work in compara-tive regional governance, urban public finance, research methods, law and politics of local government, and administrative theory. A frequent user of Census Bureau government statistics, he has developed metropolitan da-tasets based on census data. He has a Ph.D. in public policy research and analysis from the University of Pittsburgh Graduate School of Public and International Affairs.
ROBERT PARKER is a consultant on federal statistics and has served as chief statistician of the U.S. Government Accountability Office (GAO), where he directed work on the operations of the federal statistical system and advised the staff on the use of statistics and statistical methodologies in the conduct of audits and evaluations of government programs and op-erations. Prior to joining GAO in July 2000, he was the chief statistician of the Bureau of Economic Analysis and associate director for national accounts and a member of the Statistics Canada National Accounts Ad-visory Committee. He is a member of the National Business Economics Issues Council and the Conference of Business Economists. He authors the “Focus on Statistics” articles in Business Economics, the quarterly journal of the National Association for Business Economics. He also serves as the association’s representative to the Council of Professional Associations for Federal Statistics.
APPENDIX F ���
THOMAS J. PLEWES (Study Director) is a senior program officer for the Committee on National Statistics. Previously he served as study director for the Panel to Review Research and Development Statistics at the National Science Foundation. Prior to joining the Committee on National Statistics staff, he was associate commissioner for employment and unemployment statistics of the Bureau of Labor Statistics and served as chief of the U.S. Army Reserve. He is a fellow of the American Statistical Association and was a member of the Federal Committee on Statistical Methodology. He has a B.A. in economics from Hope College and an M.A. in economics from the George Washington University.
ROBERT P. STRAUSS is professor of economics and public policy at the J. John Heinz III School of Public Policy and Management at Carnegie Mellon University. His general research interests include public economics, urban real estate assessment practices, and state and local taxation policy. He has served on the advisory boards of several federal statistical agencies, includ-ing the Statistics of Income Division of the Internal Revenue Service and the Governments Division of the Census Bureau. He served on the Revenue Estimating Advisory Committee of the Joint Committee on Taxation, U.S. Congress, and was assistant to the deputy secretary of the treasury. He has a Ph.D. in economics from the University of Wisconsin.


COMMITTEE ON NATIONAL STATISTICS
The Committee on National Statistics (CNSTAT) was established in 1972 at the National Academies to improve the statistical methods and informa-tion on which public policy decisions are based. The committee carries out studies, workshops, and other activities to foster better measures and fuller understanding of the economy, the environment, public health, crime education, immigration, poverty, welfare, and other public policy issues. It also evaluates ongoing statistical programs and tracks the statistical policy and coordinating activities of the federal government, serving a unique role at the intersection of statistics and public policy. The committee’s work is supported by a consortium of federal agencies through a National Science Foundation grant.
