papar – interacting with multimedia on paper – interacting with multimedia on paper jörg...
TRANSCRIPT
PapAR – Interacting with Multimedia on Paper
Jörg Cassens1 and Michael Herczeg2
1 Institute for Mathematics and Applied Informatics, University of Hildesheim, Samelsonplatz 1, 31141 Hildesheim, Germany
[email protected] 2 Institute for Multimedia and Interactive Systems,
University of Lübeck, Ratzeburger Allee 160, 23562 Lübeck, Germany [email protected]
Abstract. In this contribution, we introduce the augmented reality presentation system PapAR. PapAR extends the use of printed paper documents in such a way that it is possible to integrate tokens for multimedia elements such as pic-tures, video or audio. These tokens can then be used in conjunction with a presentation system to interact with the multimedia elements on a large display, e.g. in a lecture situation. To this end, a PDF document that has been produced with any application is annotated with multimedia elements in the PapAR editor component. The multimedia elements, together with some metadata, are stored in the Network Environment for Multimedia Objects (NEMO) or on a physical device. Additionally, a new PDF document is generated containing tokens for the multimedia elements and for interaction with them. The new PDF can be printed and taken to the PapAR presentation system where the printout is placed under a camera. On the presentation screen, the tokens are overlaid with the re-spective multimedia or interactive elements.
Keywords: Augmented Reality, Presentation System, Network Media Storage.
1 Introduction
Presentations form an integral part in many different work contexts, and in particular in the teaching and learning environment. We have conducted a survey (Eberhardt 2011) targeted at persons that use presentation software regularly in order to find out more about the perceived advantages and disadvantages of different presentation software applications. It became clear that the users at least sometimes prefer to use traditional methods of presentation, e.g. printed transparencies in conjunction with an overhead projector or paper that is photographed by a digital camera with the output being presented with the help of a digital projection system.
Our presentation software PapAR combines some aspects of traditional paper-based or printed presentations. The prototype was positively received in a summative evaluation.
In the following chapters, we will firstly describe features of digital and paper based-based media. Combining digital media and paper forms the basis of PapAR.
13
In: Roth-Berghofer, T., Atzmueller, M. & Oussena, S. (Eds.). Proceedings of the First International Smart University Workshop, CONTEXT 2013, Annecy, France. pp. 13-24

Another chapter gives details of our survey. The results of the survey lead to a de-scriptive scenario. Building on the scenario, we describe the concept of PapAR and its implementation before we conclude with some results of a preliminary user-centered evaluation of the prototype.
2 Virtual and Tangible Media
Media that is bound to a physical representation like paper has some capabilities that cannot be delivered by purely virtual representations. In certain contexts of use, these capabilities can be considered a positive feature. Guimbretière (2003) has studied paper-based artifacts. As an advantage of paper, he points out that, in contrast to digi-tal representations, paper can be grasped and touched, that it is a tangible media. In addition, it gives the user immediate and well-known means of annotation, using pens or text markers.
A comparison of paper-based and digital patient records has been done by Tange (1995). It was found that physical properties of the paper-based artifact actually con-vey a lot of information, e.g. the weight of patient records gives an immediate repre-sentation of the history of the patient. It was also found that the speed of annotating paper was much higher than when using a PDA or tablet PC. As advantages of elec-tronic records, concurrent use and support by computer-based diagnostic systems were mentioned.
These findings are supported by Guimbretière, who points to additional benefits of digital artifacts. For example, he points out that it is easy to index and search comput-erized documents. Digital documents are easy to copy and to transfer to different locations. It is also easy to preserve the history of changes, to change layout and presentation, or just change content – all these are activities that are much harder with paper-based documents.
Another study by Harper and Sellen (1995) adds some nuances to this stance and come to the following conclusions:
“The fact that paper is tangible, flexible, and light, has a variety of implications for the ease with which it can be physically transported, manipulated and laid out in space. The fact that it is easy to mark and annotate, and that it displays fixed rather than dynamic information means that it is easily tailorable and shows a history of the ways in which it has been tailored. Finally, it is in the nature of paper that access to its contents can be physically controlled and monitored, as opposed to electronic media which may give access to a centralised deposit of information for many differ-ent individuals.”
In order to combine perceived advantages of both media types, Guimbretière (2003) started experimenting with an electronic pen. A digital document that is print-ed can be annotated using a special pen that recognizes the annotations. Changes to the printed documents can therefore later be transferred back to the electronic version of the document.
14

3 Analysis
Based on a survey with 43 participants, we analyzed the work processes surrounding authoring and giving presentations (Eberhardt 2011). The primary target group was comprised of persons giving presentations frequently. Students, (74%), Professors (4%) and other research staff (22%) were answering a survey form in order to de-scribe their experience with presentations and talks. The largest number of presenta-tions was authored using Microsoft PowerPoint (44%), but somewhat surprisingly, a large number of those were transformed to PDF for the presentation in order to avoid compatibility problems with different versions of Microsoft Office or missing fonts. The second most used tool was the typesetting system LaTeX, which can be used to author presentations as well (37%). The third most used option was a web-based presentation system called XMendeL (Hartwig & Herczeg 2003).
XMendeL integrates authoring and presentation with asset management and has the advantage of ubiquitous access through a web browser. Every presentation is saved in a hierarchical and semantic structure that can be easily navigated on the web server. Through the integrated asset management system, users can share media ob-jects like images or video with each other and in different presentations. One can also easily cross reference (parts of) other presentations through the use of hyperlinks. One disadvantage mentioned by the users was performance.
The need to have a specific program installed on the presentation system was men-tioned as a disadvantage with Microsoft PowerPoint. Users also pointed out that one could encounter conversion problems when dealing with different versions of Power-Point on the authoring and the presentation computer. Users were also critical of the fact that it was easy to get an inconsistent layout with PowerPoint, and that many users would make too heavy use of multimedia effects.
Considering the use of PowerPoint in teaching settings, there seems to be no con-clusive evidence that it actually improves on the learning process (Apperson et al. 2008). An advantage when using multimedia elements seems to be that it can instill a positive bias towards learning. On the other hand, effects like sounds that do have no meaning with regard to the content conveyed would not be worth the effort.
This was also supported by results from interviews we have held at our own uni-versity. Overly complicated designs and animated presentations would distract users from the main points of the talk. On the other hand, it was considered a disadvantage of whiteboards and blackboards as well as of traditional overhead transparencies that no multimedia elements could be included. This was considered a main reason to use PowerPoint or similar software. The interviewees expressed interest in a solution that would combine multimedia elements with printed paper or transparencies.
The results of our interviews, our own survey and the literature review were used to describe the system to be implemented with the help of a scenario (Rosson & Car-roll 2002). In the following, we will introduce a descriptive scenario (Pohl 2007) that describes the use of our new system, PapAR.
15
4 Descriptive Scenario
Alice enters the lecture theatre of her university. She is a researcher in mathematics, and is planning to give a guest lecture in a lecture series of environmental studies. This lecture series is given by different presenters every week, and they describe how their own discipline connects to environmental studies. She plans to present her work on graph algorithms that can model the influence different interest groups have on each other when negotiating e.g. about protected areas.
Alice has printed her slides, so she can use the time spent on the train to university to read through the paper copies and familiarize her with her arguments. She is glad that she does not have to do it with her tablet PC. She finds the contrast of paper much easier on the eyes. She also thinks that the battery life of modern gadgets is much too short – she always charges her smart phone before leaving her office and in order to be able to read the news on her way home. Today, the paper copies of the slides for the talk make her independent of the few available power sockets in her train.
Alice is welcomed in the lecture theater by Bob. Bob organizes the lecture series. He introduces Alice to the students. In the meantime, Alice puts the title page of her talk on the lecturn. She also connects a USB stick with the portable version of PapAR to the computer and starts the presentation program. PapAR is just a small executable which does not need to be installed.
A digital camera points downward to the top of the lecturn. The PapAR applica-tion on the computer connected to the camera analyzes the image of the title page. It recognizes the presentation with the help of a QR-Code1 and starts to download the multimedia objects connected with the presentation from the internet. This media data has been automatically uploaded by Alice’s presentation editor when she was prepar-ing her talk.
After Bob finishes his introduction, Alice turns the page to the first page of her presentation. This page does not make use of digital media; therefore, the image of the camera is just passed through to the video projector.
First on page three can we see how Alice makes use of the multimedia capabilities of PapAR. She has included a video that shows the spreading of information in a so-cial graph over time. The space on the paper that Alice has reserved for the video contains a marker. This marker is recognized by the PapAR application. The software overlays the marker with the media it has downloaded. The video projector now shows the thumbnail of the video where the marker is located on the paper. In addi-tion, Alice can make use of buttons to start and control playback of the video. These buttons are markers as well. If they are covered for a certain time, for example when Alice is pressing the virtual buttons with her fingers, the playback action associated with the particular button is initiated,
While the video is playing, Alice underlines parts of the description of the algo-rithm used to calculate the spread of information to highlight a specific step in the process. She uses her pen to just annotate the paper in front of her. Through the video projection system, the annotation is immediately visible to the students.
1 http://qrcode.com/index-e.html
16
At the end of her talk, Alice presents how one can use adjacency matrices to model the connections of the graph, thereby reducing a lot of the necessary calculation to matrix multiplications. The students have some questions with regard to the underly-ing math. Alice demonstrates a simple matrix multiplication with pen and paper. This example is not only immediately visible to the students, but will also be part of the handout Alice is going to distribute after the lecture.
5 Concept and Design
In order to achieve the capabilities as described in the scenario above, we decided to implement our presentation system in the form of an augmented reality application (Sherman & Craig 2003; Bimber & Raskar 2005). The system design is comprised of three different components.
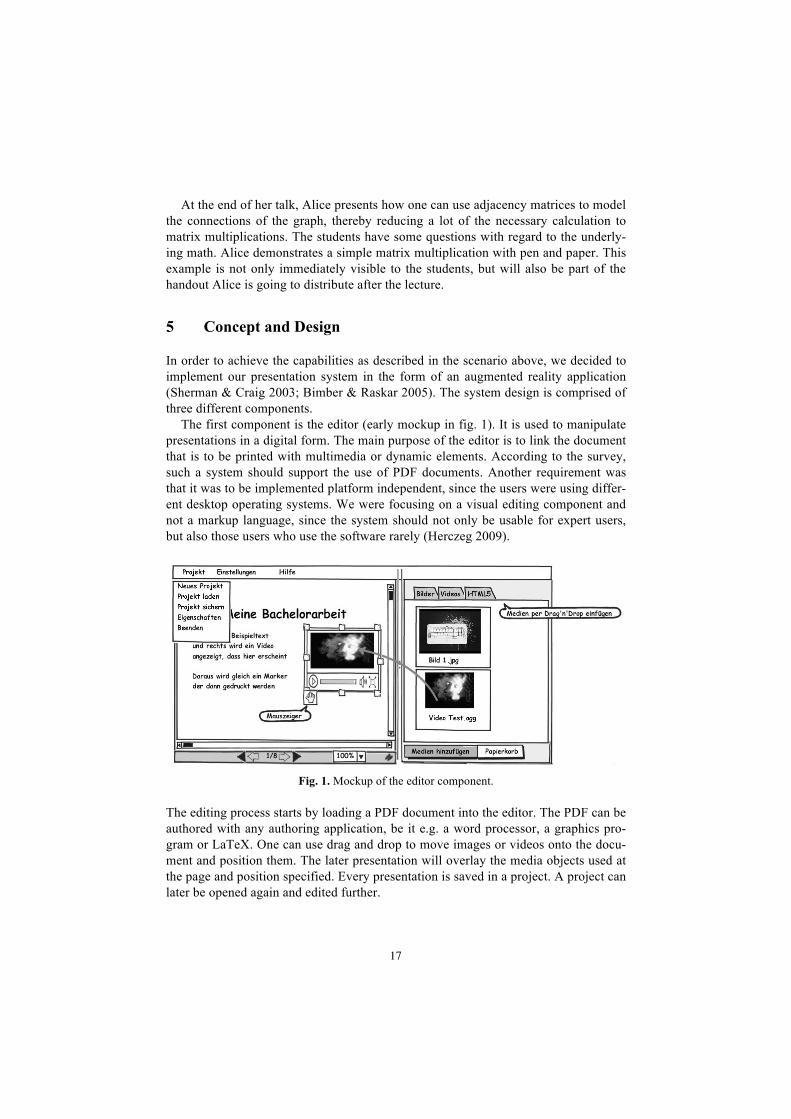
The first component is the editor (early mockup in fig. 1). It is used to manipulate presentations in a digital form. The main purpose of the editor is to link the document that is to be printed with multimedia or dynamic elements. According to the survey, such a system should support the use of PDF documents. Another requirement was that it was to be implemented platform independent, since the users were using differ-ent desktop operating systems. We were focusing on a visual editing component and not a markup language, since the system should not only be usable for expert users, but also those users who use the software rarely (Herczeg 2009).
Fig. 1. Mockup of the editor component.
The editing process starts by loading a PDF document into the editor. The PDF can be authored with any authoring application, be it e.g. a word processor, a graphics pro-gram or LaTeX. One can use drag and drop to move images or videos onto the docu-ment and position them. The later presentation will overlay the media objects used at the page and position specified. Every presentation is saved in a project. A project can later be opened again and edited further.
17

The editor is also used to generate a PDF with a printable version of the presenta-tion. In this PDF, a unique title page is generated that is used to identify the presenta-tion at hand. This title page contains information about where the media and metadata are stored. In addition to the title page, every page is annotated with a small marker. This marker is used to identify the page number, so that the user can move freely through the printout, leaving out pages or going backwards at his disposal. Lastly, the editor also replaces every occurrence of multimedia objects that have been imported into the system with a unique marker.
As mentioned in the scenario, time-based media are additionally annotated with markers that represent interface buttons, called the media bar. Such an idea of a “clickable paper document” was also employed by Hull et al. (2007), where it was used to represent hyperlinks linking different documents together. The media bar is located below the marker that represents a time-based multimedia object.
In order to be able to use the presentation later in a different location, the project has to be published. For this purpose, we use the second component, a media reposito-ry, making the multimedia objects available in the internet or intranet. The repository must also contain the necessary metadata, in particular size and positions of media data. We decided therefore to save the whole project in the repository. Therefore, we can open the project in the editor in every location that has network access to the re-pository and continue editing. The user authentication mechanisms provided by the repository are used to control access to our projects.
We make use of the Network Environment for Multimedia Objects (NEMO, Lob et al. 2010; Feldner et al. 2009). NEMO is a framework for the contextualized, person-alized, semantically rich and device-specific access to and interaction with collections of multimedia objects. Such collections can encompass for example texts, videos, audio and pictures. NEMO is a client-server system enabling different applications to download such collections, display or manipulate the multimedia objects, and upload the changed collections again.
In this application context, we take advantage of NEMO’s ability to semantically group media objects and annotations as well as its client-server architecture that makes it possible to work with NEMO objects from any location that has network access to the server. Another advantage is the ability to use NEMO as an asset man-agement system that allows the user to reuse media objects in different applications and share them with other users.
PapAR uses one collection, a so called NEMO multimedia object (NMO), to de-scribe one project. It uses the semantic annotation capabilities of NEMO to store the necessary metadata, such as position and size of objects. NEMO incorporates the necessary user and rights management as well.
PapAR retains some of the benefits of the XMendeL system (central storage loca-tion, asset management, shared use of presentation and media objects, semantic anno-tation and modeling). The use of the system with only a web browser, however, had to be abandoned, since the main advantage of PapAR lies in the use of printed paper. When implementing the system, the realization of the PapAR presentation application as a web application was deemed unfeasible due to performance and security con-cerns.
18

This presentation application forms the third component of PapAR. It has to be available on the presentation computer. To this end, it can either be installed locally or used as a portable application from a USB-stick. This component takes the digital input from a camera or digital overhead projection system, augments the picture with the digital media elements and transfers this augmented picture to a video projection device.
In order to be able to access the necessary metadata and media objects, the presen-tation component first has to identify the presentation at hand. This is done with the help of the unique title page generated by the editing component. This title page con-tains a QR-Code with the necessary data to identify the NEMO server used and means of connection, as well as the specific NMO that includes the presentation.
The presentation application uses this data to connect to the NEMO server and loads the NMO with the presentation. It then uses the information stored in the NMO to start downloading the media files themselves. Such media files can be located on the same NEMO server as the presentation or at different network locations (NEMO uses a simple URI system to identify media resources, so pictures or videos on the public internet can be incorporated as well).
The decision to use unique login data contained in the QR-Code instead of asking the user for necessary authentication data like a user name and passwords was taken based on the results of our survey. It is a tradeoff between usability and security, but the users strongly favored a system that minimizes direct interaction with the presen-tation computer. Of course, access to a presentation is only secure as long as the title page is not available to third parties. Since the presentation itself is only projected with the help of the PapAR presentation application, the QR-Code can be blanked out on the projection screen to prevent leakage to large audiences. If stronger security is needed, one can make use of an optional password.
In order to identify the different pages of a presentation, we make use of the aforementioned marker that is present in the footer on every page. Through the com-bination of page marker and markers for individual media objects, the presentation system can then overlay the media object at the correct location and orientation. The augmented picture of the presentation is then presented on the video projection device to the whole audience.
The presentation component does also recognize the media bar below time-based multimedia objects, such as videos. It scans for a number of markers that represent the playback buttons, usually a combined play/pause button and a full screen button. If these markers are obscured for a certain period of time, e.g. when the presenter places his finger on the button, then the according action is executed.
6 Implementation
The user-centered process helped us to design the PapAR system. The design in turn was implemented in a prototypical system. The editor was realized with the JAVA programming language in order to be able to deliver a platform-independent solution for users on different operating systems. The interface design was guided by usability
19

criteria as laid out in the respective standards and in the literature (DIN EN ISO 9241-110 2006; Herczeg 2009). Figure 2 shows the user interface of the editor component together with a printable PDF.
Fig. 2. Screenshot of the editor and a PDF with markers ready to print.
The editor connects to the NEMO system via the Extensible Messaging and Presence Protocol (XMPP), more widely known as Jabber2. Messages between the NEMO clients and the server are specified as XML-based extensions to the XMP-Protocol (which itself is based on XML). Multimedia objects that are imported into the editor are uploaded to the NEMO server and get an URL with an UUID (Universally Unique Identifier) according to RFC 4122 for further reference. The UUID makes it hard to “guess” the correct URL and prevents unauthorized access, even if the user chooses not to restrict access to the individual multimedia objects via NEMO usernames or group definitions. Access to these multimedia objects is therefore scheduled through the NEMO system.
For the presentation component, we have chosen to implement the system in C++ with the help of the AR-Toolkit3. The component can make use of different video input devices, e.g. web cams or specific overhead presentation cameras. The applica-tion then processes the video images received. Identification of different pages hap-pens via TopCodes (Tangible Object Placement Codes)4 whereas identification of the presentation itself (and the associated NMO) happens via QR-Codes. Media elements
2 http://xmpp.org/ 3 http://www.hitl.washington.edu/artoolkit/ 4 http://users.eecs.northwestern.edu/~mhorn/topcodes/
20

and the media bar are identified through the use of AR-Markers from the AR-Toolkit. Output is rendered as an OpenGL scene and forwarded to the connected video presen-tation devices.
Fig. 3. Presentation component with rendered media contents and the media bar.
Figure 3 shows the output of the presentation component. One can see the OpenGL scene generated by the application where multimedia objects overlay the paper (com-pare Fig. 1 where AR markers are shown instead of multimedia content). The upper object is a video, and one can see the media bar with the “buttons” for start/pause and full screen. The lower object is a static picture. One can see that it is possible to make use of color pictures even when the document is printed in black and white. One can also see the TopCode identifying the page in the lower left corner.
7 Evaluation
Formative evaluations of the prototype as work in process plus a summative evalua-tion of the finished prototype were both carried out. The main focus was on the user interface of the editor component. In particular, the user was queried about the dialog design. Five test participants were asked to go through a specific evaluation scenario, doing tasks for preparing a presentation. The users were observed doing the tasks, they were also asked to think aloud to help the observer understand their internal rea-soning. We evaluated the observable reactions of the users, problems that occurred,
21

ineffective or faulty use of the system and the time the participants needed to reach the goal as well as how the participants reached the goal.
The results were used to infer details about the usability of the system (Rosson & Carroll 2002). The moderator of the evaluation took an observing, non-interfering approach. After the tests, the participants answered additional questions, and the in-terpretation of the test was discussed between moderator and participants. The partic-ipants were also asked whether they had any suggestions for improvement, or whether they were missing some features they would have liked to see implemented.
One very important result of the test was that some participants wanted to be able to use PapAR independent of NEMO. This was also supported by those users who were familiar with NEMO from different contexts. The main reason was that the par-ticipants wanted to be able to use PapAR even if network access to NEMO was re-stricted, e.g. in corporate settings where presentation computers might not be con-nected to the public internet. They suggested that the project could additionally to being saved in NEMO also be exported to e.g. a USB stick that could be taken to the presentation. This feature was added to the final version of the prototype.
Suitability for the task Ease of use 80 % Clear arrangement of the editor 76 % Clear arrangement of the dialogs 84 % Arrangement of functions 70 % Readability (font size, symbols, layout) 76 % Self-descriptiveness Clarity of functionality through its description 88 % Clarity of next step 76 % Controllability Action is always selectable 70 % Conformity with user expectations Action leads to the result wanted 92 % Arrangement of elements is conform with user expectations 92 % Error tolerance Actions can always be cancelled 88 % Input with errors is rejected 98 % Suitabilty for learning Dialogs help understanding the system 92 % Help functions increases understanding of the application 82 %
Table 1. Evaluation results.
For the summative evaluation with regard to dialog principles, we used the ISONORM questionnaire that tests criteria related to DIN/ISO 9241-110 (Prümper 1987). PapAR’s self-descriptiveness was rated high and the dialogs were considered understandable. An integrated help outlining the most frequently used steps was con-sidered helpful. It is worth mentioning that this help was only consulted by the partic-
22

ipants in case they encountered problems or when they had additional questions, not as a primer for using the system. The settings and importing media objects via drag and drop was easy to use for the test participants, keyboard shortcuts followed the principle of external consistency with other programs.
The functions of PapAR were regarded as sufficient for the task, which lead to a positive evaluation of the suitability for the task. The system was also considered error tolerant. Details of the evaluation with regard to dialog principles can be seen in table 1. The system was not evaluated for suitability for individualization since the prototype offered limited options for individualization.
8 Conclusions and Further Work
The user-centered process to design the paper-based augmented reality system for presentations PapAR and its prototypical implementation according to user feedback lead to a prototype that was well received by the prospective users, as was evident in the evaluation. It was shown that the combination of paper-based material with mul-timedia elements gives the user new options for authoring presentation material for talks. It can be said that the attempt to combine advantages of paper-based and digital presentations was successful. One has to keep in mind that our goal was not to make other methods and tools superfluous, but to give the user a new tool based on well known media at hand that can be useful in specific settings. The most important con-tribution here is that it is now possible to use time-based multimedia elements tied to the static paper artifact.
The system should be evaluated in a longer study to see what features users are missing the most. It can, however, already be said that it should be made possible to incorporate changes to the paper back into the digital representation of the talk, e.g. by building on the ideas of specific pens for this purpose (Guimbretière 2003). Such a pen would synchronize the digital and the analog version of the talk again (such a feature has also been hinted at in our descriptive scenario).
It should also be possible to integrate at least some of the functions of the editor in-to tools like PowerPoint, Word or LaTeX itself. For example, macro definitions could be used to generate the TopCodes for page identification and the markers that identify the different multimedia objects. What remains of the editor component – uploading the multimedia objects to NEMO and generating the local project copy, generating a project-specific QR-code – could then be handled by a non-interactive post processing application, which could ideally be called by the authoring tools automatically on export. Such an extension would integrate the augmented reality tools more closely in existing work flows.
Acknowledgments. The authors wish to thank their student Bjørn Eberhardt for his contributions in designing, implementing and evaluating PapAR.
23

9 References
Apperson, J. M., Laws, E. L. & Scepansky, J.A. (2008). An assessment of student preferences for PowerPoint presentation structure in undergraduate courses. Computers & Education (50), 148-153
Bimber, O. & Raskar, R. (2005). Spatial Augmented Reality. Wellesley: A.K. Peters.
Eberhardt, B. (2011). Augmented Reality an gedruckten Dokumenten. Bachelorarbeit, Universi-tät zu Lübeck.
Feldner B., Günther S., Schmitt F., Winkler T. & Herczeg M. (2009). A Dolphin Is a Dolphin Is a Dolphin? In ICALT 2009, Riga, Latvia, 29-31.
Guimbretière, F. (2003). Paper augmented digital documents. In Proceedings of the 16th annu-al ACM symposium on user interface software and technology, UIST ’03. New York: ACM, S. 51–60.
Hartwig, R. & Herczeg, M. (2003). XMendeL - Web-gestützte objektorientierte Datenhaltung im Usability-Engineering. In Ziegler, J. & Szwillus, G. (Hrsg.), Mensch & Computer 2003. Wiesbaden: Teubner Verlag, S. 267-276.
Harper, R. & Sellen, A. (1995). Paper-Supported Collaborative Work. Technischer Bericht. Cambridge: Rank Xerox
Herczeg, M. (2009). Software-Ergonomie. Theorien, Modelle und Kriterien für gebrauchstaug-liche interaktive Computersysteme. 3. Auflage. München: Oldenbourg.
Hull J. J., Erol B., Graham J., Ke Q., Kishi H., Moraleda J. & Van Olst D. G. (2007). Paper-Based Augmented Reality. In Proceedings of the 17th International Conference on Artifi-cial Reality and Telexistence (ICAT '07). IEEE Computer Society, Washington, DC, USA, 205-209.
Lob S., Cassens J., Herczeg M. & Stoddart J. (2010). NEMO – The Network Environment for Multimedia Objects. In Proceedings of the First International Conference on Intelligent In-teractive Technologies and Multimedia (IITM 2010), IIIT Allahabad, India. ACM. 245-249.
McLendon K. (1993). Electronic medical record systems as a basis for computer-based patient records. Journal of AHIMA – American Health Information Management Association, 64(9):50, 52, 54-55
Pohl, K. (2007). Requirements Engineering. Grundlagen, Prinzipien, Techniken. Heidelberg: Dpunkt.Verlag GmbH.
Prümper, J. (1997). Der Benutzungsfragebogen ISONORM 9241/10: Ergebnisse zur Reliabili-tät und Validität. In: Software-Ergonomie '97 – Usability Engineering: Integration von Mensch-Computer-Interaktion und Software-Entwicklung, Stuttgart: Teubner, S. 253-261.
Rosson, M. B. & Carroll, J. M. (2002). Usability Engineering – Scenario-Based Development of Human-Computer Interaction. San Francisco: Morgan Kaufmann.
Sherman, W.R. & Craig A.B. (2003). Understanding Virtual Reality. San Francisco: Morgan Kaufmann.
Tange, H. J. (1995). The paper-based patient record: is it really so bad? Computer Methods and Programs in Biomedicine, 48(1-2), 127-131.
24