paper 1edit
TRANSCRIPT

8/8/2019 Paper 1edit
http://slidepdf.com/reader/full/paper-1edit 1/18
SULIT 5 50/1
[Lihat sebelah50/1 SULIT
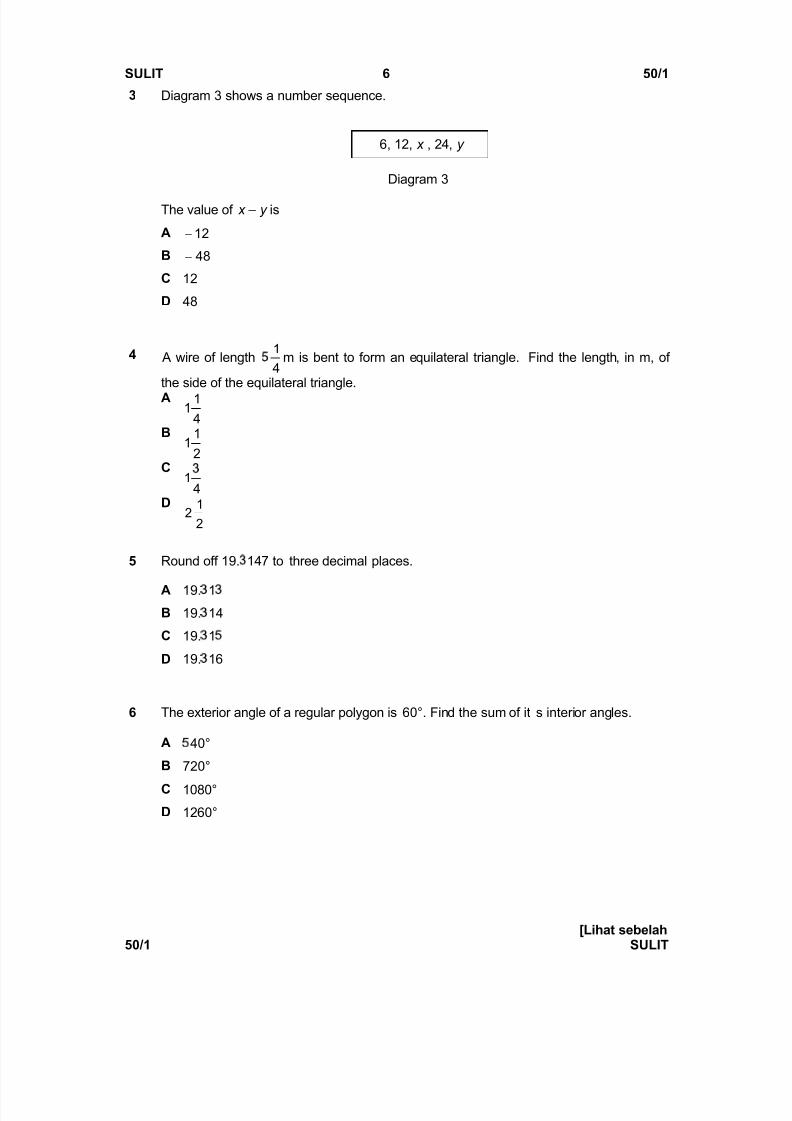
1 Diagram 1 shows the subtraction of two numbers.
2 x 7 8 3 2 y 9 2
2 4 5 9 1
Diagram 1Find the sum of digits x and y .
A 6
B 7
C 8
D 9
2 Diagram 2 shows two statements.
Diagram 2
Which of the following is a possible value of y ?
A 10
B 12
C 15
D 21
3 is a factor of y. y is a common factor of 3 6 and 7 2 .
8/8/2019 Paper 1edit
http://slidepdf.com/reader/full/paper-1edit 2/18
8/8/2019 Paper 1edit
http://slidepdf.com/reader/full/paper-1edit 3/18
SULIT 7 50/1
[Lihat sebelah 50/1 SULIT
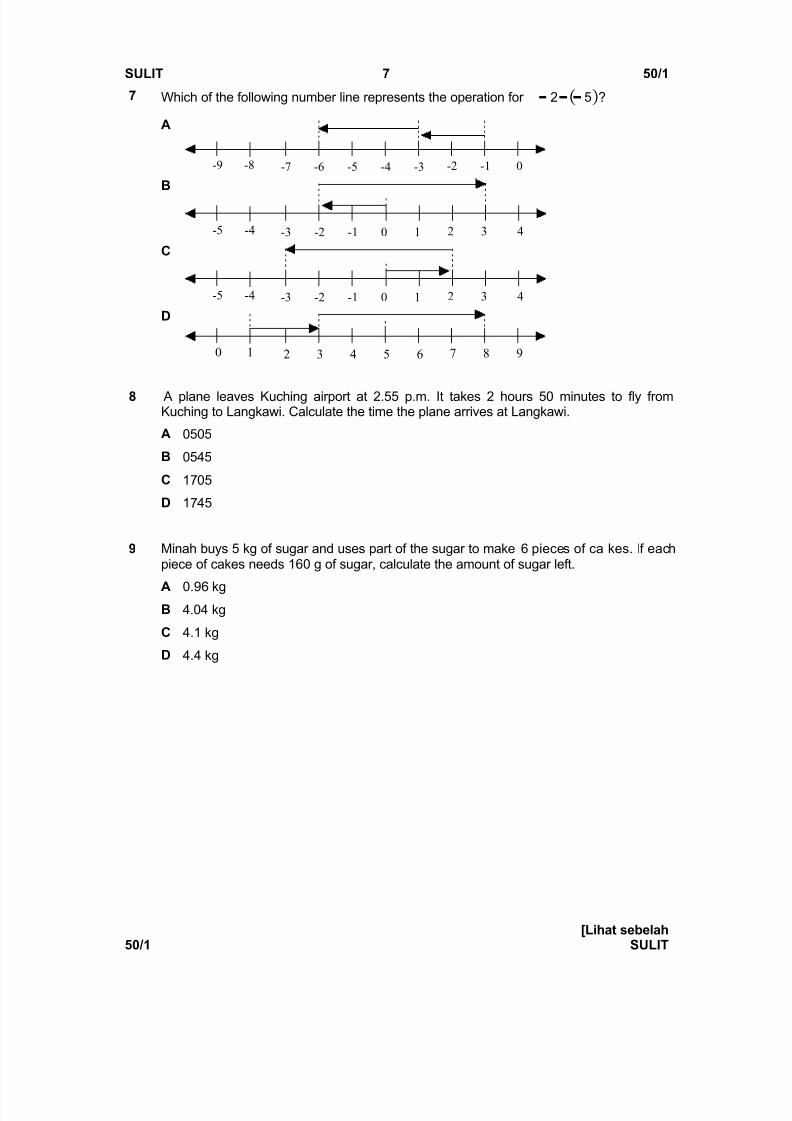
7 Which of the following number line represents the operation for 52 ?
A
-9 -6-7-8 -2-3-4-5 0-1
B
-5 -2-3-4 210-1 43
C
-5 -2-3-4 210-1 43
D
0 321 7654 98
8 A plane leaves Kuching airport at 2.55 p.m. It takes 2 hours 50 minutes to fly fromKuching to Langkawi. Calculate the time the plane arrives at Langkawi.
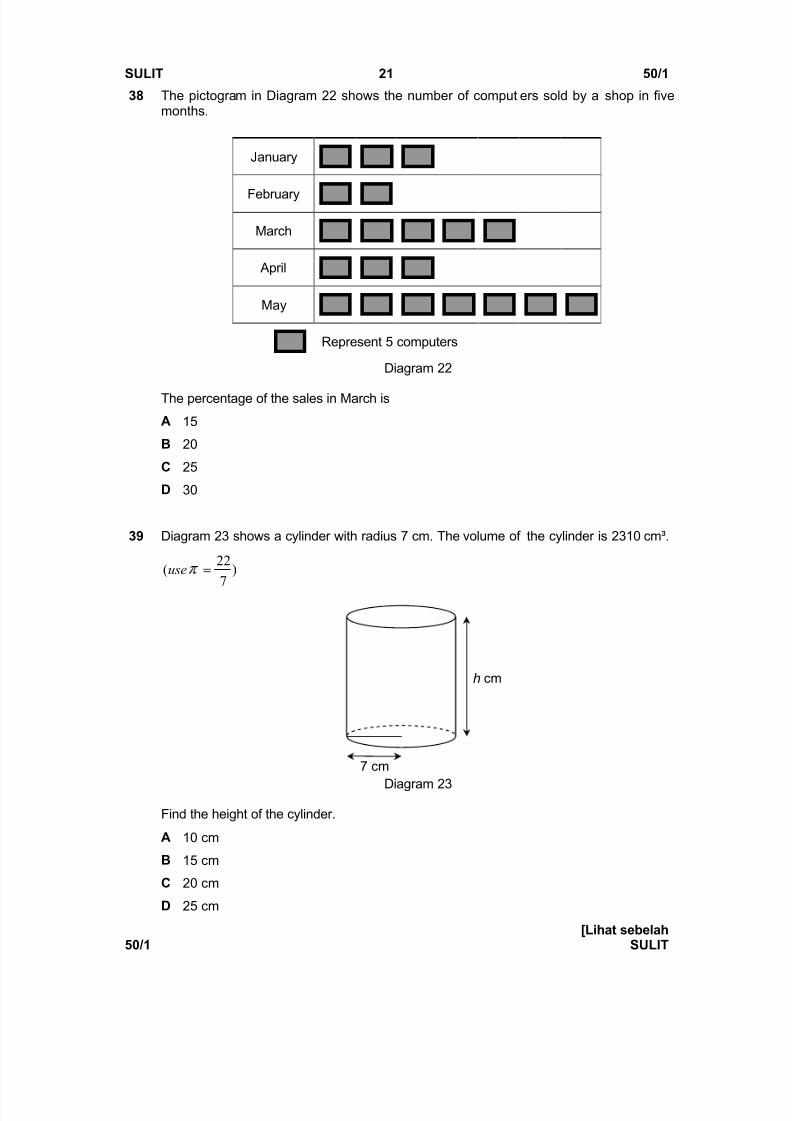
A 0505
B 0545
C 17 05
D 17 45
9 Minah buys 5 kg of sugar and uses part of the sugar to make 6 pieces of ca kes. If eachpiece of cakes needs 1 6 0 g of sugar, calculate the amount of sugar left.
A 0. 96 kgB 4.04 kg
C 4.1 kg
D 4.4 kg
8/8/2019 Paper 1edit
http://slidepdf.com/reader/full/paper-1edit 4/18
8/8/2019 Paper 1edit
http://slidepdf.com/reader/full/paper-1edit 5/18
SULIT 9 50/1
[Lihat sebelah 50/1 SULIT
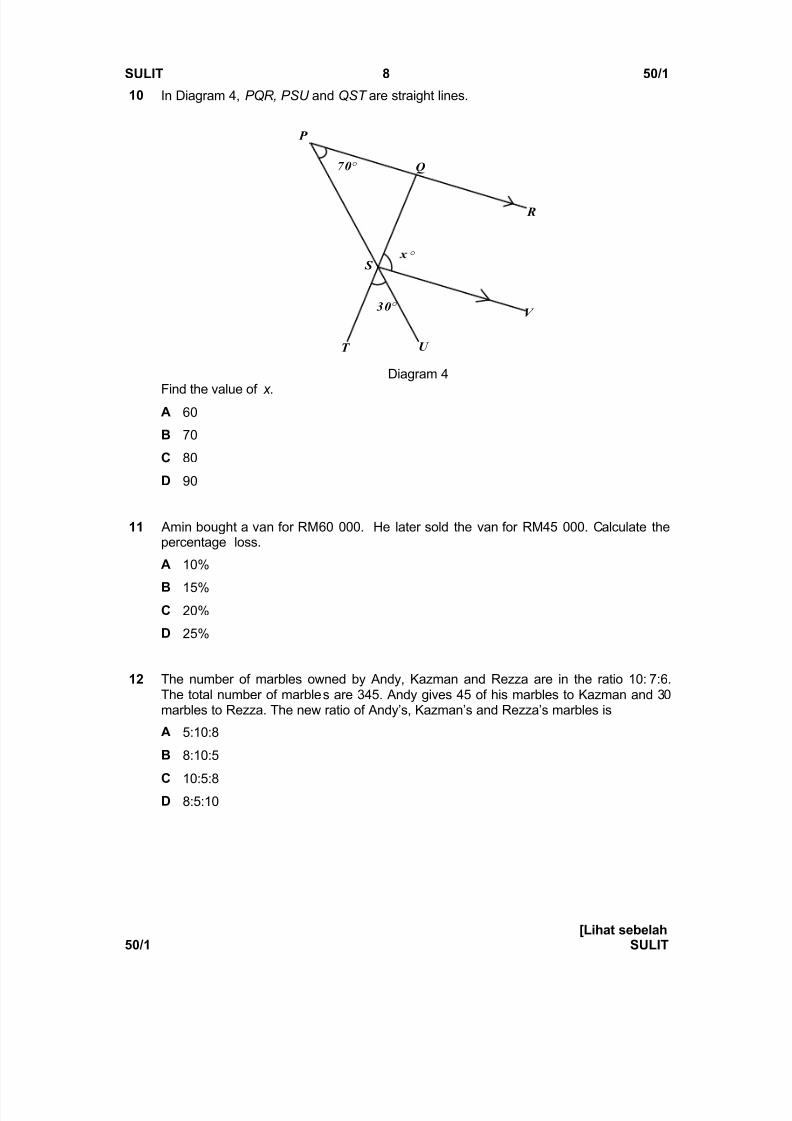
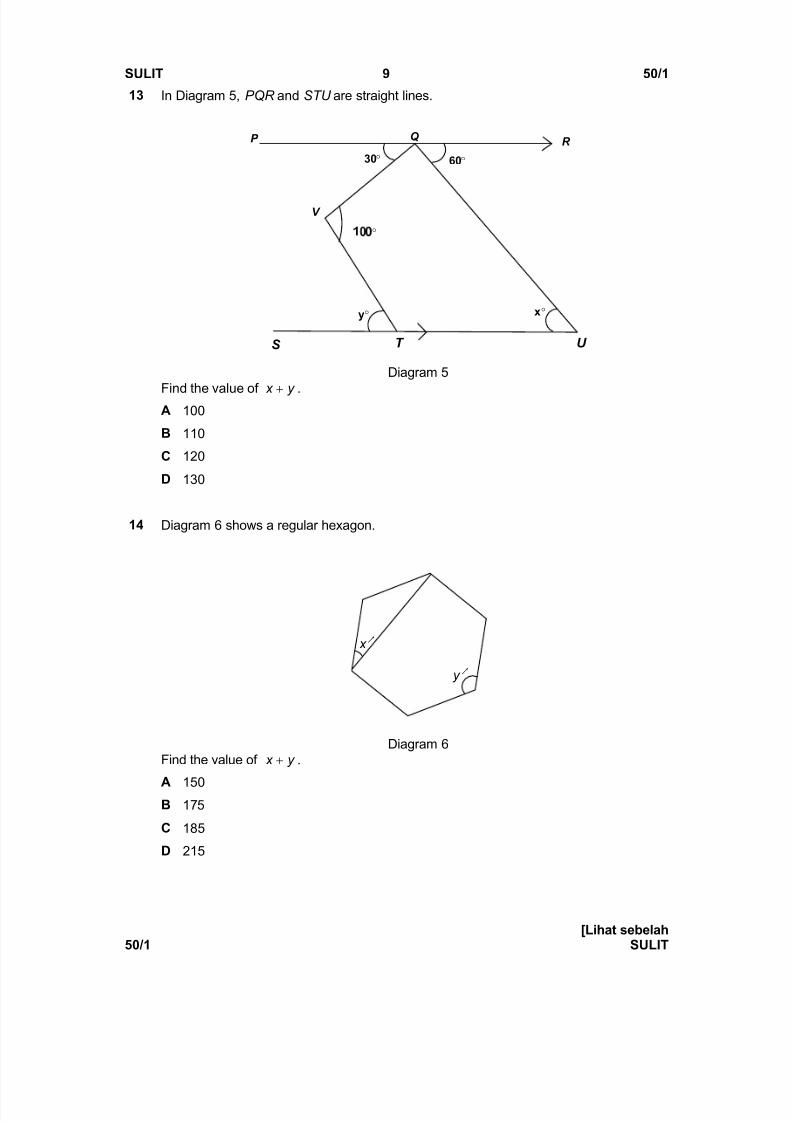
13 In Diagram 5, PQR and STU are straight lines.
V
U T S
Q R P
¡ ¢ ¢
r
y r x r
60 r30 r
Diagram 5
Find the value of y x
.A 100
B 110
C 120
D 130
14 Diagram 6 shows a regular hexagon.
Diagram 6 Find the value of y x .
A 150B 17 5
C 185
D 215
Q x
Qy
8/8/2019 Paper 1edit
http://slidepdf.com/reader/full/paper-1edit 6/18
SULIT 10 50/1
[Lihat sebelah50/1 SULIT
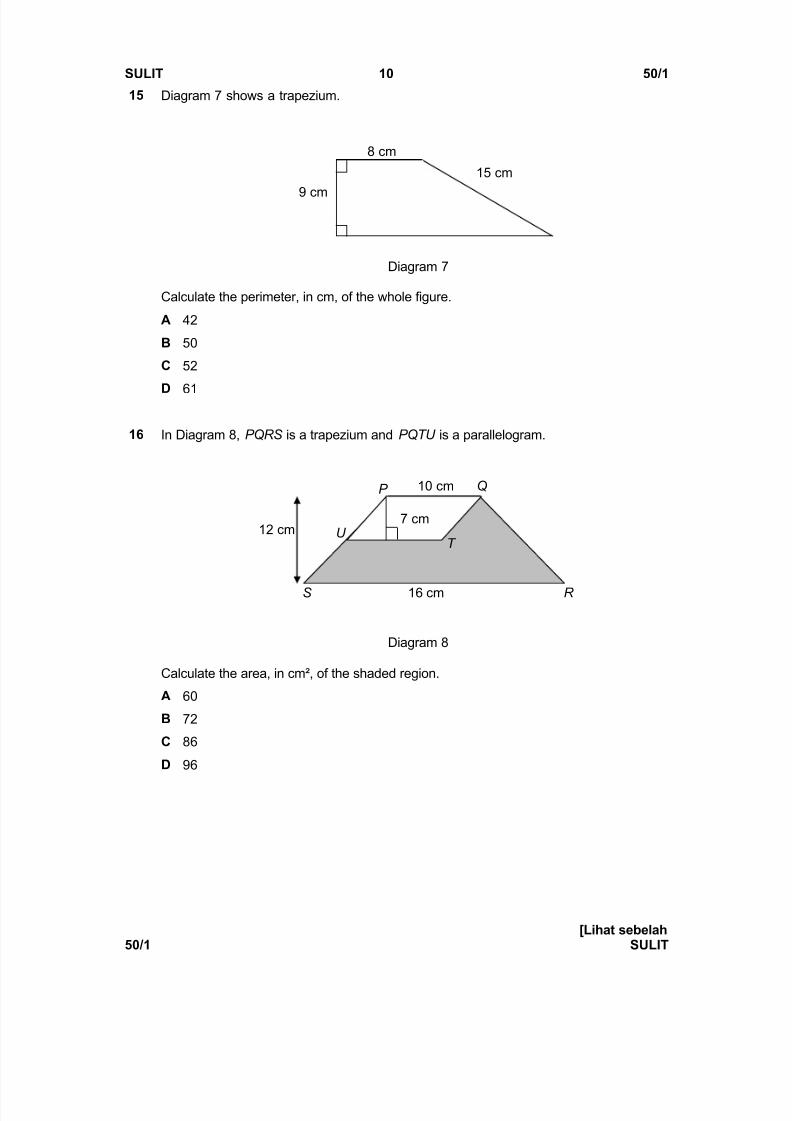
15 Diagram 7 shows a trapezium.
Diagram 7
Calculate the perimeter, in cm, of the whole figure.
A 42
B 50
C 52
D 6 1
16 In Diagram 8, PQRS is a trapezium and PQTU is a parallelogram.
Diagram 8
Calculate the area, in cm², of the shaded region.
A 6 0
B 7 2
C 86
D 96
S 16 cm R
12 cm
P Q
T U
10 cm
7 cm
9 cm
8 cm
15 cm
8/8/2019 Paper 1edit
http://slidepdf.com/reader/full/paper-1edit 7/18
8/8/2019 Paper 1edit
http://slidepdf.com/reader/full/paper-1edit 8/18
SULIT 12 50/1
[Lihat sebelah50/1 SULIT
19 Zakuan cycled 30 minutes from his house to the school library at an average speed of 25 km/h. When he cycled back home, he took 5 minutes longer than his journey fromhis house to the library. Find Zakuan ¶s average speed on his return journey in km/h.
A 12.5 km/h
B 13.5 km/h
C 21.4 km/hD 22.4 km/h
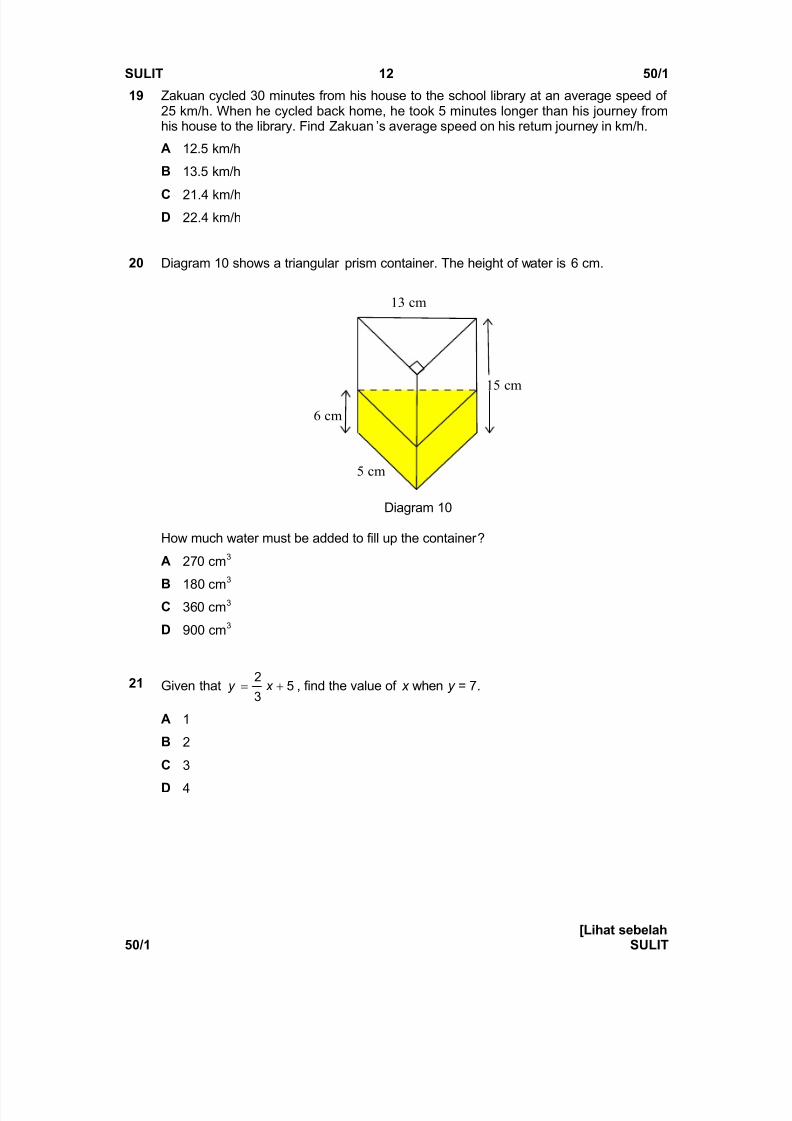
20 Diagram 10 shows a triangular prism container. The height of water is 6 cm.
5 cm
13 cm
15 cm
6 cm
Diagram 10
How much water must be added to fill up the container ?
A 27 0 cm 3
B 180 cm3
C 36 0 cm 3
D 9 00 cm 3
21 Given that 53
2! x y , find the value of x when y = 7 .
A 1
B 2
C 3
D 4
8/8/2019 Paper 1edit
http://slidepdf.com/reader/full/paper-1edit 9/18
SULIT 13 50/1
[Lihat sebelah 50/1 SULIT
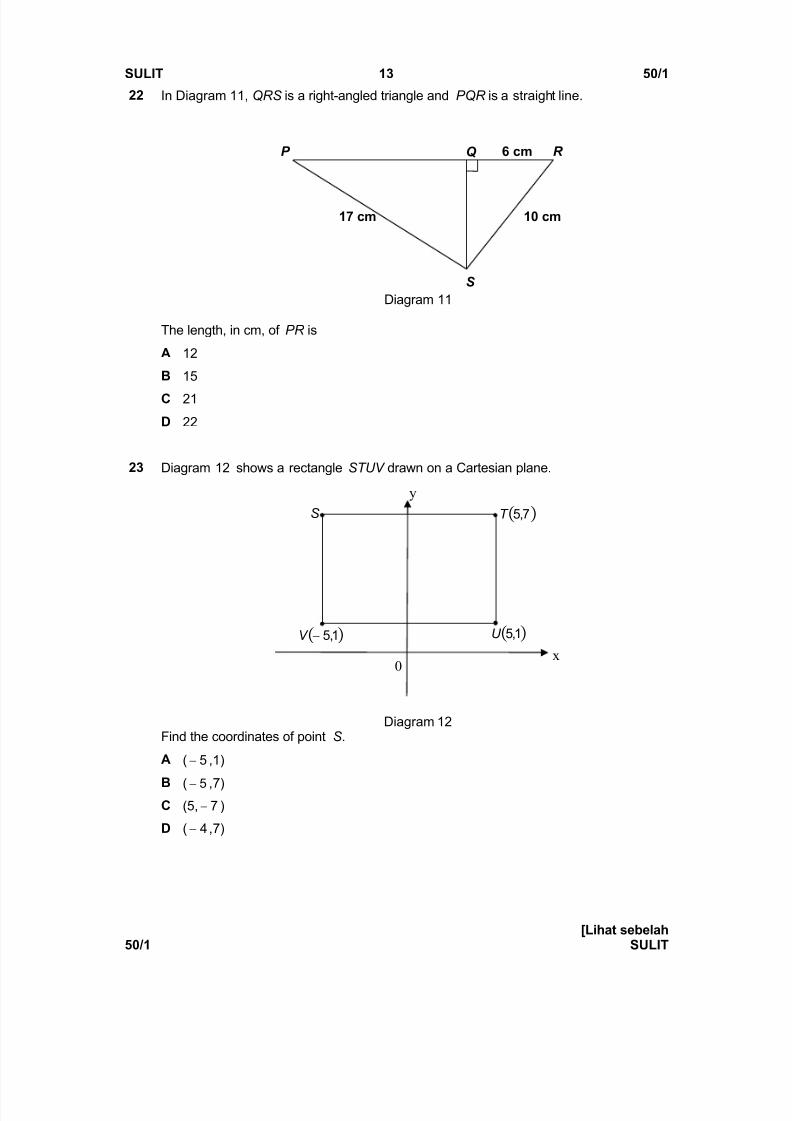
22 In Diagram 11, QRS is a right-angled triangle and PQR is a straight line.
Diagram 11
The length, in cm, of PR is
A 12
B 15
C 21
D 22
23 Diagram 12 shows a rectangle STUV drawn on a Cartesian plane.
Diagram 12Find the coordinates of point S .
A ( 5 ,1)
B ( 5 ,7 )C (5, 7 )
D ( 4 ,7 )
R
S
6 cm
10 cm 17 cm
Q P
S
1,5V
7,5T
1,5U
x
y
0
8/8/2019 Paper 1edit
http://slidepdf.com/reader/full/paper-1edit 10/18
8/8/2019 Paper 1edit
http://slidepdf.com/reader/full/paper-1edit 11/18
SULIT 15 50/1
[Lihat sebelah 50/1 SULIT
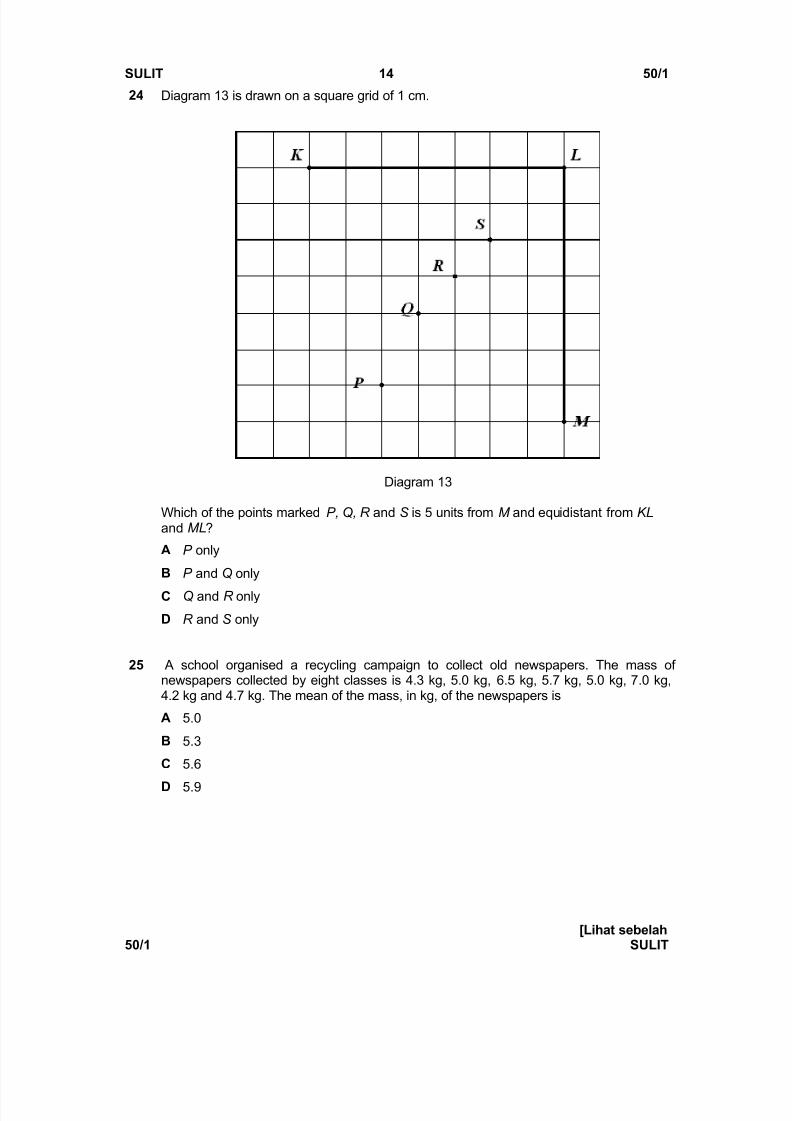
26 Table 1 shows the frequency of grades obtained by a group of students in a class.
Grades A B C D E
Frequency 10 12 8 x 6
Table 1
If the mode is grade D, then the possible value of x is
A 7
B 9
C 12
D 13
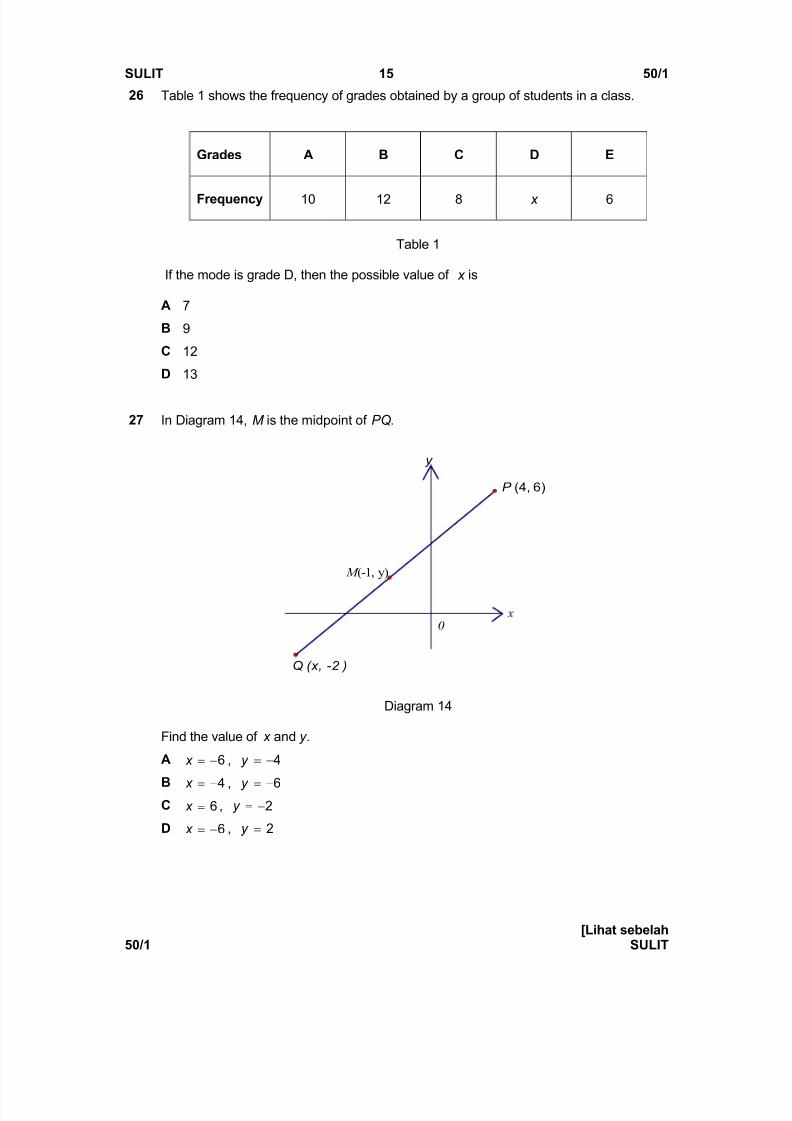
27 In Diagram 14, M is the midpoint of PQ .
y
Q (x, -2 )
P (4, 6)
0
M (-1, y)
Diagram 14
Find the value of x and y .
A 6! x , 4!y
B 4! x , 6!y C 6! x , 2!y
D 6! x , 2!y
8/8/2019 Paper 1edit
http://slidepdf.com/reader/full/paper-1edit 12/18
8/8/2019 Paper 1edit
http://slidepdf.com/reader/full/paper-1edit 13/18
SULIT 17 50/1
[Lihat sebelah 50/1 SULIT
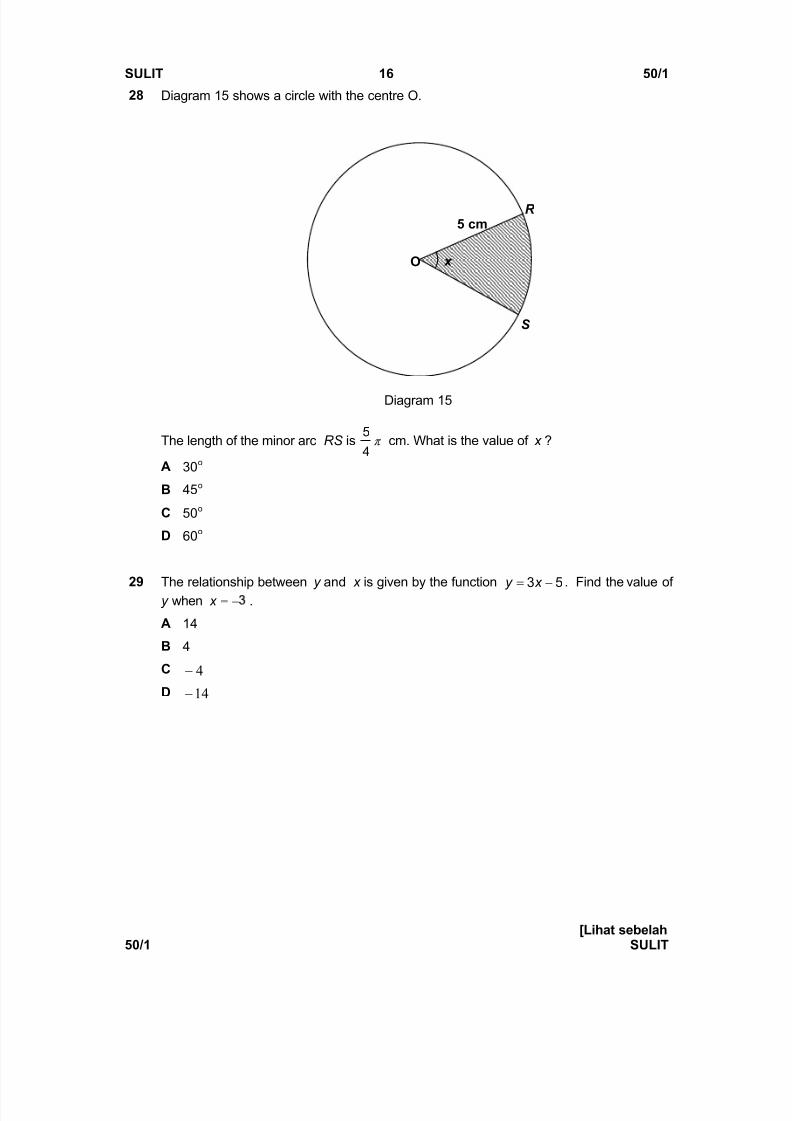
30 Diagram 1 6 shows a circle with diameter 21 cm and a square of side 10 cm.
)7
22( !T use
Diagram 1 6
What is the area, in cm 2, of the shaded region ?
A 24 6 .5
B 34 6 .5
C 9 86
D 128 6
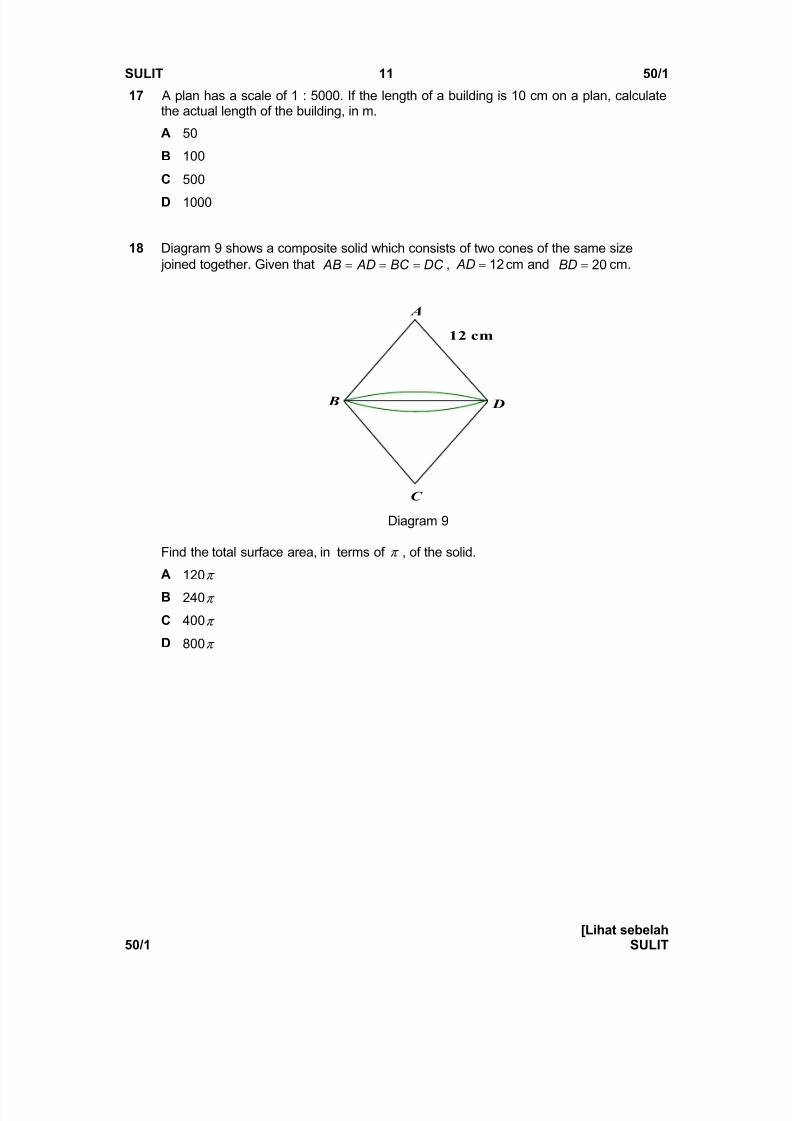
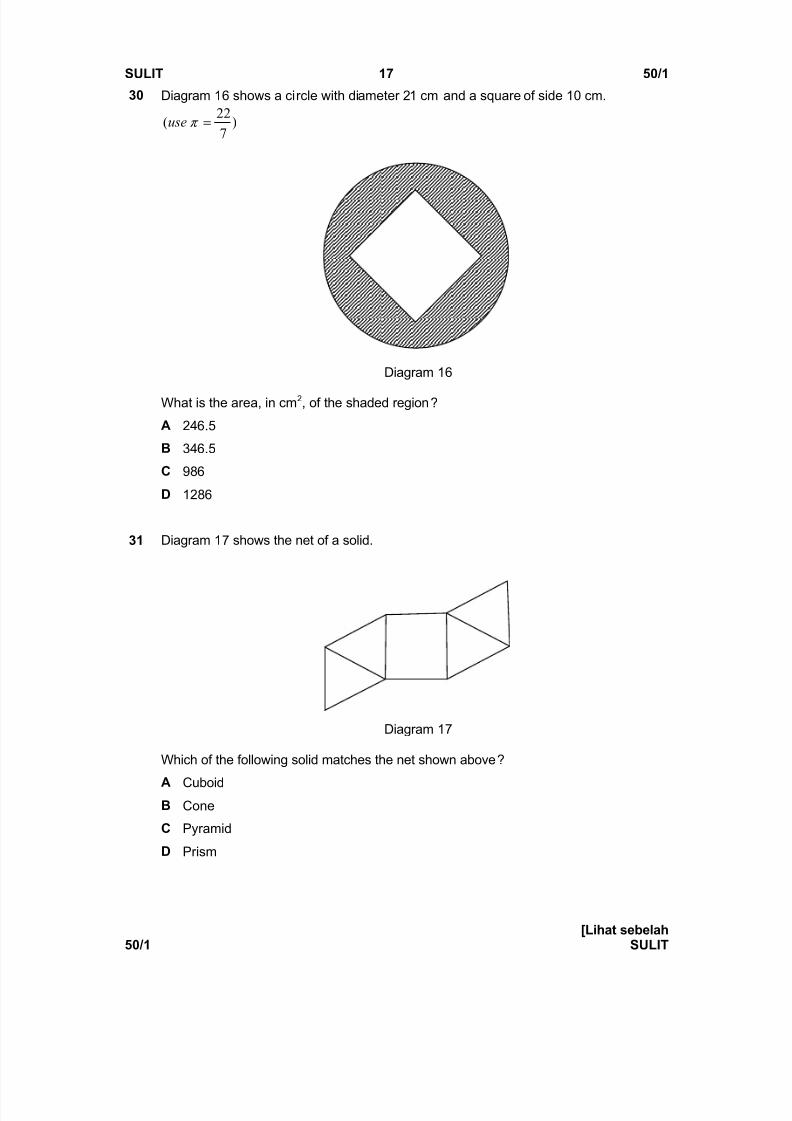
31 Diagram 1 7 shows the net of a solid.
Diagram 1 7
Which of the following solid matches the net shown above ?
A CuboidB Cone
C Pyramid
D Prism
8/8/2019 Paper 1edit
http://slidepdf.com/reader/full/paper-1edit 14/18
SULIT 18 50/1
[Lihat sebelah50/1 SULIT
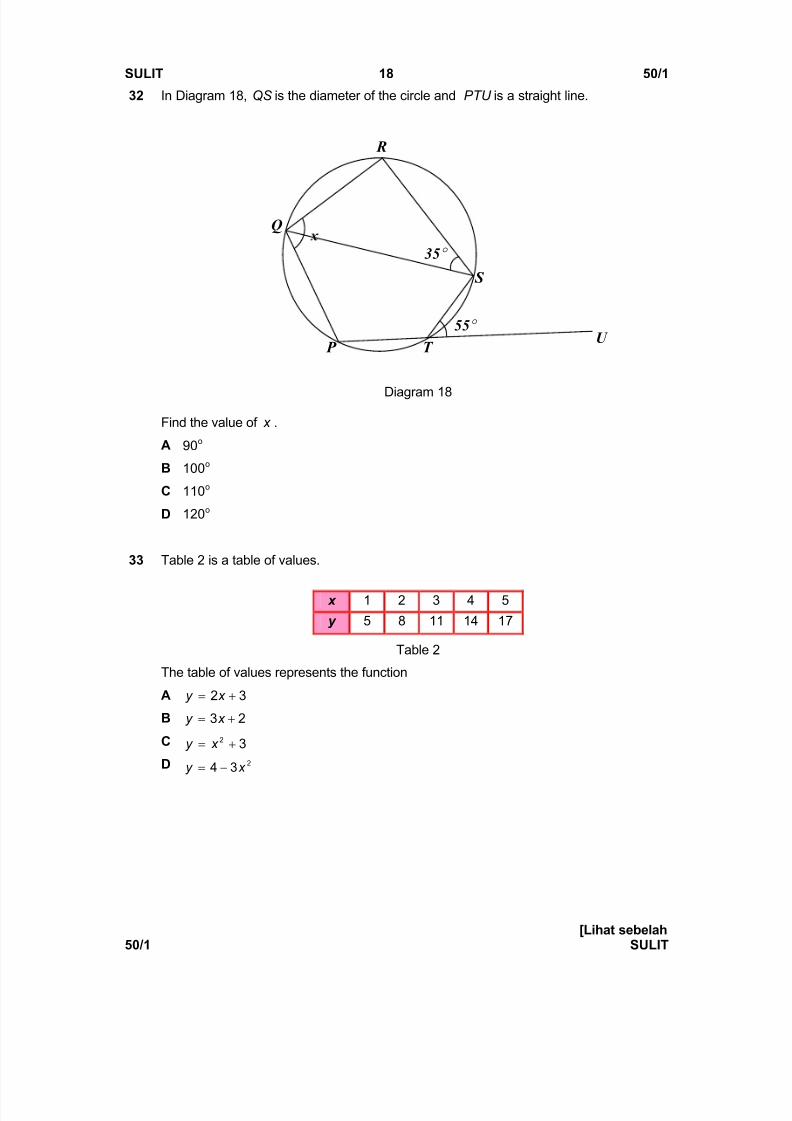
32 In Diagram 18, QS is the diameter of the circle and PTU is a straight line.
55 r
35 r
U T P
S
R
Q
Diagram 18
Find the value of x .
A 9 0 o
B 100 o
C 110 o
D 120 o
33 Table 2 is a table of values.
x 1 2 3 4 5
y 5 8 11 14 1 7
Table 2
The table of values represents the function
A 32! x y
B 23! x y
C 32! x y
D 234 x y !
8/8/2019 Paper 1edit
http://slidepdf.com/reader/full/paper-1edit 15/18
SULIT 19 50/1
[Lihat sebelah 50/1 SULIT
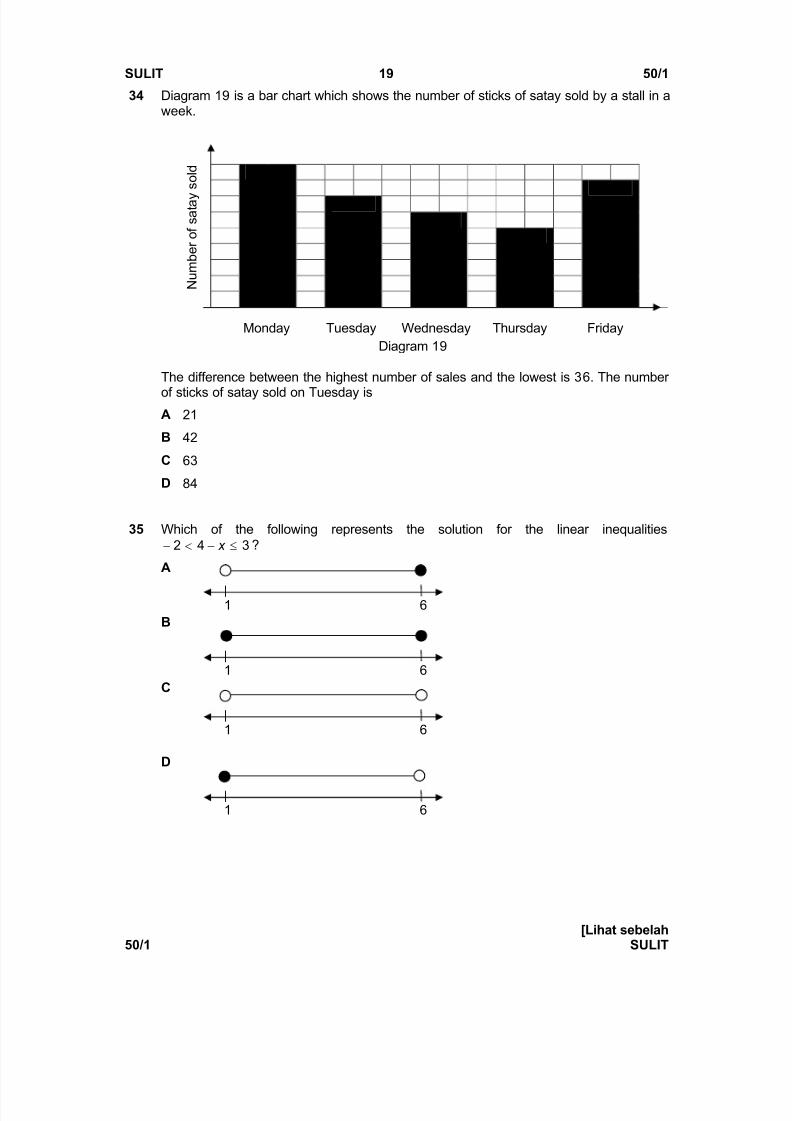
34 Diagram 1 9 is a bar chart which shows the number of sticks of satay sold by a stall in aweek.
Diagram 1 9
The difference between the highest number of sales and the lowest is 3 6 . The number
of sticks of satay sold on Tuesday isA 21
B 42
C 6 3
D 84
35 Which of the following represents the solution for the linear inequalities342 e x ?
A
B
C
D
1 6
1 6
1 6
1 6
Monday Tuesday Wednesday Thursday Friday
N u m
b e r o
f s a
t a y
s o
l d
8/8/2019 Paper 1edit
http://slidepdf.com/reader/full/paper-1edit 16/18
SULIT 20 50/1
[Lihat sebelah50/1 SULIT
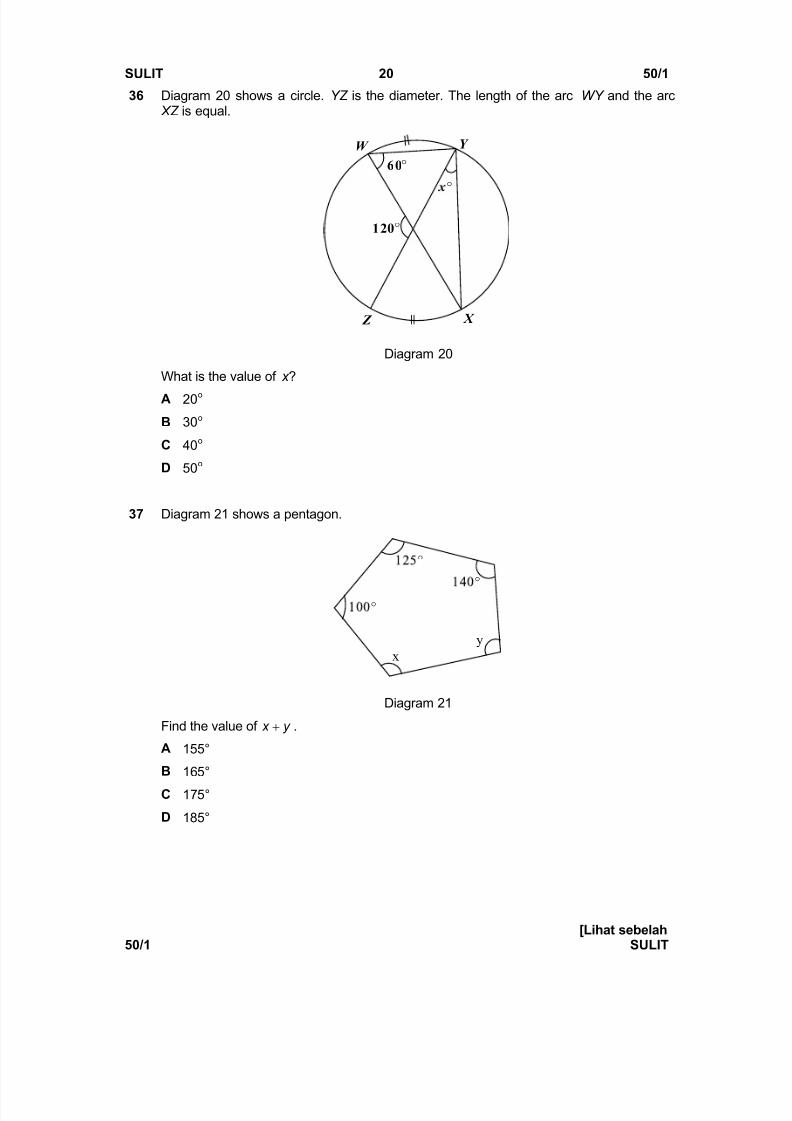
36 Diagram 20 shows a circle. YZ is the diameter. The length of the arc WY and the arc XZ is equal.
120 r
Z X
Y W
6 0 r
r
Diagram 20
What is the value of x ?
A 20 o
B 30 o
C 40 o
D 50 o
37 Diagram 21 shows a pentagon.
yx
rr
r
Diagram 21
Find the value of y x .
A 155°
B 16 5°
C 17 5°
D 185°
8/8/2019 Paper 1edit
http://slidepdf.com/reader/full/paper-1edit 17/18
8/8/2019 Paper 1edit
http://slidepdf.com/reader/full/paper-1edit 18/18
SULIT 22 50/1
[Lihat sebelah50/1 SULIT
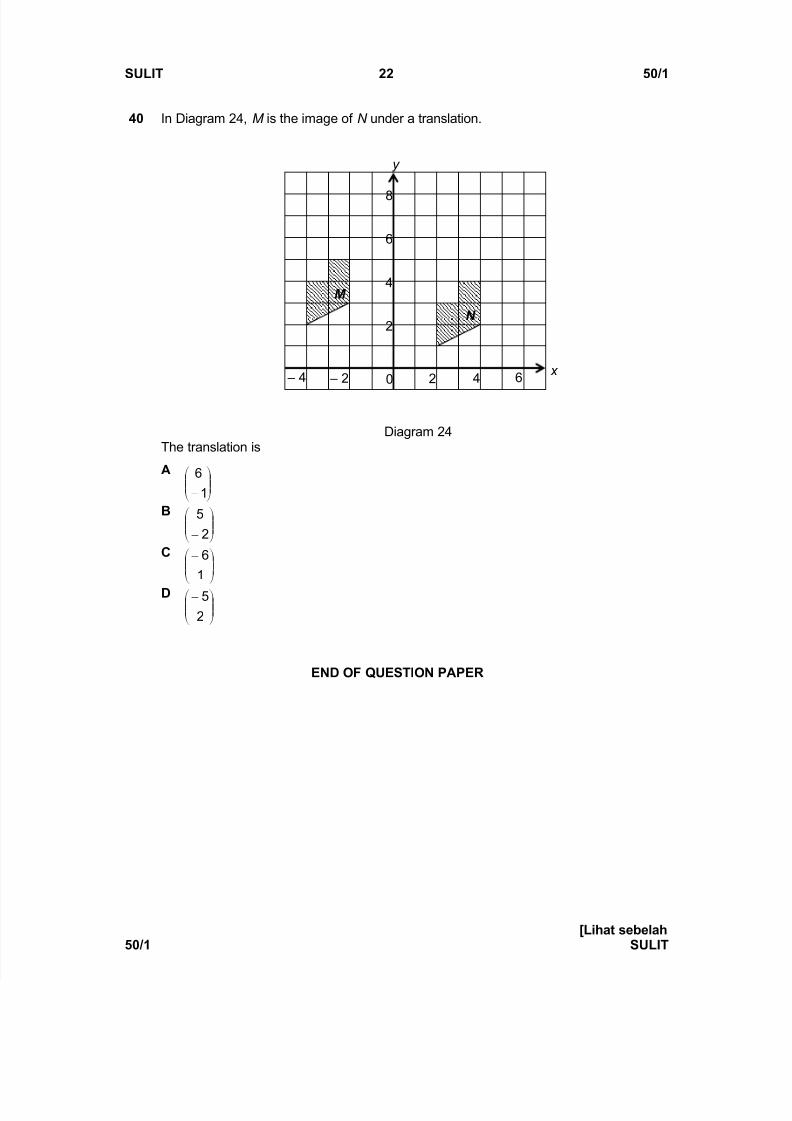
40 In Diagram 24, M is the image of N under a translation.
Diagram 24The translation is
A ¹¹ º
¸©©ª
¨
1
6
B¹¹ º
¸©©ª
¨2
5
C¹¹ º
¸©©ª
¨
1
6
D¹¹ º
¸©©ª
¨2
5
END O F QUESTI O N P APER
6 420 x
y
± 4 ± 2
M
N
6
4
2
8