paper cc-017 pivottable – a powerful tool for data exploration
TRANSCRIPT

Paper CC-017 PivotTable – A Powerful Tool for Data Exploration
in the Pharmaceutical Industry Wei (Lisa) Lin & June Cheng, Merck & Co, Inc., Upper Gwynedd, PA
ABSTRACT PivotTable is a powerful Microsoft® Excel tool used to create interactive tables that automatically extract, organize, and summarize large amounts of data. Additionally, PivotTable reports can be used to analyze data, make comparisons, detect patterns and relationships, and discover trends. As statistical programmers working in a large pharmaceutical company, we have found PivotTable to be a very useful tool for communicating with our clients because it is fast, easy and interactive. We mainly use these PivotTable reports for exploratory/ad-hoc analysis before formal reporting tables are produced. This paper will show how to use patients' Adverse Event (AE) information to create pivot tables from a SAS® dataset. INTRODUCTION PivotTable is one of the most powerful and useful features of Microsoft® Excel. PivotTable allows for the pivoting of data via drag-and-drop techniques, and can be used to create a table that produces statistical information. The biggest advantage of PivotTable is that meaningful information can be generated and extracted from a large table of information within a matter of minutes, or even seconds. In this paper, AE data will be used as an example to demonstrate how to create a pivot table for clinical review. STEPS TO CREATE A PIVOT TABLE: Step 1: Generate AE dataset in SAS. In the pharmaceutical industry, AE information is critical for evaluating the safety of a drug. Imagine we have a SAS AE dataset containing AE information such as Subject Identifier (subjid), Report Term of Adverse Events (aeterm), Body System or Organ Class of AE (aebodsys), Serious Events (aeser), Causality of AE (aerel), Severity of AE (aesev), AE start date (aestdt), AE end date (aeendt), etc. The AE dataset will be merged with the DM (Demographic) dataset to contain all the information needed. Below is an example of a resulting AE dataset:
1

Step 2: Export SAS dataset to Excel. Now this SAS dataset needs to be exported to an Excel file. There are a couple of ways to do that. One is to use the export wizard in SAS: click on "Export Data" under "File", follow the steps to enter the libname and name of the dataset, and enter the location and name of the Excel file to export. Another method to export SAS dataset to an Excel file is by using following SAS statements: proc export data = A.AE outfile = "C:\Documents and Settings\Linlis\My Documents\Test\ae.xls" dbms = EXCEL; run; After the Excel file AE.xls has been created, Excel can be opened and AE.xls can be used to create a pivot table. This step can be automated in SAS with the following statements:
2
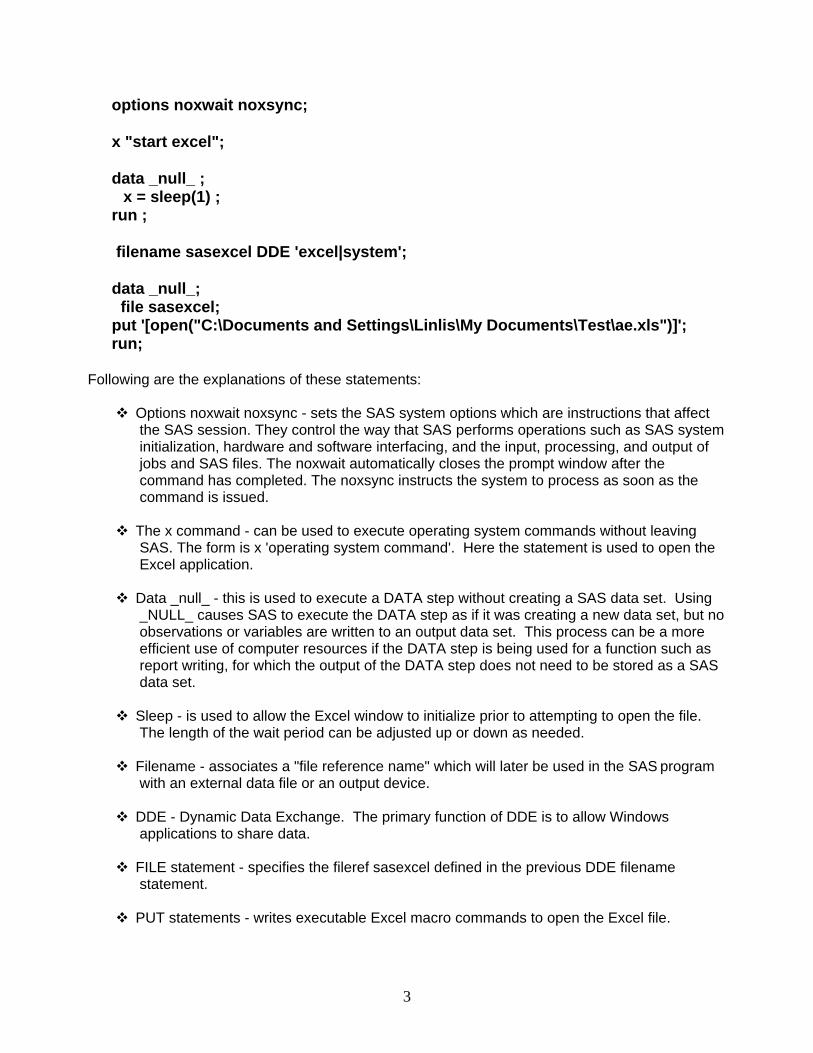
options noxwait noxsync; x "start excel"; data _null_ ; x = sleep(1) ; run ; filename sasexcel DDE 'excel|system'; data _null_; file sasexcel; put '[open("C:\Documents and Settings\Linlis\My Documents\Test\ae.xls")]'; run; Following are the explanations of these statements:
Options noxwait noxsync - sets the SAS system options which are instructions that affect the SAS session. They control the way that SAS performs operations such as SAS system initialization, hardware and software interfacing, and the input, processing, and output of jobs and SAS files. The noxwait automatically closes the prompt window after the command has completed. The noxsync instructs the system to process as soon as the command is issued.
The x command - can be used to execute operating system commands without leaving
SAS. The form is x 'operating system command'. Here the statement is used to open the Excel application.
Data _null_ - this is used to execute a DATA step without creating a SAS data set. Using
_NULL_ causes SAS to execute the DATA step as if it was creating a new data set, but no observations or variables are written to an output data set. This process can be a more efficient use of computer resources if the DATA step is being used for a function such as report writing, for which the output of the DATA step does not need to be stored as a SAS data set.
Sleep - is used to allow the Excel window to initialize prior to attempting to open the file.
The length of the wait period can be adjusted up or down as needed.
Filename - associates a "file reference name" which will later be used in the SAS program with an external data file or an output device.
DDE - Dynamic Data Exchange. The primary function of DDE is to allow Windows
applications to share data.
FILE statement - specifies the fileref sasexcel defined in the previous DDE filename statement.
PUT statements - writes executable Excel macro commands to open the Excel file.
3

At this point, AE.xls is opened in Excel:
Step 3: Create Pivot Table. Before pivoting the table, the following information should be ready:
Where is the data stored; Which column of data is going into which field, e.g. the optional page field, and mandatory
row, column and data fields; Where should the pivot table go, e.g. a new worksheet or an existing one.
Now the PivotTable wizard is used to create the pivot table. From Excel's menu bar, click on "Data", then click on "PivotTable and PivotChart Report", and the PivotTable wizard starts up. The wizard will guide us through the steps to create a pivot table. This should generally follow the default selections until the following screen is seen after clicking on "Finish".
4

The PivotTable Field List on the right is used to drag and drop the specific field to page, row, column and data fields. Page fields allow filtering of the entire PivotTable report to display data for a single item or all the items. Row fields and column fields are self explanatory. Data fields provide the data values to be summarized. Usually data fields contain numbers, which are combined with the Sum summary function, but data fields can also contain text, in which case the PivotTable report uses the Count summary function.
Clicking on "Options" instead of "Finish" allows more flexibility:
5

The base pivot table is now complete.
As demonstrated, the pivot table is easily constructed and the results include:
• Specific AE by Body System ; • AE dictionary term, AE reported term; • The count of particular AETERM (or whatever else is chosen to put at data area); • Other information selected by the user.
The pivot table has dynamic elements. For example, click on the drop down arrows in the page area to change selects. In the example above, “All” can be changed to the specific subjid, siteno, race, sex, etc to view the detailed AE information for the selection. It is also possible to drill down to details. Subjid, race, sex, etc. can be selected to view for the particular AETERM by double clicking on the AETERM, and a new worksheet will pop up showing all the information including subjid, site number, race, sex, date of birth, AE start date, AE intensity, AE causality, AE seriousness, etc by double clicking on the count (shown below).
6
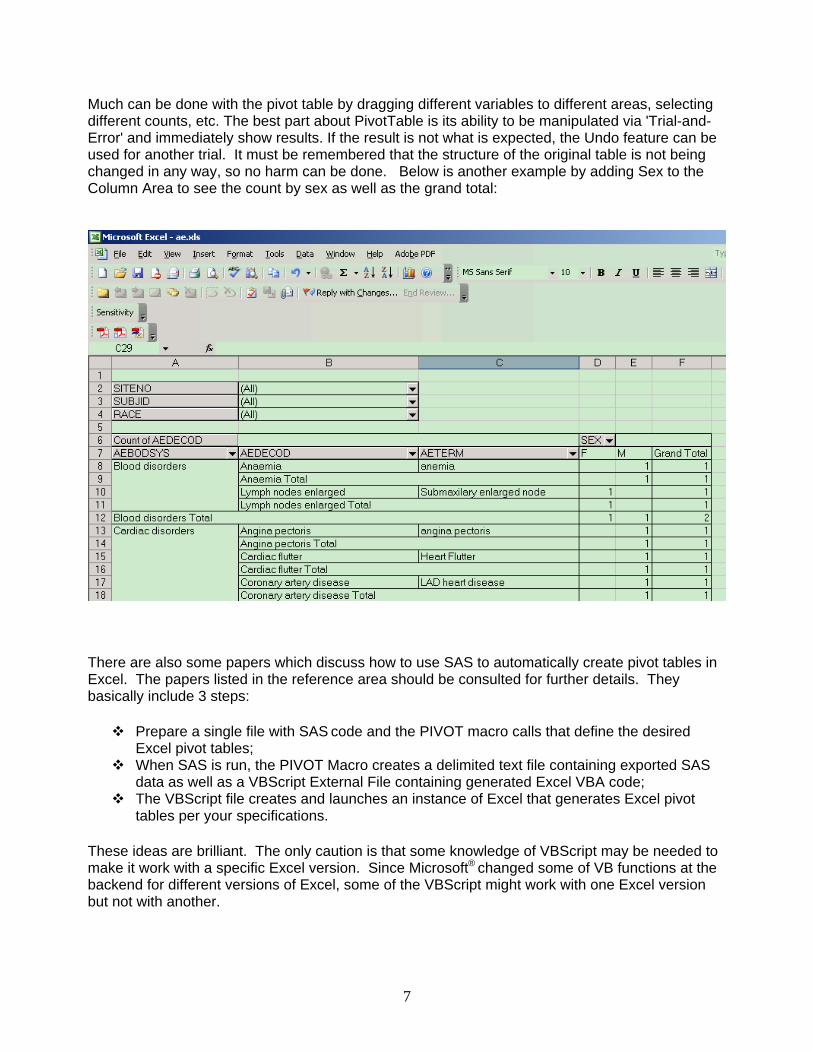
Much can be done with the pivot table by dragging different variables to different areas, selecting different counts, etc. The best part about PivotTable is its ability to be manipulated via 'Trial-and-Error' and immediately show results. If the result is not what is expected, the Undo feature can be used for another trial. It must be remembered that the structure of the original table is not being changed in any way, so no harm can be done. Below is another example by adding Sex to the Column Area to see the count by sex as well as the grand total:
There are also some papers which discuss how to use SAS to automatically create pivot tables in Excel. The papers listed in the reference area should be consulted for further details. They basically include 3 steps:
Prepare a single file with SAS code and the PIVOT macro calls that define the desired Excel pivot tables;
When SAS is run, the PIVOT Macro creates a delimited text file containing exported SAS data as well as a VBScript External File containing generated Excel VBA code;
The VBScript file creates and launches an instance of Excel that generates Excel pivot tables per your specifications.
These ideas are brilliant. The only caution is that some knowledge of VBScript may be needed to make it work with a specific Excel version. Since Microsoft® changed some of VB functions at the backend for different versions of Excel, some of the VBScript might work with one Excel version but not with another.
7

CONCLUSION This paper presents PivotTable as an easy and powerful tool to perform data exploration. It also demonstrates the following main benefits: end users do not have to wait for programmers to produce formal reporting tables to perform their data exploration; end users can decide and create on the fly the additional views/summaries that occur to them while they are reviewing the data; tremendous resources are saved when programmers do not have to produce formal reporting tables for exploratory purposes. So just go ahead and give PivotTable a try! REFERENCES Ted Conway "Sur La Table: Creating Microsoft Excel PivotTables in a Jiffy from SAS Data" SUGI 31, March 2006 John DeMeo "Creating Microsoft Excel Pivot Tables from SAS - (Part 2)" SAS Global Forum, April 2007
CONTACT INFORMATION
Your comments and questions are valued and encouraged. Contact the authors at:
Wei (Lisa) Lin Merck & Co., Inc. UG1CD-14 Po Box 1000 North Wales, PA 19454-1099 Work Phone: 267-305-6521 Email: [email protected]
June Cheng Merck & Co., Inc. UG1CD-14 Po Box 1000 North Wales, PA 19454-1099 Work Phone: 267-305-5389 Email: [email protected] TRADEMARKS SAS and all other SAS Institute Inc. product or service names are registered trademarks or trademarks of SAS Institute Inc. in the USA and other countries. ® indicates USA registration. Other brand and product names are trademarks of their respective companies.
8