paper prepared for presentation at the tenth annual
TRANSCRIPT

DRAFT: FOR REVIEW ONLY.
DO NOT CITE OR QUOTE
Global Adoption of Agricultural Biotechnology: Modeling and Preliminary Results
Jorge Fernandez-Cornejo, Ruben Lubowski, and Agapi Somwaru *
May, 2007
Paper prepared for presentation at the Tenth Annual Conference on Global Economic Analysis, West Lafayette, IN, June 7-9, 2007.
* Authors are economists at the Economic Research Service, U.S. Department of Agriculture, 1800 M Street, NW, Washington DC, 20036. Please do not cite, reproduce, or distribute without permission of the authors. The views expressed are those of the authors and do not necessarily correspond to the views or policies of the Economic Research Service or the U.S. Department of Agriculture.

Introduction
This paper analyzes the economic and land-use implications of world trends in the adoption of
agricultural biotechnology. Driven by farmers' expectations of higher yields, savings in management
time, and lower pesticide costs, the global adoption of biotech corn, soybeans, and cotton crop varieties
has increased rapidly over the past ten years. An estimated 220 million acres of biotech crops with
herbicide tolerance and/or insect resistance traits were cultivated in 21 countries worldwide in 2005, a
10-percent increase over 2004. At present, only a few countries account for most of the world’s
biotech acreage (Figure 1). U.S. acreage accounts for about 55 percent, followed by Argentina (19
percent), Brazil (10 percent), Canada (6 percent), China (4 percent), Paraguay (2 percent), and India
(more than 1 percent).
Technological change has been acknowledged as a critical component of productivity and
economic growth (Solow, 1994; Griliches, 1995). The rapid adoption and diffusion of new
technologies within the U.S. agricultural sector has resulted in sustained agricultural productivity
growth and ensured an abundance of food (Huffman and Evenson, 1993; Alston and Pardey, 1996;
Ball et al., 1997). However, since technological change can also affect employment, trade, real wages,
and the environment, the adoption of new technologies may trigger asymmetric effects on different
sectors of the economy.
Over the past decade, developments in modern biotechnology have expanded the scope of
biological innovations by providing new tools for increasing crop yields and agricultural productivity
while causing some environmental and consumer concerns, particularly in Europe. Agricultural
biotechnology is a collection of scientific techniques, including genetic engineering, that are used to
create, improve, or modify plants, animals, and microorganisms. Genetic engineering modifies
organisms by recombinant DNA techniques. These techniques allow a more precise and time-saving
alteration of a plants’ traits, facilitating the development of characteristics that are not feasible through
DRAFT: FOR REVIEW ONLY. DO NOT CITE OR QUOTE.
2

traditional plant breeding. Genetic engineering also allows scientists to target a single plant trait, thus
decreasing the number of unintended characteristics that often accompany traditional breeding
techniques, and increasing the speed at which breeders can develop new varieties. The first generation
of genetically engineered (GE) crops includes crops with pest management traits, including those
carrying genes selected for resistance to certain insects and/or tolerance to specific herbicides.
GE varieties of soybeans, corn, and cotton have been available commercially since 1996, and
the rate of adoption by farmers has climbed in most years since then. For the most part, farmers have
adopted herbicide-tolerant (HT) varieties—which help control weeds by surviving certain potent
herbicides that previously would have destroyed the crop along with the targeted weeds—and insect-
resistant (Bt) varieties, which contain a gene from the soil bacterium, Bacillus thuringiensis (Bt) that
produces a protein toxic to specific insects (European corn borer and corn rootworm for the case of
corn and tobacco budworm, bollworm, and pink bollworm for the case of cotton). The main crop
adopted is soybeans as HT soybeans reached 134 million acres in 2005 (ISAAA, 2006) followed by
GE corn (HT and Bt) with 52 million acres, and cotton (HT and Bt) that reached 24 million acres.
Other GE crops planted by U.S. farmers over the past 10 years include HT canola, virus-resistant
papaya, and virus-resistant squash. In addition, Bt potato varieties were introduced in 1996 but
withdrawn from the market after the 2001 season, and a tomato variety genetically engineered to
remain on the vine longer and ripen to full flavor after harvest was introduced in 1994 but was
withdrawn from the market after being available sporadically for several years (Fernandez-Cornejo and
Caswell, 2006).
The overall objectives of the study are to examine some of the global economic and
environmental implications of increasing adoption of major GE crop varieties within the countries that
are currently the leading adopters as well as in others. We explore effects of different adoption
scenarios for agricultural biotechnology and consider implications for production, trade, prices, as well
as the location and characteristics of land in agricultural production. This study provides the first
DRAFT: FOR REVIEW ONLY. DO NOT CITE OR QUOTE.
3

examination of these issues in an integrated economic and biophysical framework. We focus on the
adoption of two major crops: HT soybeans and Bt corn.
The rest of this paper will briefly describe the model used, discuss recent changes introduced
to the model, and present preliminary simulation results on the global economic effects of increased
GE crop adoption under several scenarios.
The Model and Data
To examine these issues, we updated and refined the Future Agricultural Resources Model
(FARM), which was developed by the Economic Research Service (ERS) of the U.S. Department of
Agriculture. FARM II is an integrated modeling framework designed to analyze global changes
related to long-run agricultural and environmental resources. This model was originally developed by
Roy Darwin and others (John Sullivan, Kevin Ingram, Vince Breneman from ERS, Lahouari Bounoua,
from NASA and the University of Maryland and Marc Imhoff from NASA) (Darwin et al, 1995,
Darwin and Kennedy, 2002). Darwin and his collaborators were some of the first to introduce into
their global economic modeling the concept of agro-ecological zones (AEZ), where land is divided
into classes based on climate and other physical characteristics that affect the suitability of land to
grow different crops and productivity of different uses.
Previous versions of FARM have been used primarily to analyze the impacts of greenhouse gas
emissions on agriculture (Darwin et al., 1994, 1995; Darwin, 1999, 2003, 2004b; Darwin and
Kennedy, 2000). Other applications include: costs of sea level rise (Darwin and Tol, 2001); the
impacts of changes in agricultural technology on land use (Ianchovichina et al., 2001); the costs of
protecting global ecosystem diversity (Lewandrowski et al., 1999); and the effects of trade
deregulation and population growth on tropical forests (Darwin et al., 1996).
DRAFT: FOR REVIEW ONLY. DO NOT CITE OR QUOTE.
4
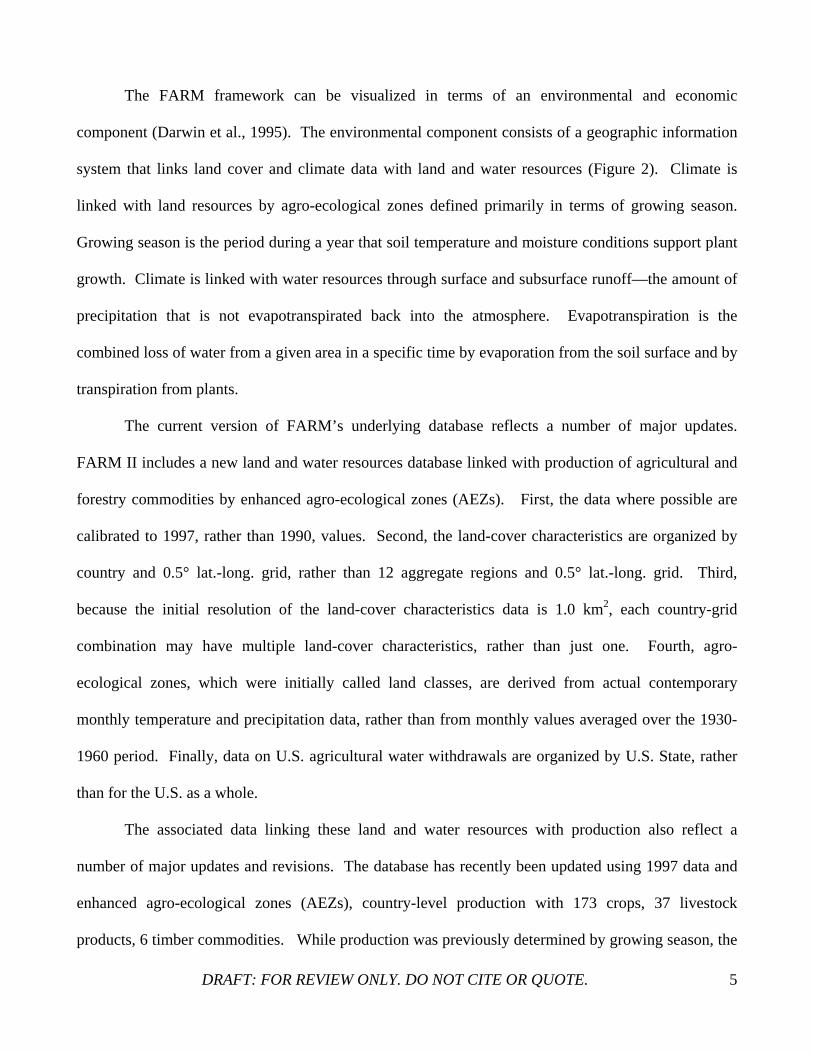
The FARM framework can be visualized in terms of an environmental and economic
component (Darwin et al., 1995). The environmental component consists of a geographic information
system that links land cover and climate data with land and water resources (Figure 2). Climate is
linked with land resources by agro-ecological zones defined primarily in terms of growing season.
Growing season is the period during a year that soil temperature and moisture conditions support plant
growth. Climate is linked with water resources through surface and subsurface runoff—the amount of
precipitation that is not evapotranspirated back into the atmosphere. Evapotranspiration is the
combined loss of water from a given area in a specific time by evaporation from the soil surface and by
transpiration from plants.
The current version of FARM’s underlying database reflects a number of major updates.
FARM II includes a new land and water resources database linked with production of agricultural and
forestry commodities by enhanced agro-ecological zones (AEZs). First, the data where possible are
calibrated to 1997, rather than 1990, values. Second, the land-cover characteristics are organized by
country and 0.5° lat.-long. grid, rather than 12 aggregate regions and 0.5° lat.-long. grid. Third,
because the initial resolution of the land-cover characteristics data is 1.0 km2, each country-grid
combination may have multiple land-cover characteristics, rather than just one. Fourth, agro-
ecological zones, which were initially called land classes, are derived from actual contemporary
monthly temperature and precipitation data, rather than from monthly values averaged over the 1930-
1960 period. Finally, data on U.S. agricultural water withdrawals are organized by U.S. State, rather
than for the U.S. as a whole.
The associated data linking these land and water resources with production also reflect a
number of major updates and revisions. The database has recently been updated using 1997 data and
enhanced agro-ecological zones (AEZs), country-level production with 173 crops, 37 livestock
products, 6 timber commodities. While production was previously determined by growing season, the
DRAFT: FOR REVIEW ONLY. DO NOT CITE OR QUOTE.
5
current version uses plant hardiness zones (PHZ) (9 categories) and thermal regimes (six categories) in
addition to length of growing season (six categories) in order to distribute commodities to land covers.
Finally, distribution of livestock and forestry products is further constrained by population density.
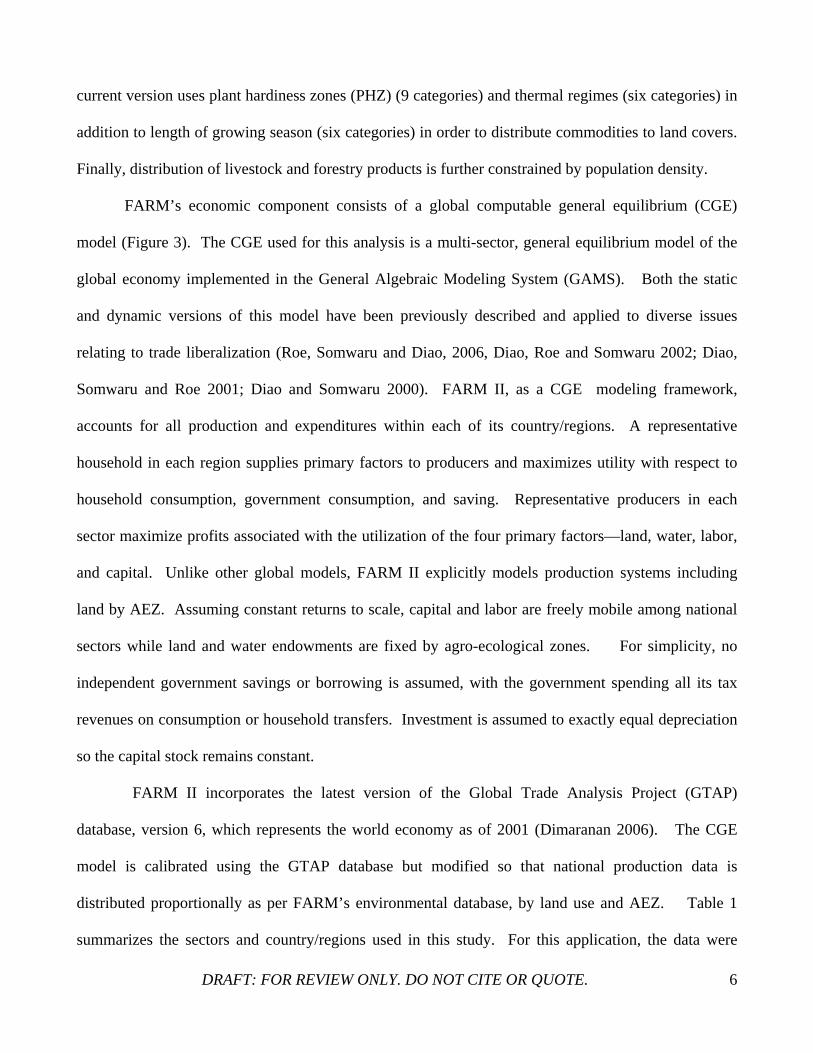
FARM’s economic component consists of a global computable general equilibrium (CGE)
model (Figure 3). The CGE used for this analysis is a multi-sector, general equilibrium model of the
global economy implemented in the General Algebraic Modeling System (GAMS). Both the static
and dynamic versions of this model have been previously described and applied to diverse issues
relating to trade liberalization (Roe, Somwaru and Diao, 2006, Diao, Roe and Somwaru 2002; Diao,
Somwaru and Roe 2001; Diao and Somwaru 2000). FARM II, as a CGE modeling framework,
accounts for all production and expenditures within each of its country/regions. A representative
household in each region supplies primary factors to producers and maximizes utility with respect to
household consumption, government consumption, and saving. Representative producers in each
sector maximize profits associated with the utilization of the four primary factors—land, water, labor,
and capital. Unlike other global models, FARM II explicitly models production systems including
land by AEZ. Assuming constant returns to scale, capital and labor are freely mobile among national
sectors while land and water endowments are fixed by agro-ecological zones. For simplicity, no
independent government savings or borrowing is assumed, with the government spending all its tax
revenues on consumption or household transfers. Investment is assumed to exactly equal depreciation
so the capital stock remains constant.
FARM II incorporates the latest version of the Global Trade Analysis Project (GTAP)
database, version 6, which represents the world economy as of 2001 (Dimaranan 2006). The CGE
model is calibrated using the GTAP database but modified so that national production data is
distributed proportionally as per FARM’s environmental database, by land use and AEZ. Table 1
summarizes the sectors and country/regions used in this study. For this application, the data were
DRAFT: FOR REVIEW ONLY. DO NOT CITE OR QUOTE.
6

aggregated into 17 sectors, including 8 agricultural commodities (seven crops—paddy rice, wheat,
other grains, oilseeds, sugar, cotton, other crops—and livestock). In addition, we included nine other
commodities: forestry, fish/meat/dairy, other processed foods, oil and gas, other minerals, textiles and
apparel, manufacturing (non-metallic), other manufacturing, and services. The data were also
aggregated into 19 countries/regions: Canada, United States, Mexico, Argentina, Brazil, Paraguay,
other Western hemisphere, European Union (EU25), Russia (and other countries of the former Soviet
Union), China, India, Pakistan, Indonesia, other East Asia, other South Asia, rest of Asia, Oceania,
Africa, and the rest of the world (ROW).
Costs and Pecuniary Benefits of Agricultural Biotechnology Adoption
As a benchmark for modeling the impacts of adopting agricultural biotechnology, we restrict
attention to production effects, assuming no differences in demand for GE varieties. In particular, we
develop estimates of adoption potential and yield and cost effects (if any) from the adoption of Bt corn
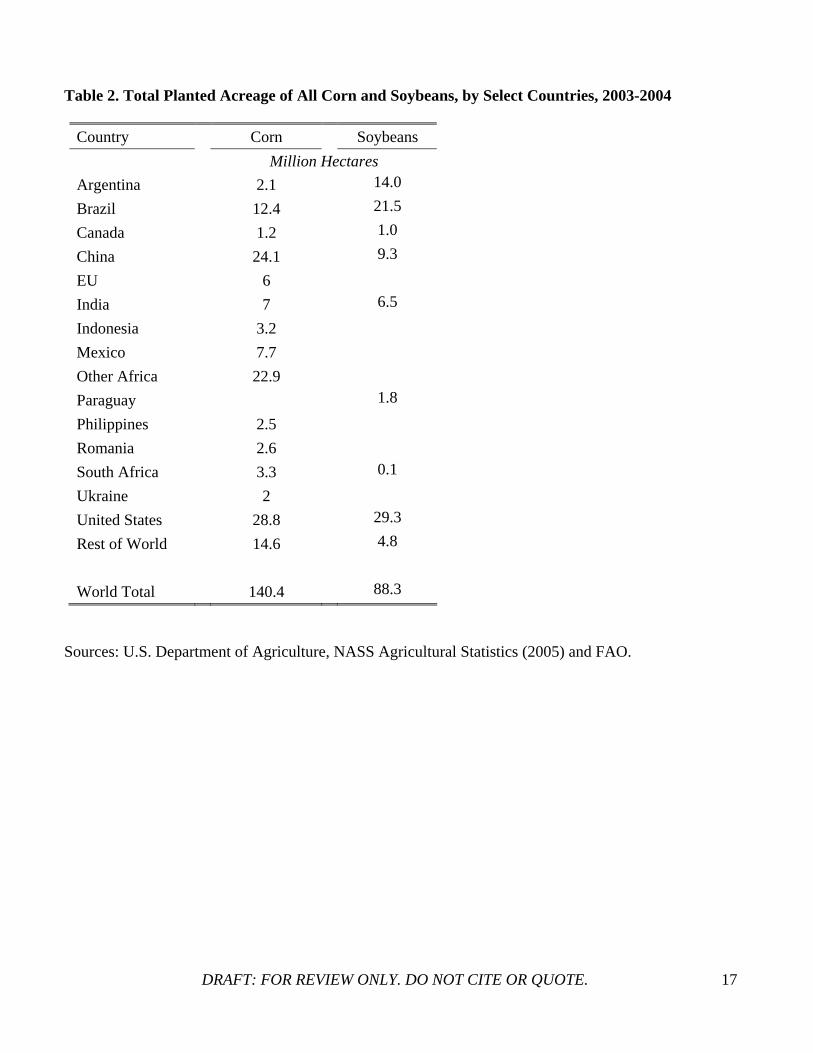
and HT soybeans across countries. We included only countries with at least 1 million hectares planted
of the crop, with the exception of South Africa in the case of soybeans (Table 2).
The estimated potential adoption from current levels is based on estimated infestation at
treatable levels (Table 3). It is expressed as percent of planted area and adapted from James (2003),
unless otherwise indicated. The estimated adoption potentials for Bt corn range from a low of 20
percent in Ukraine to 60 percent in Brazil, India, Mexico, South Africa, and Other Africa. Potentials
equal 40 percent in Argentina, Canada, China, European Union, United States, and other countries. 1
Estimated adoption potentials for HT soybeans are estimated at 90 percent for all the countries
included.
1 EU countries included here are: Austria, Belgium, Luxemburg, Czech Republic, France, Germany, Greece, Hungary, Italy, Netherlands, Poland, Portugal, Slovakia, Slovenia, and Spain.
DRAFT: FOR REVIEW ONLY. DO NOT CITE OR QUOTE.
7
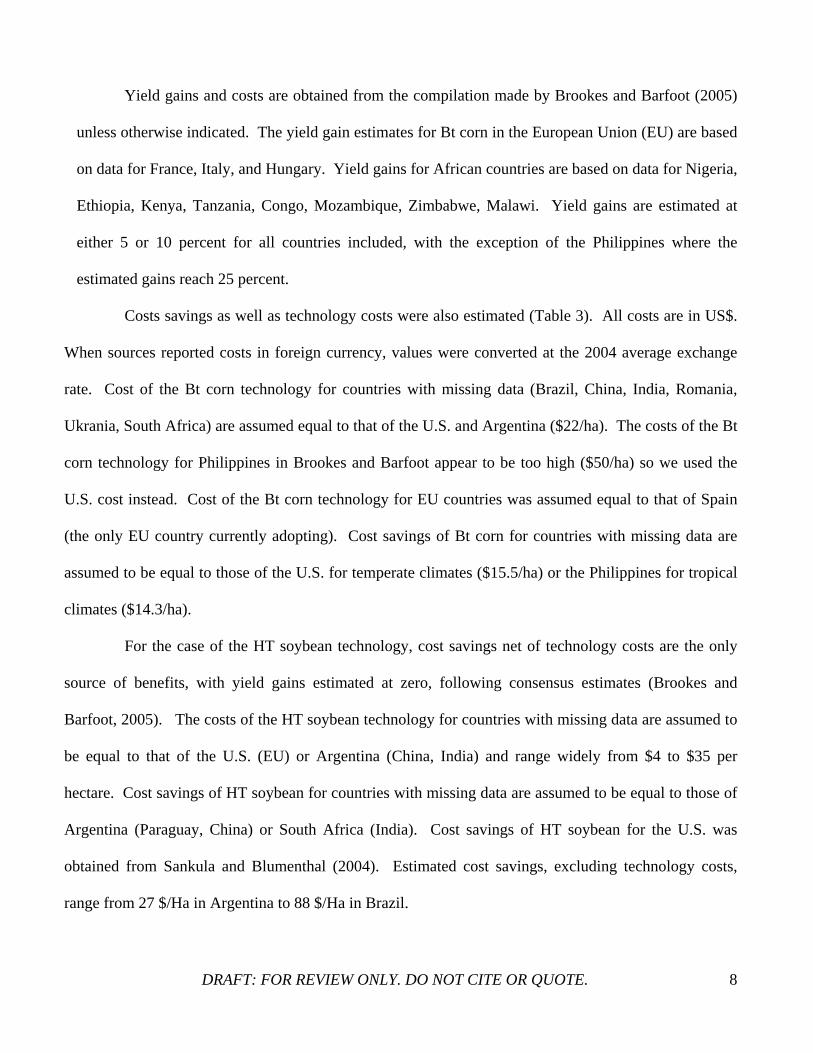
Yield gains and costs are obtained from the compilation made by Brookes and Barfoot (2005)
unless otherwise indicated. The yield gain estimates for Bt corn in the European Union (EU) are based
on data for France, Italy, and Hungary. Yield gains for African countries are based on data for Nigeria,
Ethiopia, Kenya, Tanzania, Congo, Mozambique, Zimbabwe, Malawi. Yield gains are estimated at
either 5 or 10 percent for all countries included, with the exception of the Philippines where the
estimated gains reach 25 percent.
Costs savings as well as technology costs were also estimated (Table 3). All costs are in US$.
When sources reported costs in foreign currency, values were converted at the 2004 average exchange
rate. Cost of the Bt corn technology for countries with missing data (Brazil, China, India, Romania,
Ukrania, South Africa) are assumed equal to that of the U.S. and Argentina ($22/ha). The costs of the Bt
corn technology for Philippines in Brookes and Barfoot appear to be too high ($50/ha) so we used the
U.S. cost instead. Cost of the Bt corn technology for EU countries was assumed equal to that of Spain
(the only EU country currently adopting). Cost savings of Bt corn for countries with missing data are
assumed to be equal to those of the U.S. for temperate climates ($15.5/ha) or the Philippines for tropical
climates ($14.3/ha).
For the case of the HT soybean technology, cost savings net of technology costs are the only
source of benefits, with yield gains estimated at zero, following consensus estimates (Brookes and
Barfoot, 2005). The costs of the HT soybean technology for countries with missing data are assumed to
be equal to that of the U.S. (EU) or Argentina (China, India) and range widely from $4 to $35 per
hectare. Cost savings of HT soybean for countries with missing data are assumed to be equal to those of
Argentina (Paraguay, China) or South Africa (India). Cost savings of HT soybean for the U.S. was
obtained from Sankula and Blumenthal (2004). Estimated cost savings, excluding technology costs,
range from 27 $/Ha in Argentina to 88 $/Ha in Brazil.
DRAFT: FOR REVIEW ONLY. DO NOT CITE OR QUOTE.
8
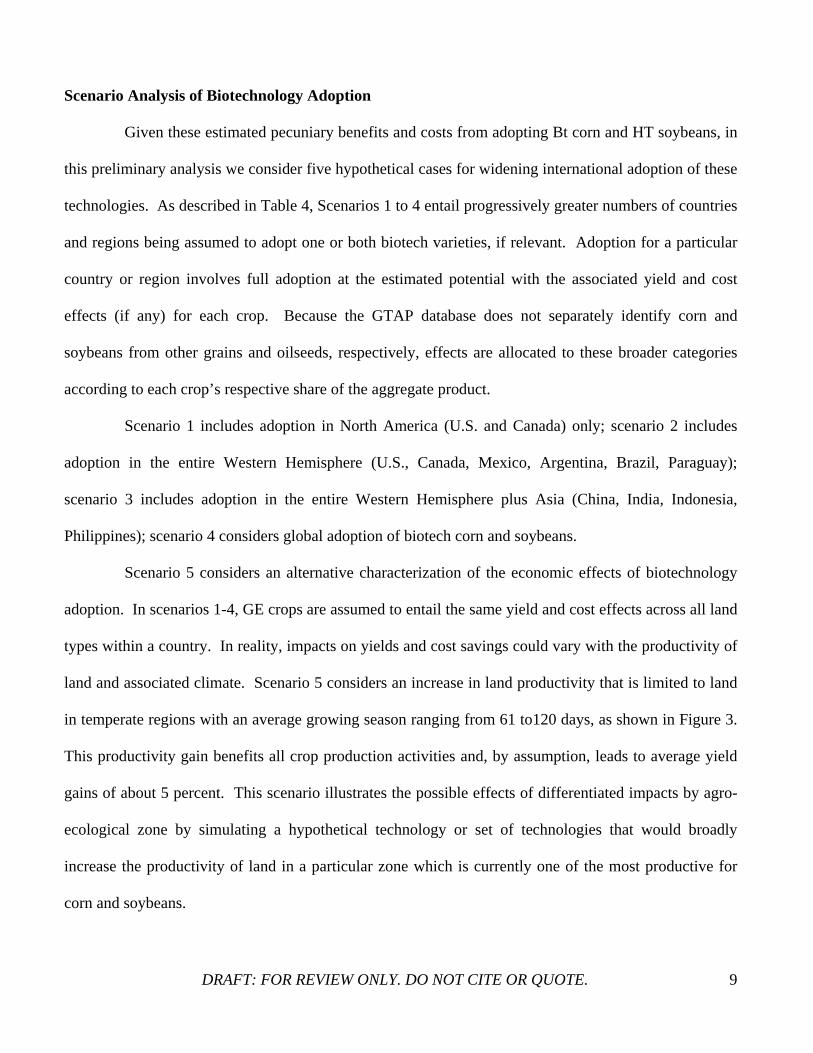
Scenario Analysis of Biotechnology Adoption
Given these estimated pecuniary benefits and costs from adopting Bt corn and HT soybeans, in
this preliminary analysis we consider five hypothetical cases for widening international adoption of these
technologies. As described in Table 4, Scenarios 1 to 4 entail progressively greater numbers of countries
and regions being assumed to adopt one or both biotech varieties, if relevant. Adoption for a particular
country or region involves full adoption at the estimated potential with the associated yield and cost
effects (if any) for each crop. Because the GTAP database does not separately identify corn and
soybeans from other grains and oilseeds, respectively, effects are allocated to these broader categories
according to each crop’s respective share of the aggregate product.
Scenario 1 includes adoption in North America (U.S. and Canada) only; scenario 2 includes
adoption in the entire Western Hemisphere (U.S., Canada, Mexico, Argentina, Brazil, Paraguay);
scenario 3 includes adoption in the entire Western Hemisphere plus Asia (China, India, Indonesia,
Philippines); scenario 4 considers global adoption of biotech corn and soybeans.
Scenario 5 considers an alternative characterization of the economic effects of biotechnology
adoption. In scenarios 1-4, GE crops are assumed to entail the same yield and cost effects across all land
types within a country. In reality, impacts on yields and cost savings could vary with the productivity of
land and associated climate. Scenario 5 considers an increase in land productivity that is limited to land
in temperate regions with an average growing season ranging from 61 to120 days, as shown in Figure 3.
This productivity gain benefits all crop production activities and, by assumption, leads to average yield
gains of about 5 percent. This scenario illustrates the possible effects of differentiated impacts by agro-
ecological zone by simulating a hypothetical technology or set of technologies that would broadly
increase the productivity of land in a particular zone which is currently one of the most productive for
corn and soybeans.
DRAFT: FOR REVIEW ONLY. DO NOT CITE OR QUOTE.
9

Preliminary Results
Preliminary results from the simulations are summarized in Tables 5-8. All impacts are
measured as percentage changes from the model baseline (according to the latest GTAP database,
which represents the world economy as of 2001). Overall global effects are presented in Table 5.
Estimated impacts generally increase progressively as a broader set of countries is assumed to adopt.
In scenarios 1 to 4, greater worldwide adoption of Bt Corn and HT soybeans leads to moderate (0.2-1.5
%) increases in the aggregate production of agricultural commodities with an associated decline in
prices of about 1.1 to 3% (Table 5). Global adoption leads to greater volume of world trade (an
estimated increase of 3.3%) and lesser increases in trade value (about 1.2%) given the decline in
prices. Price declines overshadow trade increases in scenario 3 where adoption occurs in the Western
Hemisphere and Asia, leading to a small (0.17%) decline in trade value.
Results from scenario 5 differ in several key respects. Aggregate production increases and
associated price declines are greater, given a different pattern of production increases. Nevertheless,
the increase in trade volumes is smaller as increases in productivity are spread worldwide across a
broader set of commodities, reducing the advantages from agricultural trade. The larger decline in
prices combined with the smaller increase in trade volume produces an overall decline in the value of
world trade relative to the baseline, compared to the increase with scenario 4. This illustrates the
differential effects of productivity gains depending on the spatial distribution of simulated effects.
Tables 6-8 summarize the estimated global impacts on the production, prices, and volume of
trade for the main agricultural commodities in the model. The estimated effects are similar for both
oilseeds (e.g. soybeans) and other grains (e.g. corn) when adoption is restricted to the Western
Hemisphere (scenarios 1 and 2) but increase by a greater amount for oilseeds when adoption spreads to
Asia and the entire world (scenarios 3 and 4). The estimated increase in the production of oilseeds
ranges from 0.13% with adoption only in U.S. and Canada to 2.5% under global adoption (Table 6).
DRAFT: FOR REVIEW ONLY. DO NOT CITE OR QUOTE.
10

Estimated production of other grains rises by 0.11% with adoption only in U.S. and Canada to 0.88%
under global adoption. Price impacts, however, are consistently greater for other grains versus
soybeans, with declines reaching 4.69% versus 3.86% under the global adoption case (Table 7).
Under global adoption, the greatest predicted growth of production of other grains occurs in South
Asia (India, Pakistan). These regions also experience the largest increases in oilseed production,
along with EU, Africa, and Mexico.
Impacts on the production (Table 6) and prices (Table 7) of other major agricultural
commodities are also generally positive with production of paddy rice declining somewhat (0.73
percent) in the global adoption scenario due to shifts in land (chiefly in Other East Asia) and changes
in consumption. Production of other major agricultural products is estimated to increase, with gains
ranging from 0.27% for wheat, 0.90% for other crops, and 1.25% for livestock under the global case.
Possible explanations for these effects are changes in comparative advantage, increases in demand due
to falling consumer prices, and availability of cheaper feed in the case of livestock.
Increasing worldwide adoption of GE corn and soybeans leads to greater volume of trade in
agricultural products across most commodities and scenarios (Table 8). As adoption grows beyond the
Western Hemisphere, however, the growth in trade volumes is smaller, and the volume of trade in
oilseeds actually declines by 1.5% in the global adoption case. This compares with an increase in
oilseed trade volume of more than 2 percent when only the Western Hemisphere adopts (scenario 2).
This could be expected as comparative advantage in production appears to erode with broader
technological adoption, reducing the benefits of trade. Similarly, the volume of trade in other grains
rises by 3.9% when only the Western Hemisphere adopts and rises by just 1.5% in the global adoption
scenario. Other commodities experience steadier increases in trade volumes as adoption becomes
widespread, as countries increase imports to compensate for land and other resources diverted to the
production of corn and soybeans.
DRAFT: FOR REVIEW ONLY. DO NOT CITE OR QUOTE.
11

For other grains and oilseeds, production and price effects are larger under scenario 5 than
scenario 4, while results for other commodities are mixed. This can be explained by the broader set of
commodities, including soybeans, to which productivity impacts accrue as well as to the restriction of
productivity gains to a single AEZ with a comparative advantage for these crops in certain
countries/regions. Impacts on trade volumes are more negative for oilseeds and more positive for
other grains in scenario 5 versus 4, perhaps indicating broader production of soybeans and more
specialized production of corn. Results for trade volumes of other commodities show no consistent
pattern. This experiment illustrates the sensitivity of results to the spatial location and characterization
of the simulated technological benefits.
To further explore these issues, some additional simulations were conducted. If the land
productivity increase is restricted to only other grains, as opposed to all crops, an increase of just 2
percent in the productivity of the same temperate zone AEZ produces equivalent overall production
increases in other grains as in the global adoption scenario. This indicates that more geographically
limited changes in productivity could produce greater production impacts compared to broader
adoption of improved technology.
Conclusion
This paper describes a unique global general equilibrium framework for integrated economic
and environmental modeling of the impacts of global biotechnology adoption. We simulate a variety
of scenarios that explore effects from progressively broader sets of nations and regions adopting two
key agricultural biotechnologies, Bt corn and HT soybeans, and associated yield and cost effects (if
any). These scenarios focus on changes in the production technology and assume no change in
associated demand relationships. Preliminary results indicate moderate increases in production of
DRAFT: FOR REVIEW ONLY. DO NOT CITE OR QUOTE.
12
these and other commodities, and corresponding declines in prices. Trade volumes and values also
increase generally but peak with less than global adoption levels.
This initial application of the model focused on the economic consequences. Consideration of
the impacts on land and water resources was limited to a scenario exploring an alternative
characterization of biotechnology impacts restricted to one particular agro-ecological zone (AEZ).
Next steps in the analysis will involve additional disaggregation of results by country and AEZ,
including an examination of land and water use tradeoffs. Further research will also involve
sensitivity analysis of different adoption scenarios and inclusion of data on BT cotton and other GE
crops.
DRAFT: FOR REVIEW ONLY. DO NOT CITE OR QUOTE.
13

References
Brookes, G., and Barfoot, P. 2005. “GM crops: The global Economic and Environmental Impact - The First Nine Years 1996-2004.” AgBioForum, 8(2&3): 187-196. http://www.agbioforum.org
Carpenter, J. and Gianessi, L. 2001. Agricultural biotechnology: Updated benefit estimates. Washington, DC: National Center for Food and Agriculture Policy. http://www.ncfap.org/reports/biotech/updatedbenefits.pdf
Darwin, R., M. Tsigas, J. Lewandrowski, and A Raneses. 1995. World Agriculture and Climate Change: Economic Adaptations. Agricultural Economic Report No.703. U.S. Department of Agriculture, Economic Research Service, Washington, DC. Darwin, R., M. Tsigas, J. Lewandrowski, and A Raneses. 1996. “Land Use and Cover in Ecological Economics.” Ecological Economics 17(3): 157-181. Darwin, R. and D. Kennedy. 2000. “Economic Effects of CO2 Fertilization of Crops: Transforming Changes in Yields into Changes in Supply.” Environmental Modeling and Assessment, 5(3): 157-168. Diao, X., T. Roe, and A. Somwaru. 2002. “Developing Country Interests in Agricultural Reforms Under the World Trade Organization,” American Journal of Agricultural Economics, 84(3): 782-790. Diao, X., A. Somwaru, and T. Roe 2001. “A Global Analysis of Agricultural Reform in WTO Member Countries,” in Agricultural Policy Reform in the WTO: The Road Ahead, Agricultural Economic Report No. 802. U.S. Department of Agriculture, Economic Research Service, Washington, DC. Dimaranan, Betina V., Editor. 2006. Global Trade, Assistance, and Production: The GTAP 6 Data Base, Center for Global Trade Analysis, Purdue University. https://www.gtap.agecon.purdue.edu/databases/v6/v6_doco.asp Fernandez-Cornejo, J. and M. Caswell. 2006. The First Decade of Genetically Engineered Crops in the United States, Economic Information Bulletin EIB-11, U.S. Department of Agriculture, Economic Research Service, Washington, DC. www.ers.usda.gov/publications/eib11/ Fernandez-Cornejo, J., and W.D. McBride. 2000. Genetically Engineered Crops for Pest Management in U.S. Agriculture. Agricultural Economic Report No. 786. U.S. Department of Agriculture, Economic Research Service, Washington, DC. Fernandez-Cornejo, J. and W.D. McBride. 2002. The Adoption of Bioengineered Crops. Agricultural Economic Report No. 810. U.S. Department of Agriculture, Economic Research Service Fernandez-Cornejo, J. 2006. “Adoption of Genetically Engineered Crops in the U.S., Data Product, U.S. Department of Agriculture, Economic Research Service, Washington, DC. http://www.ers.usda.gov/data/biotechcrops/ Posted July 13, 2006
James, C. 2005. Global Status of Commercialized Biotech/GM Crops: 2005. ISAAA Briefs No. 34. ISAAA, Ithaca, NY.
DRAFT: FOR REVIEW ONLY. DO NOT CITE OR QUOTE.
14

James, C. 2002. Global Status of Transgenic Crops (various global review briefs from 1996 to 2002). Ithaca, NY: International Service for the Acquisition of Agri-Biotech Applications. 2002.
James, C. 2003. Global Review of Commercialized Transgenic Crops 2002: Feature Bt Maize. Ithaca, NY: International Service for the Acquisition of Agri-Biotech Applications.
James, C. 2005. Executive Summary of Global Status of Commercialized Biotech/GM Crops: 2005. ISAAA Briefs No. 34. ISAAA: Ithaca, NY.) http://www.isaaa.org/kc/bin/briefs34/pk/index.htm
Qaim, M., and De Angry, A. 2002. “Bt cotton in Argentina: Analyzing Adoption and Farmers' Willingness to Pay.” Paper presented at the American Agricultural Economics Association, Long Beach, CA. July 2002.
Qaim, M. and De Janvry, A. 2005. “Bt Cotton and Pesticide Use in Argentina: Economic and Environmental Effects.” Environment and Development Economics, 10(2): 179-200. http://are.berkeley.edu/~sadoulet/papers/Argentina_EDE.pdf.
Qaim, M. and Traxler, G. 2002. “Roundup Ready Soybeans in Argentina: Farm Level, Environmental, and Welfare Effects.” Paper presented at the 6th International ICABR Conference, Ravello, Italy. July 2002.
Roe, T., A. Somwaru and X. Diao. 2006. “Globalization: Welfare Distribution and Costs among Developed and Developing Countries,” Review of Agricultural Economics, 28(3): 399-408.
Sankula, S. and Blumenthal, E. 2004. Impacts on US Agriculture of Biotechnology-Derived Crops Planted in 2003: An Update of Eleven Case Studies. Washington, DC: National Center for Food and Agriculture Policy. http://www.ncfap.org/whatwedo/pdf/2004finalreport.pdf .
DRAFT: FOR REVIEW ONLY. DO NOT CITE OR QUOTE.
15

Table 1. Model Regions and Sectors
Countries/Regions (19): Commodities/Activities (17): SSA Africa pfb Cotton ARG Argentina osd Oilseeds BRA Brazil ocr Other Crops CAN Canada gro Other Grains CHN China pdr Rice E_U EU25 c_b Sugar, Cane and Beets IND India wht Wheat IDN Indonesia lvk Livestock MEX Mexico fmm Fish, Meat, Dairy ROW Middle East opf Other Processed Food OCE Oceania frs Forest OEA Other East Asia nmm Manufacturing, Non-Metallic OSA Other South Asia omn Manufacturing, Other OWH Other Western Hemisphere cog Oil and Gas PAK Pakistan min Other Minerals PRY Paraguay srv Services XOA Rest of Asia tcf Textile and Apparel RUS Russia USA United States
DRAFT: FOR REVIEW ONLY. DO NOT CITE OR QUOTE.
16
DRAFT: FOR REVIEW ONLY. DO NOT CITE OR QUOTE.
17
Table 2. Total Planted Acreage of All Corn and Soybeans, by Select Countries, 2003-2004
Country Corn Soybeans Million Hectares Argentina 2.1 14.0
Brazil 12.4 21.5
Canada 1.2 1.0
China 24.1 9.3
EU 6
India 7 6.5
Indonesia 3.2
Mexico 7.7
Other Africa 22.9
Paraguay 1.8
Philippines 2.5
Romania 2.6
South Africa 3.3 0.1
Ukraine 2
United States 28.8 29.3
Rest of World 14.6 4.8
World Total 140.4 88.3 Sources: U.S. Department of Agriculture, NASS Agricultural Statistics (2005) and FAO.

Table 3. Estimated Global Adoption Potential, Benefits, and Costs for GE Crops: Corn and Soybeans
Bt Corn HT Soybeans
Estimated Potential Adoption
Yield Gain
Cost Savings, Excluding
Technology Costs
Technology Costs
Estimated Potential Adoption
Yield Gain
Cost Savings,
Excluding Technology
Costs
Technology Costs
Country
% % $/Ha $/Ha % % $/Ha $/Ha Argentina 40 10 0 22 90 0 27 4 Brazil 60 10 15.5 22 90 0 88 15 Canada 40 5 15.5 22 90 0 52 35 China 40 5 15.5 22 90 0 27 4 EU 40 5 15.5 23 India 60 10 14.3 22 90 0 36 4 Indonesia 40 10 14.3 22 Mexico 60 10 14.3 22 Other Africa 60 10 14.3 22 Paraguay 90 0 27 4 Philippines 40 25 14.3 22 Romania 40 5 15.5 22 South Africa 60 5 14.3 22 90 0 36 26.3 Ukraine 20 5 15.5 22 United States 40 5 15.5 22 90 0 67 17.3 Sources: Estimates derived for this study based on Brookes and Barfoot (2005), Sankula and Blumenthal (2004), and James (2003).
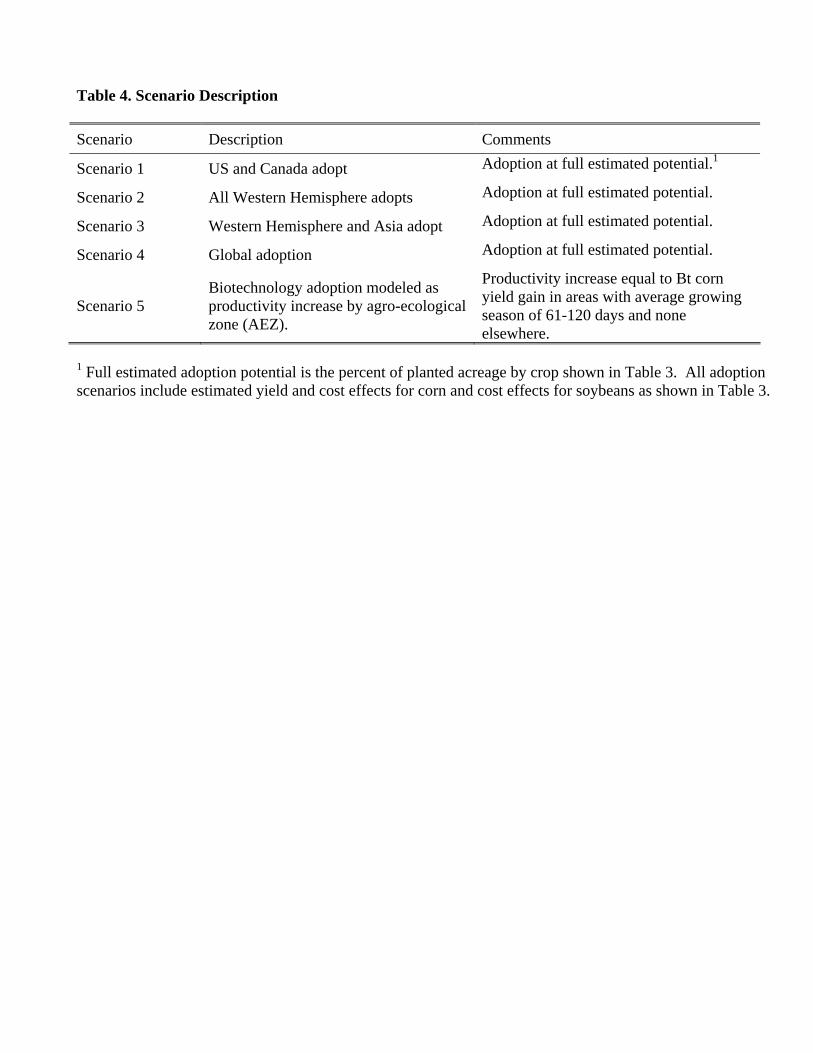
Table 4. Scenario Description
Scenario Description Comments
Scenario 1 US and Canada adopt Adoption at full estimated potential.1
Scenario 2 All Western Hemisphere adopts Adoption at full estimated potential.
Scenario 3 Western Hemisphere and Asia adopt Adoption at full estimated potential.
Scenario 4 Global adoption Adoption at full estimated potential.
Scenario 5 Biotechnology adoption modeled as productivity increase by agro-ecological zone (AEZ).
Productivity increase equal to Bt corn yield gain in areas with average growing season of 61-120 days and none elsewhere.
1 Full estimated adoption potential is the percent of planted acreage by crop shown in Table 3. All adoption scenarios include estimated yield and cost effects for corn and cost effects for soybeans as shown in Table 3.

Table 5. Aggregate Impacts of Biotechnology Adoption Scenarios
Scenario 1 Scenario 2 Scenario 3 Scenario 4 Scenario 5 Productivity
increase where growing
season is 61-120 days
Western Hem. &
Asia
Variable U.S. and Canada
Western. Hemisphere
Global adoption
Percentage difference from the baseline
World Agricultural Prices -0.991 -1.526 -1.110 -1.972 -5.044
World Agricultural Production 0.230 0.380 0.440 0.619 2.218
World trade (value) 0.090 0.160 -0.170 1.170 -3.709
World trade (volume) 1.107 1.695 1.196 3.310 1.705
1 Scenarios 1-4 are for the adoption Bt corn and HT soybeans with yield and cost effects and cost effects only, respectively. Scenario 5 is an alternate scenario in which productivity for only one AEZ is increased (see Table 4).
DRAFT: FOR REVIEW ONLY. DO NOT CITE OR QUOTE.
20

Table 6. Estimated Changes in Global Agricultural Production of Main Commodities Due to Biotechnology Adoption Scenarios 1
Scenario 1 Scenario 2 Scenario 3 Scenario 4 Scenario 5 Productivity
increase where growing season is
61-120 days
Commodity U.S. and Canada
Western. Hemisphere
Western Hem. & Asia
Global adoption
Percentage difference from the baseline Oilseeds 0.130 0.190 0.890 2.520 4.170 Other crops 0.290 0.479 0.609 0.899 0.030 Other grains 0.110 0.380 0.490 0.880 2.010 Paddy rice -0.090 -0.210 0.270 -0.730 2.879 Wheat -0.060 0.030 0.260 0.270 1.589 Livestock 0.349 0.598 0.668 1.266 0.027
1 Scenarios 1-4 are for the adoption Bt corn and HT soybeans with yield and cost effects and cost effects only, respectively. Scenario 5 is an alternate scenario in which productivity for only one AEZ is increased (see Table 4).
DRAFT: FOR REVIEW ONLY. DO NOT CITE OR QUOTE.
21

Table 7. Estimated Changes in Global Agricultural Prices of Main Commodities Due to Biotechnology Adoption Scenarios 1
Scenario 1 Scenario 2 Scenario 3 Scenario 4 Scenario 5 Productivity
increase where growing season is
61-120 days
Commodity U.S. and Canada
Western. Hemisphere
Western Hem. & Asia
Global adoption
Percentage difference from the baseline Oilseeds -1.536 -2.741 -2.068 -3.865 -7.068 Wheat -1.305 -2.782 2.507 0.645 -3.262 Other grains -2.488 -3.741 -3.099 -4.694 -6.911 Paddy rice 1.057 0.205 -1.540 -4.424 -11.906 Other crops -2.136 -3.009 -2.808 -3.671 -0.093 Livestock -1.095 -1.788 -1.416 -1.848 -0.068
1 Scenarios 1-4 are for the adoption Bt corn and HT soybeans with yield and cost effects and cost effects only, respectively. Scenario 5 is an alternate scenario in which productivity for only one AEZ is increased (see Table 4).
DRAFT: FOR REVIEW ONLY. DO NOT CITE OR QUOTE.
22

Table 8. Estimated Changes in Volume of Agricultural Trade in Main Commodities Due to Biotechnology Adoption Scenarios 1
Scenario 1 Scenario 2 Scenario 3 Scenario 4 Scenario 5 Productivity
increase where growing season is
61-120 days
Commodity U.S. and Canada
Western. Hemisphere
Western Hem. & Asia
Global adoption
Percentage difference from the baseline Oilseeds 1.361 2.061 1.471 -1.541 -1.851 Wheat 2.215 3.542 2.475 6.306 5.358 Other grains 3.260 3.910 3.390 1.520 4.310 Paddy rice -2.021 -1.127 0.428 4.135 4.023 Other crops 1.854 2.661 2.063 5.092 -0.022 Livestock 1.050 2.230 0.822 2.893 0.012
1 Scenarios 1-4 are for the adoption Bt corn and HT soybeans with yield and cost effects and cost effects only, respectively. Scenario 5 is an alternate scenario in which productivity for only one AEZ is increased (see Table 4).
DRAFT: FOR REVIEW ONLY. DO NOT CITE OR QUOTE.
23

Figure 1. Global Area Planted in GE Crops, 2005 (Million acres)
123
42.2
23.214.3
8.2 4.4 3.2 40
20
40
60
80
100
120
140
USA Argentina Brazil Canada China Paraguay India Others
Source: ISAAA (2005).
DRAFT: FOR REVIEW ONLY. DO NOT CITE OR QUOTE.
24

Figure 2.
FARM II’s Environmental Component
Climate
Growing Season Water Runoff
LandCharacteristics Water Supply
FARM’s Economic Component
Land Cover
DRAFT: FOR REVIEW ONLY. DO NOT CITE OR QUOTE.
25

Figure 3.
FARM II’s Economic ComponentFARM’s Environmental Component
Land Water
Labor CapitalProduction Possibilities
PopulationProduction
ConsumerPreferences
Foreign Region1
Foreign Region n
Income
Other RegionsSupply &Demand
Supply &Demand
TradePayments
Payments
Technology
DRAFT: FOR REVIEW ONLY. DO NOT CITE OR QUOTE.
26

Figure 4.
Rainfed Agro-Ecological Zones in 1997Derived from: University of East Anglia. Climate Research Unit. CRU05 0.5 Degree 1901-1995 Monthly Climate Time-Series. East Anglia, Great Britain.
DRAFT: FOR REVIEW ONLY. DO NOT CITE OR QUOTE.
27