parameterising bayesian networks: a case study in ecological risk assessment carmel a. pollino water...
Post on 19-Dec-2015
215 views
TRANSCRIPT

Parameterising Bayesian Networks:
A Case Study in Ecological Risk Assessment
Carmel A. PollinoWater Studies Centre
Monash University
Owen Woodberry, Ann Nicholson, Kevin Korb
Computer Science and Software EngineeringMonash University

Ecological Risk Assessment Process for improving environmental
management to protect ECOLOGICAL values/assets
Focus: Managing physical, chemical and biological processes to protect ecological endpoints
Ecological sustainability/integrity poorly dealt with in many integrative analyses (not just environmental sustainability – human focus)

Ecological Risk Assessment
Problem Formulation What are the environmental values of the
system? What is it you want to protect? Conceptual Model
Risk Analysis (Risk = Likelihood x Consequence)
Risk Characterisation Risk Management

Ecological Risk Assessment Stakeholder engagement (adoption)
technical non-technical
Modular (multiple stressors - multiple models in single framework)
Promotion of Iterative and Adaptive approaches to environmental management Inform future monitoring and targeted research
needs

Models required for multiple stressor / hazard problems (complex issues)
Models need to: incorporate information with high
uncertainties incorporate disparate information be able to prioritise risks to
endpoint be applicable in risk management
Modelling Complex Issues (ERA)

Address Uncertainty and Complexity Increasingly being used in ecological applications
Modular DSS Complex system composed of simpler parts (or multiple
models) Inputs: expert opinion, literature, data, other
models Predictions able to be tested (test robustness of
predictions) and models easily updated Models simple (pragmatic), transparent and easily
interpreted (adoption into risk management)
Bayesian Networks
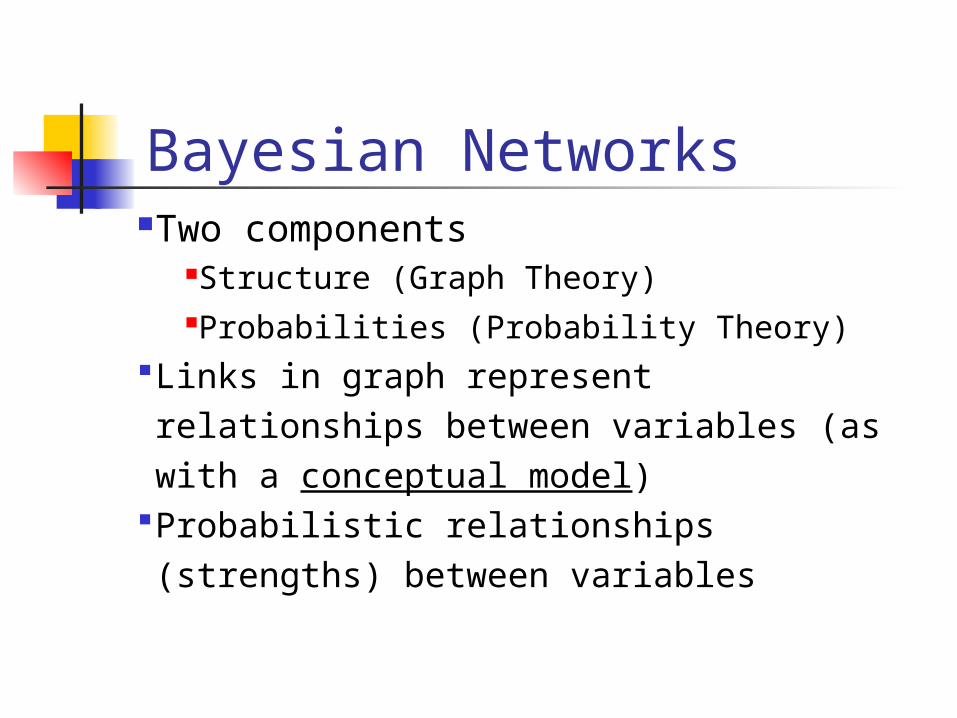
Two componentsStructure (Graph Theory)Probabilities (Probability Theory)
Links in graph represent relationships between variables (as with a conceptual model)
Probabilistic relationships (strengths) between variables
Bayesian Networks

ERA Case Study
Goulburn Catchment, Victoria, Australia

Important irrigation Area Important habitat for endangered
and threatened native fish species Problem Formulation:
Reduced abundance and diversity of native fish in the Goulburn Catchment, Victoria, Australia
Adoption: Goulburn Murray Water
Goulburn Broken Catchment
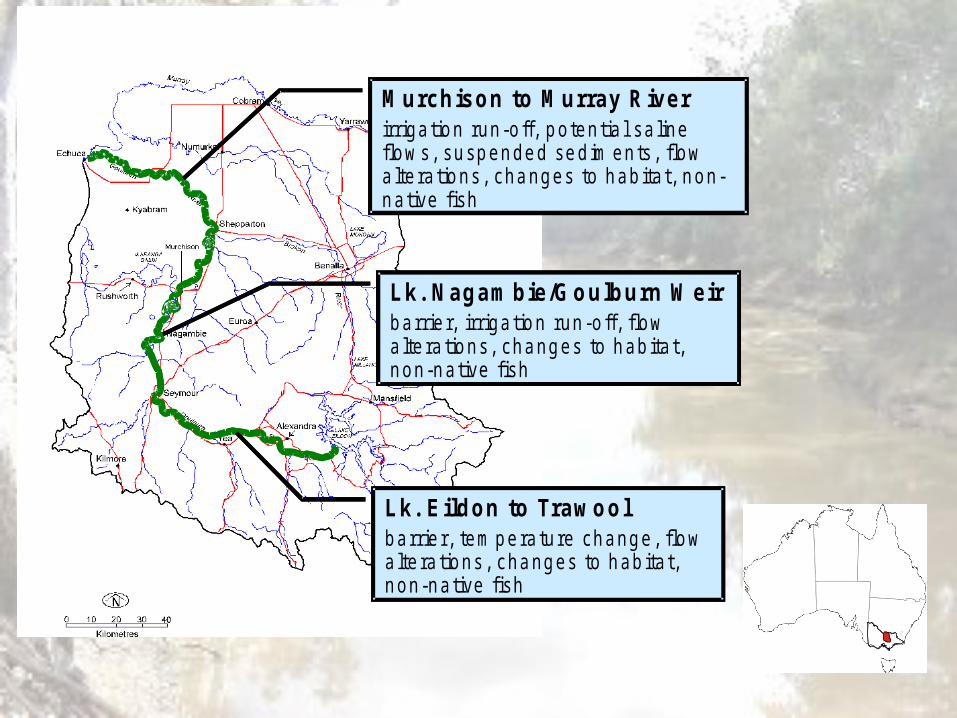
Lk. Eildon to Trawoolbarrie r, tem pera ture change, flowa lte ra tions, changes to hab itat, non-native fish
Lk. Nagam bie/Goulburn Weirbarrie r, irriga tion run -o ff, flowa lte ra tions, changes to hab itat, non-native fish
Murchison to Murray Riverirriga tion run-o ff, poten tia l saline flow s, suspended sed im ents, flowa lte ra tions, changes to hab itat, non-native fish

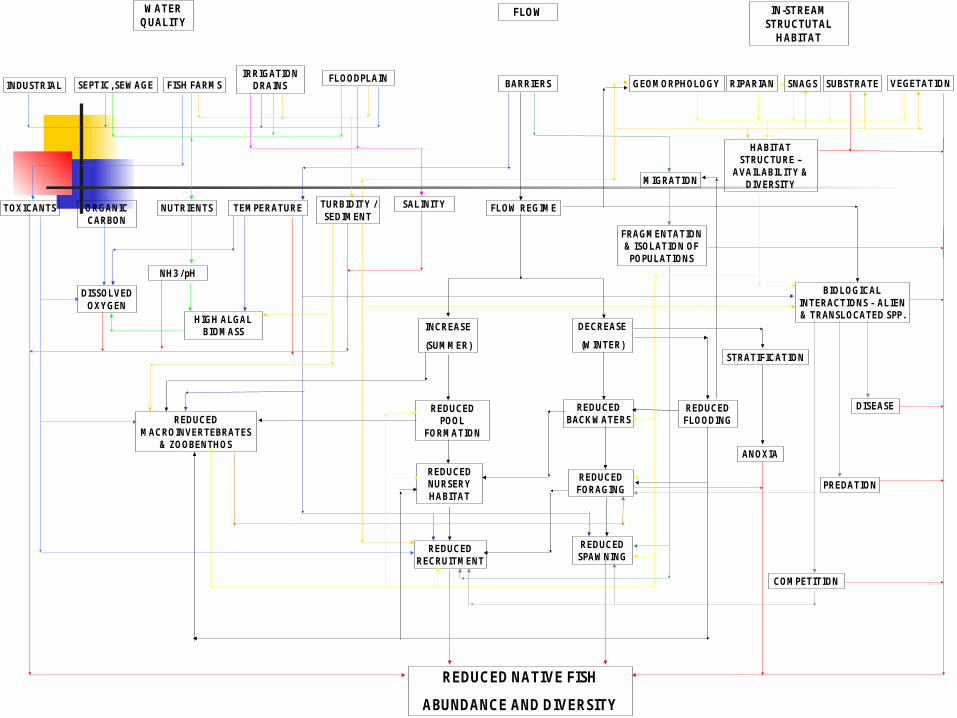
Model Structure
Expert (Workshop 1) and Automated
IN-STREAM STRUCTUTAL
HABITAT
WATER QUALITY
FLOW
REDUCED NATIVE FISH
ABUNDANCE AND DIVERSITY
BARRIERSFLOODPLAIN GEOMORPHOLOGY SUBSTRATERIPARIAN VEGETATIONINDUSTRIAL FISH FARMSSEPTIC, SEWAGEIRRIGATION
DRAINS
TOXICANTS TEMPERATUREORGANIC CARBON
NUTRIENTS
NH3 / pH
DISSOLVED OXYGEN
TURBIDITY / SEDIMENT
FLOW REGIME
INCREASE
(SUMMER)
DECREASE
(WINTER)
REDUCED POOL
FORMATION
REDUCED NURSERY HABITAT
REDUCED RECRUITMENT
REDUCED FLOODING
REDUCED FORAGING
REDUCED SPAWNING
STRATIFICATION
ANOXIA
SALINITY
MIGRATION
FRAGMENTATION & ISOLATION OF
POPULATIONS
REDUCED BACKWATERSREDUCED
MACROINVERTEBRATES & ZOOBENTHOS
HABITAT STRUCTURE –
AVAILABILITY & DIVERSITY
BIOLOGICAL INTERACTIONS - ALIEN & TRANSLOCATED SPP.
PREDATION
DISEASE
COMPETITION
SNAGS
HIGH ALGAL BIOMASS

Fish Network-5 sub-networksWater QualityFlowStructural HabitatBiological Interactions
-2 query nodesFish AbundanceFish Diversity
-23 sites 6 reaches
-2 temporal scales 1 and 5 year changes

Model Parameterisation
Expert (Workshop 2) and Automated

Parameterisation
Expert Elicitation used to parameterise aspects of model not represented by data (lack of variability in data set)
Iterative process of updating expert derived probabilities (prior probabilities) using data (automated process)
Needed this process to be supervised
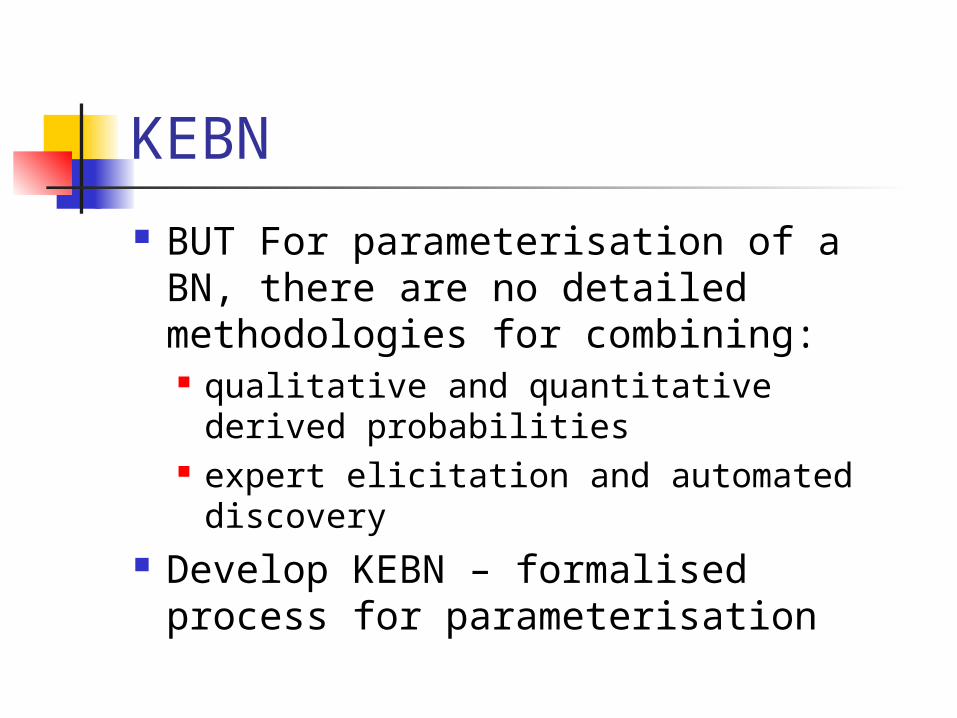
KEBN
BUT For parameterisation of a BN, there are no detailed methodologies for combining: qualitative and quantitative derived
probabilities expert elicitation and automated
discovery Develop KEBN – formalised process
for parameterisation

Parameter Estimation KEBN has 3 “paths”:
(1) Elicited from experts (2) Learned from data
Routine Monitoring Data Targeted Research
(3) Generated from a combination of sources
Evaluation process essential to assess parameterisation process
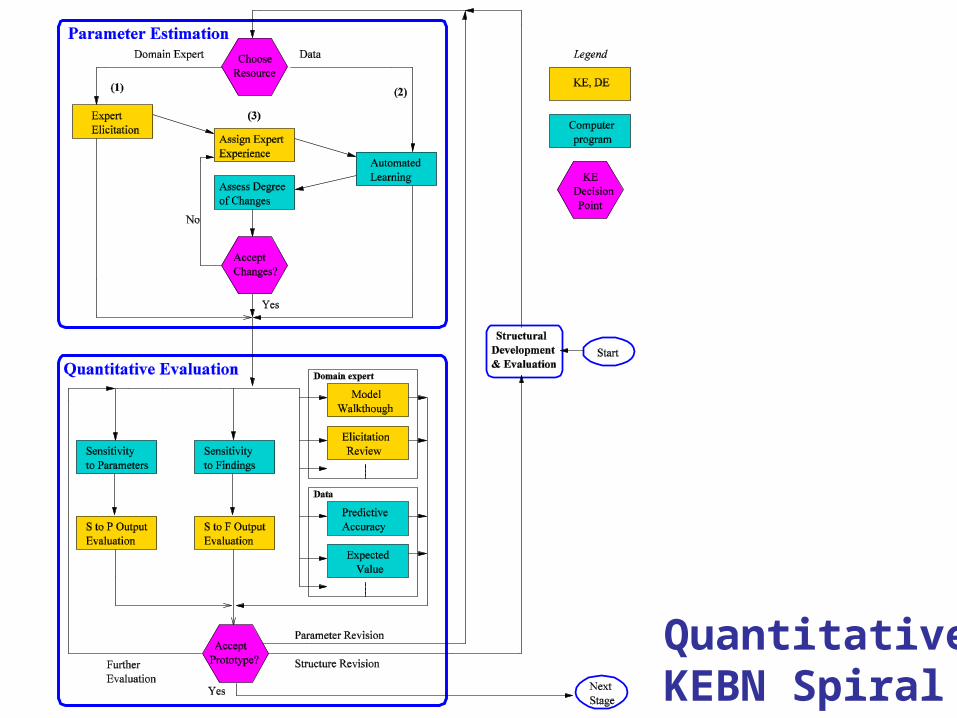
Quantitative KEBN Spiral

Fish Network

Parameter Estimation
Data variables: initially given uniform distribution
Sparse or no data variables: elicited. Experts were asked to report confidence
in estimates (equivalent sample size – ESS), to be used by data learning/training method: EM (Expectation Maximisation) algorithm.

Parameter Estimation
Parameterisation after learning compared to original in “Assess Degree of Change” process.
Identify where large changes occur Changes focus on where there are
discrepancies in expert elicited probabilities and data derived probabilities.
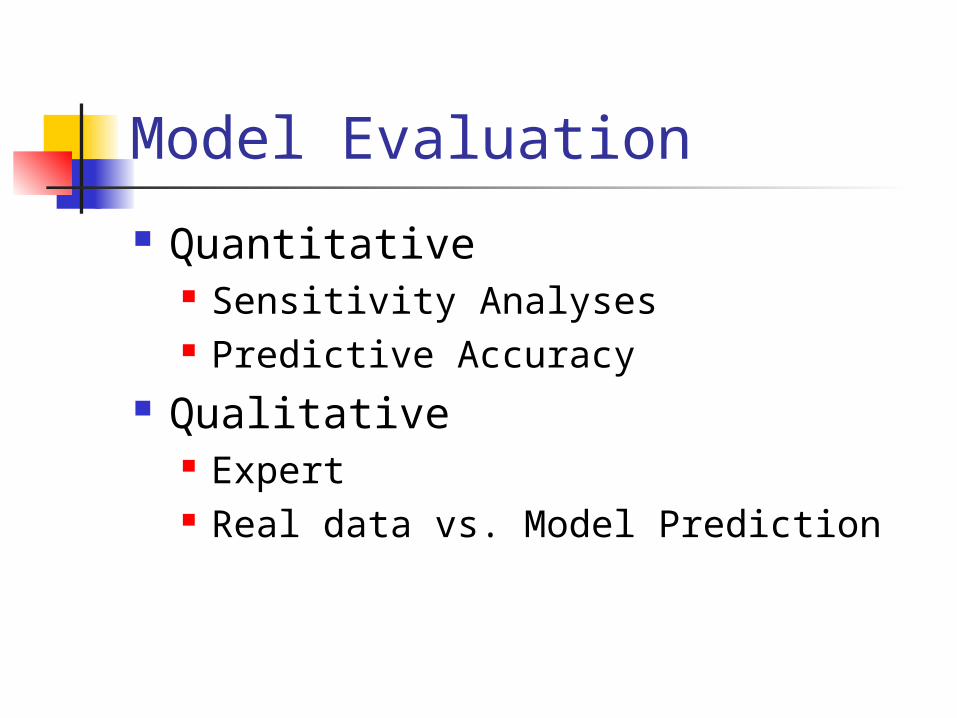
Model Evaluation
Quantitative Sensitivity Analyses Predictive Accuracy
Qualitative Expert Real data vs. Model Prediction
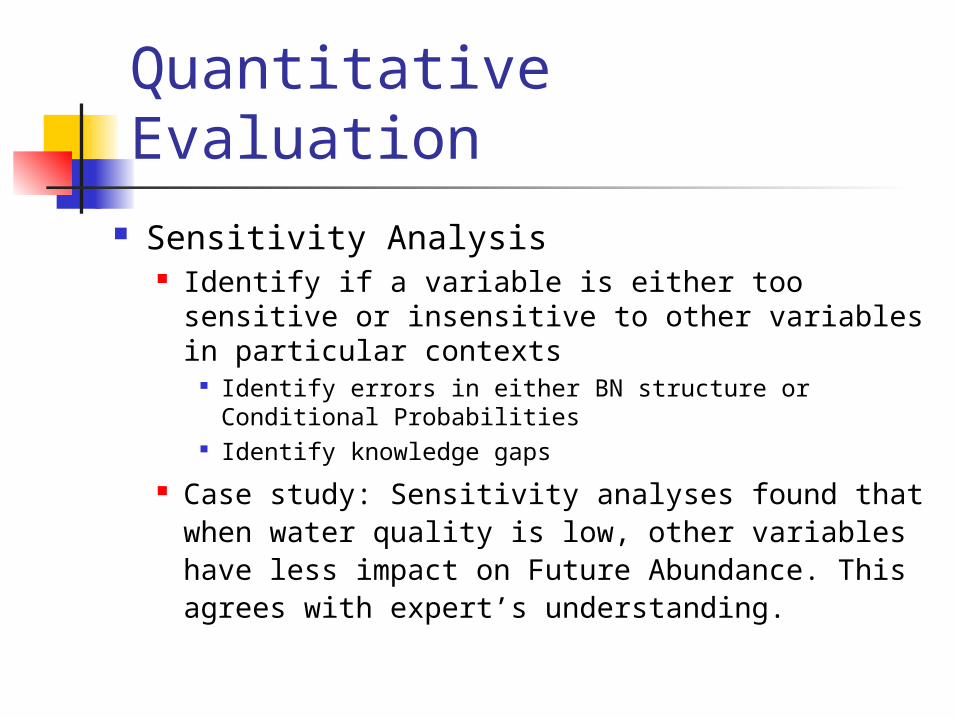
Quantitative Evaluation Sensitivity Analysis
Identify if a variable is either too sensitive or insensitive to other variables in particular contexts
Identify errors in either BN structure or Conditional Probabilities
Identify knowledge gaps
Case study: Sensitivity analyses found that when water quality is low, other variables have less impact on Future Abundance. This agrees with expert’s understanding.

Quantitative EvaluationSensitivity to Findings
P (Future Abundance) = High
0.0 0.2 0.4 0.6 0.8 1.0
Var
iabl
e (R
ange
0 to
1)
Future Diversity
Water Quality Habitat
Biological Potential
Hydraulic Habitat
Barrier
Temperature Modification

Quantitative Evaluation
Predictive Accuracy Data split (80% training, 20% testing) Error Rate (Future Abundance) = 5.8%
Limited data Lack of variability in abundance of fish
communities throughout catchment (mostly low – poor condition)

0
20
40
60
80
100
120
GEi
GA
GY G
TG
NG
Mu
GS
GM
cG
UG
Ec
Rel
ativ
e ab
un
dan
ce
0
0.2
0.4
0.6
0.8
1
P(N
ativ
e F
ish
) =
Hig
h
Figure 5: Relative Abundance Data (left axis - bars) versus BN Model Predictions (right axis - line) for Sites in the Goulburn Main Channel.
Qualitative Evaluation

Test aspects of network not represented in data set Conditions required for ‘healthy’ native
fish communities
Robustness of network Fish Ecologists Environmental Managers / Natural
Resource Managers
Expert Evaluation

Risk Management framework
Prioritise risks
Identify knowledge gaps
Allocate resources for:
Further monitoring and research
Risk mitigation
GBC Bayesian Networks
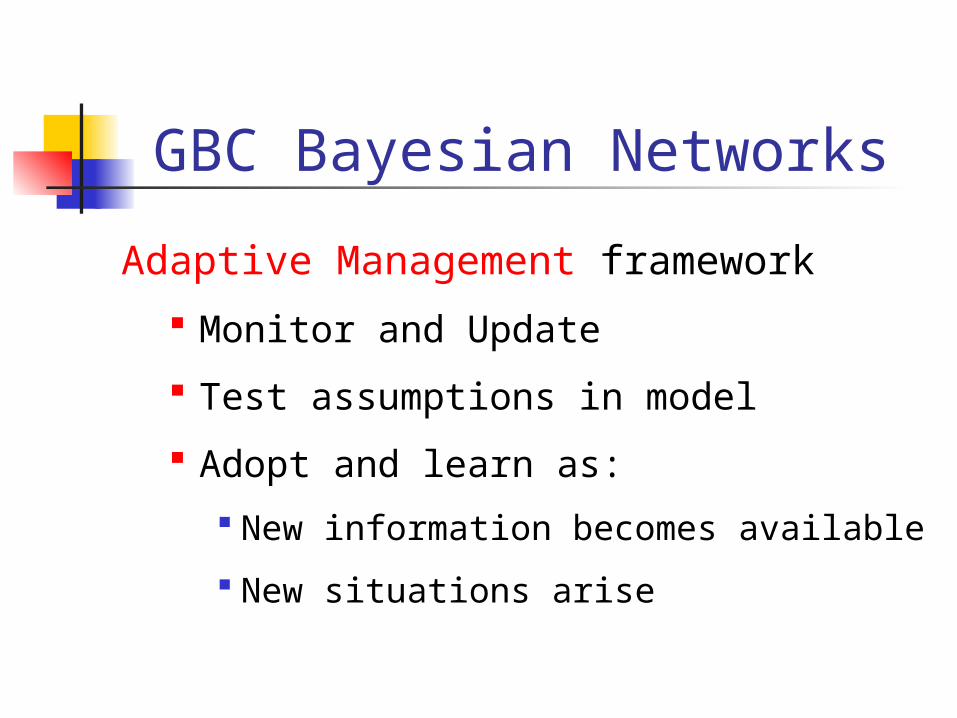
Adaptive Management framework
Monitor and Update
Test assumptions in model
Adopt and learn as:
New information becomes available
New situations arise
GBC Bayesian Networks

Model specific for different
communities of fish in Murray-
Darling Basin Currently biased towards Low Flow Specialists
Model represent dynamic changes
(temporal changes)
Future Improvements
Acknowledgements
National Program for Sustainable Irrigation
Goulburn Murray Water Stakeholders