parameters identification of granular soils around … identification of granular soils around pmt...
TRANSCRIPT
Parameters Identification of Granular Soils around PMT test by Inverse Analysis
*Y. Abed1), Djillali Amar-Bouzid2), R. Bahar3) and I. Toumi4)
1), 2), 4) Département de génie civil, Université de Blida1, BP 270, Route de Soumaa, Blida, Algérie
3) Département de génie civil, Université Houari Boumedien, Bab Ezzouar, Algérie.
ABSTRACT
We present in the proposed work a numerical analysis of the soil behaviour around pressuremeter based on the generalised Prager’s model with the Drucker & Prager Criterion. The procedure, applied here to identify the parameters of generalized Prager model associated to the Drucker&Prager failure criterion from a pressuremeter expansion curve, is based on an inverse analysis approach, which consists of minimizing the function representing the difference between the experimental curve and the curve obtained by integrating the model along the loading path in the in-situ testing. The numerical process implemented here is based on a finite element procedure. Some parameters effects, such as, disturbance surrounding pressuremeter probe and consolidation pressure are presented and finally, we visualize the stresses path in all points of discretisation.
1. INTRODUCTION
The successful application of in-situ testing of soils heavily depends on development of interpretation methods of tests. The pressuremeter test simulates the expansion of a cylindrical cavity and because it has well defined boundary conditions, it is more unable to rigorous theoretical analysis (i. e. cavity expansion theory) then most other in-situ tests.
Soil parameters can be identified from pressuremeter tests by using an inverse analysis of the cavity pressure–cavity strain relationship measured in the field. To perform this,
1)
Ph. D 2), 3)
Pr. 4)
Undergraduate Student
the pressuremeter test is generally simulated as the expansion of an infinitely long cylindrical cavity inside an infinite uniform medium by means of closed-form analytical solutions (Moussavi et al. 2011; Rashed et al. 2012) or approximate numerical models, such as the finite elements (Zanier, 1985; Carter et al.,1986; Cambou et al., 1990; Yu and Houlsby, 1991and 1995; Fahey and Carter, 1993; Olivari and Bahar, 1995; Cudmani and Osinov, 2001; Hsieh et al., 2002; Levasseur, 2008; Shahin et al., 2008; Javadi and Rezania 2009; Zhang et al. 2009; Levasseur et al. 2010; Liang and Sharo, 2010; Zhang et al. 2013; Abed et al., 2014 and Al-Zubaidi, 2015).
The work proposed is based on an approach proposed by (Olivari and Bahar 1993) for modeling the short term behavior of saturated clay by using the generalized Prager model associated with the failure criterion of Von Mises. To expand the use of the approach to granular soils, we have associated the model with the criterion failure of Drucker and Prager, while involving the phenomenon of dilatancy. The model is then introduced in a computer code baptized " Press-Sim" (pressuremeter simulation) to identify the model parameters from pressuremeter results. Some parameters effect on the simulated pressuremeter curve; the consolidation pressure effect, the probe slenderness effect and finally the stress path and the disturbance effects surrounding the pressuremeter probe are presented.
2. PROPOSED METHOD
The problem of the cylindrical cavity expansion was treated, through a generalized Prager model, in view of interpreting pressuremeter tests performed in sand. The generalized Prager model version used in the present study is a non linear elastic, plastic model. The elastic part includes two parameters: the Young's modulus, E, and
the Poisson's ratio, . The plastic part includes the Friction angle, , the dilatancy
parameter, , and the parameter which governs the curvature of pressuremeter curve (Abed et al. 2014).
In the numerical theory of plasticity, the Prager model describes the yielding behavior of a material by a yield surface which gives the state of stress under which yielding first occurs, a work hardening rule which specifies how the yield surface is changed during plastic flow, and a flow rule which relates the plastic strain increment to the state of stress and the stress increment (Chen et al. 1985).
A Kinematic hardening model is adopted which assumes that during the plastic deformation the loading surface translates as a rigid body in the stress space keeping the size, shape and orientation of the initial yield surface. The kinematic hardening has the following form for hardening surface:
0, 2 kXFf ijij
p
ijij (1)
Where k is a constant and Xij are the coordinates of the center of loading surface which change as the plastic strain continues. The simplest version for determining parameter Xij is to assume a linear dependence of dXij
p
ijij CddX (2)
Where C is the work hardening constant, characteristic for given material. Equation (2) may be taken as the definition of the linear work hardening.
The plastic strain is given by the normality rule (standard material)
k
ij
kp
ij df
d
(3)
00 ijij
kp
ij ndifd (4)
The consistency condition means that the yield surface keeps the same radius, this
help to determine the plastic proportionality factor d with:
01
klkl
ij
ij
k
kff
df
Cd
(5)
Where k used as a superscript denotes the kth element of chain;
Ck is the modulus of the kth element of the chain;
nijk is the normal external vector to the yield surface.
The total plastic strain is the sum of the plastic strain of each cell. Some of them may not be strained during loading. In this case, it can be said that they are not activated. The number of activated cells is n* with 0 < n*< n. The model is thus defined by the compliance of n elastic elements and their associated n yield surfaces. Eventually, a single linear elastic element can be introduced to represent the initial elastic strain. This,
introduce a further compliance noted J0 and a limit surface of threshold stress S. Thus the model is defined by 2n+2 parameters. In the virgin state, all the residual stresses are equal to zero, hence for each cell, the hardening variables are also equal to zero, Xij (k) = 0. Since each of the n Prager elements will individually obey a linear work -hardening law, their combined action leads to a piecewise linear behaviour with a kinematic hardening for the material as a whole.
2.1 Yield function and plastic flow rule:
The failure criterion associated with the proposed model is that of Drucker and Prager (Drucker and Prager 1952). This criterion is based on the assumption that the octahedral shear stress at failure depends linearly on the octahedral normal stress through material constants. It was established as generalisation of the Mohr-Coulomb criterion for soil:
√ (6)
Where, the constants and are material constants.
is the second invariant of the stress deviator tensor and is the first invariant of the stress tensor, and are defined as follows:

(7)
[(
) (
) (
)] (8)
,
, , are the principal effective stresses.
The parameters and can be calibrated to make the Drucker-Prager criterion fit different parts of the Mohr-Coulomb criterion (Chen and Mizuno 1990). The Mohr-Coulomb criterion and two different Drucker-Prager fits are shown in Fig.1.
Fig. 1. Mohr-Coulomb and Drucker-Prager criteria on the octahedral plane.
The two fits are:
1. Triaxial extension fit: The triaxial extension corners of the Mohr-Coulomb criterion coincide with the Drucker-Prager criterion.
2. Triaxial compression fit: The triaxial compression corners of the Mohr-Coulomb criterion coincide with the Drucker-Prager criterion.
3. FINITE ELEMENT SIMULATION OF PRESSUREMETER TEST
In this work, the computed cavity pressure–cavity strain curves were obtained from the finite element simulation of an infinitely long cylindrical cavity expanding inside a cohesionless soil.
In order to apply the finite element method, the 1D expansion of an infinitely long
cylindrical cavity is simulated. The segment ( ) is divided into segments of unequal lengths (Fig. 2). To ensure a good accuracy of stresses and strains, the mesh

is relatively fine in the vicinity of the borehole. With growing distance to the probe, the elements increase progressively in size. With reference to the middle point of the
Pressuremeter membrane, the dimension of the finite element mesh used is in width. The soil around the probe is modelled using a linear mesh (Abed et al., 2014).
Fig. 2 Finite element mesh around pressuremeter borehole.
3.1 Solution of the problem in elastic zone:
In elasticity, the analytical solution of the differential equation governing the expansion of a cylindrical cavity is given according to the elastic parameters (Clark, 1995):
(9)
(10)
The deformation occurs at a constant stress without volume changes.
Fig.3 Yield zone around the expanding cavity
3.2 Solution of the problem in elasto-plastic zone
The behaviour law can be written by:

(11)
Where, the matrix is function of the stress state and the loading path. It
describes the soil behaviour for a loading increment. It may be written as:
∑
(
) ( ( ))
( ( )) For (12)
∑
(
) ( ( ))
( ( )) For (13)
4. IDENTIFYING MODEL PARAMETERS FROM PRESSUREMETER TEST
The general framework adopted in this paper for the calibration of the proposed model from pressuremeter tests is first described in this section. The two main components of the proposed methodology are the finite element simulation of pressuremeter tests and the optimization algorithm.
The flowchart depicted in Fig. 4 illustrates the algorithm for inverse analysis of pressuremeter test results. The flowchart starts from the consideration of two different pieces of information: on one side, there is a set of experimental pressure–expansion curve measured during pressuremeter test in the field while, on the other side, there is a corresponding set of finite element simulations.
On the basis of the theoretical developments presented in the previous sections and subsections, a computer program called "Press-Sim" has been written in Fortran. As an input data, this program begins by reading geometrical parameters relative to the Finite Element mesh and soil properties in order to establish a computed pressure curve at a given depth. In addition to data required for the simulation, "Press-Sim" necessitates the experimentally established pressuremeter curve at the same depth. Generally speaking, this computer program carries fundamentally two main tasks. The first consists in the establishment of a numerical curve illustrating the variation of volume changes ( ) in function of the applied pressure ( ), while the second is the matching of the computed and the experimental curves according to a specifically chosen optimization procedure. These two tasks lead finally to the determination of soil
parameters namely: and which can be considered as the results of the best fit of the two curves.

Fig. 4. The optimization flowchart.
5. NUMERICAL CODE
The determination of the parameters of the constitutive model from the pressure-meter test consists in solving the following inverse problem: to find a set of parameters which minimize the difference between the experimental data (here the pressuremeter curve defined as the applied pressure versus the cavity wall deformation) and the simulated curve. This problem is classically defined by an objective function which evaluates, for a given set ofparameters, the discrepancy between the model prediction and the experimental data.
To achieve this purpose, a computer program baptised "Press-Sim" is developed in order to identify automatically the parameters of the proposed behaviour law. In order to evaluate the objective function, we use an algorithm that allows the decomposition of the pressuremeter curve in three parts (Fig. 5):
- Part I: The parameters defining the behavior of small strains, which in the simulation of a pressuremeter curve, have a major influence at the beginning of the curve. These are essentially the parameters characterizing the deformability of the material (Young's modulus E);
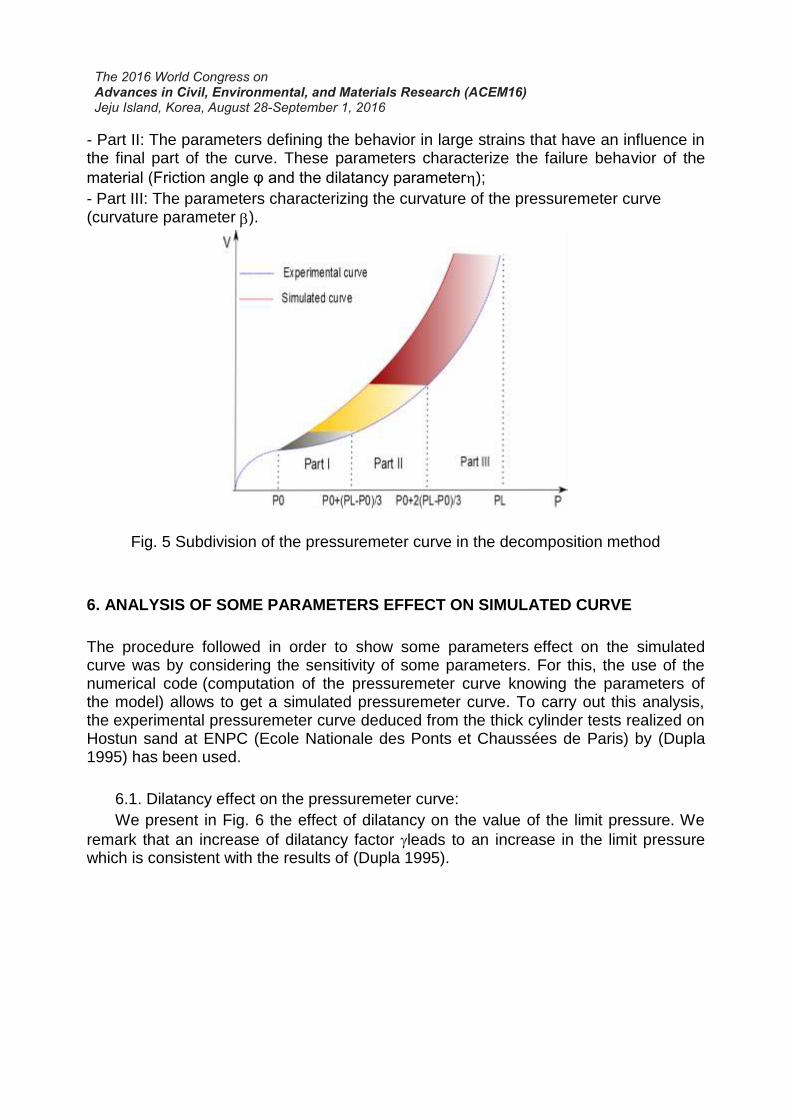
- Part II: The parameters defining the behavior in large strains that have an influence in the final part of the curve. These parameters characterize the failure behavior of the
material (Friction angle φ and the dilatancy parameter);
- Part III: The parameters characterizing the curvature of the pressuremeter curve (curvature parameter ).
Fig. 5 Subdivision of the pressuremeter curve in the decomposition method
6. ANALYSIS OF SOME PARAMETERS EFFECT ON SIMULATED CURVE
The procedure followed in order to show some parameters effect on the simulated curve was by considering the sensitivity of some parameters. For this, the use of the numerical code (computation of the pressuremeter curve knowing the parameters of the model) allows to get a simulated pressuremeter curve. To carry out this analysis, the experimental pressuremeter curve deduced from the thick cylinder tests realized on Hostun sand at ENPC (Ecole Nationale des Ponts et Chaussées de Paris) by (Dupla 1995) has been used.
6.1. Dilatancy effect on the pressuremeter curve:
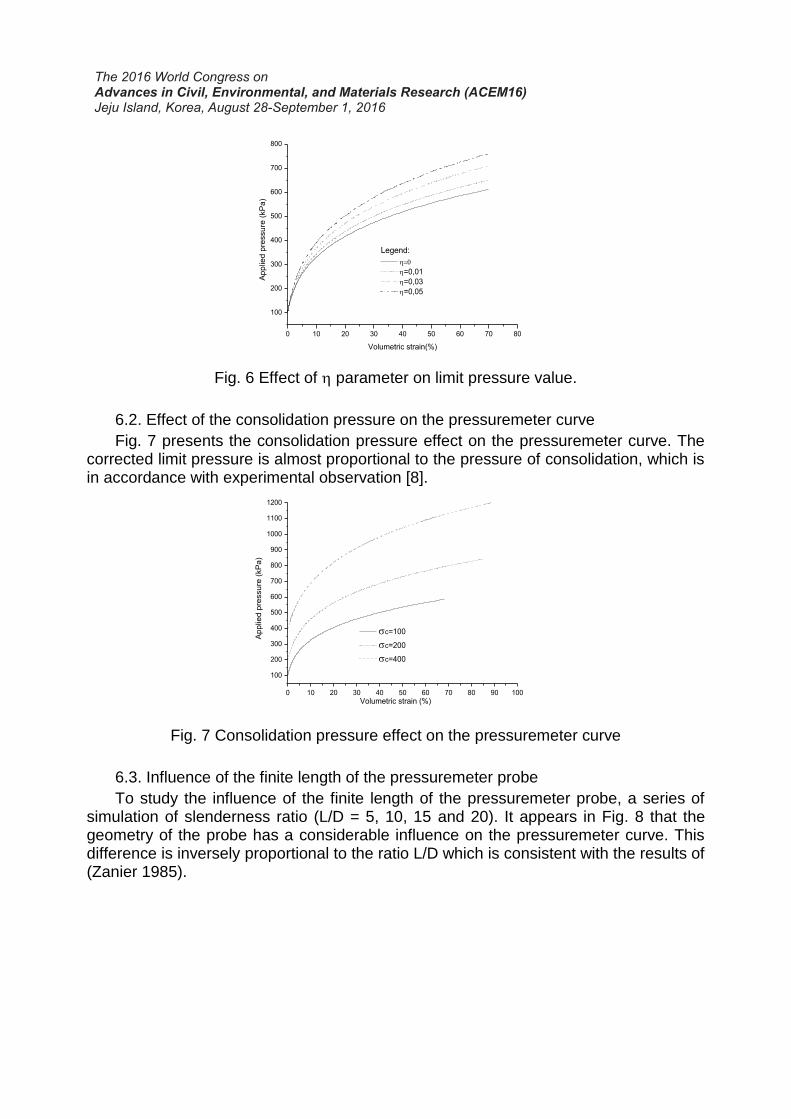
We present in Fig. 6 the effect of dilatancy on the value of the limit pressure. We
remark that an increase of dilatancy factor leads to an increase in the limit pressure which is consistent with the results of (Dupla 1995).
100
200
300
400
500
600
700
800
0 10 20 30 40 50 60 70 80
Volumetric strain(%)
Ap
plie
d p
ressu
re (
kP
a)
=0,01
=0,03
=0,05
Legend:
Fig. 6 Effect of parameter on limit pressure value.
6.2. Effect of the consolidation pressure on the pressuremeter curve
Fig. 7 presents the consolidation pressure effect on the pressuremeter curve. The corrected limit pressure is almost proportional to the pressure of consolidation, which is in accordance with experimental observation [8].
100
200
300
400
500
600
700
800
900
1000
1100
1200
0 10 20 30 40 50 60 70 80 90 100
Volumetric strain (%)
Ap
plie
d p
ressu
re (
kP
a)
c=100
c=200
c=400
Fig. 7 Consolidation pressure effect on the pressuremeter curve
6.3. Influence of the finite length of the pressuremeter probe
To study the influence of the finite length of the pressuremeter probe, a series of simulation of slenderness ratio (L/D = 5, 10, 15 and 20). It appears in Fig. 8 that the geometry of the probe has a considerable influence on the pressuremeter curve. This difference is inversely proportional to the ratio L/D which is consistent with the results of (Zanier 1985).

100
200
300
400
500
600
0 10 20 30 40 50 60 70 80 90 100
Volumetric strain (%)
Ap
plie
d p
ressu
re (
kP
a)
L/D=5
L/D=10
L/D=15
L/D=20
Fig. 8 Slenderness ratio effect
6.4 Disturbance effects around pressuremeter
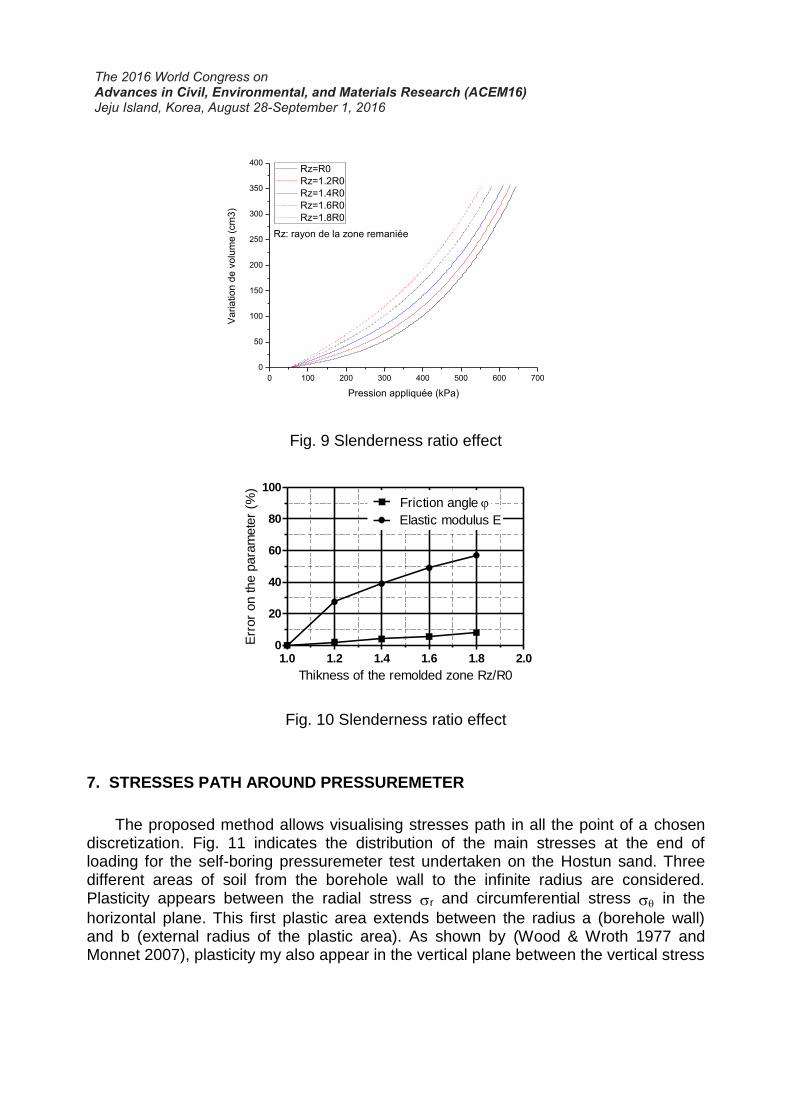
A remoulded annulus surrounding the pressuremeter probe reduces the mechanical characteristics, in particular the deformation modulus. The degree of disturbance in the annulus varies with distance from the borehole. In the conventional pressuremeter test, disturbance is also caused by the temporary unloading of the borehole until the probe is inserted and inflated to restore original stress conditions. The use of the Self Boring Pressuremeter can reduce remoulding disturbance considerably, although is not eliminated completely (Praharam & al., 1990).
The effect of a remoulded annulus with reduced modulus and strength around the probe was analyzed theoretically by (Baguelin & al. 1972). They adopted different stress-strain relationships for the intact and the remoulded zones in the analysis. The stress-strain curve of the remoulded soil was chosen with a modulus equal to 10% of the modulus of the intact soil. We adopting the same hypothesis expansion curves predicted for Hostun sand with different thickness of disturbed zone. The error in strength and modulus due to the presence of a disturbed annulus is plotted against the thickness of the annulus in Fig. 9. The error is calculated with reference to the strength and modulus values predicted for the undisturbed soil.
We remark that the elastic modulus E is very sensitive to the disturbance; the error on this parameter varies from 0 to 60%, while the friction angle, the error varies from 0 to 8% Fig. 10.
0 100 200 300 400 500 600 700
0
50
100
150
200
250
300
350
400
Va
ria
tio
n d
e v
olu
me
(cm
3)
Pression appliquée (kPa)
Rz=R0
Rz=1.2R0
Rz=1.4R0
Rz=1.6R0
Rz=1.8R0
Rz: rayon de la zone remaniée
Fig. 9 Slenderness ratio effect
1.0 1.2 1.4 1.6 1.8 2.00
20
40
60
80
100
Elastic modulus E
Friction angle
Thikness of the remolded zone Rz/R0
Err
or
on the p
ara
mete
r (%
)
Fig. 10 Slenderness ratio effect
7. STRESSES PATH AROUND PRESSUREMETER
The proposed method allows visualising stresses path in all the point of a chosen discretization. Fig. 11 indicates the distribution of the main stresses at the end of loading for the self-boring pressuremeter test undertaken on the Hostun sand. Three different areas of soil from the borehole wall to the infinite radius are considered. Plasticity appears between the radial stress r and circumferential stress in the
horizontal plane. This first plastic area extends between the radius a (borehole wall) and b (external radius of the plastic area). As shown by (Wood & Wroth 1977 and Monnet 2007), plasticity my also appear in the vertical plane between the vertical stress
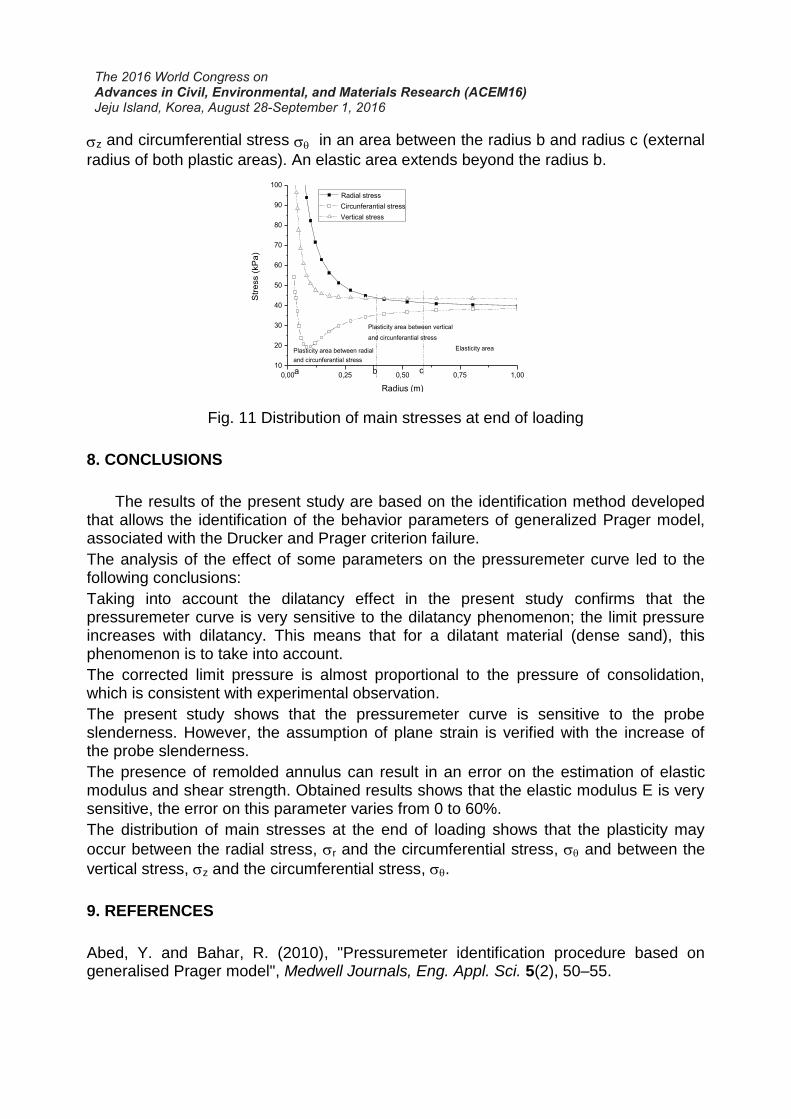
z and circumferential stress in an area between the radius b and radius c (external
radius of both plastic areas). An elastic area extends beyond the radius b.
Plasticity area between radial
and circunferantial stress
0,00 0,25 0,50 0,75 1,00
10
20
30
40
50
60
70
80
90
100
cb
Elasticity area
Plasticity area between vertical
and circunferantial stress
Str
ess (
kP
a)
Radius (m)
Radial stress
Circunferantial stress
Vertical stress
a
Fig. 11 Distribution of main stresses at end of loading
8. CONCLUSIONS
The results of the present study are based on the identification method developed that allows the identification of the behavior parameters of generalized Prager model, associated with the Drucker and Prager criterion failure.
The analysis of the effect of some parameters on the pressuremeter curve led to the following conclusions:
Taking into account the dilatancy effect in the present study confirms that the pressuremeter curve is very sensitive to the dilatancy phenomenon; the limit pressure increases with dilatancy. This means that for a dilatant material (dense sand), this phenomenon is to take into account.
The corrected limit pressure is almost proportional to the pressure of consolidation, which is consistent with experimental observation.
The present study shows that the pressuremeter curve is sensitive to the probe slenderness. However, the assumption of plane strain is verified with the increase of the probe slenderness.
The presence of remolded annulus can result in an error on the estimation of elastic modulus and shear strength. Obtained results shows that the elastic modulus E is very sensitive, the error on this parameter varies from 0 to 60%.
The distribution of main stresses at the end of loading shows that the plasticity may
occur between the radial stress, r and the circumferential stress, and between the
vertical stress, z and the circumferential stress, .
9. REFERENCES
Abed, Y. and Bahar, R. (2010), "Pressuremeter identification procedure based on generalised Prager model", Medwell Journals, Eng. Appl. Sci. 5(2), 50–55.

Abed, Y.; Bahar, R.; Dupla, J-C. and Amar Bouzid, Dj. (2014), "Identification of granular soils strength and stiffness parameters by matching Finite Element results to PMT data", International Journal of Computational Methods, 2(2), 231-253.
Baguelin F., Jezequel J.F., Lemée E. & LeMéhauté A. (1972), "Expansion of cylindrical probes in cohesive soils", J. of the Soil Mechanics and Foundations Division 98: 1129-1142.
Cambou, B.; Boubanga, A.; Bozetto, P. and Haghgou, M. (1990), "Determination of constitutive parameters from pressuremeters tests", 3rd Symp. Pressuremeter and Its Marine Applications, Oxford University, 243–352.
Carter, J.P.; Booker, J.R.; Yeung, S. K. (1986), "Cavity expansion in frictional cohesive soils". Géotechnique, 36(3), 349–58.
Chen W. F. and BaladiG. Y. (1985), "Soil plasticity: theory and implementation", Elsevier, Amesterdam (1985), 231 pp.
Chen W. F. and MIZUNO E. (2001), "Non linear analysis in soil mechanics, theory and implementation", Elsevier, Amesterdam (1990), 351 pp.
Cudmani, R. and Osinov, V. A. (2001), "The cavity expansion problem for the interpretation of cone penetration and pressuremeter tests", Canadian Geotechnical Journal, 38(3), 622–38.
Drucker D. & Prager W. (1952), "Soil mechanics and plastic analysis of limit design", Quart. Appl Math., vol 10, pp 157-165.
Dupla J. C. (1995), "Application de la sollicitation d’expansion d’une cavité cylindrique à l’évaluation des caractéristiques de liquefaction d’un sable", Thèse de doctorat, Ecole Nationale des Ponts et Chaussées,1995. P. 422
Fahey, M. and Carter J.P. (1993), "A finite element study of the pressuremeter test in sand using a nonlinear elastic plastic model", Canadian Geotechnical Journal, 30(2), 348–62.
Hsieh, Y.M.; Whittle, A.J. and Yu, H.S. (2002), "Interpretation of pressuremeter tests in sand using advanced soil model" ASCE Journal of Geotechnical and Geoenvironmental Engineering, 128(3), 274–8.
Javadi A. A. and Rezania M. (2009), "Applications of artificial intelligence and data mining techniques in soil modelling", Geomechanics and Engineering, 01, 53-74
Levasseur S, Malecot Y, Boulon M, Flavigny E. (2010), "Statistical inverse analysis based on genetic algorithm and principal component analysis: applications to excavation problems and pressuremeter tests", International Journal for Numerical and Analytical Methods in Geomechanics, 34, 471–91.
Levasseur, S. (2008), "Soil parameter identification using a genetic algorithm”, Int. J. Numer. Anal. Meth. Geomech. 32(2), 189–213.
Liang, R.Y. and Sharo, A. (2010), "Numerical investigation of the pressuremeter results affected by anisotropy of geomaterials", GeoFlorida 2010, Adv. Analysis, Modeling & Design, 1090–1098.
Monnet J. (2007), "Numericalanalysis for an interpretation of the pressuremeter test in granularsoil", 18ème congrés Français de mécanique, Grenoble, France.

Mousavi S. M., Alavi A. H., Mollahasani A., Gandomi A. H. (2011), "A hybrid computational approach to formulate soil deformation moduli obtained from PLT", Engineering Geology, 123, 324-332.
Olivari G. & Bahar R. (1993), "Analyse de la réponse du modèle de Prager généralisé sur chemin pressiométrique", 6ème Colloque Franco-Polonais de Mécanique des sols appliquée, Douai.
Olivari, G. and Bahar, R. (1995), "Response of generalized Prager’s model on pressuremeter path", Proc. 4th Int. Symp. Pressuremeter, A. A. Balkema, Sherbrooke, Canada, pp. 207–213.
Paraharam S., Chameau J.L., Alischaeffl A.G. & Holtz R.D. (1990), "Effect of disturbance on pressuremeter results in clays", Journal of Geotechnical Engineering, vol. 116, No 1, 35-53.
Rashed A., Bazaz J. B., Alavi A. M. (2012), "Nonlinear modeling of soil deformation modulus through LGP-based interpretation of pressuremeter test results", Engineering Applications of Artificial Intelligence, 25, 1437-1449.
Shahin, M.A.; Jaksa, M.B. and Maier, H.R. (2008), "State of the Art of Artificial Neural Networks in Geotechnical Engineering", Electronic Journal of Geotechnical Engineering 8, 1-26.
Wood D.M. & Wroth P.C. (1977), "Some laboratory experiments related to the results of pressuremeter tests", Geotechnique, 27(2), pp 181-201.
Yu, H.S. and Houlsby, G.T. (1991), "Finite cavity expansion in dilatant soils: loading analysis", Géotechnique, 41(2), 173–83.
Yu, H.S. and Houlsby, G.T. (1995), "A large strain analytical solution for cavity contraction in dilatant soils", Int J Numer Anal Methods Geomech.,19(11), 793–811.
Zanier F. (1985), "Analyse numérique de l’essai pressiométrique par la method des éléments finis, Application au cas des sols cohérents", Thèse de Docteur-Ingénieur, Ecole Centrale de Lyon, France.
Zhang Y, Gallipoli D, Augarde CE. (2009), "Simulation-based calibration of geotechnical parameters using parallel hybrid moving boundary particle swarm optimization" Computers and Geotechnics, 36, 604–15.
Zhang, Y.; Gallipoli, D. and Augarde, C. (2013), "Parameter identification for elasto-plastic modelling of unsaturated soils from pressuremeter tests by parallel modified particle swarm optimization", Computers and Geotechnics, 48, 293–303.