parametric analysis and torsion design charts for … · parametric analysis and torsion design...
TRANSCRIPT
Structural Engineering and Mechanics, Vol. 55, No. 1 (2015) 1-27
DOI: http://dx.doi.org/10.12989/sem.2015.55.1.001 1
Copyright © 2015 Techno-Press, Ltd.
http://www.techno-press.org/?journal=sem&subpage=8 ISSN: 1225-4568 (Print), 1598-6217 (Online)
Parametric analysis and torsion design charts for axially restrained RC beams
Luís F.A. Bernardo1, Cátia S.B. Taborda1a and Jorge M.R. Gama2b
1Department of Civil Engineering and Architecture, Centre of Materials and Building Technologies (C-made),
University of Beira Interior, Covilhã, Portugal 2Departments of Mathematics, University of Beira Interior, Center of Mathematics, Covilhã, Portugal
(Received February 25, 2013, Revised May 2, 2014, Accepted May 9, 2014)
Abstract. This article presents a theoretical parametric analysis on the ultimate torsional behaviour of axially restrained reinforced concrete (RC) beams. This analysis is performed by using a computing procedure based on a modification of the Variable Angle Truss Model. This computing procedure was previously developed to account for the influence of the longitudinal compressive stress state due to the axial restraint conditions provided by the connections of the beams to other structural members. The presented parametric study aims to check the influence of some important variable studies, namely: torsional reinforcement ratio, compressive concrete strength and axial restraint level. From the results of this parametric study, nonlinear regression analyses are performed and some design charts are proposed. Such charts allow to correct the resistance torque of RC beams (rectangular sections with small height to width ratios) to account for the favorable influence of the axial restraint.
Keywords: reinforced concrete; beams; torsion; axial restraint; parametric study; torsional design
1. Introduction
In common design procedures of reinforced concrete (RC) beams under torsion, the influence
of the axial restraint provided by the connections of the beams to other structural members is
usually neglected. These other structural members (beams, columns, walls, etc.) usually composes
the structure in which the beams are inserted (for instance, building frames). In non-cracked stage,
experimental results show that the beam’s elongation is negligible. This is because the torsional
longitudinal tensile stresses in the longitudinal direction are mainly carried by the entire concrete
area of the cross section. However, experimental results show that, after concrete cracking, RC
beams under torsion undergo a non-negligible longitudinal elongation (for instance: Hsu 1969 for
plain beams, Bernardo and Lopes 2009 for hollow beams). This is mainly due to the high tensile
stresses in the longitudinal reinforcement located in the crack zones (tensile stresses in the
longitudinal direction are mainly carried by longitudinal reinforcement). Experimental results also
Corresponding author, Assistant Professor, E-mail: [email protected] aMaster, E-mail: [email protected]
bAssistant Professor, E-mail: [email protected]
Luís F.A. Bernardo, Cátia S.B. Taborda and Jorge M.R. Gama
show that the beam’s elongation increases from the cracking torque until maximum torque is reached. Then, if beams are axially restrained it is expected that an increasing longitudinal compressive stress state will act in addition to the pure shear stress state due to torsion. The magnitude of this longitudinal compressive stress state will depend on the loading level (in the cracking stage of the beam) and also on the level of the axial restraint provided by the stiffness of the connections to the other structural members.
For the design of RC beams under shear forces, current codes of practice (for instance European Code, Eurocode 2 2010) include clauses to compute the increase of shear strength due to the existence of a longitudinal compressive stress state. For torsion, such clauses are usually not provided. However, since shear stresses are high in RC beams under torsion, it is expected that the torsional strength of the beams also increases due to the existence of a longitudinal compressive stress state.
The Variable Angle Truss-Model (VATM) was previously proposed by Hsu and Mo (1985). This torsional model uses a nonlinear softened stress () – strain () relationship for the concrete in the struts instead of a conventional – relationship for uniaxial compression.
VATM is able to predict the global behaviour of RC beams under torsion throughout the entire loading history. However, very good results are observed only for high loading levels (Bernardo et al. 2012a) and mainly for torque values. This is because for low loading levels the beam is not extensively cracked or not cracked at all (VATM assumes that the RC beam is fully cracked at all loading stages). When compared with other and recent theoretical models to compute the resistance torque of RC beams (for instance, Jeng and Hsu 2009, Cevik et al. 2012), VATM provides a simple mathematical treatment of the torsional problem. VATM is recognized to also provide a simple physical understanding of the torsion phenomenon in RC beams.
Based on the observations stated in the beginning of this section, it is expected that the axial restraint modifies the behaviour of RC beams under torsion mainly in the post-cracking stage. Then, it is expected that VATM provides a reliable model to be modified to account for the influence of the variable longitudinal compressive stress state in the beam due to the axial restraint condition. This modification was already presented and validated experimentally and numerically (Taborda 2012, Bernardo et al. 2014) and led to a new version of VATM called “modified VATM”. From this new model, Taborda (2012), Bernardo et al. (2014) presented a simple computing procedure which was implemented with the help of the computing programming language Delphi. This computing procedure is able to compute the Torque (T) - Twist () curve for axially restrained RC beams under torsion. 2. Research significance
As referred in other studies (Taborda 2012, Bernardo et al. 2014), no previous theoretical or experimental studies on axially restrained RC beams under torsion where found in the consulted literature.
As referred in Section 1, a new computing procedure was previously proposed and validated (both experimentally and numerically with finite element models) by Taborda (2012) and Bernardo et al. (2014). This computing procedure is able to predict very well the ultimate torsional behaviour of axially restrained RC beams under torsion, namely the effective resistance torque. However, its use for practical purposes involves computational programming. This is because modified VATM (as for original VATM) is a nonlinear model and involves an iterative calculus
2
Parametric analysis and torsion design charts for axially restrained RC beams
procedure, since some interdependent variables are initially unknown for each loading level. For practical purposes (design procedures), an appropriate and simplest tool becomes necessary to correct the calculation value of the resistance torque computed, for instance, from actual codes rules. This tool will allow structural designers to perform optimized designs of RC beams under torsion. This tool was not proposed by the authors (Taborda 2012, Bernardo et al. 2014) and still remains to be proposed in the literature.
For this reason, the modified VATM is used in this article to propose such a tool for practice. Firstly, based on the modified VATM, this article presents a theoretical parametric analysis. In this analysis, the influence of some important variable studies on the torsional behaviour of axially restrained RC beams is analyzed, namely: torsional reinforcement ratio, compressive concrete strength and axial restraint level. The first two variables fairly govern the torsional behaviour of RC beams under torsion for high level loading (Bernardo and Lopes 2008, 2011). Secondly, from the results of the parametric study, nonlinear correlation analyses are performed and some design charts are proposed. Such design charts allow to correct the calculation value of the resistance torque of RC beams (rectangular sections with small height to width ratios) in order to account for the favorable influence of the axial restraint.
It should be pointed out that, in this study, only rectangular RC beams with current dimensions, current beam’s length and small aspect ratio (height/width) for the cross section, will be studied. Then, this study is mainly focused on current beams used in building’s frames. In fact, in current building structures high axial restraints confinement constitutes a common situation due to the high static indetermination degree of the 3D frames. It is also known that the structural design of such beams with high torsional moments usually lead to sections with small height to width ratio.
Finally, it should be also pointed out that this study deals exclusively with pure torsion. In actual structures, the interaction between torsion and other internal forces is a common situation. However, the behaviour of beams under pure torsion needs to be well known. Firstly, the design procedures of RC sections are usually carried on separately for each internal force. So, a design for pure torsion is always carried on. Secondly, theoretical and reliable models for special cases with pure torsion are still need. Such models can be very useful to be applied in other studies focused in more complex situations, namely to members with force interactions (Belarbi et al. 2009, Valipour and Foster 2010). 3. Modified VATM for axially restrained beams
This section summarizes the formulation and the calculus procedure for the modified VATM for axially restrained beams under torsion. Some experimental and numerical results previously used by the authors to validate this theoretical model are also presented. More detailed information about the derivation of the formulation for the modified VATM, as well as the comparative analyzes performed to validate the model, can be found in Taborda (2012) and Bernardo et al. (2014). In these studies, the modified VATM was extended to prestressed concrete beams under torsion (longitudinal uniform prestress). In the present study, the formulation and calculus procedure of the modified VATM will be particularized to RC beams. Such beams constitute a particular case of VATM for PC beams when neither prestress force nor prestress reinforcement exist.
As illustrated in Table 1, the elongation l of the beam under torsion (with length l), in the cracked stage, is computed assuming firstly that no axial restraint exists (“free condition”). Then, a
3
Luís F.A. Bernardo, Cátia S.B. Taborda and Jorge M.R. Gama
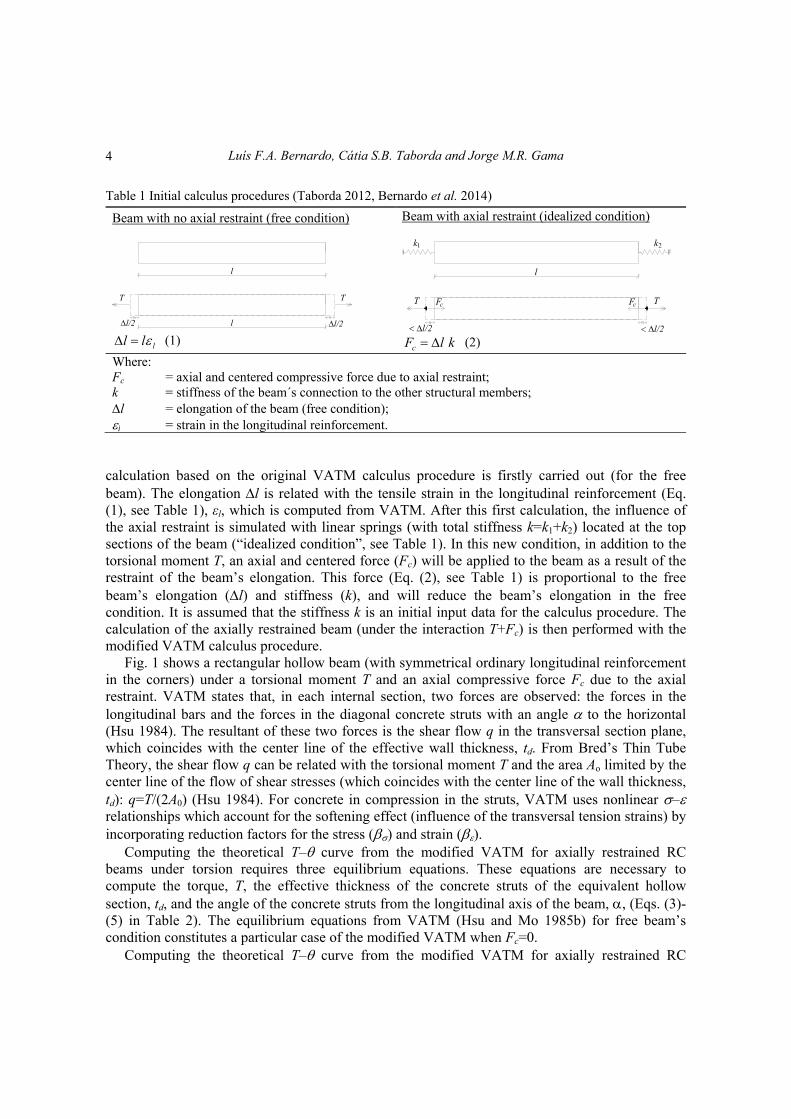
Table 1 Initial calculus procedures (Taborda 2012, Bernardo et al. 2014)
Beam with no axial restraint (free condition)
l
T T
l/2 l/2l ll l (1)
Beam with axial restraint (idealized condition)
1 2
l
T TFc Fc
cF l k (2)
Where: Fc = axial and centered compressive force due to axial restraint; k = stiffness of the beam´s connection to the other structural members; l = elongation of the beam (free condition); l = strain in the longitudinal reinforcement.
calculation based on the original VATM calculus procedure is firstly carried out (for the free beam). The elongation l is related with the tensile strain in the longitudinal reinforcement (Eq. (1), see Table 1), εl, which is computed from VATM. After this first calculation, the influence of the axial restraint is simulated with linear springs (with total stiffness k=k1+k2) located at the top sections of the beam (“idealized condition”, see Table 1). In this new condition, in addition to the torsional moment T, an axial and centered force (Fc) will be applied to the beam as a result of the restraint of the beam’s elongation. This force (Eq. (2), see Table 1) is proportional to the free beam’s elongation (l) and stiffness (k), and will reduce the beam’s elongation in the free condition. It is assumed that the stiffness k is an initial input data for the calculus procedure. The calculation of the axially restrained beam (under the interaction T+Fc) is then performed with the modified VATM calculus procedure.
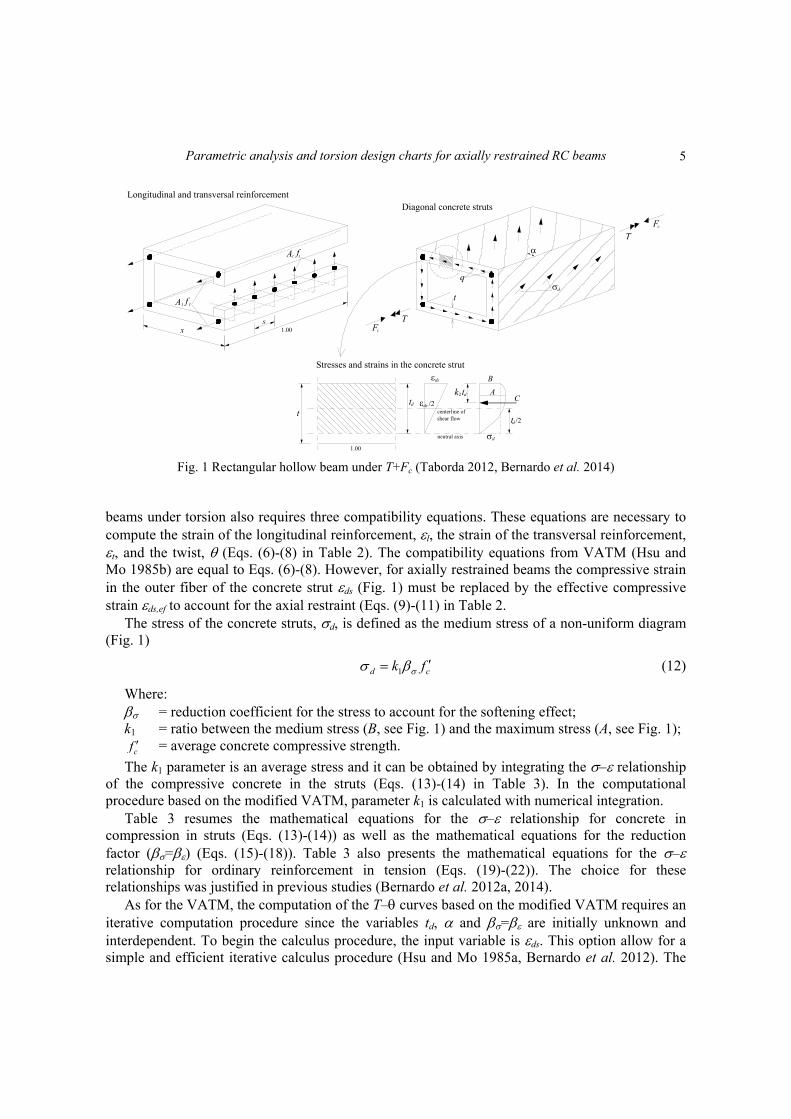
Fig. 1 shows a rectangular hollow beam (with symmetrical ordinary longitudinal reinforcement in the corners) under a torsional moment T and an axial compressive force Fc due to the axial restraint. VATM states that, in each internal section, two forces are observed: the forces in the longitudinal bars and the forces in the diagonal concrete struts with an angle to the horizontal (Hsu 1984). The resultant of these two forces is the shear flow q in the transversal section plane, which coincides with the center line of the effective wall thickness, td. From Bred’s Thin Tube Theory, the shear flow q can be related with the torsional moment T and the area Ao limited by the center line of the flow of shear stresses (which coincides with the center line of the wall thickness, td): q=T/(2A0) (Hsu 1984). For concrete in compression in the struts, VATM uses nonlinear – relationships which account for the softening effect (influence of the transversal tension strains) by incorporating reduction factors for the stress () and strain ().
Computing the theoretical T– curve from the modified VATM for axially restrained RC beams under torsion requires three equilibrium equations. These equations are necessary to compute the torque, T, the effective thickness of the concrete struts of the equivalent hollow section, td, and the angle of the concrete struts from the longitudinal axis of the beam, , (Eqs. (3)-(5) in Table 2). The equilibrium equations from VATM (Hsu and Mo 1985b) for free beam’s condition constitutes a particular case of the modified VATM when Fc=0.
Computing the theoretical T– curve from the modified VATM for axially restrained RC
4
Parametric analysis and torsion design charts for axially restrained RC beams
Al f l
tt /2d
neutral axis
td
k2td
ds
A
B
C
Stresses and strains in the concrete strut
centerline ofds /2
d
1.00
Longitudinal and transversal reinforcement
1.00
q
T
d
t
Diagonal concrete struts
shear flow
T
Fc
Fcxs
At ft
Fig. 1 Rectangular hollow beam under T+Fc (Taborda 2012, Bernardo et al. 2014)
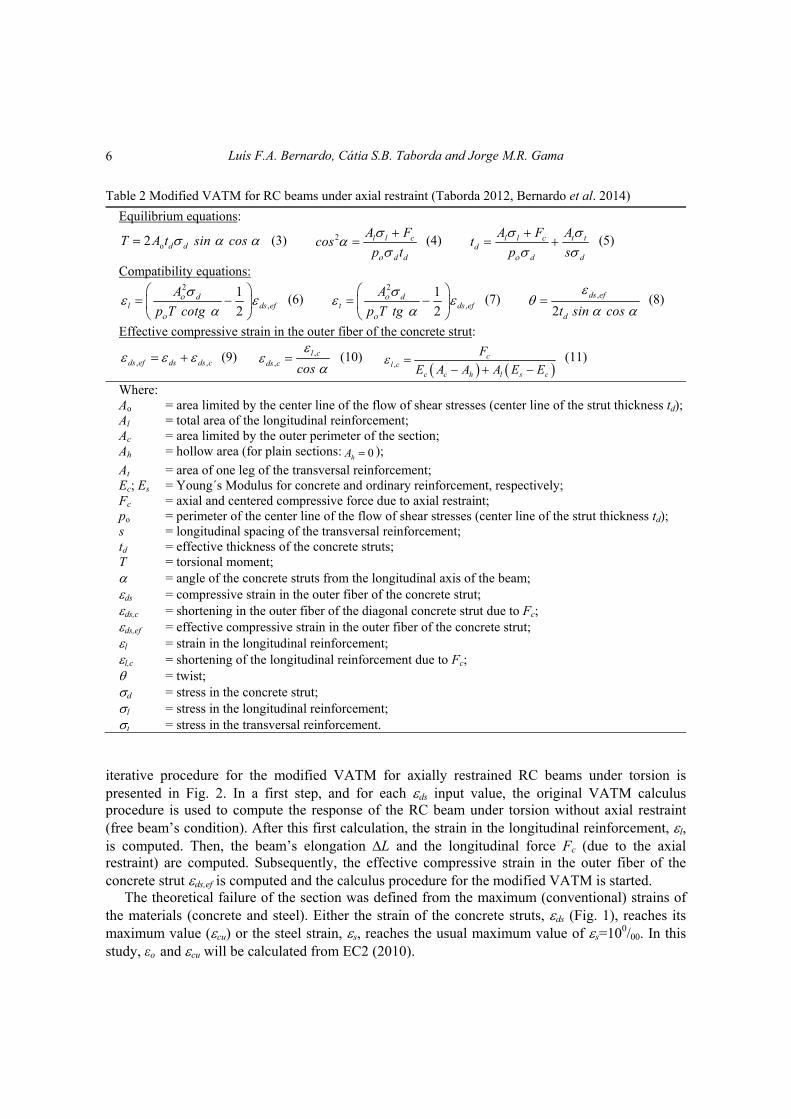
beams under torsion also requires three compatibility equations. These equations are necessary to compute the strain of the longitudinal reinforcement, l, the strain of the transversal reinforcement, t, and the twist, (Eqs. (6)-(8) in Table 2). The compatibility equations from VATM (Hsu and Mo 1985b) are equal to Eqs. (6)-(8). However, for axially restrained beams the compressive strain in the outer fiber of the concrete strut ds (Fig. 1) must be replaced by the effective compressive strain ds,ef to account for the axial restraint (Eqs. (9)-(11) in Table 2.
The stress of the concrete struts, d, is defined as the medium stress of a non-uniform diagram (Fig. 1)
1d ck f (12)
Where: = reduction coefficient for the stress to account for the softening effect; k1 = ratio between the medium stress (B, see Fig. 1) and the maximum stress (A, see Fig. 1);
cf = average concrete compressive strength.
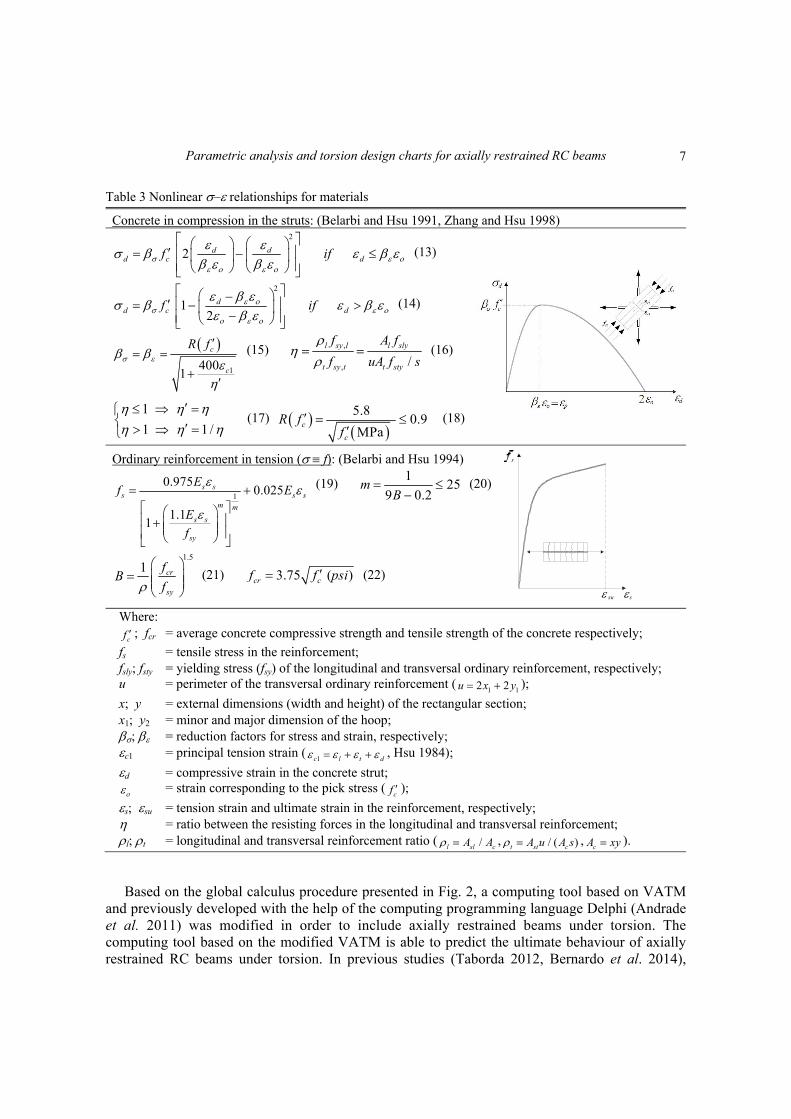
The k1 parameter is an average stress and it can be obtained by integrating the – relationship of the compressive concrete in the struts (Eqs. (13)-(14) in Table 3). In the computational procedure based on the modified VATM, parameter k1 is calculated with numerical integration.
Table 3 resumes the mathematical equations for the – relationship for concrete in compression in struts (Eqs. (13)-(14)) as well as the mathematical equations for the reduction factor (=) (Eqs. (15)-(18)). Table 3 also presents the mathematical equations for the – relationship for ordinary reinforcement in tension (Eqs. (19)-(22)). The choice for these relationships was justified in previous studies (Bernardo et al. 2012a, 2014).
As for the VATM, the computation of the T– curves based on the modified VATM requires an iterative computation procedure since the variables td, and = are initially unknown and interdependent. To begin the calculus procedure, the input variable is ds. This option allow for a simple and efficient iterative calculus procedure (Hsu and Mo 1985a, Bernardo et al. 2012). The
5
Luís F.A. Bernardo, Cátia S.B. Taborda and Jorge M.R. Gama
Table 2 Modified VATM for RC beams under axial restraint (Taborda 2012, Bernardo et al. 2014)
Equilibrium equations:
ο2 d dT A t sin cos (3) 2 l l c
d d
A Fcos
p t
(4) l l c t td
d d
A F At
p s
(5)
Compatibility equations: 2
,
1
2d
l ds ef
A
p T cotg
(6) 2
,
1
2d
t ds ef
A
p T tg
(7) ,
2ds ef
dt sin cos
(8)
Effective compressive strain in the outer fiber of the concrete strut:
, ,ds ef ds ds c (9) ,,
l cds c cos
(10)
,c
l cc c h l s c
F
E A A A E E
(11)
Where: Ao = area limited by the center line of the flow of shear stresses (center line of the strut thickness td);Al = total area of the longitudinal reinforcement; Ac = area limited by the outer perimeter of the section; Ah = hollow area (for plain sections: 0hA );
At = area of one leg of the transversal reinforcement; Ec; Es = Young´s Modulus for concrete and ordinary reinforcement, respectively; Fc = axial and centered compressive force due to axial restraint; po = perimeter of the center line of the flow of shear stresses (center line of the strut thickness td); s = longitudinal spacing of the transversal reinforcement; td = effective thickness of the concrete struts; T = torsional moment; = angle of the concrete struts from the longitudinal axis of the beam; ds = compressive strain in the outer fiber of the concrete strut; ds,c = shortening in the outer fiber of the diagonal concrete strut due to Fc; ds,ef = effective compressive strain in the outer fiber of the concrete strut; l = strain in the longitudinal reinforcement; l,c = shortening of the longitudinal reinforcement due to Fc; = twist; d = stress in the concrete strut; l = stress in the longitudinal reinforcement; t = stress in the transversal reinforcement.
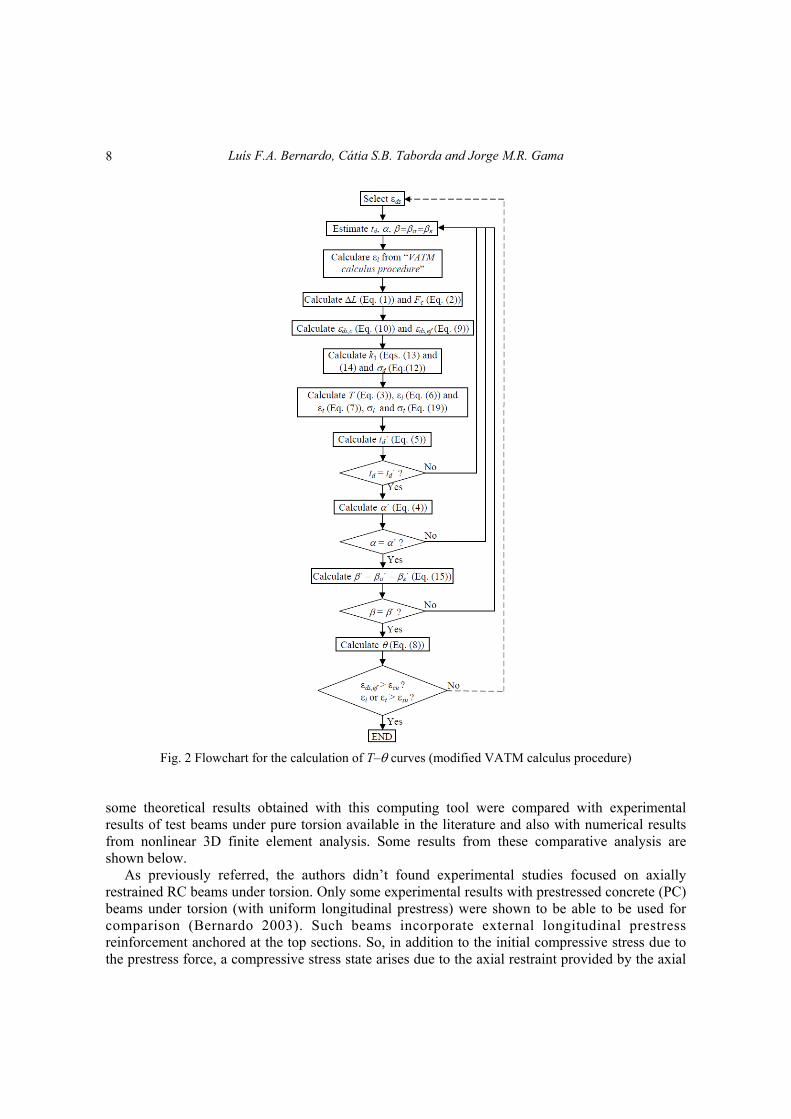
iterative procedure for the modified VATM for axially restrained RC beams under torsion is presented in Fig. 2. In a first step, and for each ds input value, the original VATM calculus procedure is used to compute the response of the RC beam under torsion without axial restraint (free beam’s condition). After this first calculation, the strain in the longitudinal reinforcement, l, is computed. Then, the beam’s elongation L and the longitudinal force Fc (due to the axial restraint) are computed. Subsequently, the effective compressive strain in the outer fiber of the concrete strut ds,ef is computed and the calculus procedure for the modified VATM is started.
The theoretical failure of the section was defined from the maximum (conventional) strains of the materials (concrete and steel). Either the strain of the concrete struts, ds (Fig. 1), reaches its maximum value (cu) or the steel strain, s, reaches the usual maximum value of s=100/00. In this study, εo and cu will be calculated from EC2 (2010).
6
Parametric analysis and torsion design charts for axially restrained RC beams
Table 3 Nonlinear – relationships for materials
Concrete in compression in the struts: (Belarbi and Hsu 1991, Zhang and Hsu 1998) 2
2 d dd c df if
(13)
2
1 2
dd c df if
(14)
1400
1
c
c
R f
(15) ,
, /l sy l l sly
t sy t t sty
f A f
f uA f s
(16)
1
1 1 /
(17) 5.8
0.9MPa
c
c
R ff
(18)
Ordinary reinforcement in tension ( f): (Belarbi and Hsu 1994)
1
0.9750.025
1.11
s ss s s
m m
s s
sy
Ef E
E
f
(19) 1
259 0.2
mB
(20)
1.5
1 cr
sy
fB
f
(21) 3.75 ( )cr cf f psi (22)
Where:
cf ; fcr = average concrete compressive strength and tensile strength of the concrete respectively;
fs = tensile stress in the reinforcement; fsly;fsty = yielding stress (fsy) of the longitudinal and transversal ordinary reinforcement, respectively; u = perimeter of the transversal ordinary reinforcement (
1 12 2u x y );
x; y = external dimensions (width and height) of the rectangular section; x1; y2 = minor and major dimension of the hoop; ; = reduction factors for stress and strain, respectively; c1 = principal tension strain (
1c l t d , Hsu 1984);
d = compressive strain in the concrete strut;
= strain corresponding to the pick stress (cf );
s;su = tension strain and ultimate strain in the reinforcement, respectively; = ratio between the resisting forces in the longitudinal and transversal reinforcement; l;t = longitudinal and transversal reinforcement ratio ( /l sl cA A , / ( )t st cA u A s ,
cA xy ).
Based on the global calculus procedure presented in Fig. 2, a computing tool based on VATM
and previously developed with the help of the computing programming language Delphi (Andrade et al. 2011) was modified in order to include axially restrained beams under torsion. The computing tool based on the modified VATM is able to predict the ultimate behaviour of axially restrained RC beams under torsion. In previous studies (Taborda 2012, Bernardo et al. 2014),
s
s su
7
Luís F.A. Bernardo, Cátia S.B. Taborda and Jorge M.R. Gama
Fig. 2 Flowchart for the calculation of T– curves (modified VATM calculus procedure)
some theoretical results obtained with this computing tool were compared with experimental results of test beams under pure torsion available in the literature and also with numerical results from nonlinear 3D finite element analysis. Some results from these comparative analysis are shown below.
As previously referred, the authors didn’t found experimental studies focused on axially restrained RC beams under torsion. Only some experimental results with prestressed concrete (PC) beams under torsion (with uniform longitudinal prestress) were shown to be able to be used for comparison (Bernardo 2003). Such beams incorporate external longitudinal prestress reinforcement anchored at the top sections. So, in addition to the initial compressive stress due to the prestress force, a compressive stress state arises due to the axial restraint provided by the axial
8

Parametric analysis and torsion design charts for axially restrained RC beams
(a) T– curves (b) Geometry and detailing
Fig. 3 Beam D1 (Bernardo et al. 2014)
stiffness of the prestress reinforcement. Such beams can be studied as axially restrained PC beams under torsion. As an example, Fig. 3(a) shows the T– curves for one (Beam D1) of the two prestressed concrete beams under torsion tested by Bernardo (2003). Beam D1 (with 5.9 meters long) has a rectangular hollow cross section (Fig. 3(b)). External prestressing was applied through three 0.6 inches wires centered in the section (Fig. 3(b)). The ordinary reinforcement were ribbed bars sold commercially as A500 Class. The prestress reinforcement used in Beam D1 were wires sold commercially as S1670/1860 Class. The average concrete compressive strength was 80.8 MPa and the initial stress in the prestressing reinforcement was 640 MPa.
Fig. 3(a) includes two theoretical T– curves. The first one was calculated from the original VATM (“VATM”). The second T– curve was calculated from the modified VATM (“mod.VATM”) to account for the axial restraint provided by the axial stiffness of the longitudinal prestress reinforcement. Fig. 3(a) shows that the modified VATM slightly improves the previsions of the T– curves for the ultimate behaviour of Beam D1. The slight differences between the theoretical T– curves were probably due to the low level of axial restraint provided by the low longitudinal prestress reinforcement area. Nevertheless, some axial restraint effect exists and the theoretical T– curves from the modified VATM are closer to the experimental one.
To validate the modified VATM, Bernardo et al. (2014) also performed a comparative analysis with some numerical results. Such results were obtained from a 3D nonlinear finite element model (3D FEM) developed with LUSAS software. This comparative analysis was focused on the ultimate behaviour of a RC hollow beam under torsion (with no axial restraint). This beam, Beam A2 from Bernardo and Lopes (2009), has the same geometry as for Beam D1 (see details of Beam A2 in Section 4.1).
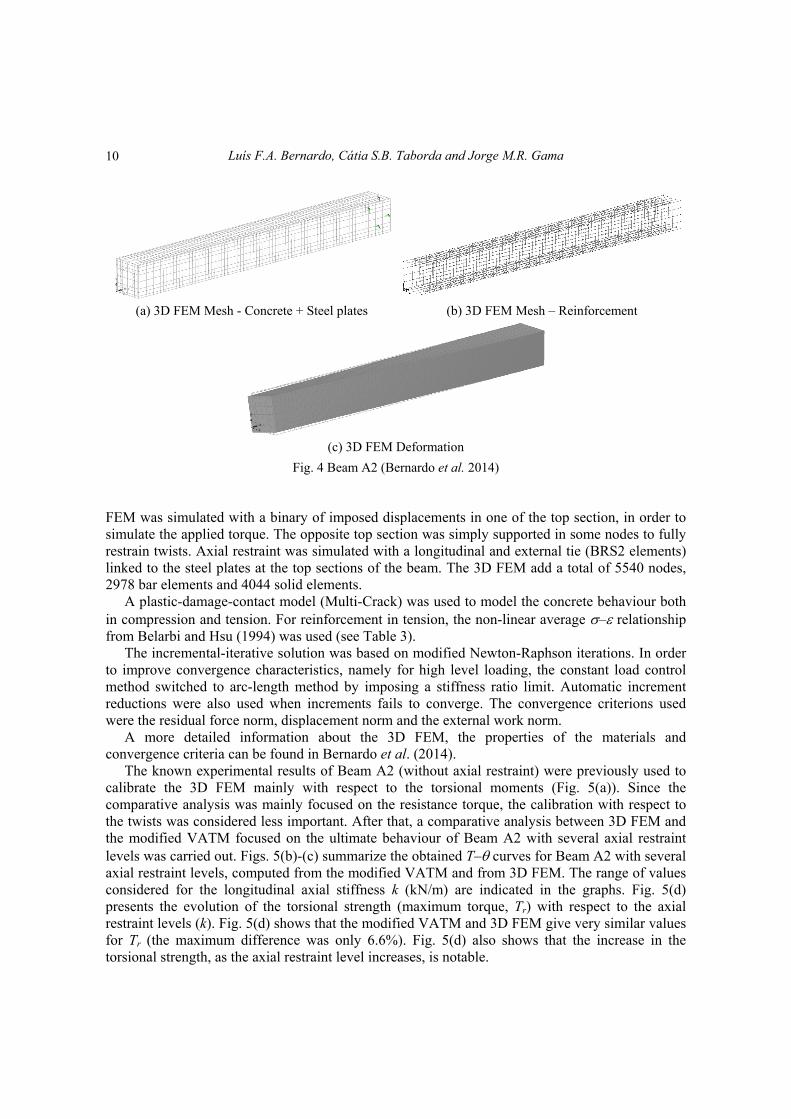
The 3D FEM aimed to simulate the global behaviour of the RC Beam A2 under torsion and under several axial restraint levels. The 3D FEM consisted of thick steel plates in the tops of the beam (sections under torsional loading and with bearing supports), and RC walls composing the hollow section (Fig. 4(a)). The concrete walls and steel plates were modeled with eight-node solid elements with 3 degrees of freedom (translations) in each node (HX8 element). The steel reinforcement was modeled using a 3D isoparametric bar with two nodes and 3 degrees of freedom (translations) in each node (BRS2 element). Perfect bond was considered between concrete and reinforcement bars, so solid and bar steel elements share the same nodes. The loading of the 3D
9
Luís F.A. Bernardo, Cátia S.B. Taborda and Jorge M.R. Gama
X
Y
Z
(a) 3D FEM Mesh - Concrete + Steel plates (b) 3D FEM Mesh – Reinforcement
X
Y
Z
(c) 3D FEM Deformation
Fig. 4 Beam A2 (Bernardo et al. 2014)
FEM was simulated with a binary of imposed displacements in one of the top section, in order to simulate the applied torque. The opposite top section was simply supported in some nodes to fully restrain twists. Axial restraint was simulated with a longitudinal and external tie (BRS2 elements) linked to the steel plates at the top sections of the beam. The 3D FEM add a total of 5540 nodes, 2978 bar elements and 4044 solid elements.
A plastic-damage-contact model (Multi-Crack) was used to model the concrete behaviour both in compression and tension. For reinforcement in tension, the non-linear average – relationship from Belarbi and Hsu (1994) was used (see Table 3).
The incremental-iterative solution was based on modified Newton-Raphson iterations. In order to improve convergence characteristics, namely for high level loading, the constant load control method switched to arc-length method by imposing a stiffness ratio limit. Automatic increment reductions were also used when increments fails to converge. The convergence criterions used were the residual force norm, displacement norm and the external work norm.
A more detailed information about the 3D FEM, the properties of the materials and convergence criteria can be found in Bernardo et al. (2014).
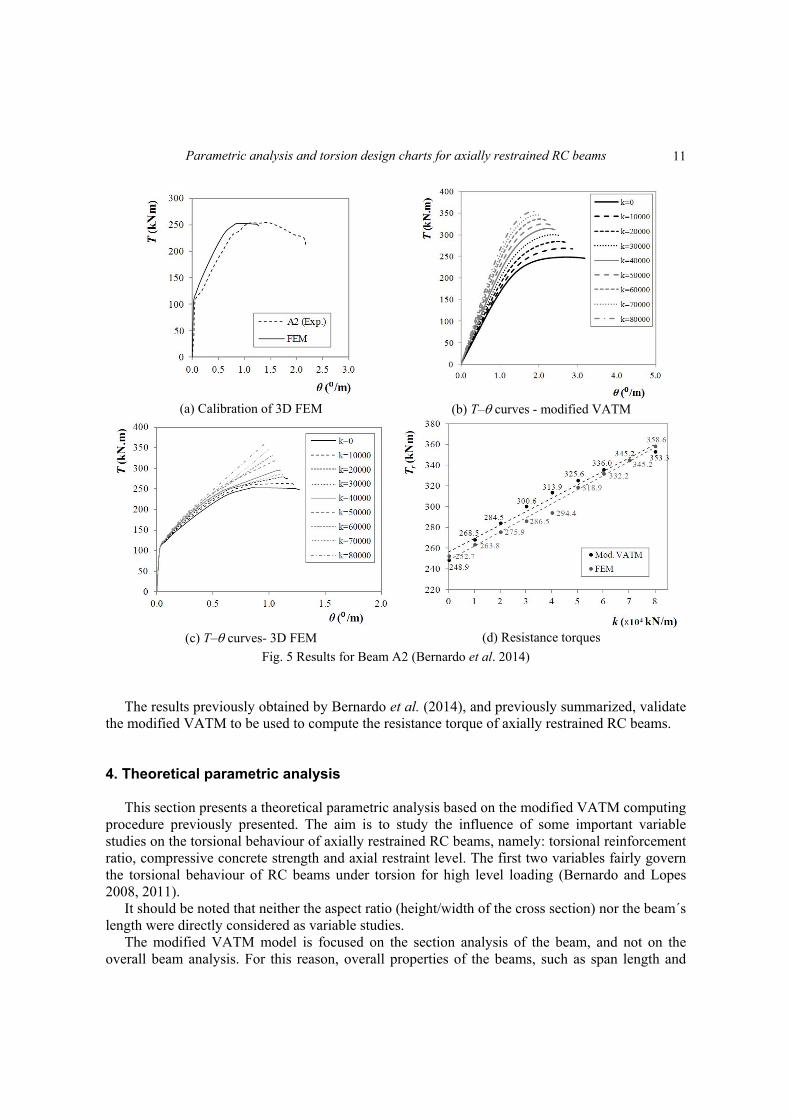
The known experimental results of Beam A2 (without axial restraint) were previously used to calibrate the 3D FEM mainly with respect to the torsional moments (Fig. 5(a)). Since the comparative analysis was mainly focused on the resistance torque, the calibration with respect to the twists was considered less important. After that, a comparative analysis between 3D FEM and the modified VATM focused on the ultimate behaviour of Beam A2 with several axial restraint levels was carried out. Figs. 5(b)-(c) summarize the obtained T– curves for Beam A2 with several axial restraint levels, computed from the modified VATM and from 3D FEM. The range of values considered for the longitudinal axial stiffness k (kN/m) are indicated in the graphs. Fig. 5(d) presents the evolution of the torsional strength (maximum torque, Tr) with respect to the axial restraint levels (k). Fig. 5(d) shows that the modified VATM and 3D FEM give very similar values for Tr (the maximum difference was only 6.6%). Fig. 5(d) also shows that the increase in the torsional strength, as the axial restraint level increases, is notable.
10
Parametric analysis and torsion design charts for axially restrained RC beams
(a) Calibration of 3D FEM (b) T– curves - modified VATM
(c) T– curves- 3D FEM (d) Resistance torques
Fig. 5 Results for Beam A2 (Bernardo et al. 2014) The results previously obtained by Bernardo et al. (2014), and previously summarized, validate
the modified VATM to be used to compute the resistance torque of axially restrained RC beams. 4. Theoretical parametric analysis
This section presents a theoretical parametric analysis based on the modified VATM computing procedure previously presented. The aim is to study the influence of some important variable studies on the torsional behaviour of axially restrained RC beams, namely: torsional reinforcement ratio, compressive concrete strength and axial restraint level. The first two variables fairly govern the torsional behaviour of RC beams under torsion for high level loading (Bernardo and Lopes 2008, 2011).
It should be noted that neither the aspect ratio (height/width of the cross section) nor the beam´s length were directly considered as variable studies.
The modified VATM model is focused on the section analysis of the beam, and not on the overall beam analysis. For this reason, overall properties of the beams, such as span length and
11
Luís F.A. Bernardo, Cátia S.B. Taborda and Jorge M.R. Gama
stiffness of the connections to other structural members cannot be considered as direct variable studies. For this reason, in this study, the influence of the referred variables are computed separately (such as for the stiffness) or included in a complementary analysis (such as performed with the span length, see Section 4.5).
The aspect ratio was one of the variables study considered in the early studies on rectangular RC beams under torsion (for instance, Hsu 1968). From such studies, it was concluded that, for aspects ratio not very far from unity, the influence of this parameter is very small when compared with other variables study (such as material strengths and reinforcement ratios). Furthermore, it is also well known that when torsion constitutes a major internal force in design, the cross section of the beams are usually designed with similar depth and width (aspect ratio close to unity).
In fact, the aspect ratio can be somehow indirectly considered in the torsional reinforcement ratio, which constitutes one of the three variables study considered in this article. The total torsional reinforcement ratio is the sum of the longitudinal (l) and transversal (t) torsional reinforcement ratio. As stated in Table 3, both parameters depends on the width (x) and high (y) of the rectangular section (l=Asl/Ac and t=Astu/(Acs), with Ac=xy). This explains why the experimental results of rectangular sections (with aspect ratios not much different) can be grouped to validate theoretical models used to compute the resistance torque (Leu and Lee 2000).
Since this article is mainly focused on current rectangular sections designed for primary torsional moments (with aspect ratios not very far from unity), the influence of the aspect ratio was neglected as a direct variable study. This will allow to reduce the complexity of the nonlinear regression analyzes presented below.
The parametric analysis presented below will focus on the influence of the axial restraint level in the global behaviour of RC beams under torsion. Such influence on some parameters which characterize the internal deformation and stress state of RC beams under torsion, as well as for some other parameters included in the formulation of the modified VATM, is also analyzed.
4.1 Reference beam For the purpose of Section 4, the experimental RC hollow beam A2 (or A-47.3-0.76) from
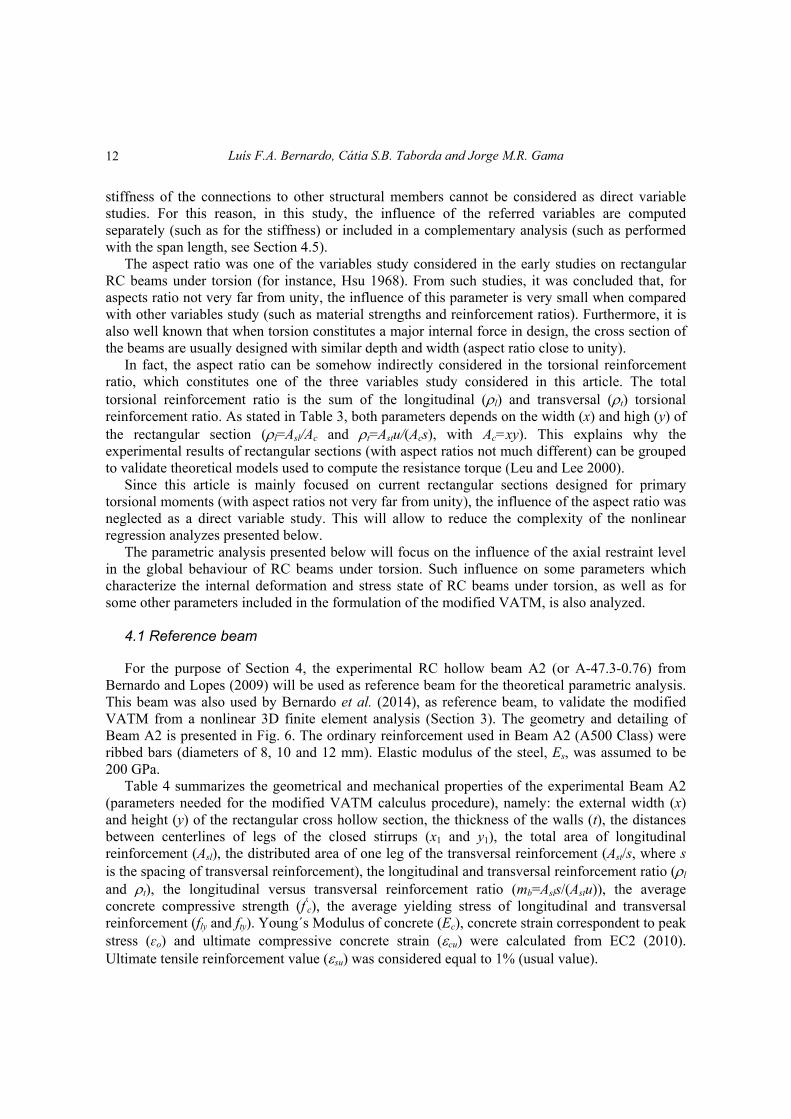
Bernardo and Lopes (2009) will be used as reference beam for the theoretical parametric analysis. This beam was also used by Bernardo et al. (2014), as reference beam, to validate the modified VATM from a nonlinear 3D finite element analysis (Section 3). The geometry and detailing of Beam A2 is presented in Fig. 6. The ordinary reinforcement used in Beam A2 (A500 Class) were ribbed bars (diameters of 8, 10 and 12 mm). Elastic modulus of the steel, Es, was assumed to be 200 GPa.
Table 4 summarizes the geometrical and mechanical properties of the experimental Beam A2 (parameters needed for the modified VATM calculus procedure), namely: the external width (x) and height (y) of the rectangular cross hollow section, the thickness of the walls (t), the distances between centerlines of legs of the closed stirrups (x1 and y1), the total area of longitudinal reinforcement (Asl), the distributed area of one leg of the transversal reinforcement (Ast/s, where s is the spacing of transversal reinforcement), the longitudinal and transversal reinforcement ratio (l and t), the longitudinal versus transversal reinforcement ratio (mb=Asls/(Astu)), the average concrete compressive strength (f′c), the average yielding stress of longitudinal and transversal reinforcement (fly and fty). Young´s Modulus of concrete (Ec), concrete strain correspondent to peak stress (ɛo) and ultimate compressive concrete strain (cu) were calculated from EC2 (2010). Ultimate tensile reinforcement value (su) was considered equal to 1% (usual value).
12
Parametric analysis and torsion design charts for axially restrained RC beams
1.20
LONGITUDINAL VIEW
6.49
5.900.34 0.25
(m)
Fig. 6 Geometry and detailing of test Beam A2 (Bernardo and Lopes 2009)
Table 4 Properties of test Beam A2 (Bernardo and Lopes 2009)
Beam x ; y cm
t cm
x1 cm
y1 cm
Asl cm2
Ast/scm2/m
l %
t %
mbcf
MPafly
MPafty
MPa Ec
(1) (1)
%
cu(1)
%
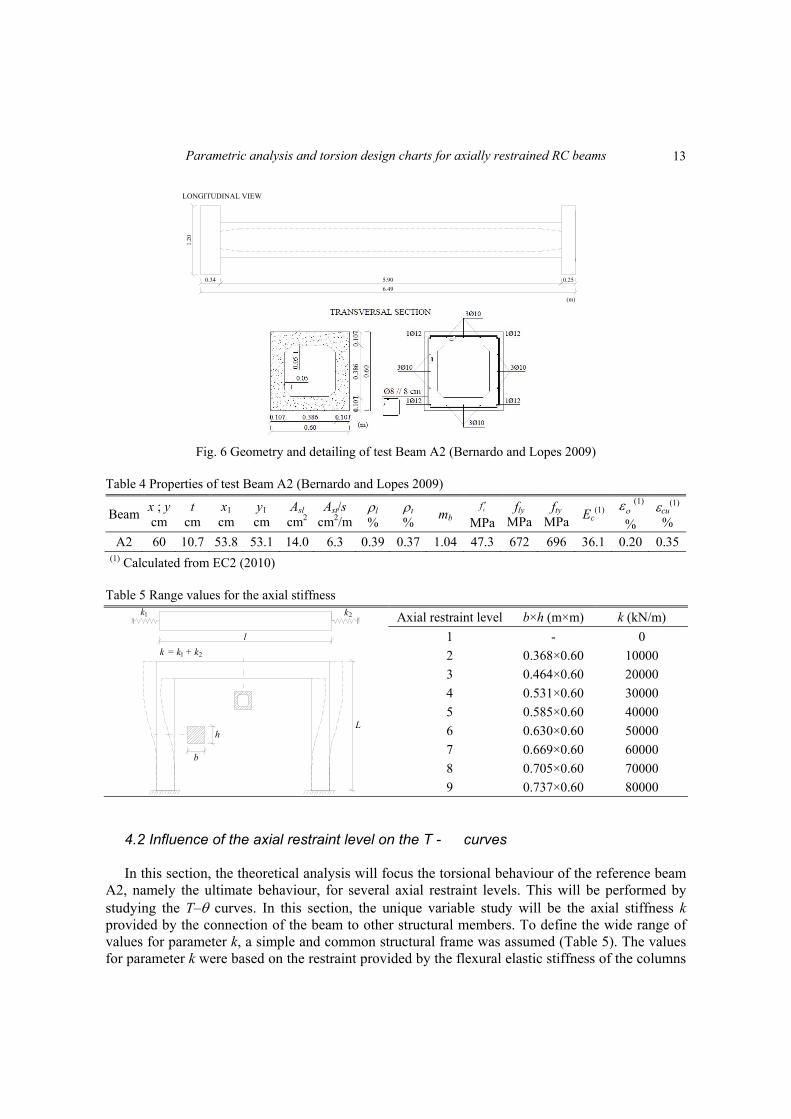
A2 60 10.7 53.8 53.1 14.0 6.3 0.39 0.37 1.04 47.3 672 696 36.1 0.20 0.35 (1) Calculated from EC2 (2010) Table 5 Range values for the axial stiffness
1 2
l
k1 + k2=k
h
b
L
Axial restraint level b×h (m×m) k (kN/m)
1 - 0
2 0.368×0.60 10000
3 0.464×0.60 20000
4 0.531×0.60 30000
5 0.585×0.60 40000
6 0.630×0.60 50000
7 0.669×0.60 60000
8 0.705×0.60 70000
9 0.737×0.60 80000
4.2 Influence of the axial restraint level on the T - curves In this section, the theoretical analysis will focus the torsional behaviour of the reference beam
A2, namely the ultimate behaviour, for several axial restraint levels. This will be performed by studying the T– curves. In this section, the unique variable study will be the axial stiffness k provided by the connection of the beam to other structural members. To define the wide range of values for parameter k, a simple and common structural frame was assumed (Table 5). The values for parameter k were based on the restraint provided by the flexural elastic stiffness of the columns
13
Luís F.A. Bernardo, Cátia S.B. Taborda and Jorge M.R. Gama
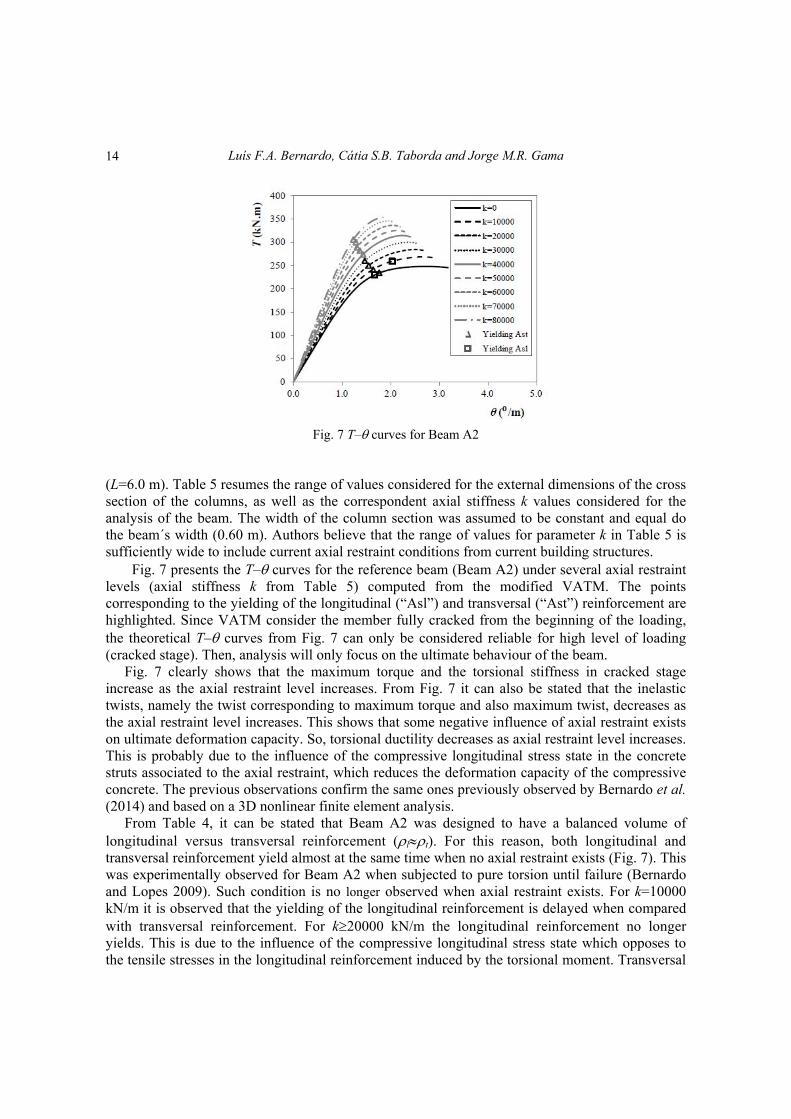
Fig. 7 T– curves for Beam A2
(L=6.0 m). Table 5 resumes the range of values considered for the external dimensions of the cross section of the columns, as well as the correspondent axial stiffness k values considered for the analysis of the beam. The width of the column section was assumed to be constant and equal do the beam´s width (0.60 m). Authors believe that the range of values for parameter k in Table 5 is sufficiently wide to include current axial restraint conditions from current building structures.
Fig. 7 presents the T– curves for the reference beam (Beam A2) under several axial restraint levels (axial stiffness k from Table 5) computed from the modified VATM. The points corresponding to the yielding of the longitudinal (“Asl”) and transversal (“Ast”) reinforcement are highlighted. Since VATM consider the member fully cracked from the beginning of the loading, the theoretical T– curves from Fig. 7 can only be considered reliable for high level of loading (cracked stage). Then, analysis will only focus on the ultimate behaviour of the beam.
Fig. 7 clearly shows that the maximum torque and the torsional stiffness in cracked stage increase as the axial restraint level increases. From Fig. 7 it can also be stated that the inelastic twists, namely the twist corresponding to maximum torque and also maximum twist, decreases as the axial restraint level increases. This shows that some negative influence of axial restraint exists on ultimate deformation capacity. So, torsional ductility decreases as axial restraint level increases. This is probably due to the influence of the compressive longitudinal stress state in the concrete struts associated to the axial restraint, which reduces the deformation capacity of the compressive concrete. The previous observations confirm the same ones previously observed by Bernardo et al. (2014) and based on a 3D nonlinear finite element analysis.
From Table 4, it can be stated that Beam A2 was designed to have a balanced volume of longitudinal versus transversal reinforcement (lt). For this reason, both longitudinal and transversal reinforcement yield almost at the same time when no axial restraint exists (Fig. 7). This was experimentally observed for Beam A2 when subjected to pure torsion until failure (Bernardo and Lopes 2009). Such condition is no longer observed when axial restraint exists. For k=10000 kN/m it is observed that the yielding of the longitudinal reinforcement is delayed when compared with transversal reinforcement. For k20000 kN/m the longitudinal reinforcement no longer yields. This is due to the influence of the compressive longitudinal stress state which opposes to the tensile stresses in the longitudinal reinforcement induced by the torsional moment. Transversal
14
Parametric analysis and torsion design charts for axially restrained RC beams
7.914.3
20.826.1
30.835.0
38.742.0
-1.2-7.1
-12.1-17.6
-21.2-24.4
-27.9-31.2
-40
-30
-20
-10
0
10
20
30
40
50
1 2 3 4 5 6 7 8
k (x103 kN/m)
Tr(%
)
Tr(%
)
2.96.5
11.016.6
20.223.3
28.0 30.3
-7.0-12.4
-17.0 -18.8-22.6
-26.0 -27.3-30.3
-40
-30
-20
-10
0
10
20
30
40
1 2 3 4 5 6 7 8
k (x103 kN/m)
Tty
(%)
T
ly(%
)(a) Resistance torque and twist (b) Yielding torque and twist
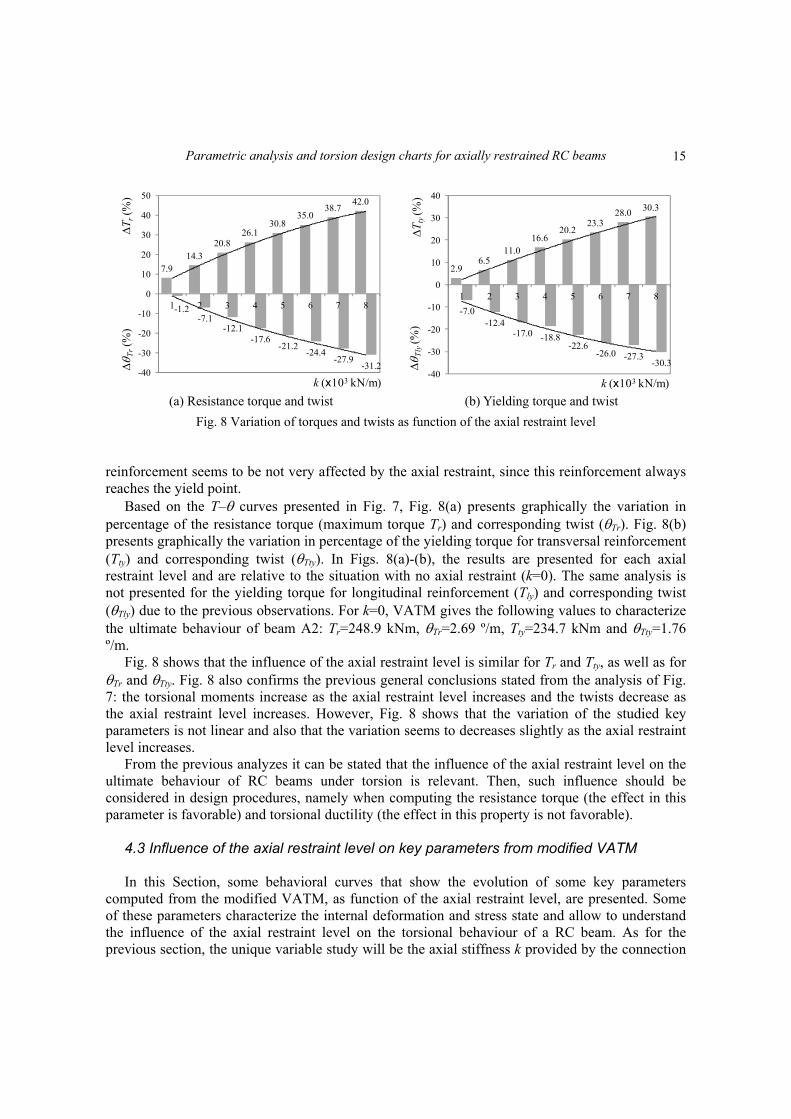
Fig. 8 Variation of torques and twists as function of the axial restraint level
reinforcement seems to be not very affected by the axial restraint, since this reinforcement always reaches the yield point.
Based on the T– curves presented in Fig. 7, Fig. 8(a) presents graphically the variation in percentage of the resistance torque (maximum torque Tr) and corresponding twist (Tr). Fig. 8(b) presents graphically the variation in percentage of the yielding torque for transversal reinforcement (Tty) and corresponding twist (Tty). In Figs. 8(a)-(b), the results are presented for each axial restraint level and are relative to the situation with no axial restraint (k=0). The same analysis is not presented for the yielding torque for longitudinal reinforcement (Tly) and corresponding twist (Tly) due to the previous observations. For k=0, VATM gives the following values to characterize the ultimate behaviour of beam A2: Tr=248.9 kNm, Tr=2.69 º/m, Tty=234.7 kNm and Tty=1.76 º/m.
Fig. 8 shows that the influence of the axial restraint level is similar for Tr and Tty, as well as for Tr and Tty. Fig. 8 also confirms the previous general conclusions stated from the analysis of Fig. 7: the torsional moments increase as the axial restraint level increases and the twists decrease as the axial restraint level increases. However, Fig. 8 shows that the variation of the studied key parameters is not linear and also that the variation seems to decreases slightly as the axial restraint level increases.
From the previous analyzes it can be stated that the influence of the axial restraint level on the ultimate behaviour of RC beams under torsion is relevant. Then, such influence should be considered in design procedures, namely when computing the resistance torque (the effect in this parameter is favorable) and torsional ductility (the effect in this property is not favorable).
4.3 Influence of the axial restraint level on key parameters from modified VATM In this Section, some behavioral curves that show the evolution of some key parameters
computed from the modified VATM, as function of the axial restraint level, are presented. Some of these parameters characterize the internal deformation and stress state and allow to understand the influence of the axial restraint level on the torsional behaviour of a RC beam. As for the previous section, the unique variable study will be the axial stiffness k provided by the connection
15
Luís F.A. Bernardo, Cátia S.B. Taborda and Jorge M.R. Gama
(a) td–ds,ef curves (b) –ds,ef curves
(c) –ds,ef curves
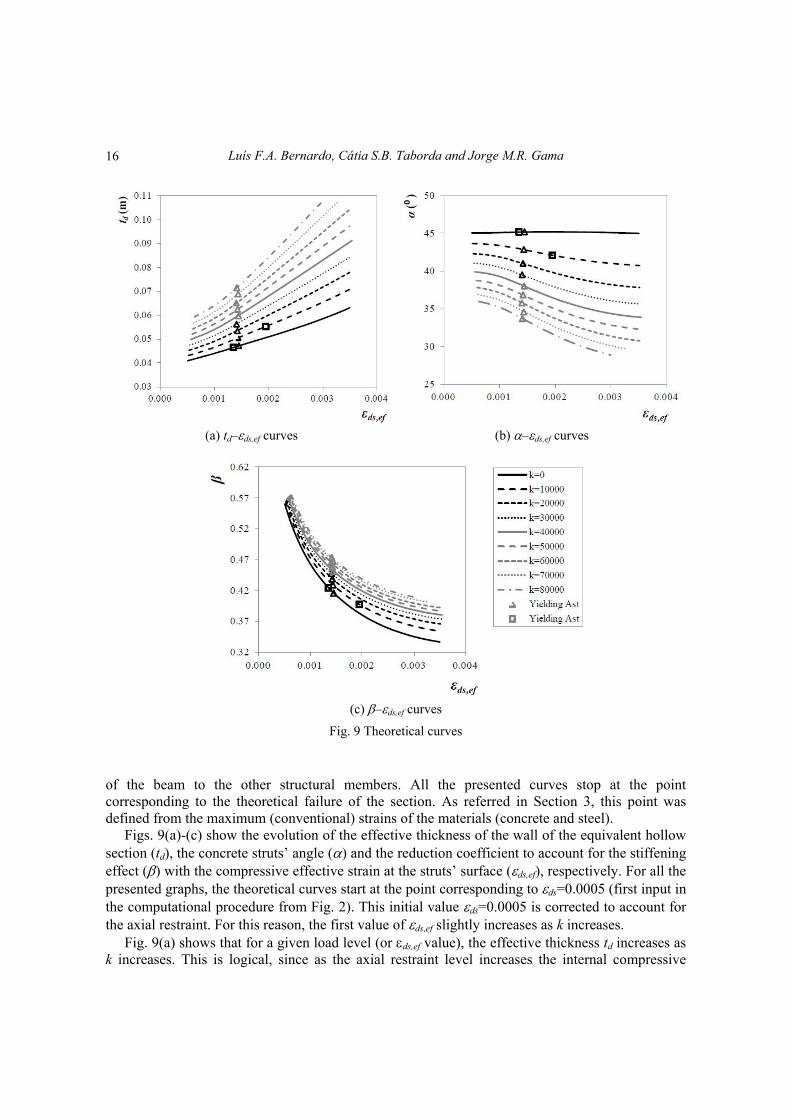
Fig. 9 Theoretical curves
of the beam to the other structural members. All the presented curves stop at the point corresponding to the theoretical failure of the section. As referred in Section 3, this point was defined from the maximum (conventional) strains of the materials (concrete and steel).
Figs. 9(a)-(c) show the evolution of the effective thickness of the wall of the equivalent hollow section (td), the concrete struts’ angle () and the reduction coefficient to account for the stiffening effect () with the compressive effective strain at the struts’ surface (ds,ef), respectively. For all the presented graphs, the theoretical curves start at the point corresponding to ds=0.0005 (first input in the computational procedure from Fig. 2). This initial value ds=0.0005 is corrected to account for the axial restraint. For this reason, the first value of ds,ef slightly increases as k increases.
Fig. 9(a) shows that for a given load level (or ds,ef value), the effective thickness td increases as k increases. This is logical, since as the axial restraint level increases the internal compressive
16
Parametric analysis and torsion design charts for axially restrained RC beams
(a) ds,ef– curves (b) l– curves
(c) t–curves
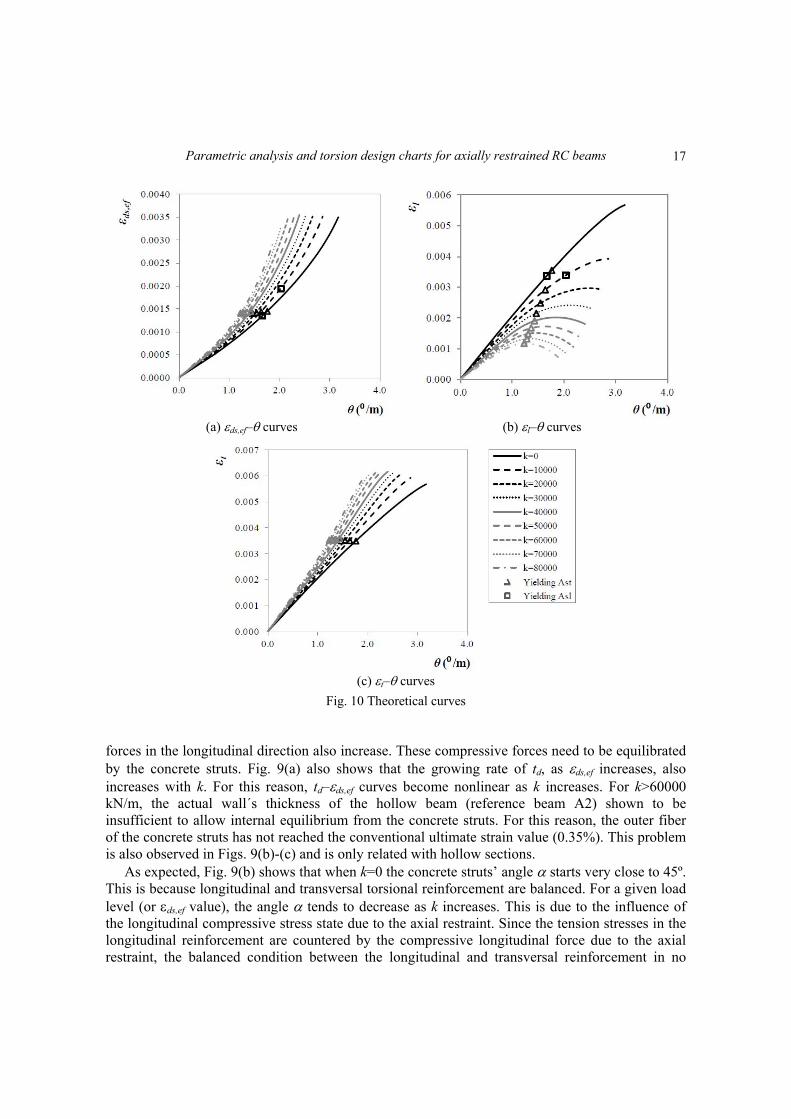
Fig. 10 Theoretical curves
forces in the longitudinal direction also increase. These compressive forces need to be equilibrated by the concrete struts. Fig. 9(a) also shows that the growing rate of td, as ds,ef increases, also increases with k. For this reason, td–ds,ef curves become nonlinear as k increases. For k>60000 kN/m, the actual wall´s thickness of the hollow beam (reference beam A2) shown to be insufficient to allow internal equilibrium from the concrete struts. For this reason, the outer fiber of the concrete struts has not reached the conventional ultimate strain value (0.35%). This problem is also observed in Figs. 9(b)-(c) and is only related with hollow sections.
As expected, Fig. 9(b) shows that when k=0 the concrete struts’ angle starts very close to 45º. This is because longitudinal and transversal torsional reinforcement are balanced. For a given load level (or ds,ef value), the angle tends to decrease as k increases. This is due to the influence of the longitudinal compressive stress state due to the axial restraint. Since the tension stresses in the longitudinal reinforcement are countered by the compressive longitudinal force due to the axial restraint, the balanced condition between the longitudinal and transversal reinforcement in no
17
Luís F.A. Bernardo, Cátia S.B. Taborda and Jorge M.R. Gama
longer valid. The previous observation agrees with similar tendencies, which were observed in longitudinally prestressed beams under torsion (Bernardo 2003). These beams carried an initial compressive stress due to the prestressing. In fact, for prestressed beams and for torsional design, ACI code imposes a concrete struts’ angle lesser than 45º. Fig. 9(b) also shows that for k>0 the concrete struts’ angle still continue to decrease as the load increases (or as ds,ef increases). This is because the longitudinal compressive stress due to the axial restraint increases as the load increases. From Fig. 9(b), it can be stated that higher the load (or ds,ef) and higher the axial restraint level (k), lesser the concrete struts’ angle.
Finally, Fig. 9(c) shows that for a given load level (or ds,ef value), the reduction coefficient slightly decreases as k increases. This seems to show that the effect of the softening effect in the concrete struts is slightly lesser as the axial restraint level (or the corresponding longitudinal compressive force) increases.
Figs. 10(a)-(c) show the evolution of the compressive effective strain at the struts’ surface (ds,ef), the tensile strain in the longitudinal reinforcement (l) and the tensile strain in the transversal reinforcement (t) with the twist (), respectively. For all the presented graphs, the theoretical curves start at the point corresponding to ds=0 since the deformation is null for no loading condition.
Fig. 10(a) shows that the deformation of the struts reaches more quickly its ultimate value as the axial restraint level increases. This is because the longitudinal compressive stresses increase as the axial restraint level increases. Fig. 10(a) also confirms that, as previously referred in Section 4.2, torsional stiffness increases as the axial restraint level increases.
For k=0, Figs. 10(b)-(c) show that the strains on the steel reinforcement, both longitudinal and transversal, vary almost linearly with twist. Moreover, the contribution of each reinforcement type is very similar. This is because longitudinal and transversal reinforcement are balanced. As previously referred, this balanced condition is no longer valid when k>0. For this situation, while transversal reinforcement behaves similarly as for k=0, longitudinal reinforcement behaves very differently. For a given twist level, Figs. 10(b)-(c) show that, as k increases, the strain in transversal reinforcement increases and the strain in the longitudinal reinforcement decreases.
Finally, Fig. 10 generally shows that the internal forces in the truss model change and transversal reinforcement and concrete struts are more stressed. This is due to the longitudinal compressive stresses induced by the axial restraint.
4.4 Influence of the variables study on the resistance torque In this Section, the influence of some variables study on the resistance torque of axially
restrained RC beams is analyzed, namely: total torsional reinforcement ratio (totl+t), compressive concrete strength (fc) and axial restraint level (k). Among all the ultimate key parameters from T– curves previously analyzed (resistance torque, yielding torques and corresponding twists), only resistance torque will be studied here. This is because, as previously referred, torsional design procedures in actual codes of practice are mainly focused to compute this parameter. Again, Beam A2 will be used as reference RC beam for this section and resistance torque will be calculated from modified VATM.
For the purpose of this section, a wide range of values for tot, fc and k where considered, namely:
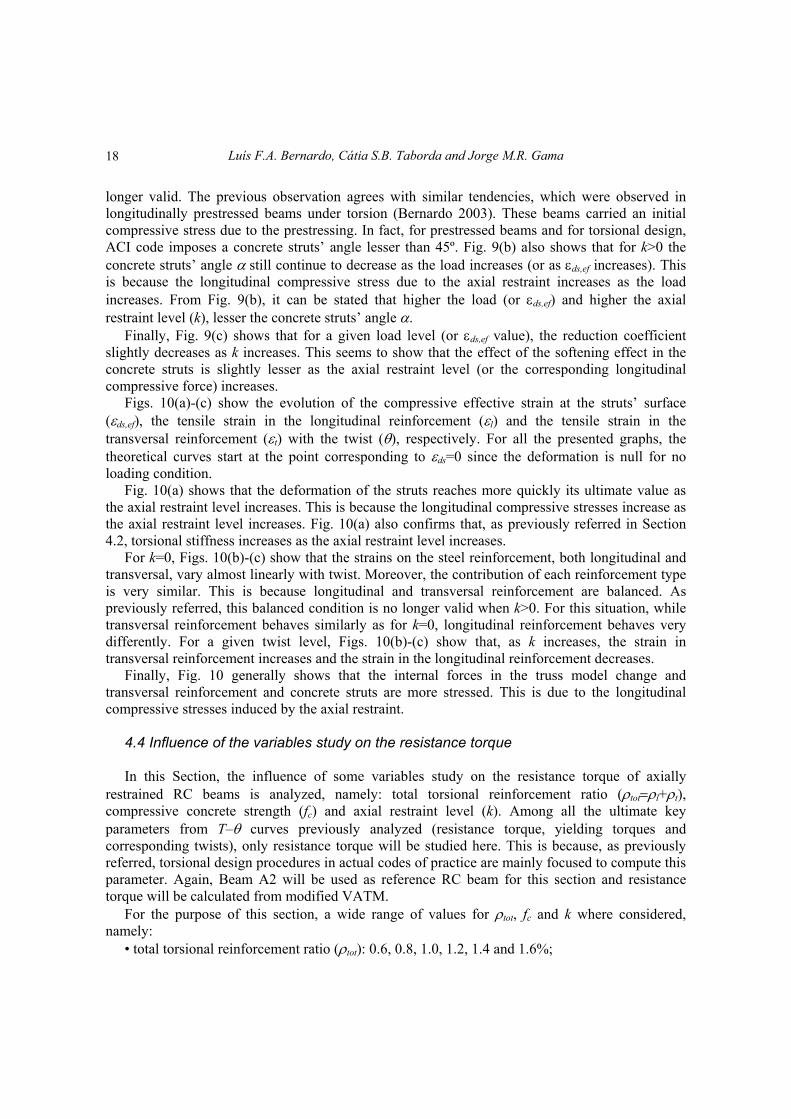
• total torsional reinforcement ratio (tot): 0.6, 0.8, 1.0, 1.2, 1.4 and 1.6%;
18
Parametric analysis and torsion design charts for axially restrained RC beams
• compressive concrete strength (fc): 30, 50, 70 and 90 MPa; • axial restraint level (k): 0, 10000, 20000, 30000, 40000, 50000, 60000, 70000 and 80000
kN/m. For the axial stiffness (k) the same range of values defined in Section 4.2 was used. For the
compressive concrete strength (fc) a wide range of values was chosen in order to include both normal-strength and high-strength concrete. For the total torsional reinforcement ratio (tot), a wide range of values was chosen in order to include different failure modes observed in experimental studies of RC beams under torsion. From such studies (for instance, Bernardo and Lopes 2009), the following range of values for tot can be related with a specific torsional failure mode (for any compressive concrete strength range):
• tot 0.6 to 0.8%: ductile failure (yielding of torsional reinforcement); • tot 1.0 to 1.2%: brittle failure (breaking off of concrete corners); • tot 1.4 to 1.6%: brittle failure (crushing of concrete in struts). Each k value was combined with all possible combinations of tot and fc values. Then, 192
combinations were considered and calculated with the modified VATM calculus procedure. Figs. 11(a)-(f) show the influence of the compressive concrete strength (fc) and axial restraint
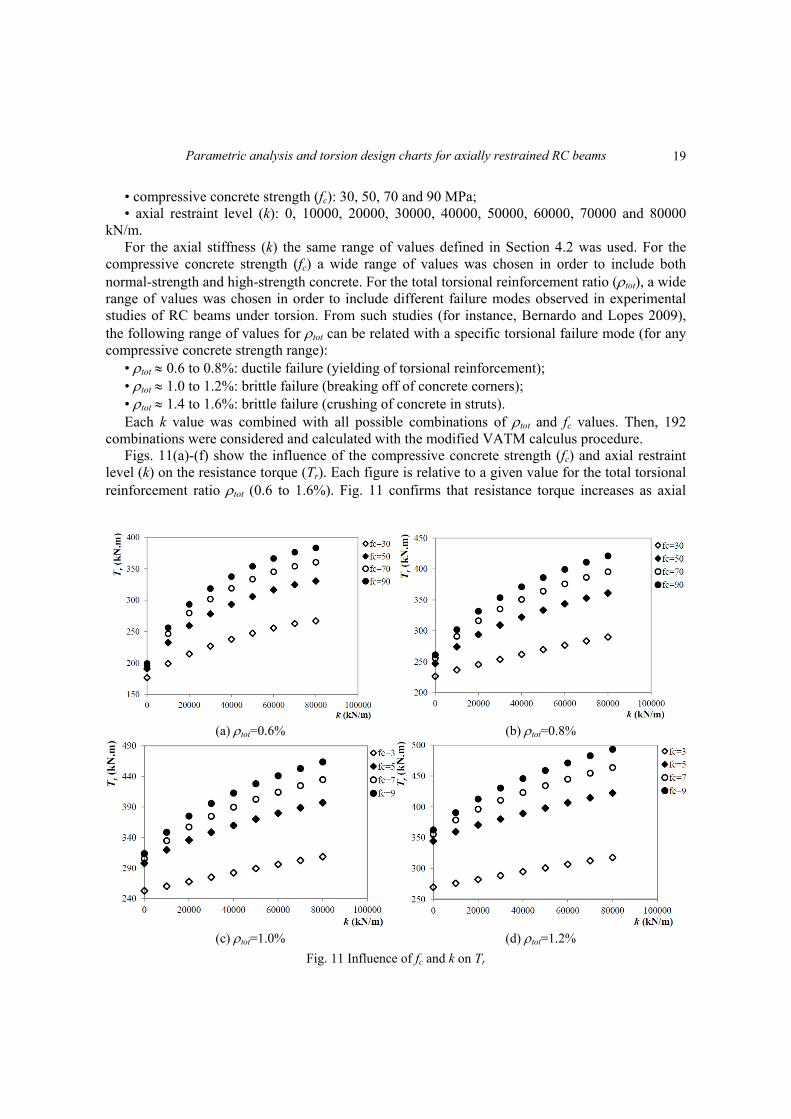
level (k) on the resistance torque (Tr). Each figure is relative to a given value for the total torsional reinforcement ratio tot (0.6 to 1.6%). Fig. 11 confirms that resistance torque increases as axial
(a) tot=0.6% (b) tot=0.8%
(c) tot=1.0% (d) tot=1.2%
Fig. 11 Influence of fc and k on Tr
19
Luís F.A. Bernardo, Cátia S.B. Taborda and Jorge M.R. Gama
(e) tot=1.4% (f) tot=1.6%
Fig. 11 Continued
0
10
20
30
40
50
60
1 2 3 4 5 6 7 8
T r
(%)
ρtot=1,0; fc=30ρtot=1,0; fc=50
ρtot=1,0; fc=70ρtot=1,0; fc=90
k (x103 kN/m)
Fig. 12 Variation of resistance torque as function of the axial restraint level
restraint level increases, although the growing rate of the resistance torque is higher for lower axial restraint levels. Another conclusion from Fig. 11 is that the favorable effect of the axial restraint seems to be higher for higher compressive concrete strengths. This is true for any level of the total torsional reinforcement ratio. The previous observation can be verified in Fig. 12 which represents, as an example, the variation in percentage of the resistance torque for tot=1.0%. From Fig. 12 it can be observed that, for instance, for k=80000 kN/m and for fc=30 MPa the resistance torque increases approximately 20%. For k=80000 kN/m and for fc=90 MPa the increase of the resistance torque is now approximately 50%.
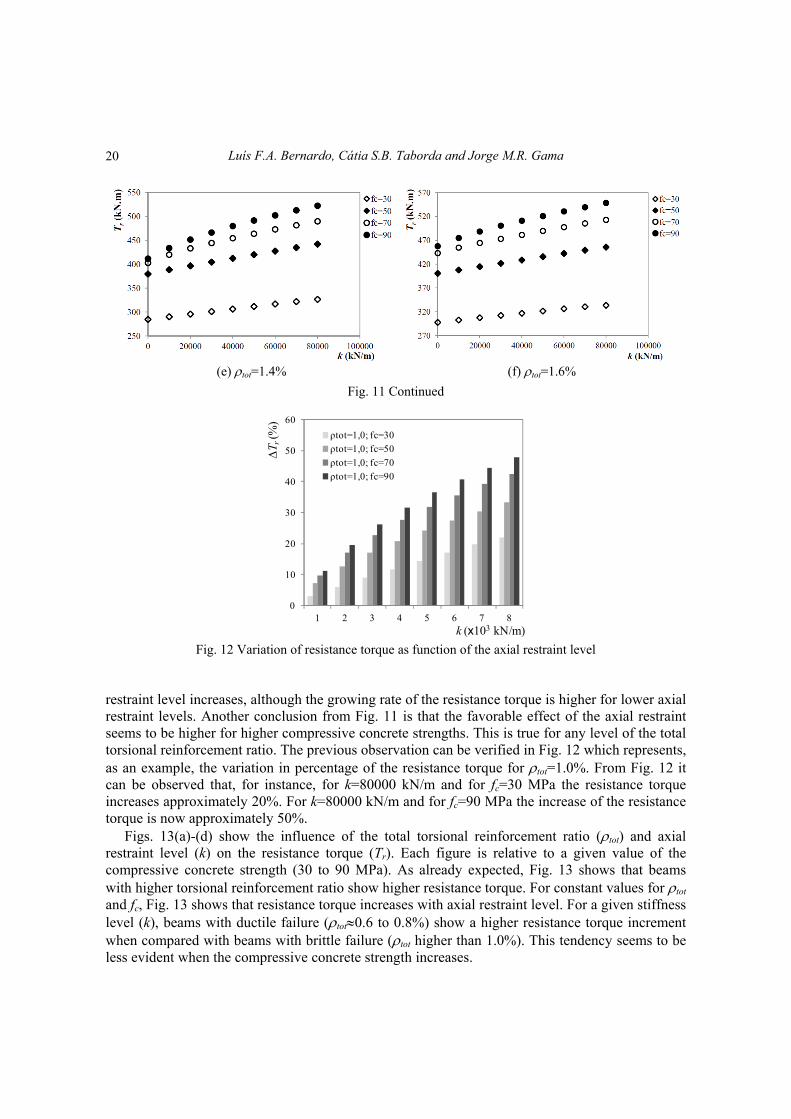
Figs. 13(a)-(d) show the influence of the total torsional reinforcement ratio (tot) and axial restraint level (k) on the resistance torque (Tr). Each figure is relative to a given value of the compressive concrete strength (30 to 90 MPa). As already expected, Fig. 13 shows that beams with higher torsional reinforcement ratio show higher resistance torque. For constant values for tot and fc, Fig. 13 shows that resistance torque increases with axial restraint level. For a given stiffness level (k), beams with ductile failure (tot0.6 to 0.8%) show a higher resistance torque increment when compared with beams with brittle failure (tot higher than 1.0%). This tendency seems to be less evident when the compressive concrete strength increases.
20
Parametric analysis and torsion design charts for axially restrained RC beams
(a) fc=30 MPa (b) fc=50 MPa
(c) fc=70 MPa (d) fc=90 MPa
Fig. 13 Influence of tot and k on Tr Also from Fig. 13, if ductile beams (for instance, tot=0.6) and failure beams (for instance,
tot=1.6) are compared, the increment of the resistance torque is higher for ductile beams and for lower axial restraint levels. This is because, for brittle beams and k=0, the failure is due to the crashing of the concrete struts. Then, axial restraint is not very effective to increase the resistance torque because the maximum resistance of the concrete was already reached. For ductile beams, since the failure is due to the yielding of the reinforcement, the longitudinal compressive stresses due to the axial restraint allow the beam to reach higher torsional resistance. This is because the yielding of the longitudinal reinforcement is delayed and concrete struts can reach higher compressive stresses.
4.5 Torsion design charts From the parametric study presented in the previous sections, it can be state that the axial
restraint has a favorable influence on the resistance torque. This section aims to perform some
21
Luís F.A. Bernardo, Cátia S.B. Taborda and Jorge M.R. Gama
regression analyses in order to propose some design charts to help for the torsional design of axially restrained RC beams (rectangular sections with small height to width ratios). The objective is to correct the resistance torque computed for beams without axial restraint (for instance by using code’s rules). As previously referred (Section 2), torsional design procedures in actual codes of practice are mainly focused to compute the resistance torque. Then, the proposed design charts will only cover this parameter.
A correction parameter, Car, is defined in this study to compute the effective resistance torque (to account for the axial restraint). Since the resistance torque is higher due to the axial restraint, then Car≥1. From the previous sections, the correction parameter Car can be computed as follow
, /ar r ef rC T T (23)
Where: Tr,ef = effective resistance torque computed from modified VATM with the influence of axial
restraint (k 0); Tr = resistance torque computed from VATM with no influence of axial restraint (k = 0). A general equation for parameter Car will be defined from nonlinear regression analysis
between the variable studies analyzed in the previous section, namely: total torsional reinforcement ratio (tot), compressive concrete strength (fc) and axial restraint level (k). In fact, a new variable is also introduced in this section, namely the length of the beam (l). This is because, in the modified VATM, the elongation (l) of the beam depends on the beam´s length in order to compute the compressive longitudinal force due to the axial restraint (Fc) (see Eqs. (1)-(2) from Table 1). The results of the parametric analysis presented in Sections 4.3 and 4.4 are only valid for reference beam A2 which length is 5.9 m (Fig. 6). Then, to generalize the equation for parameter Car, the beam´s length l must be also considered as a variable.
Initially, all the 4 variables (tot, fc, k and l) were simultaneously introduced to perform the regression analysis in order to found a general equation for parameter Car. However, the high number of combinations to be considered led the authors to adopt a different strategy. In a first stage, the 3 variables study previously analyzed in Sections 4.3 and 4.4 were correlated and a general equation for parameter Car was found. In this stage, only a section analysis of the beam is performed. In a second stage, an additional regression analysis is performed in order to introduce the new variable l and a correction equation is found to compute the final value for Car parameter. In this stage, a global analysis of the beam is performed since the beam´s length l is also considered.
Due to the tendencies observed for the points in graphs from Figs. 11 and 13, the initial analysis (first stage) with variables tot, fc, and k led to nonlinear regression analysis. To perform this analysis, the statistical software “R” with “stats” package was used. Although the problem under study is deterministic, the high level of data do be processed led the authors to treat the problem as a statistical one in order to facilitate the data process. The several values considered for tot, fc and k, and for Car computed from Eq. (23), were inserted into a data frame and a script was created for “R” in order to perform a nonlinear and multivariable regression analysis (Venable et al. 2012). Parameter Car was considered as the dependent variable and tot, fc and k parameters were considered as the independent variables. Based on the method of least squares, a polynomial surface of degree 13 was found to compute Car. The coefficient of determination of this polynomial is approximately equal to unity. This means that almost 100% of the variability of the dependent variable is explained by the created model with the independent variables tot, fc, and k.
22
Parametric analysis and torsion design charts for axially restrained RC beams
(a) fc=30 MPa (b) fc=50 MPa
(c) fc=70 MPa (d) fc=90 MPa
Fig. 14 Charts to compute the correction coefficient Car
The maximum absolute residue (difference between the sample values for Car and the corresponding values predicted by fitted polynomial) was found to be very low (0.000488). It should be noted that this accuracy can only be considered valid for the range of values and combinations considered for the variable studies. Thus, it can be state that the polynomial surface is quite accurate. For other values or other combinations, it is expected that the accuracy is still very good.
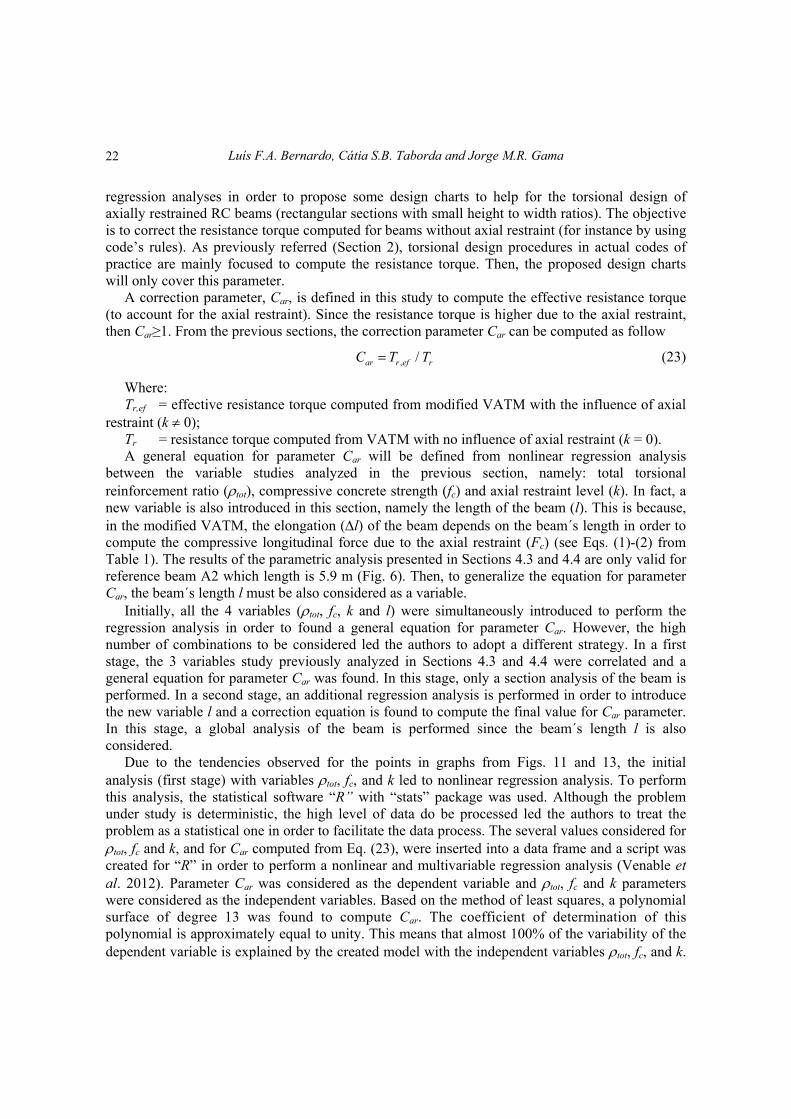
Since the polynomial found for Car has 171 monomials, it is not transcribed in this article. From this polynomial some charts were drawn in order to compute Car from tot, fc, and k values. Such
23
Luís F.A. Bernardo, Cátia S.B. Taborda and Jorge M.R. Gama
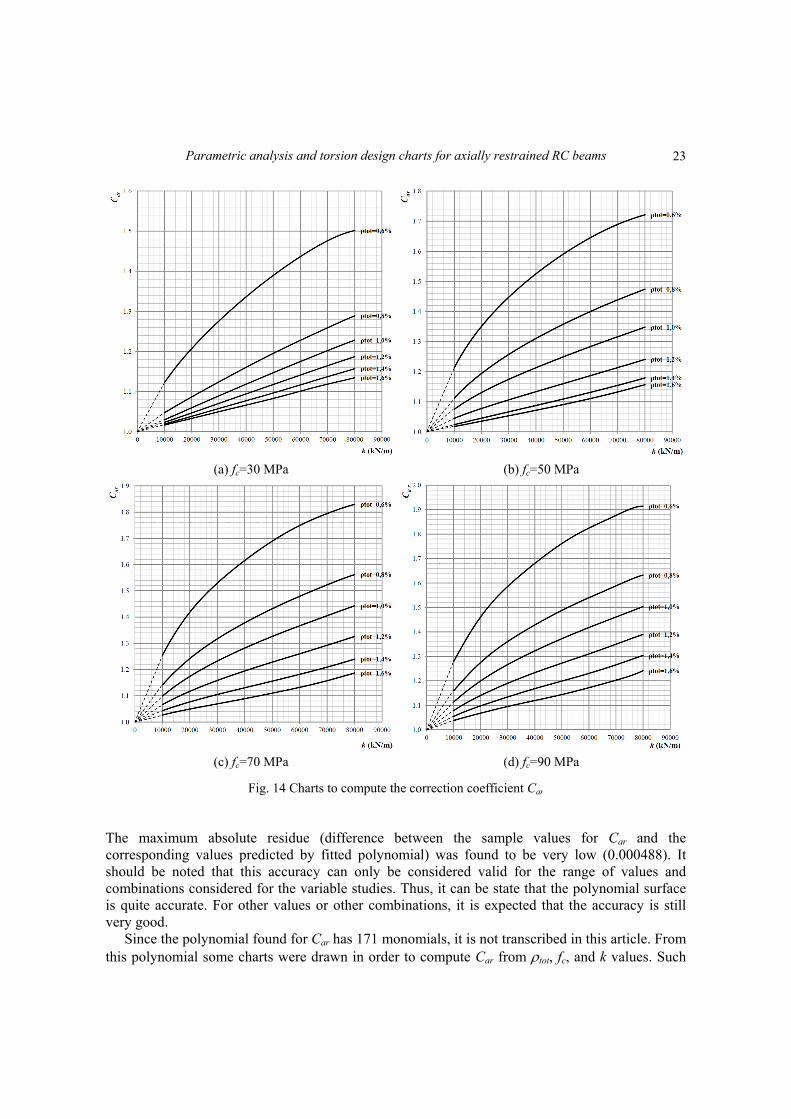
Fig. 15 Chart to compute the final correction coefficient Car,f
charts are presented in Figs. 14(a)-(d). The charts from Fig. 14 were organized in function of the compressive concrete strength. For
this reason each graph of Figs. 14(a)-(d) is relative to a compressive concrete strength level (fc=30 to 90 MPa). From Figs. 14(a)-(d), the correction coefficient Car can easily be estimated graphically (from output data in the ordinates axis of the graphs). For this, the graph must be previously chosen (as function of fc) and the values for k (input data in the abscissa axis) and tot (to choose the curve) must be known. Values of Car for intermediate values for fc, k and tot can be estimated from linear interpolation. For k<10000 kN/m, the estimation of Car can be obtained by extending and adjusting the curves so that they cross the origin of the coordinate axis (see Fig. 14).
In order to incorporate the influence of the beam´s length (l), correction polynomials were found for Car and for the following range of length values: 2, 4, 6, 8 and 10 m. These correction polynomials will allow to compute the final correction coefficient (Car,f) to account for the beam´s length. The considered range of values for l is sufficiently wide to include common lengths used for RC beams in building´s structures. To found the correction polynomial, software IBM SPSS Statistics was used (the same results were obtained with statistical software “R”). For each beam´s length value, 129 combinations with tot, fc, and k values were considered. From a quadratic nonlinear regression analysis, a correction polynomial was found for each beam´s length value. The determination coefficients for the correction polynomial were found to be very good (R20.99). From the correction polynomial, a new chart was drawn to compute the final correction coefficient Car,f (output data in the ordinates axis) from Car (input data in the abscissa axis) and l (to choose the curve), see Fig. 15.
From the final correction coefficient Car,f, the effective resistance torque is computed from the following equation
24
Parametric analysis and torsion design charts for axially restrained RC beams
, ,r ef ar f rT C T (24)
The following steps should be followed to compute the effective resistance torque of an axially restrained RC beam under torsion (rectangular sections with small height to width ratios):
1. Compute the resistance torque (Tr) of the RC beam without axial restraint (for instance, from code’s rules);
2. From fc, k and tot values and from charts in Fig. 14, compute the correction coefficient Car; 3. From Car and l values and from chart in Fig. 15 compute the final correction coefficient Car,f; 4. From Eq. (24) compute the effective resistance torque (Tr,ef) of the axially restrained RC
beam. 5. Conclusions
In this article, theoretical parametric analyzes were performed in order to check the influence of the axial restraint level in RC beams under torsion. To perform these analyzes, a computing procedure previously presented by the authors and based on the modified VATM calculus procedure was used. Such calculus procedure was summarized in this article. Some variable studies were considered to perform the parametric analyzes, namely: the torsional reinforcement ratio, the compressive concrete strength and the axial restraint level. The parametric analyzes were focused on some key parameters and also on the ultimate behaviour, namely the resistance torque, of axially restrained RC beams under torsion. From this parametric study, nonlinear correlations analyzes were performed. Some design charts were also proposed to compute the effective resistance torque of RC beams (rectangular sections with small height to width ratios) in order to account for the favorable influence of the axial restraint.
From this study, the following main conclusions can be drawn: • The influence of the axial restraint level on the ultimate behaviour of RC beams under torsion
is relevant. • For constant values for the torsional reinforcement ratio and compressive concrete strength,
the resistance torque and the torsional stiffness in cracked stage increase as the axial restraint level increases. This is true for any level of the total torsional reinforcement ratio. The increase of the resistance torque is higher for ductile beams and for lower axial restraint levels. This tendency seems to be less clear when the compressive concrete strength increases.
• The twist corresponding to the resistance torque, as well as the maximum twist, decreases as the axial restraint level increases. So, torsional ductility decreases as axial restraint level increases. The variation of the previous key parameters, as function of the axial restraint level, is not linear and seems to decrease slightly as the axial restraint level increases.
• In RC beams under torsion designed with balanced reinforcements, longitudinal and transversal reinforcement did not yield at the same time when axial restraint exists. The yielding of the longitudinal reinforcement is delayed (or not exist at all for high axial restraint levels) when compared with transversal reinforcement.
• For a given load level, the effective thickness of the struts increases as the axial restraint level increases. The growing rate of the effective thickness of the struts also increases as the axial restraint level increases.
• For a given load level, the concrete struts’ angle (close to 45º when k = 0 if the longitudinal and transversal reinforcements are balanced) decreases as the axial restraint level increases. When
25
Luís F.A. Bernardo, Cátia S.B. Taborda and Jorge M.R. Gama
axial restraint exists, the concrete struts’ angle still continue to decrease as the load increases. Higher the load and higher the axial restraint level, lesser the concrete struts’ angle.
• For a given load level, the reduction coefficient to account for the softening effect in the compressive concrete struts slightly decreases as the axial restraint level increases. The effect of the softening effect in the concrete struts is slightly lesser as the axial restraint level increases.
• The deformation of the struts reaches more quickly its ultimate value as the axial restraint level increases.
• When axial restraint exists, the contributions of transversal and longitudinal reinforcement change in the truss model, even if both reinforcements type are balanced. For a given twist level, as the axial restraint level increases, the strain in the transversal reinforcement increases and the strain in the longitudinal reinforcement decreases.
From the theoretical parametric analyzes and from the nonlinear correlations performed, some design charts were proposed to compute the effective resistance torque of axially restrained RC beams with current sections (rectangular sections with small height to width ratios). Such charts allow to account for the favorable influence of the axial restraint in the resistance torque.
It should be noted that the main results and design charts presented in this study were obtained based on the study of reference beam A2 (with RC hollow square section).
For plain sections, it is known that the concrete core has a negligible influence in the ultimate torsional behaviour of RC beams (Hsu 1968). It is also known that VATM gives good previsions regardless of the section type (plain or hollow) (Hsu and Mo 1985, Bernardo and Lopes 2009, Bernardo et al. 2012). So, the results of this study can also be extended to square plain sections.
For rectangular sections, the height to width ratio, if not very far from unity, has no notable influence as variable study (Hsu 1968). Usually, high torsional moments lead to sections with small height to width ratio. So, the results of this study can also be extended to rectangular sections (both plain and hollow) with small height to width ratios.
However, for sections with aspect ratio very far from unity, as well as for beams with very large sections and very large spans (for instance, bridge decks), including prestressed beams, new and specific studies are needed in order to extend the results presented in this article. For instance, in such cases aspect ratio and scale effect should also be considered as direct variables study. References Andrade, A.M., Bernardo, L.F.A. and Lopes, S.M.R. (2011), “TORQUE_MTEAV: Computing tool to
evaluate the ultimate behaviour of reinforced and prestressed concrete beams in torsion”, Proceedings of the International Conference on Recent Advances in Nonlinear Models - Structural Concrete Aplications (CoRAN 2011), Coimbra, Portugal, November.
Bernardo, L.F.A. (2003), “Torsion in reinforced high-strength concrete hollow beams”, Ph.D. Thesis, University of Coimbra. Portugal. (in Portuguese)
Bernardo, L.F.A. and Lopes, S.M.R. (2008), “Behaviour of concrete beams under torsion - NSC plain and hollow beams”, Mater. Struct., 41(6), 1143-1167.
Bernardo, L.F.A. and Lopes, S.M.R. (2009), “Torsion in HSC hollow beams: strength and ductility analysis”, ACI Struct. J., 106(1), 39-48.
Bernardo, L.F.A. and Lopes, S.M.R. (2011), “Theoretical behaviour of HSC sections under torsion”, Eng. Struct., 33(12), 3702-3714.
Bernardo, L.F.A., Andrade, J.M.A. and Lopes, S.M.R. (2012), “Softened truss model for reinforced NSC and HSC beams under torsion: a comparative study”, Eng. Struct., 42, 278-296.
26
Parametric analysis and torsion design charts for axially restrained RC beams
Bernardo, L.F.A., Taborda, C.S.B. and Andrade, J.M.A. (2014), “Ultimate torsional behaviour of axially restrained RC beams”, Comput. Concrete. (in review)
Belarbi, A. and Hsu, T.C. (1991) “Constitutive laws of softened concrete in biaxial tension-compression”, Research Report UHCEE 91-2, Univ. of Houston, Houston, Texas.
Belarbi, A. and Hsu T.C. (1994) “Constitutive laws of concrete in tension and reinforcing bars stiffened by concrete”, Struct. J. Am. Concrete Inst., 91(4), 465-474.
Belarbi, A., Prakashm S. and You, Y.M. (2009), “Effect of spiral reinforcement on flexural-shear-torsional seismic behavior of reinforced concrete circular bridge columns”, Struct. Eng. Mech., 33(2), 137-158.
Cevik, A., Arslan, M.H. and Saracoglu, R. (2012), “Neuro-fuzzy modeling of resistance torque of RC beams”, Comput. Concrete, 9(6), 469-486.
Comité Euro-International du Béton (CEB) (1990), CEB-FIP MODEL CODE 1990. Hsu, T.T.C. (1968), “Torsion of structural concrete - behaviour of reinforced concrete rectangular
members”, Torsion of Structural Concrete, ACI SP-18:261-306. Hsu, T.T.C. (1984), Torsion of Reinforced Concrete, Van Nostrand Reinhold Company. Hsu, T.T.C. and Mo, Y.L. (1985), “Softening of concrete in torsional members - theory and tests”, ACI J.
Proc., 82(3), 290-303. IBM SPSS Statistics 19 Core System, User´s Guide. Jeng, C.H. and Hsu, T.T.C. (2009), “A softened membrane model for torsion in reinforced concrete
members”, Eng. Struct., 31(9), 1944-54. Leu, L.J. and Lee, Y.S. (2000), “Torsion design charts for reinforced concrete rectangular members”, J.
Struct. Eng., 210-218. NP EN 1992-1-1 (2010), Eurocode 2: Design of Concrete Structures - Part 1: General Rules and Rules for
Buildings. Taborda, C.S.B. (2012), “The effect of axial restraint on the behaviour of RC beams under torsion”, Master
Thesis, University of Beira Interior, Portugal. (in Portuguese) Valipour, H.R. and Foster, S.J. (2010), “Nonlinear analysis of 3D reinforced concrete frames: effect of
section torsion on the global response”, Struct. Eng. Mech., 36(4), 421-445. Venable, W.N., Smith, D.M. and Team, R.C. (2012), An Introduction to R., Version 2.15.1. Zhang, L.X. and Hsu, T.T.C. (1998), “Behaviour and analysis of 100 MPa concrete membrane elements”, J.
Struct. Eng., ASCE, 124(1), 24-34.
CC
27