parish of east baton rouge louisiana brec strategic …
TRANSCRIPT
PARISH OF EAST BATON ROUGE, LOUISIANA – BREC STRATEGIC PLAN Chapter 2 – Demographic Report
2-1
CHAPTER 2 - DEMOGRAPHIC REPORT INTRODUCTION The US Census Bureau's 2000 census brief stated that the Nation's 1990 to 2000 population increase of 32.7 million was the largest in American history. The previous record increase was 28.0 million people between 1950 and 1960, a gain fueled primarily by the post-World War II baby boom (1946 to 1964). Total decennial population growth declined steadily in the three decades following the 1950s peak before rising again in the 1990s. Population growth varied significantly by region in the 1990s, with higher rates in the West (19.7%) and the South (17.3%) and much lower rates in the Midwest (7.9 %) and the Northeast (5.5%).
The East Baton Rouge Parish is the third most populated Parish in Louisiana, after Orleans Parish (484,647) and Jefferson Parish (455,466). However, in the 1990s it was also one of the fastest growing Parishes in the State of Louisiana; the Parish added about 38,000 people, second only to St. Tammany Parish which added 46,760 people. Among the two largest Parishes in the State, Jefferson Parish added about 7,000 people while Orleans Parish actually lost population in the 1990s.
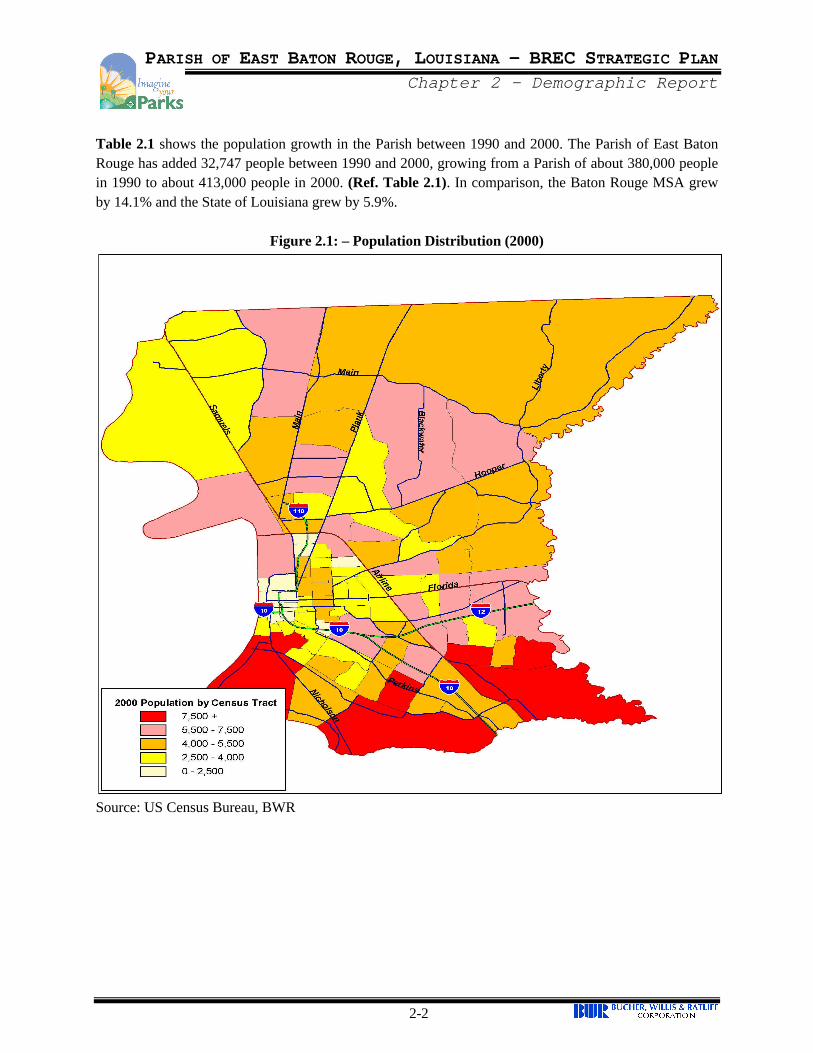
POPULATION According to the 2000 Census, the Parish of East Baton Rouge had a population of 412,852 an increase from the 1990 population by 32,747 people (8.6%). City of Baton Rouge’s population totaled 227,818, up from 219,531 in 1990 - a 3.8% increase. The Baton Rouge Metropolitan Statistical Area (MSA) saw a 14.1% increase in its population and the state of Louisiana saw an increase in its population by about 5.9%. Figure 2.1 shows the spatial distribution of the Population for the Parish with southern census tracts of the Parish having larger populations. Inner city has smaller populations though at higher densities. The northwest quadrant of the Parish began experiencing growth in the late 90’s that was not reflected in the 2000 Census, After 2000, the rate of growth increased and this is now a rapidly growing area of the Parish.
PARISH OF EAST BATON ROUGE, LOUISIANA – BREC STRATEGIC PLAN Chapter 2 – Demographic Report
2-2
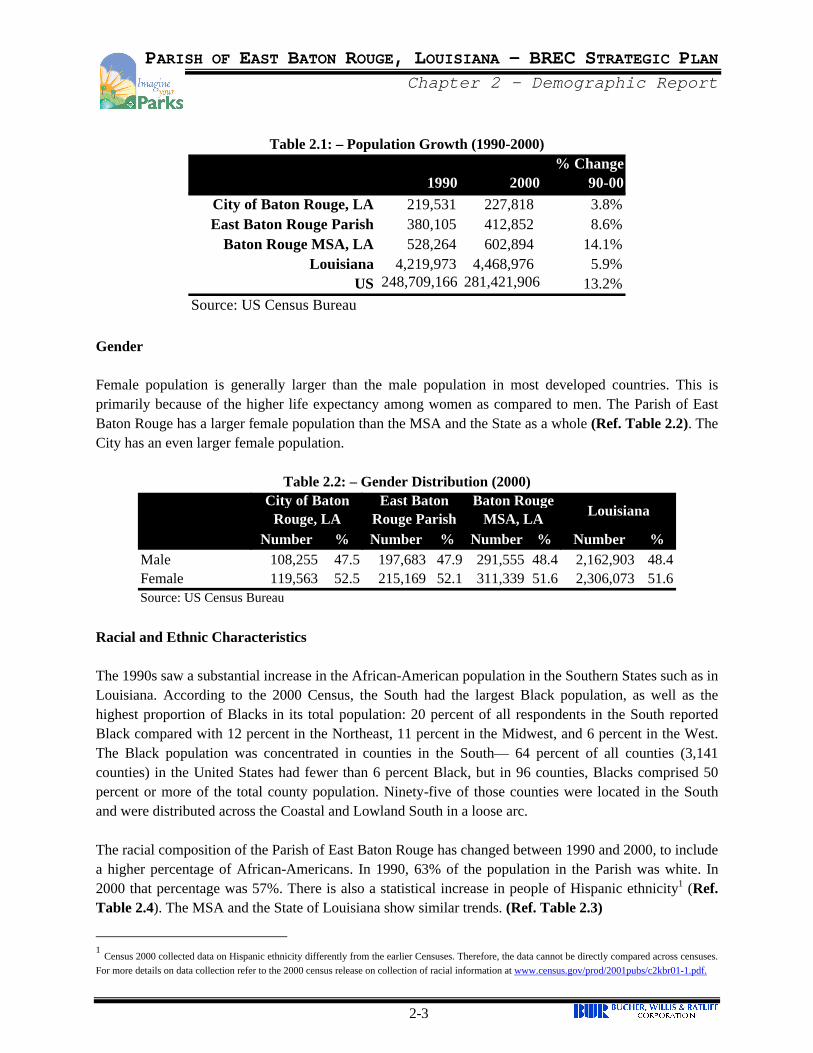
Table 2.1 shows the population growth in the Parish between 1990 and 2000. The Parish of East Baton Rouge has added 32,747 people between 1990 and 2000, growing from a Parish of about 380,000 people in 1990 to about 413,000 people in 2000. (Ref. Table 2.1). In comparison, the Baton Rouge MSA grew by 14.1% and the State of Louisiana grew by 5.9%.
Figure 2.1: – Population Distribution (2000)
Source: US Census Bureau, BWR
PARISH OF EAST BATON ROUGE, LOUISIANA – BREC STRATEGIC PLAN Chapter 2 – Demographic Report
2-3
Table 2.1: – Population Growth (1990-2000)
1990 2000% Change
90-00City of Baton Rouge, LA 219,531 227,818 3.8%East Baton Rouge Parish 380,105 412,852 8.6%
Baton Rouge MSA, LA 528,264 602,894 14.1%Louisiana 4,219,973 4,468,976 5.9%
US 248,709,166 281,421,906 13.2%Source: US Census Bureau
Gender Female population is generally larger than the male population in most developed countries. This is primarily because of the higher life expectancy among women as compared to men. The Parish of East Baton Rouge has a larger female population than the MSA and the State as a whole (Ref. Table 2.2). The City has an even larger female population.
Table 2.2: – Gender Distribution (2000)
Number % Number % Number % Number %Male 108,255 47.5 197,683 47.9 291,555 48.4 2,162,903 48.4Female 119,563 52.5 215,169 52.1 311,339 51.6 2,306,073 51.6Source: US Census Bureau
City of Baton Rouge, LA
East Baton Rouge Parish
Baton Rouge MSA, LA Louisiana
Racial and Ethnic Characteristics The 1990s saw a substantial increase in the African-American population in the Southern States such as in Louisiana. According to the 2000 Census, the South had the largest Black population, as well as the highest proportion of Blacks in its total population: 20 percent of all respondents in the South reported Black compared with 12 percent in the Northeast, 11 percent in the Midwest, and 6 percent in the West. The Black population was concentrated in counties in the South— 64 percent of all counties (3,141 counties) in the United States had fewer than 6 percent Black, but in 96 counties, Blacks comprised 50 percent or more of the total county population. Ninety-five of those counties were located in the South and were distributed across the Coastal and Lowland South in a loose arc. The racial composition of the Parish of East Baton Rouge has changed between 1990 and 2000, to include a higher percentage of African-Americans. In 1990, 63% of the population in the Parish was white. In 2000 that percentage was 57%. There is also a statistical increase in people of Hispanic ethnicity1 (Ref. Table 2.4). The MSA and the State of Louisiana show similar trends. (Ref. Table 2.3)
1 Census 2000 collected data on Hispanic ethnicity differently from the earlier Censuses. Therefore, the data cannot be directly compared across censuses. For more details on data collection refer to the 2000 census release on collection of racial information at www.census.gov/prod/2001pubs/c2kbr01-1.pdf.
PARISH OF EAST BATON ROUGE, LOUISIANA – BREC STRATEGIC PLAN Chapter 2 – Demographic Report
2-4
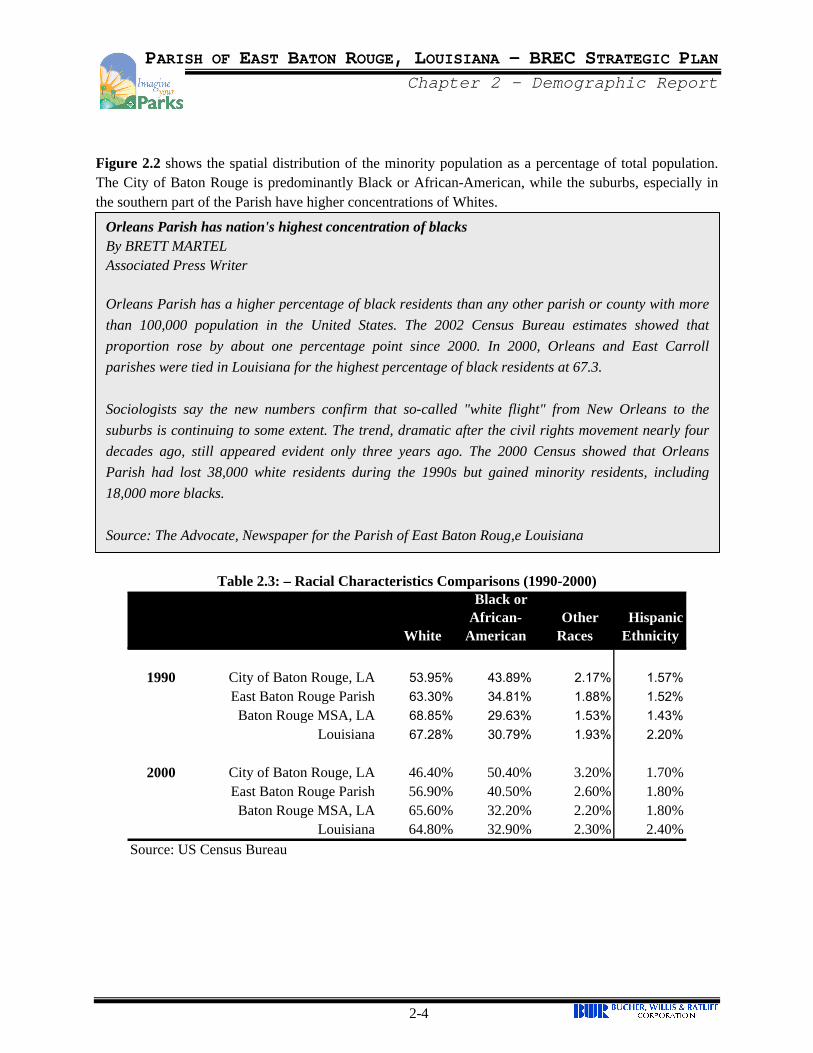
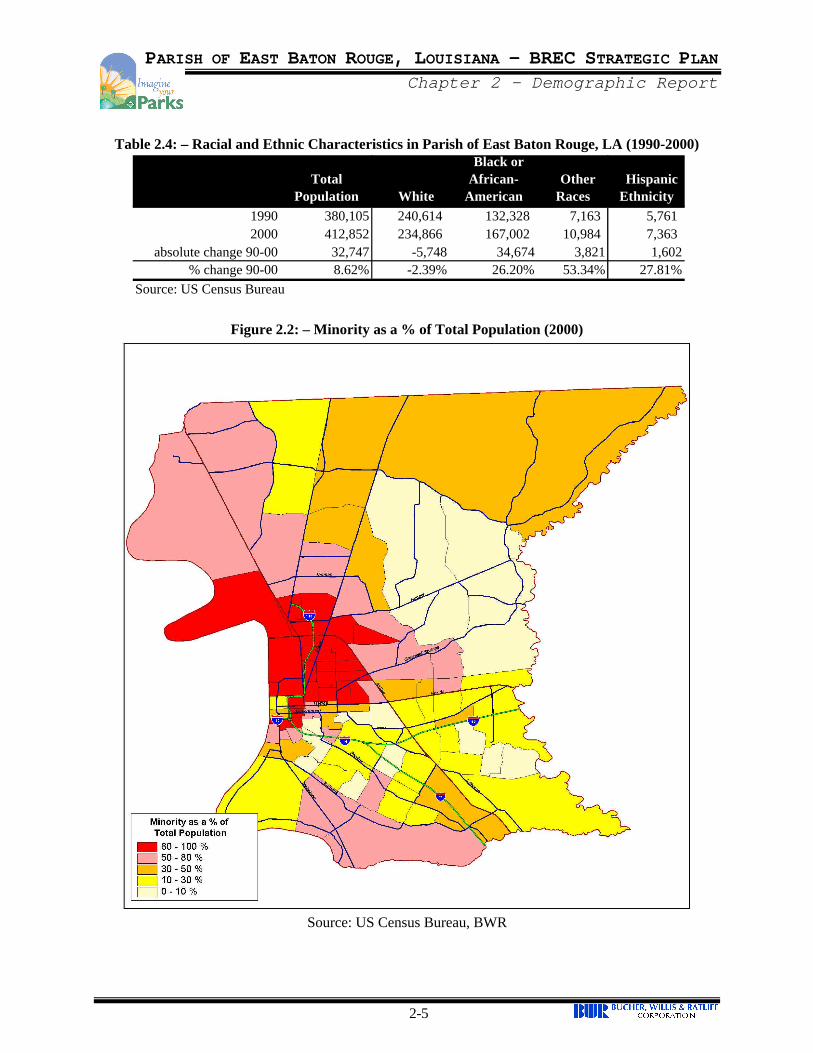
Figure 2.2 shows the spatial distribution of the minority population as a percentage of total population. The City of Baton Rouge is predominantly Black or African-American, while the suburbs, especially in the southern part of the Parish have higher concentrations of Whites.
Table 2.3: – Racial Characteristics Comparisons (1990-2000)
White
Black or African-
American Other Races
Hispanic Ethnicity
City of Baton Rouge, LA 53.95% 43.89% 2.17% 1.57%East Baton Rouge Parish 63.30% 34.81% 1.88% 1.52%Baton Rouge MSA, LA 68.85% 29.63% 1.53% 1.43%
Louisiana 67.28% 30.79% 1.93% 2.20%
City of Baton Rouge, LA 46.40% 50.40% 3.20% 1.70%East Baton Rouge Parish 56.90% 40.50% 2.60% 1.80%Baton Rouge MSA, LA 65.60% 32.20% 2.20% 1.80%
Louisiana 64.80% 32.90% 2.30% 2.40%Source: US Census Bureau
1990
2000
Orleans Parish has nation's highest concentration of blacks By BRETT MARTEL Associated Press Writer Orleans Parish has a higher percentage of black residents than any other parish or county with more than 100,000 population in the United States. The 2002 Census Bureau estimates showed that proportion rose by about one percentage point since 2000. In 2000, Orleans and East Carroll parishes were tied in Louisiana for the highest percentage of black residents at 67.3. Sociologists say the new numbers confirm that so-called "white flight" from New Orleans to the suburbs is continuing to some extent. The trend, dramatic after the civil rights movement nearly four decades ago, still appeared evident only three years ago. The 2000 Census showed that Orleans Parish had lost 38,000 white residents during the 1990s but gained minority residents, including 18,000 more blacks. Source: The Advocate, Newspaper for the Parish of East Baton Roug,e Louisiana
PARISH OF EAST BATON ROUGE, LOUISIANA – BREC STRATEGIC PLAN Chapter 2 – Demographic Report
2-5
Table 2.4: – Racial and Ethnic Characteristics in Parish of East Baton Rouge, LA (1990-2000)
Total Population White
Black or African-
American Other Races
Hispanic Ethnicity
1990 380,105 240,614 132,328 7,163 5,761 2000 412,852 234,866 167,002 10,984 7,363
absolute change 90-00 32,747 -5,748 34,674 3,821 1,602% change 90-00 8.62% -2.39% 26.20% 53.34% 27.81%
Source: US Census Bureau
Figure 2.2: – Minority as a % of Total Population (2000)
Source: US Census Bureau, BWR
PARISH OF EAST BATON ROUGE, LOUISIANA – BREC STRATEGIC PLAN Chapter 2 – Demographic Report
2-6
Median Age Changes in the median age are important indicators of a shift in the composition of the City. They are a quick way of establishing target age groups to plan for. The median age in the City of Baton Rouge is now about 30.4. In keeping with the national trend, Louisiana's population is also getting older. The median age in Louisiana is 34; at the national level, median age climbed to 35.3 in 2000. Median age among Louisiana's nonwhite ethnic populations is lower than that of whites; this parallels both national and southern patterns.
Table 2.5: – Median Age (2000) 2000
City of Baton Rouge, LA 30.4East Baton Rouge Parish 31.5
Baton Rouge MSA, LA 31.9Louisiana 34
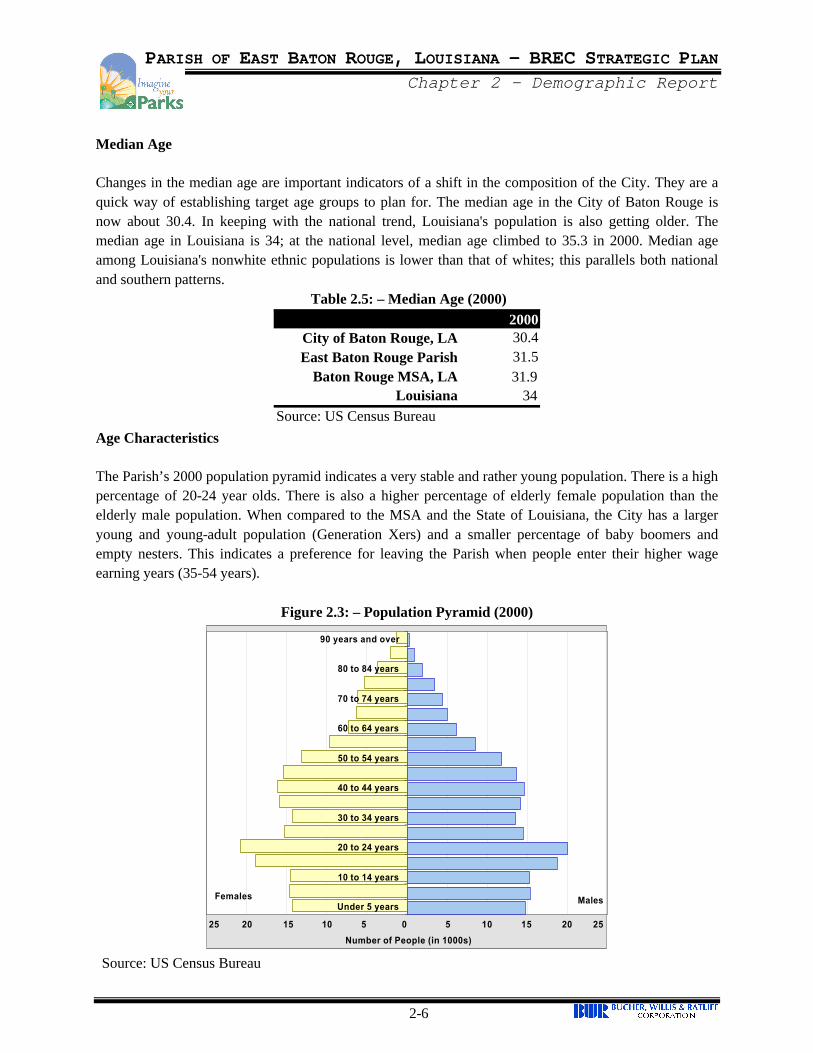
Source: US Census Bureau Age Characteristics The Parish’s 2000 population pyramid indicates a very stable and rather young population. There is a high percentage of 20-24 year olds. There is also a higher percentage of elderly female population than the elderly male population. When compared to the MSA and the State of Louisiana, the City has a larger young and young-adult population (Generation Xers) and a smaller percentage of baby boomers and empty nesters. This indicates a preference for leaving the Parish when people enter their higher wage earning years (35-54 years).
Figure 2.3: – Population Pyramid (2000)
Under 5 years
10 to 14 years
20 to 24 years
30 to 34 years
40 to 44 years
50 to 54 years
60 to 64 years
70 to 74 years
80 to 84 years
90 years and over
Number of People (in 1000s)
Females Males
0510152025 5 10 15 20 25
Source: US Census Bureau
PARISH OF EAST BATON ROUGE, LOUISIANA – BREC STRATEGIC PLAN Chapter 2 – Demographic Report
2-7
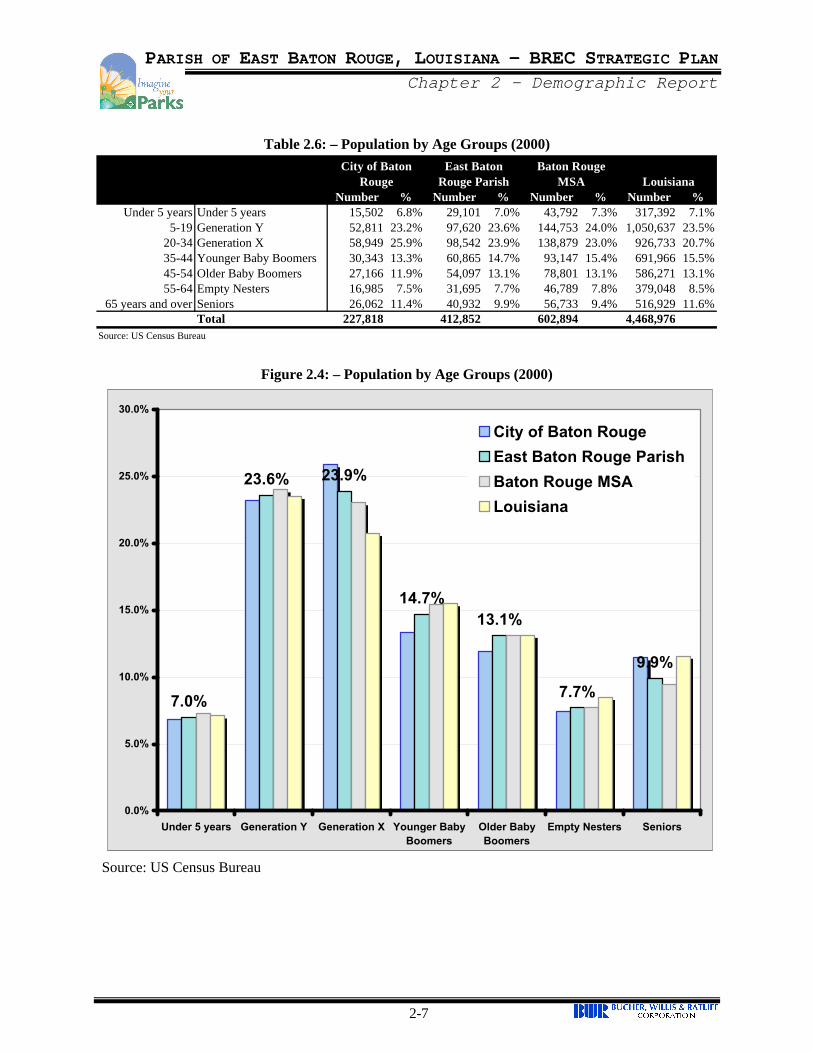
Table 2.6: – Population by Age Groups (2000)
Number % Number % Number % Number %Under 5 years Under 5 years 15,502 6.8% 29,101 7.0% 43,792 7.3% 317,392 7.1%
5-19 Generation Y 52,811 23.2% 97,620 23.6% 144,753 24.0% 1,050,637 23.5%20-34 Generation X 58,949 25.9% 98,542 23.9% 138,879 23.0% 926,733 20.7%35-44 Younger Baby Boomers 30,343 13.3% 60,865 14.7% 93,147 15.4% 691,966 15.5%45-54 Older Baby Boomers 27,166 11.9% 54,097 13.1% 78,801 13.1% 586,271 13.1%55-64 Empty Nesters 16,985 7.5% 31,695 7.7% 46,789 7.8% 379,048 8.5%
65 years and over Seniors 26,062 11.4% 40,932 9.9% 56,733 9.4% 516,929 11.6%Total 227,818 412,852 602,894 4,468,976
Source: US Census Bureau
LouisianaCity of Baton
RougeBaton Rouge
MSAEast Baton
Rouge Parish
Figure 2.4: – Population by Age Groups (2000)
7.0%
23.6% 23.9%
14.7%13.1%
7.7%
9.9%
0.0%
5.0%
10.0%
15.0%
20.0%
25.0%
30.0%
Under 5 years Generation Y Generation X Younger BabyBoomers
Older BabyBoomers
Empty Nesters Seniors
City of Baton Rouge
East Baton Rouge Parish
Baton Rouge MSA
Louisiana
Source: US Census Bureau
PARISH OF EAST BATON ROUGE, LOUISIANA – BREC STRATEGIC PLAN Chapter 2 – Demographic Report
2-8
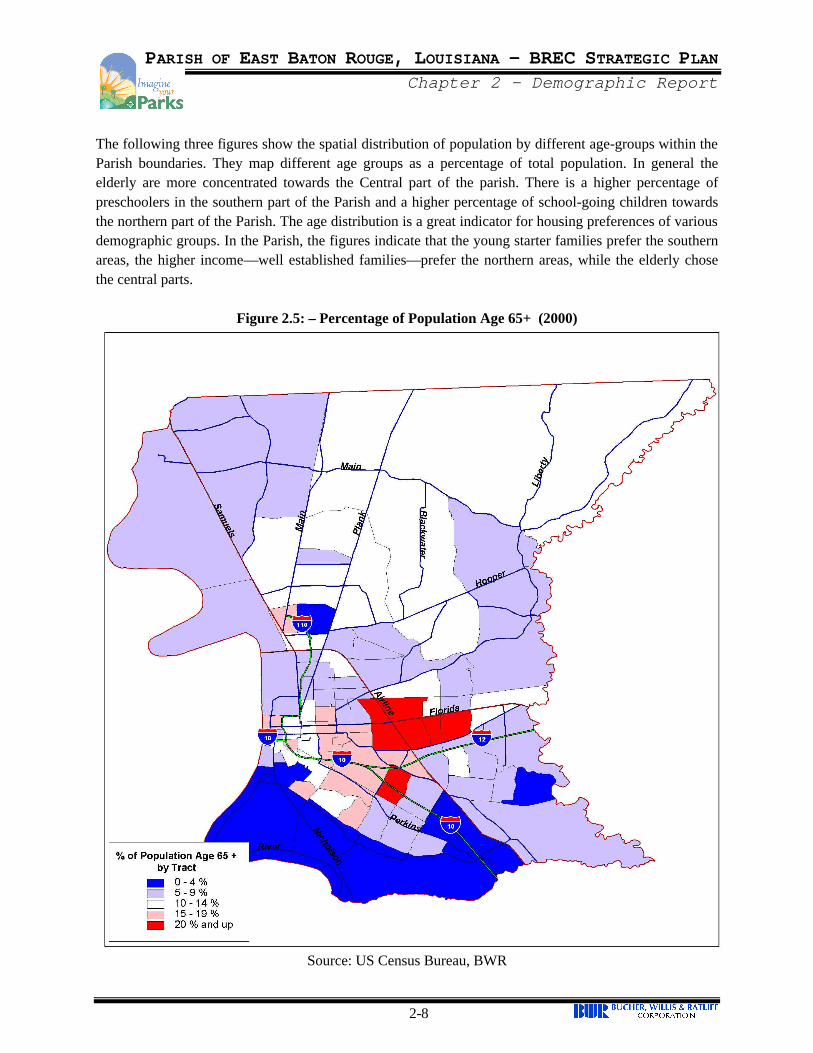
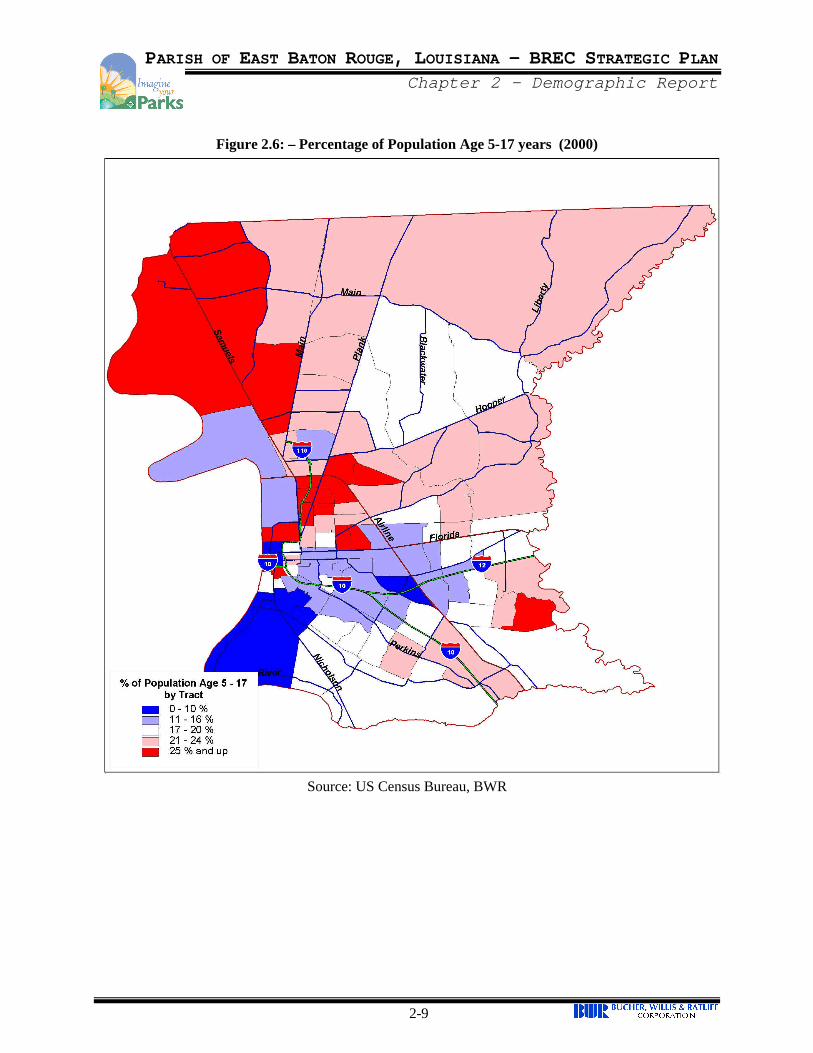
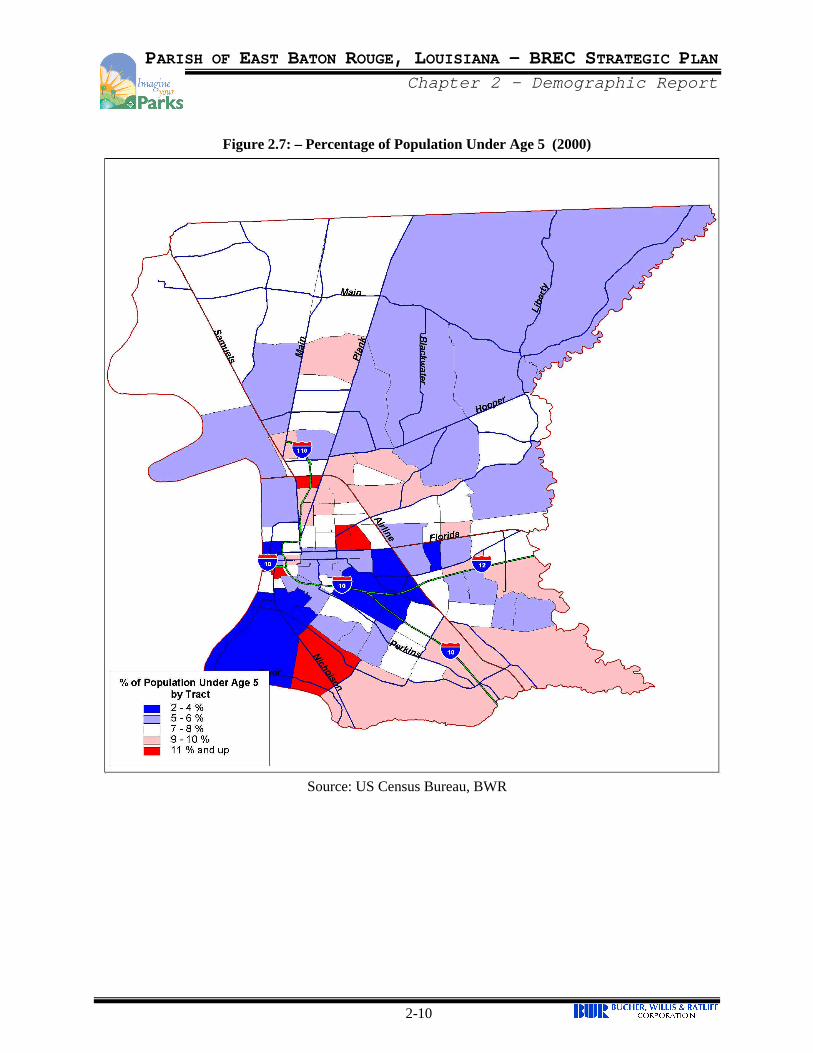
The following three figures show the spatial distribution of population by different age-groups within the Parish boundaries. They map different age groups as a percentage of total population. In general the elderly are more concentrated towards the Central part of the parish. There is a higher percentage of preschoolers in the southern part of the Parish and a higher percentage of school-going children towards the northern part of the Parish. The age distribution is a great indicator for housing preferences of various demographic groups. In the Parish, the figures indicate that the young starter families prefer the southern areas, the higher income—well established families—prefer the northern areas, while the elderly chose the central parts.
Figure 2.5: – Percentage of Population Age 65+ (2000)
Source: US Census Bureau, BWR
PARISH OF EAST BATON ROUGE, LOUISIANA – BREC STRATEGIC PLAN Chapter 2 – Demographic Report
2-9
Figure 2.6: – Percentage of Population Age 5-17 years (2000)
Source: US Census Bureau, BWR
PARISH OF EAST BATON ROUGE, LOUISIANA – BREC STRATEGIC PLAN Chapter 2 – Demographic Report
2-10
Figure 2.7: – Percentage of Population Under Age 5 (2000)
Source: US Census Bureau, BWR
PARISH OF EAST BATON ROUGE, LOUISIANA – BREC STRATEGIC PLAN Chapter 2 – Demographic Report
2-11
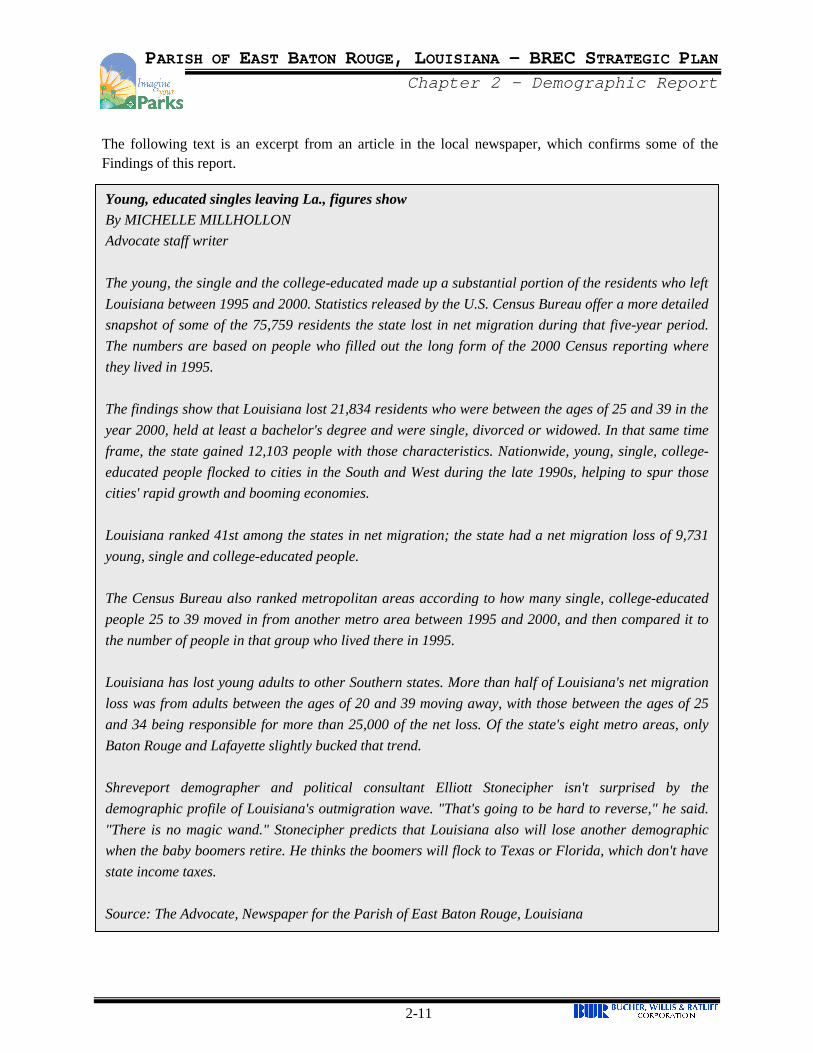
The following text is an excerpt from an article in the local newspaper, which confirms some of the Findings of this report.
Young, educated singles leaving La., figures show By MICHELLE MILLHOLLON Advocate staff writer The young, the single and the college-educated made up a substantial portion of the residents who left Louisiana between 1995 and 2000. Statistics released by the U.S. Census Bureau offer a more detailed snapshot of some of the 75,759 residents the state lost in net migration during that five-year period. The numbers are based on people who filled out the long form of the 2000 Census reporting where they lived in 1995. The findings show that Louisiana lost 21,834 residents who were between the ages of 25 and 39 in the year 2000, held at least a bachelor's degree and were single, divorced or widowed. In that same time frame, the state gained 12,103 people with those characteristics. Nationwide, young, single, college-educated people flocked to cities in the South and West during the late 1990s, helping to spur those cities' rapid growth and booming economies. Louisiana ranked 41st among the states in net migration; the state had a net migration loss of 9,731 young, single and college-educated people. The Census Bureau also ranked metropolitan areas according to how many single, college-educated people 25 to 39 moved in from another metro area between 1995 and 2000, and then compared it to the number of people in that group who lived there in 1995. Louisiana has lost young adults to other Southern states. More than half of Louisiana's net migration loss was from adults between the ages of 20 and 39 moving away, with those between the ages of 25 and 34 being responsible for more than 25,000 of the net loss. Of the state's eight metro areas, only Baton Rouge and Lafayette slightly bucked that trend. Shreveport demographer and political consultant Elliott Stonecipher isn't surprised by the demographic profile of Louisiana's outmigration wave. "That's going to be hard to reverse," he said. "There is no magic wand." Stonecipher predicts that Louisiana also will lose another demographic when the baby boomers retire. He thinks the boomers will flock to Texas or Florida, which don't have state income taxes. Source: The Advocate, Newspaper for the Parish of East Baton Rouge, Louisiana
PARISH OF EAST BATON ROUGE, LOUISIANA – BREC STRATEGIC PLAN Chapter 2 – Demographic Report
2-12
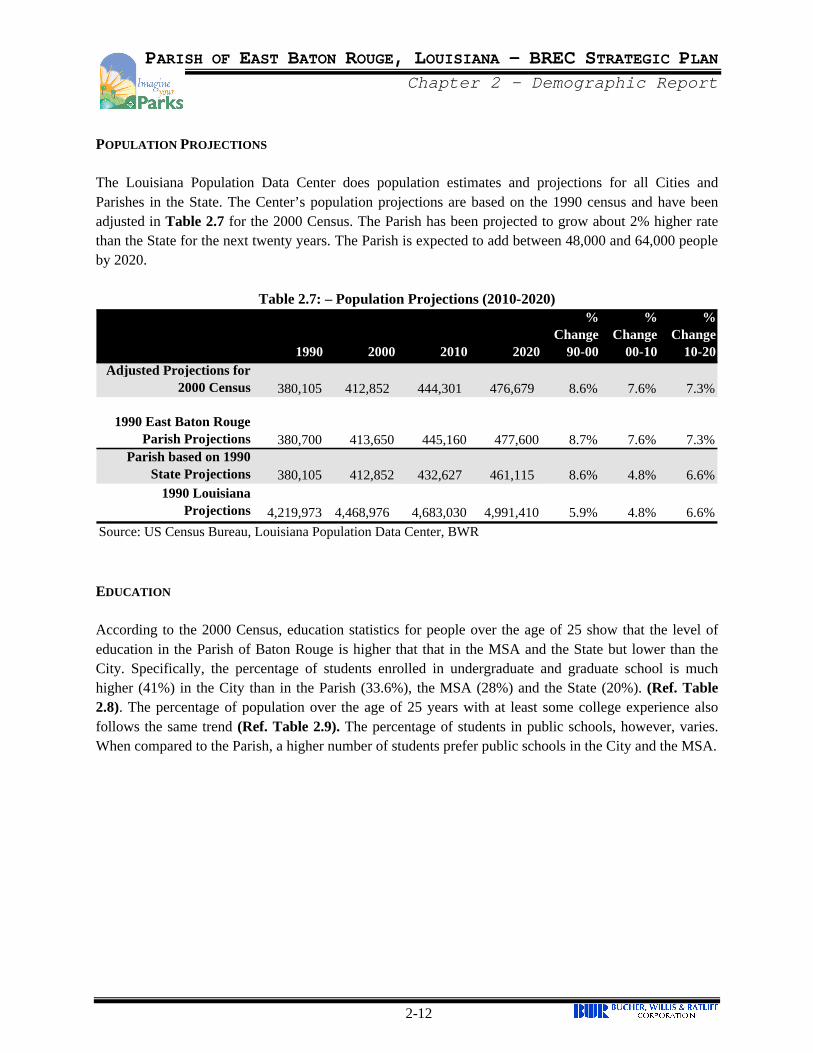
POPULATION PROJECTIONS The Louisiana Population Data Center does population estimates and projections for all Cities and Parishes in the State. The Center’s population projections are based on the 1990 census and have been adjusted in Table 2.7 for the 2000 Census. The Parish has been projected to grow about 2% higher rate than the State for the next twenty years. The Parish is expected to add between 48,000 and 64,000 people by 2020.
Table 2.7: – Population Projections (2010-2020)
1990 2000 2010 2020
% Change
90-00
% Change
00-10
% Change
10-20Adjusted Projections for
2000 Census 380,105 412,852 444,301 476,679 8.6% 7.6% 7.3%
1990 East Baton Rouge Parish Projections 380,700 413,650 445,160 477,600 8.7% 7.6% 7.3%
Parish based on 1990 State Projections 380,105 412,852 432,627 461,115 8.6% 4.8% 6.6%
1990 Louisiana Projections 4,219,973 4,468,976 4,683,030 4,991,410 5.9% 4.8% 6.6%
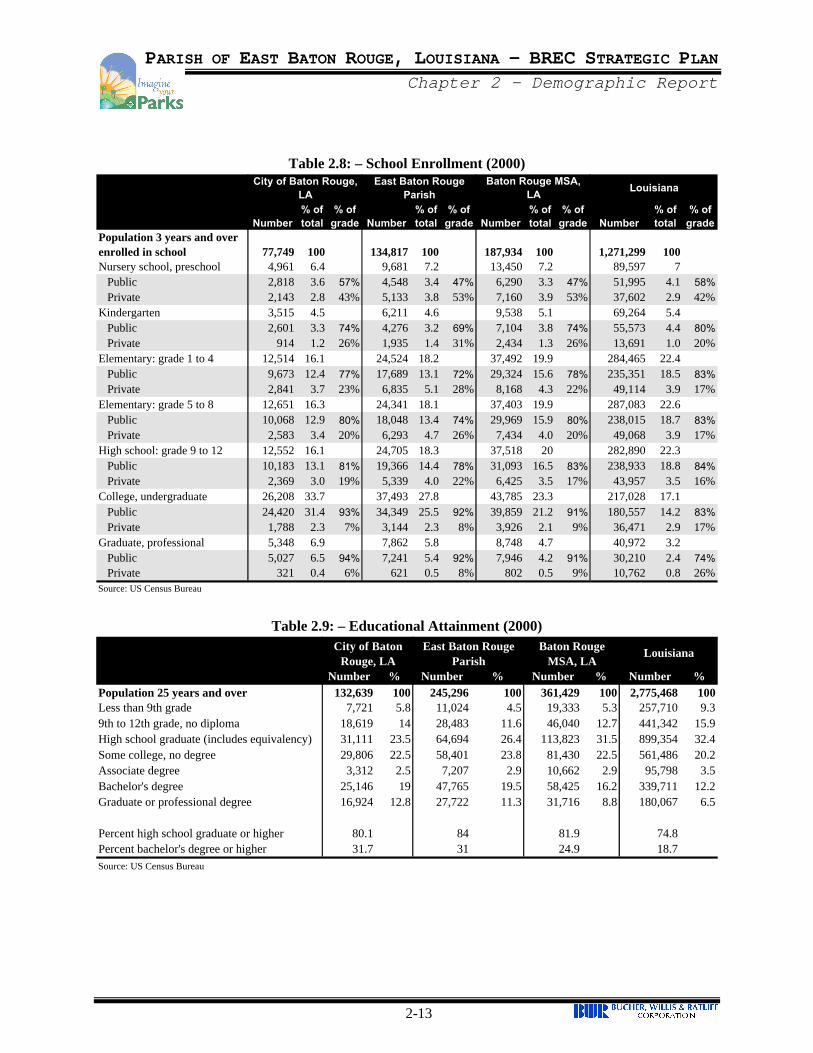
Source: US Census Bureau, Louisiana Population Data Center, BWR EDUCATION According to the 2000 Census, education statistics for people over the age of 25 show that the level of education in the Parish of Baton Rouge is higher that that in the MSA and the State but lower than the City. Specifically, the percentage of students enrolled in undergraduate and graduate school is much higher (41%) in the City than in the Parish (33.6%), the MSA (28%) and the State (20%). (Ref. Table 2.8). The percentage of population over the age of 25 years with at least some college experience also follows the same trend (Ref. Table 2.9). The percentage of students in public schools, however, varies. When compared to the Parish, a higher number of students prefer public schools in the City and the MSA.
PARISH OF EAST BATON ROUGE, LOUISIANA – BREC STRATEGIC PLAN Chapter 2 – Demographic Report
2-13
Table 2.8: – School Enrollment (2000)
Number% of total
% of grade Number
% of total
% of grade Number
% of total
% of grade Number
% of total
% of grade
Population 3 years and over enrolled in school 77,749 100 134,817 100 187,934 100 1,271,299 100Nursery school, preschool 4,961 6.4 9,681 7.2 13,450 7.2 89,597 7
Public 2,818 3.6 57% 4,548 3.4 47% 6,290 3.3 47% 51,995 4.1 58%Private 2,143 2.8 43% 5,133 3.8 53% 7,160 3.9 53% 37,602 2.9 42%
Kindergarten 3,515 4.5 6,211 4.6 9,538 5.1 69,264 5.4Public 2,601 3.3 74% 4,276 3.2 69% 7,104 3.8 74% 55,573 4.4 80%Private 914 1.2 26% 1,935 1.4 31% 2,434 1.3 26% 13,691 1.0 20%
Elementary: grade 1 to 4 12,514 16.1 24,524 18.2 37,492 19.9 284,465 22.4Public 9,673 12.4 77% 17,689 13.1 72% 29,324 15.6 78% 235,351 18.5 83%Private 2,841 3.7 23% 6,835 5.1 28% 8,168 4.3 22% 49,114 3.9 17%
Elementary: grade 5 to 8 12,651 16.3 24,341 18.1 37,403 19.9 287,083 22.6Public 10,068 12.9 80% 18,048 13.4 74% 29,969 15.9 80% 238,015 18.7 83%Private 2,583 3.4 20% 6,293 4.7 26% 7,434 4.0 20% 49,068 3.9 17%
High school: grade 9 to 12 12,552 16.1 24,705 18.3 37,518 20 282,890 22.3Public 10,183 13.1 81% 19,366 14.4 78% 31,093 16.5 83% 238,933 18.8 84%Private 2,369 3.0 19% 5,339 4.0 22% 6,425 3.5 17% 43,957 3.5 16%
College, undergraduate 26,208 33.7 37,493 27.8 43,785 23.3 217,028 17.1Public 24,420 31.4 93% 34,349 25.5 92% 39,859 21.2 91% 180,557 14.2 83%Private 1,788 2.3 7% 3,144 2.3 8% 3,926 2.1 9% 36,471 2.9 17%
Graduate, professional 5,348 6.9 7,862 5.8 8,748 4.7 40,972 3.2Public 5,027 6.5 94% 7,241 5.4 92% 7,946 4.2 91% 30,210 2.4 74%Private 321 0.4 6% 621 0.5 8% 802 0.5 9% 10,762 0.8 26%
Source: US Census Bureau
Baton Rouge MSA, LA
East Baton Rouge Parish
City of Baton Rouge, LA
Louisiana
Table 2.9: – Educational Attainment (2000)
Number % Number % Number % Number %Population 25 years and over 132,639 100 245,296 100 361,429 100 2,775,468 100Less than 9th grade 7,721 5.8 11,024 4.5 19,333 5.3 257,710 9.39th to 12th grade, no diploma 18,619 14 28,483 11.6 46,040 12.7 441,342 15.9High school graduate (includes equivalency) 31,111 23.5 64,694 26.4 113,823 31.5 899,354 32.4Some college, no degree 29,806 22.5 58,401 23.8 81,430 22.5 561,486 20.2Associate degree 3,312 2.5 7,207 2.9 10,662 2.9 95,798 3.5Bachelor's degree 25,146 19 47,765 19.5 58,425 16.2 339,711 12.2Graduate or professional degree 16,924 12.8 27,722 11.3 31,716 8.8 180,067 6.5
Percent high school graduate or higher 80.1 84 81.9 74.8Percent bachelor's degree or higher 31.7 31 24.9 18.7Source: US Census Bureau
East Baton Rouge Parish
City of Baton Rouge, LA
Baton Rouge MSA, LA
Louisiana
PARISH OF EAST BATON ROUGE, LOUISIANA – BREC STRATEGIC PLAN Chapter 2 – Demographic Report
2-14
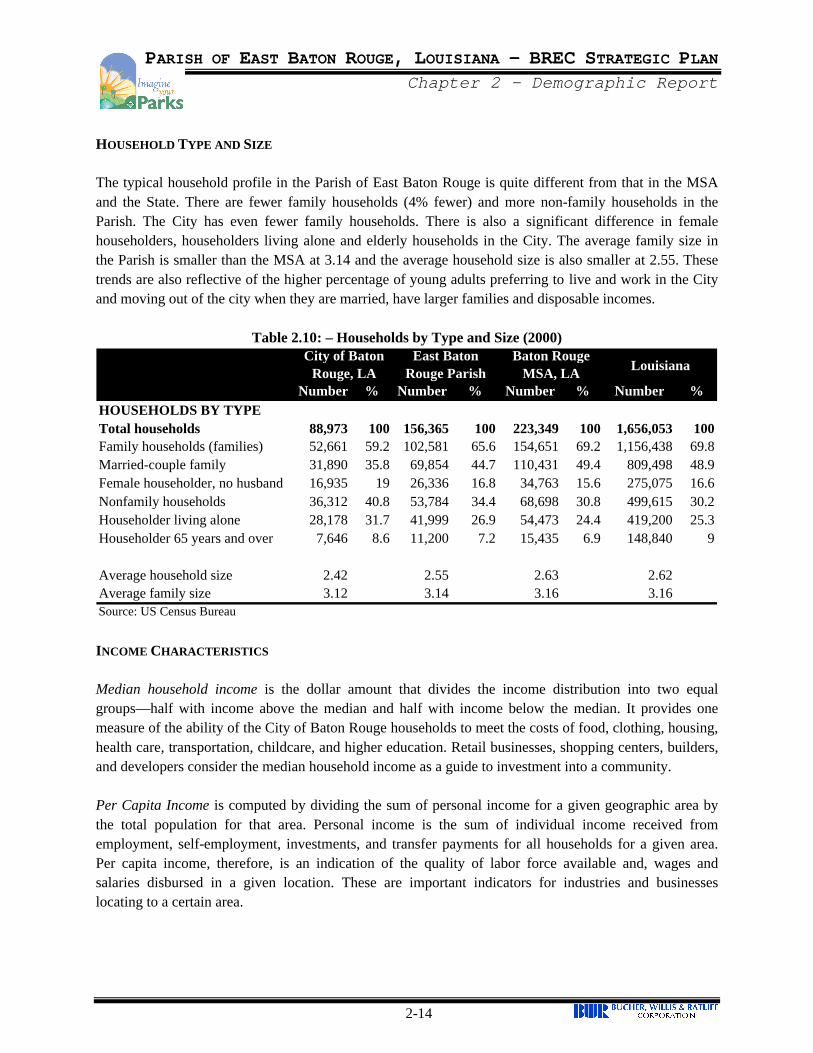
HOUSEHOLD TYPE AND SIZE The typical household profile in the Parish of East Baton Rouge is quite different from that in the MSA and the State. There are fewer family households (4% fewer) and more non-family households in the Parish. The City has even fewer family households. There is also a significant difference in female householders, householders living alone and elderly households in the City. The average family size in the Parish is smaller than the MSA at 3.14 and the average household size is also smaller at 2.55. These trends are also reflective of the higher percentage of young adults preferring to live and work in the City and moving out of the city when they are married, have larger families and disposable incomes.
Table 2.10: – Households by Type and Size (2000)
Number % Number % Number % Number %HOUSEHOLDS BY TYPETotal households 88,973 100 156,365 100 223,349 100 1,656,053 100Family households (families) 52,661 59.2 102,581 65.6 154,651 69.2 1,156,438 69.8Married-couple family 31,890 35.8 69,854 44.7 110,431 49.4 809,498 48.9Female householder, no husband 16,935 19 26,336 16.8 34,763 15.6 275,075 16.6Nonfamily households 36,312 40.8 53,784 34.4 68,698 30.8 499,615 30.2Householder living alone 28,178 31.7 41,999 26.9 54,473 24.4 419,200 25.3Householder 65 years and over 7,646 8.6 11,200 7.2 15,435 6.9 148,840 9
Average household size 2.42 2.55 2.63 2.62Average family size 3.12 3.14 3.16 3.16Source: US Census Bureau
LouisianaEast Baton
Rouge ParishCity of Baton
Rouge, LABaton Rouge
MSA, LA
INCOME CHARACTERISTICS Median household income is the dollar amount that divides the income distribution into two equal groups—half with income above the median and half with income below the median. It provides one measure of the ability of the City of Baton Rouge households to meet the costs of food, clothing, housing, health care, transportation, childcare, and higher education. Retail businesses, shopping centers, builders, and developers consider the median household income as a guide to investment into a community. Per Capita Income is computed by dividing the sum of personal income for a given geographic area by the total population for that area. Personal income is the sum of individual income received from employment, self-employment, investments, and transfer payments for all households for a given area. Per capita income, therefore, is an indication of the quality of labor force available and, wages and salaries disbursed in a given location. These are important indicators for industries and businesses locating to a certain area.
PARISH OF EAST BATON ROUGE, LOUISIANA – BREC STRATEGIC PLAN Chapter 2 – Demographic Report
2-15
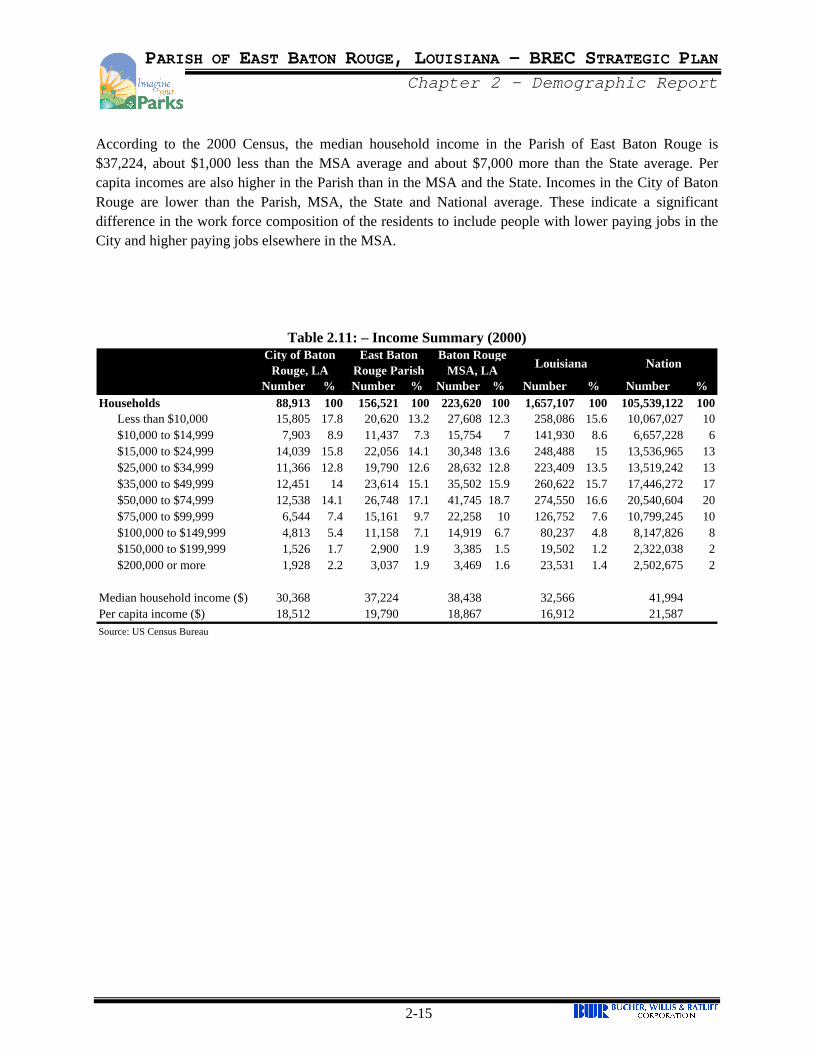
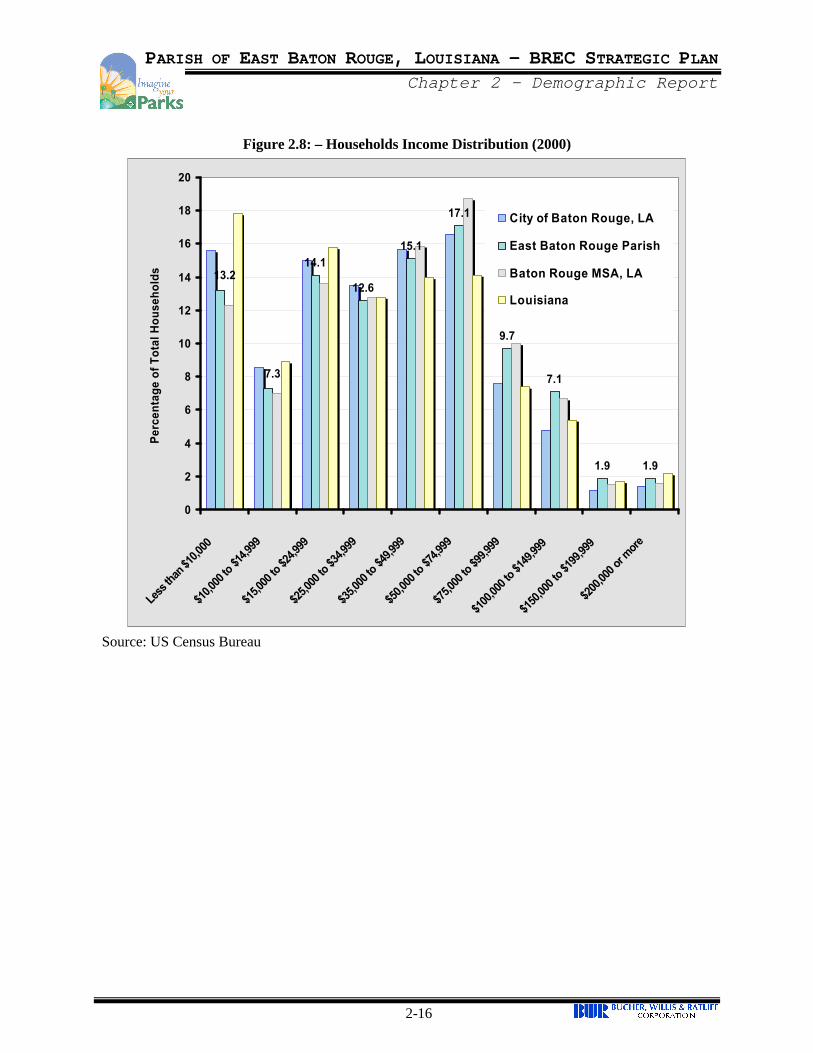
According to the 2000 Census, the median household income in the Parish of East Baton Rouge is $37,224, about $1,000 less than the MSA average and about $7,000 more than the State average. Per capita incomes are also higher in the Parish than in the MSA and the State. Incomes in the City of Baton Rouge are lower than the Parish, MSA, the State and National average. These indicate a significant difference in the work force composition of the residents to include people with lower paying jobs in the City and higher paying jobs elsewhere in the MSA.
Table 2.11: – Income Summary (2000)
Number % Number % Number % Number % Number %Households 88,913 100 156,521 100 223,620 100 1,657,107 100 105,539,122 100
Less than $10,000 15,805 17.8 20,620 13.2 27,608 12.3 258,086 15.6 10,067,027 10$10,000 to $14,999 7,903 8.9 11,437 7.3 15,754 7 141,930 8.6 6,657,228 6$15,000 to $24,999 14,039 15.8 22,056 14.1 30,348 13.6 248,488 15 13,536,965 13$25,000 to $34,999 11,366 12.8 19,790 12.6 28,632 12.8 223,409 13.5 13,519,242 13$35,000 to $49,999 12,451 14 23,614 15.1 35,502 15.9 260,622 15.7 17,446,272 17$50,000 to $74,999 12,538 14.1 26,748 17.1 41,745 18.7 274,550 16.6 20,540,604 20$75,000 to $99,999 6,544 7.4 15,161 9.7 22,258 10 126,752 7.6 10,799,245 10$100,000 to $149,999 4,813 5.4 11,158 7.1 14,919 6.7 80,237 4.8 8,147,826 8$150,000 to $199,999 1,526 1.7 2,900 1.9 3,385 1.5 19,502 1.2 2,322,038 2$200,000 or more 1,928 2.2 3,037 1.9 3,469 1.6 23,531 1.4 2,502,675 2
Median household income ($) 30,368 37,224 38,438 32,566 41,994Per capita income ($) 18,512 19,790 18,867 16,912 21,587Source: US Census Bureau
NationEast Baton
Rouge ParishCity of Baton
Rouge, LABaton Rouge
MSA, LA Louisiana
PARISH OF EAST BATON ROUGE, LOUISIANA – BREC STRATEGIC PLAN Chapter 2 – Demographic Report
2-16
Figure 2.8: – Households Income Distribution (2000)
14.1
12.6
15.1
17.1
9.7
7.1
1.9 1.9
7.3
13.2
0
2
4
6
8
10
12
14
16
18
20
Less
than
$10,0
00
$10,0
00 to
$14,9
99
$15,0
00 to
$24,9
99
$25,0
00 to
$34,9
99
$35,0
00 to
$49,9
99
$50,0
00 to
$74,9
99
$75,0
00 to
$99,9
99
$100
,000 t
o $14
9,999
$150
,000 t
o $19
9,999
$200
,000 o
r more
Per
cent
age
of T
otal
Hou
seho
lds
City of Baton Rouge, LA
East Baton Rouge Parish
Baton Rouge MSA, LA
Louisiana
Source: US Census Bureau
PARISH OF EAST BATON ROUGE, LOUISIANA – BREC STRATEGIC PLAN Chapter 2 – Demographic Report
2-17
Louisiana Income Up Slightly, But So Is Poverty Rate By BRETT MARTEL Associated Press Writer Defying a national trend, Louisiana's median household income rose between 2000 and 2002, but like the rest of the country, the state's poverty rate also appeared to increase. In both income and poverty, Louisiana remained among the poorest states in the country, along with states like Arkansas, Mississippi, New Mexico and West Virginia. Louisiana had among the lowest median incomes in the country at about $33,312 and among the highest poverty rates at 16.9 percent. Nationally, the poverty rate was 12.1 percent last year, up from 11.7 percent in 2001. Median household income declined 1.1 percent between 2001 and 2002 to $42,409, after accounting for inflation. Statistically, Louisiana seems to be in far better shape than in the mid-1990s, when the state's poverty rate hovered around 20 percent. Louisiana State University economist Loren Scott said Louisiana did not suffer in the recent recession as much as most of the country. Scott noted that while the nation lost about 2 percent of its jobs in the recent national recession. In Louisiana, that figure was closer to 1.2 percent, while in Mississippi, by contrast, it was closer to 2.3 percent. "Our oil and gas extraction industry did OK, and that was kind of a safety net," Scott said. Second, Scott said, was the fact that Louisiana, compared to many states, has relatively few jobs in durable goods manufacturing. "And that's the sector that gets hit hard when people stop buying things like cars and appliances," he said. "Most of our durable goods manufacturing serves offshore oil and gas." Although the recession technically ended in late 2001, economists say income and poverty statistics don't stop falling until about a year later. Louisiana's poverty rate in 2002 was about 0.2 percent higher than in 2001, but still slightly lower than in 2000, giving the state a 17 percent average from 2000-2002, the Census report said. The poverty threshold differs by the size and makeup of a household. For instance, a person under 65 living alone in 2002 was considered in poverty if income was $9,359 or less; for a household of three including one child, it was $14,480. The slight rise in poverty in Louisiana was expected, given that the state has experienced three consecutive years of job losses. "We've had a recession which is naturally going to raise the poverty rate and make things look bad, but it's good news we didn't sink as badly as the rest of the country," Scott said. Source: The Advocate, Newspaper for the Parish of East Baton Rouge, Louisiana
PARISH OF EAST BATON ROUGE, LOUISIANA – BREC STRATEGIC PLAN Chapter 2 – Demographic Report
2-18
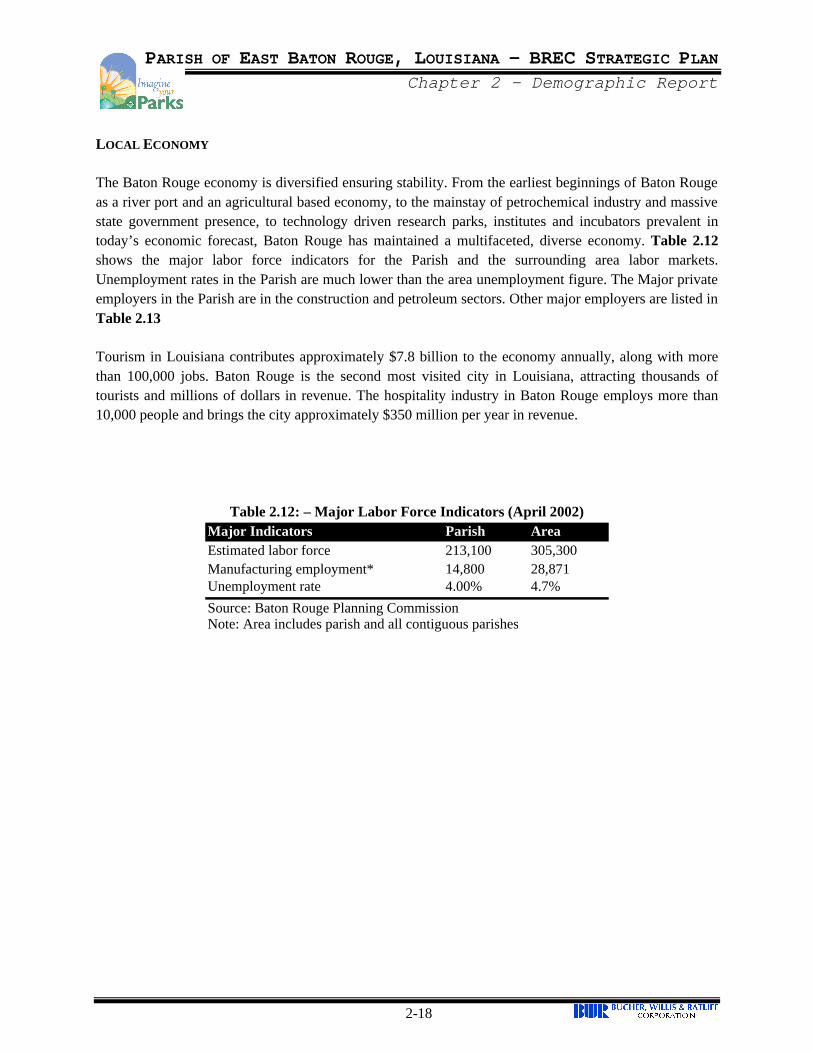
LOCAL ECONOMY The Baton Rouge economy is diversified ensuring stability. From the earliest beginnings of Baton Rouge as a river port and an agricultural based economy, to the mainstay of petrochemical industry and massive state government presence, to technology driven research parks, institutes and incubators prevalent in today’s economic forecast, Baton Rouge has maintained a multifaceted, diverse economy. Table 2.12 shows the major labor force indicators for the Parish and the surrounding area labor markets. Unemployment rates in the Parish are much lower than the area unemployment figure. The Major private employers in the Parish are in the construction and petroleum sectors. Other major employers are listed in Table 2.13 Tourism in Louisiana contributes approximately $7.8 billion to the economy annually, along with more than 100,000 jobs. Baton Rouge is the second most visited city in Louisiana, attracting thousands of tourists and millions of dollars in revenue. The hospitality industry in Baton Rouge employs more than 10,000 people and brings the city approximately $350 million per year in revenue.
Table 2.12: – Major Labor Force Indicators (April 2002) Major Indicators Parish AreaEstimated labor force 213,100 305,300Manufacturing employment* 14,800 28,871Unemployment rate 4.00% 4.7%
Source: Baton Rouge Planning CommissionNote: Area includes parish and all contiguous parishes
PARISH OF EAST BATON ROUGE, LOUISIANA – BREC STRATEGIC PLAN Chapter 2 – Demographic Report
2-19
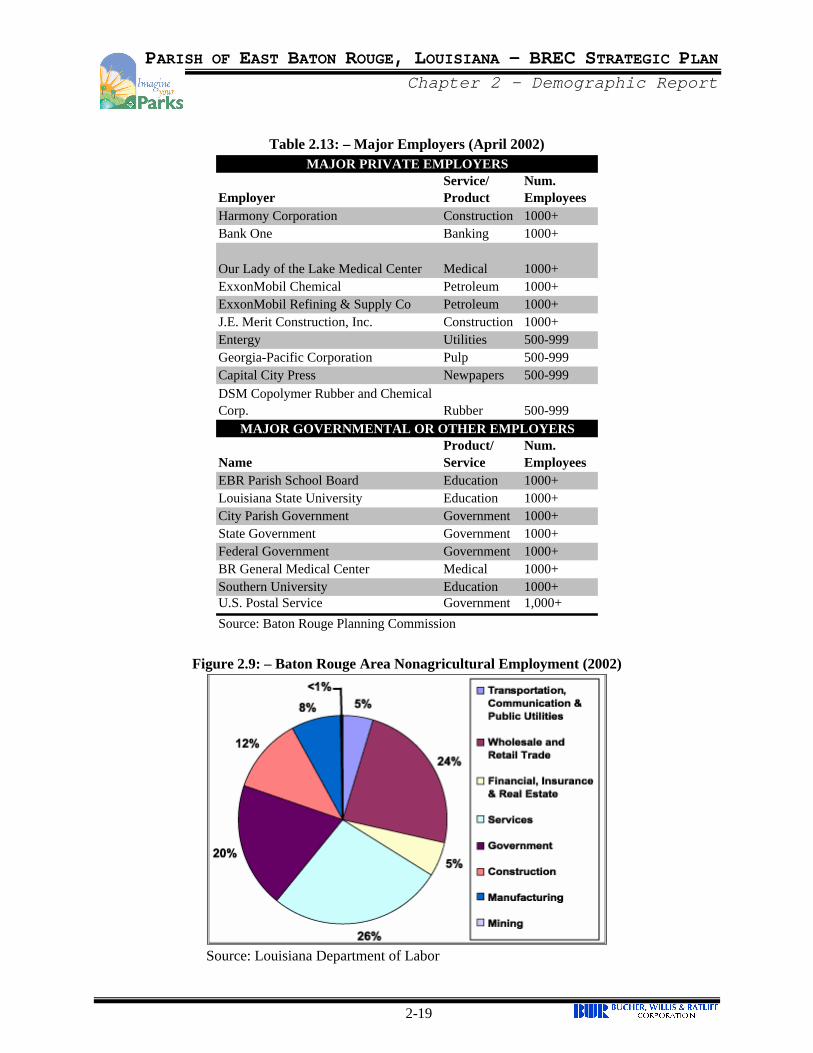
Table 2.13: – Major Employers (April 2002)
EmployerService/ Product
Num. Employees
Harmony Corporation Construction 1000+Bank One Banking 1000+
Our Lady of the Lake Medical Center Medical 1000+ExxonMobil Chemical Petroleum 1000+ExxonMobil Refining & Supply Co Petroleum 1000+J.E. Merit Construction, Inc. Construction 1000+Entergy Utilities 500-999Georgia-Pacific Corporation Pulp 500-999Capital City Press Newpapers 500-999DSM Copolymer Rubber and Chemical Corp. Rubber 500-999
NameProduct/ Service
Num. Employees
EBR Parish School Board Education 1000+Louisiana State University Education 1000+City Parish Government Government 1000+State Government Government 1000+Federal Government Government 1000+BR General Medical Center Medical 1000+Southern University Education 1000+U.S. Postal Service Government 1,000+
Source: Baton Rouge Planning Commission
MAJOR PRIVATE EMPLOYERS
MAJOR GOVERNMENTAL OR OTHER EMPLOYERS
Figure 2.9: – Baton Rouge Area Nonagricultural Employment (2002)
Source: Louisiana Department of Labor
PARISH OF EAST BATON ROUGE, LOUISIANA – BREC STRATEGIC PLAN Chapter 2 – Demographic Report
2-20
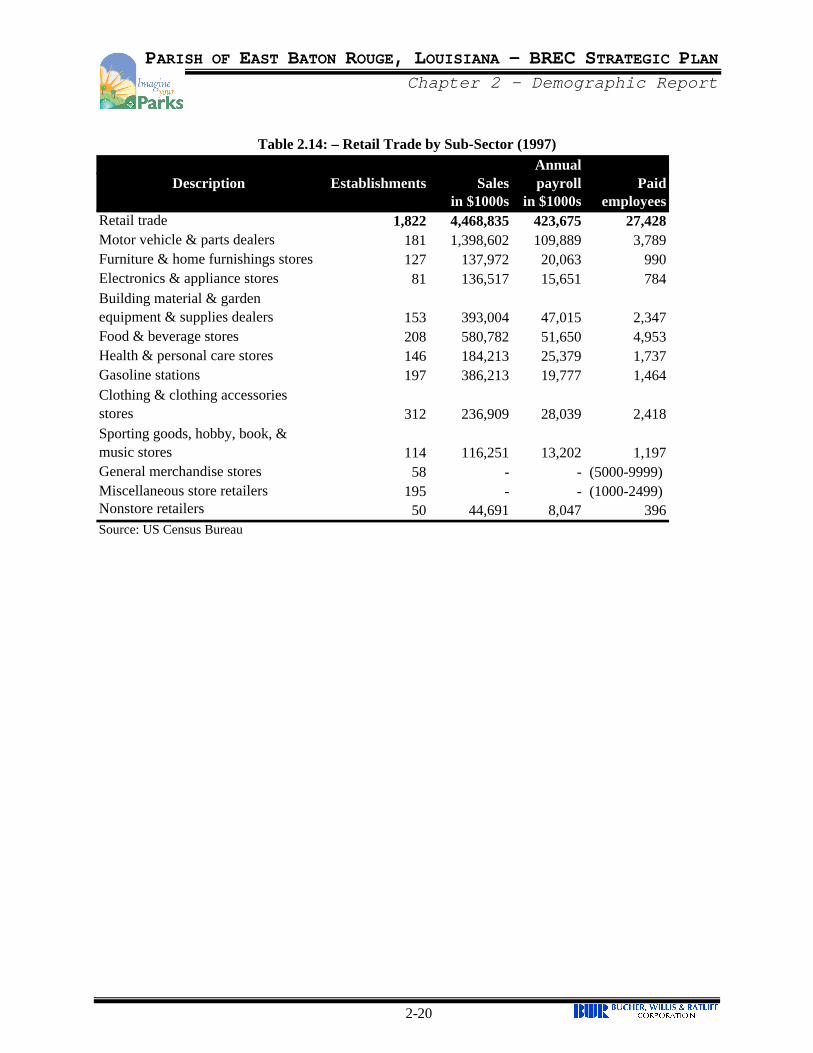
Table 2.14: – Retail Trade by Sub-Sector (1997) Annual
Description Establishments Sales payroll Paid in $1000s in $1000s employees
Retail trade 1,822 4,468,835 423,675 27,428Motor vehicle & parts dealers 181 1,398,602 109,889 3,789Furniture & home furnishings stores 127 137,972 20,063 990Electronics & appliance stores 81 136,517 15,651 784Building material & garden equipment & supplies dealers 153 393,004 47,015 2,347Food & beverage stores 208 580,782 51,650 4,953Health & personal care stores 146 184,213 25,379 1,737Gasoline stations 197 386,213 19,777 1,464Clothing & clothing accessories stores 312 236,909 28,039 2,418Sporting goods, hobby, book, & music stores 114 116,251 13,202 1,197General merchandise stores 58 - - (5000-9999) Miscellaneous store retailers 195 - - (1000-2499) Nonstore retailers 50 44,691 8,047 396Source: US Census Bureau
PARISH OF EAST BATON ROUGE, LOUISIANA – BREC STRATEGIC PLAN Chapter 2 – Demographic Report
2-21
Economists see growth, slowly, in BR By SARA BONGIORNI Advocate business writer Like the state, the local economy will shake off three years of job losses in 2004 but will remain in a funk for the next two years as the chemical industry continues to lose jobs, a team of economists concludes in a new economic forecast. Baton Rouge will gain 1,900 new jobs during the next two years to 303,900, but nowhere near enough to offset the 6,000 lost during the past three years. The rate of growth -- just 0.6 percent for the two-year period -- also will make East and West Baton Rouge, Livingston and Ascension parishes the slowest job-producing region in the state, according to the Louisiana Economic Outlook for 2004-05. The authors of the annual forecast are Loren Scott and James Richardson of LSU and A.M.M. Jamal of Southeastern Louisiana University. Two factors will pose special challenges for the Baton Rouge economy in the next two years, Scott said. The region has lost 2,400 manufacturing jobs in the past three years and stands to lose another 1,000 manufacturing jobs through 2004-05, many of them in chemical manufacturing. Chemical industry losses statewide total 4,000 jobs in three years, with 1,800 more expected. Firms announcing employment cuts include Formosa Plastics, ExxonMobil, DSM Elastomers and Triad Industries, all in the greater Baton Rouge area. Chemical industry layoffs in turn will hurt the construction sector, whose lifeblood has been industrial projects at petrochemical plants. Those projects have been put on hold as chemical plants battle high costs. Industrial engineering firms in Baton Rouge "don't have any plans on their desks," Scott said. Industrial plants are "hunkering down" to survive current market conditions, he said. The area's new "severe" rating under federal ozone regulations also means industrial expansion projects will become more difficult, Scott said. Fines linked to the problem could cost regional industry $100 million and push up regional gasoline costs by $44 million annually, he said. Still, Scott pointed to bright spots in the forecast for the Baton Rouge region. Non-industrial construction, including new state buildings and downtown projects, will help offset losses in industrial construction, he said. Other sources of expected growth include as many as 350 jobs at The Football Network's new Baton Rouge headquarters; Transgenres, a planned biotechnology company springing from research at LSU's School of Veterinary Medicine that could create 500 jobs; and new research at Pennington Biomedical Research Center, the forecast said. In sum, "We think Baton Rouge will grow, but we will struggle," Scott said. Source: The Advocate, Newspaper for the Parish of East Baton Rouge, Louisiana
PARISH OF EAST BATON ROUGE, LOUISIANA – BREC STRATEGIC PLAN Chapter 2 – Demographic Report
2-22
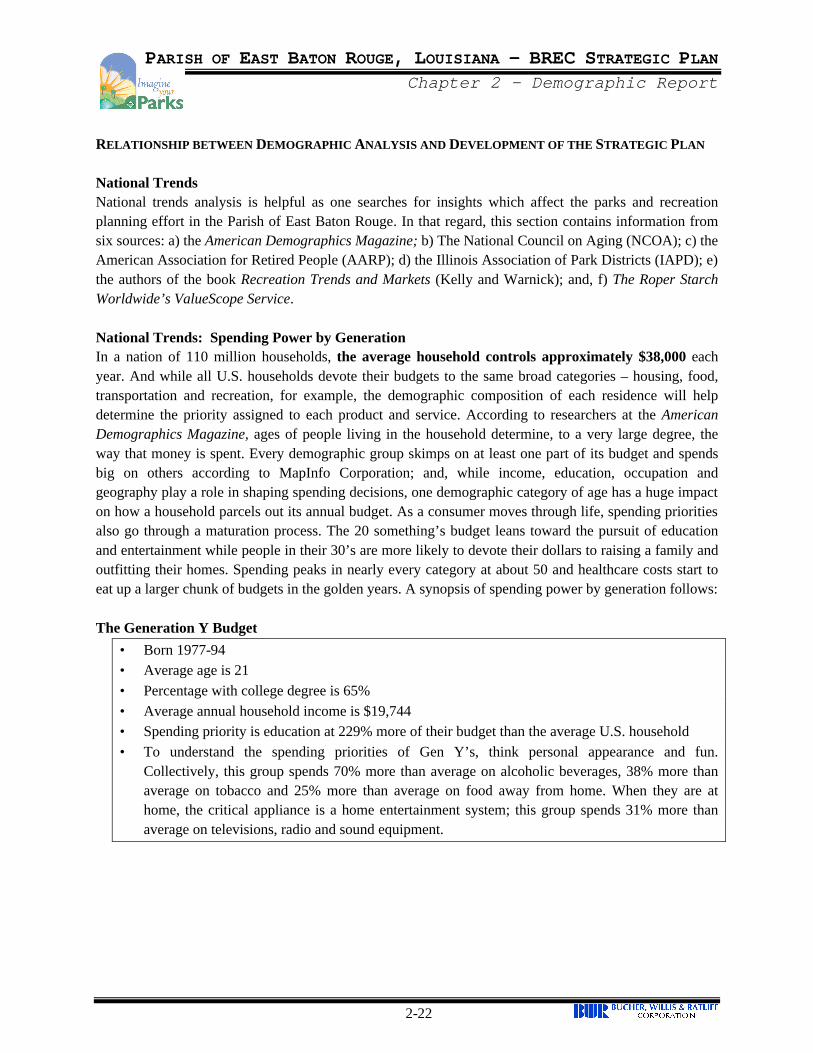
RELATIONSHIP BETWEEN DEMOGRAPHIC ANALYSIS AND DEVELOPMENT OF THE STRATEGIC PLAN National Trends National trends analysis is helpful as one searches for insights which affect the parks and recreation planning effort in the Parish of East Baton Rouge. In that regard, this section contains information from six sources: a) the American Demographics Magazine; b) The National Council on Aging (NCOA); c) the American Association for Retired People (AARP); d) the Illinois Association of Park Districts (IAPD); e) the authors of the book Recreation Trends and Markets (Kelly and Warnick); and, f) The Roper Starch Worldwide’s ValueScope Service. National Trends: Spending Power by Generation In a nation of 110 million households, the average household controls approximately $38,000 each year. And while all U.S. households devote their budgets to the same broad categories – housing, food, transportation and recreation, for example, the demographic composition of each residence will help determine the priority assigned to each product and service. According to researchers at the American Demographics Magazine, ages of people living in the household determine, to a very large degree, the way that money is spent. Every demographic group skimps on at least one part of its budget and spends big on others according to MapInfo Corporation; and, while income, education, occupation and geography play a role in shaping spending decisions, one demographic category of age has a huge impact on how a household parcels out its annual budget. As a consumer moves through life, spending priorities also go through a maturation process. The 20 something’s budget leans toward the pursuit of education and entertainment while people in their 30’s are more likely to devote their dollars to raising a family and outfitting their homes. Spending peaks in nearly every category at about 50 and healthcare costs start to eat up a larger chunk of budgets in the golden years. A synopsis of spending power by generation follows: The Generation Y Budget
• Born 1977-94 • Average age is 21 • Percentage with college degree is 65% • Average annual household income is $19,744 • Spending priority is education at 229% more of their budget than the average U.S. household • To understand the spending priorities of Gen Y’s, think personal appearance and fun.
Collectively, this group spends 70% more than average on alcoholic beverages, 38% more than average on tobacco and 25% more than average on food away from home. When they are at home, the critical appliance is a home entertainment system; this group spends 31% more than average on televisions, radio and sound equipment.
PARISH OF EAST BATON ROUGE, LOUISIANA – BREC STRATEGIC PLAN Chapter 2 – Demographic Report
2-23
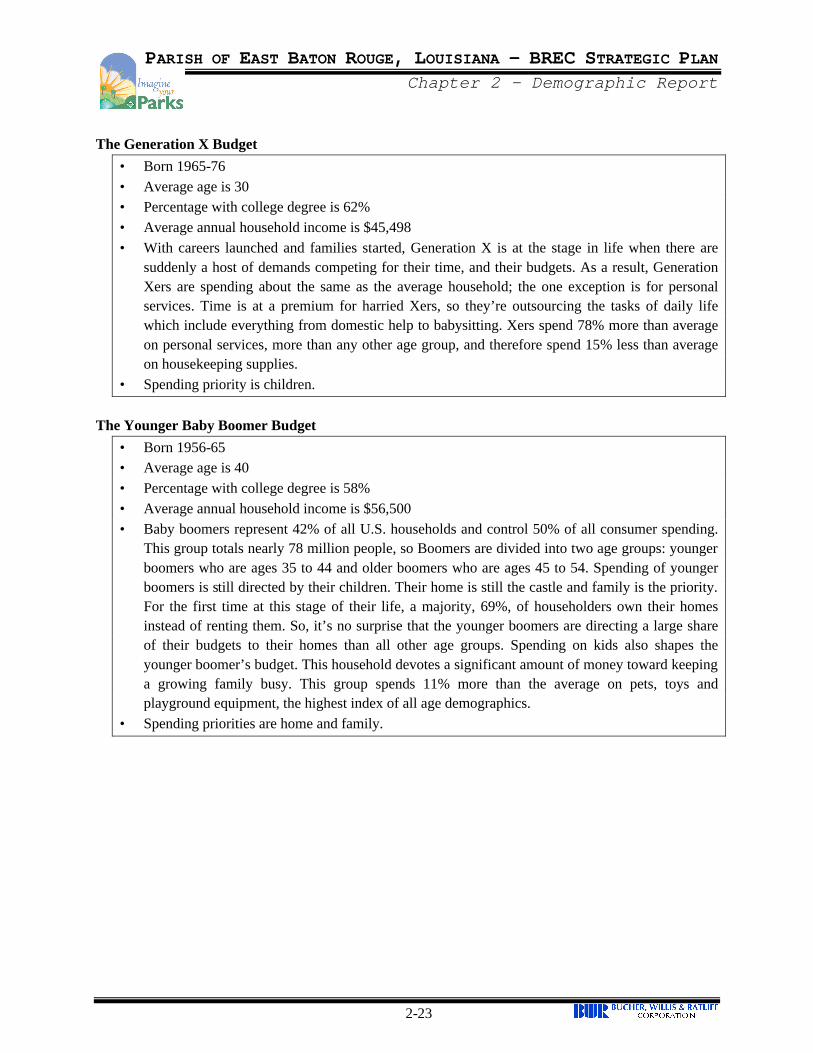
The Generation X Budget • Born 1965-76 • Average age is 30 • Percentage with college degree is 62% • Average annual household income is $45,498 • With careers launched and families started, Generation X is at the stage in life when there are
suddenly a host of demands competing for their time, and their budgets. As a result, Generation Xers are spending about the same as the average household; the one exception is for personal services. Time is at a premium for harried Xers, so they’re outsourcing the tasks of daily life which include everything from domestic help to babysitting. Xers spend 78% more than average on personal services, more than any other age group, and therefore spend 15% less than average on housekeeping supplies.
• Spending priority is children. The Younger Baby Boomer Budget
• Born 1956-65 • Average age is 40 • Percentage with college degree is 58% • Average annual household income is $56,500 • Baby boomers represent 42% of all U.S. households and control 50% of all consumer spending.
This group totals nearly 78 million people, so Boomers are divided into two age groups: younger boomers who are ages 35 to 44 and older boomers who are ages 45 to 54. Spending of younger boomers is still directed by their children. Their home is still the castle and family is the priority. For the first time at this stage of their life, a majority, 69%, of householders own their homes instead of renting them. So, it’s no surprise that the younger boomers are directing a large share of their budgets to their homes than all other age groups. Spending on kids also shapes the younger boomer’s budget. This household devotes a significant amount of money toward keeping a growing family busy. This group spends 11% more than the average on pets, toys and playground equipment, the highest index of all age demographics.
• Spending priorities are home and family.
PARISH OF EAST BATON ROUGE, LOUISIANA – BREC STRATEGIC PLAN Chapter 2 – Demographic Report
2-24
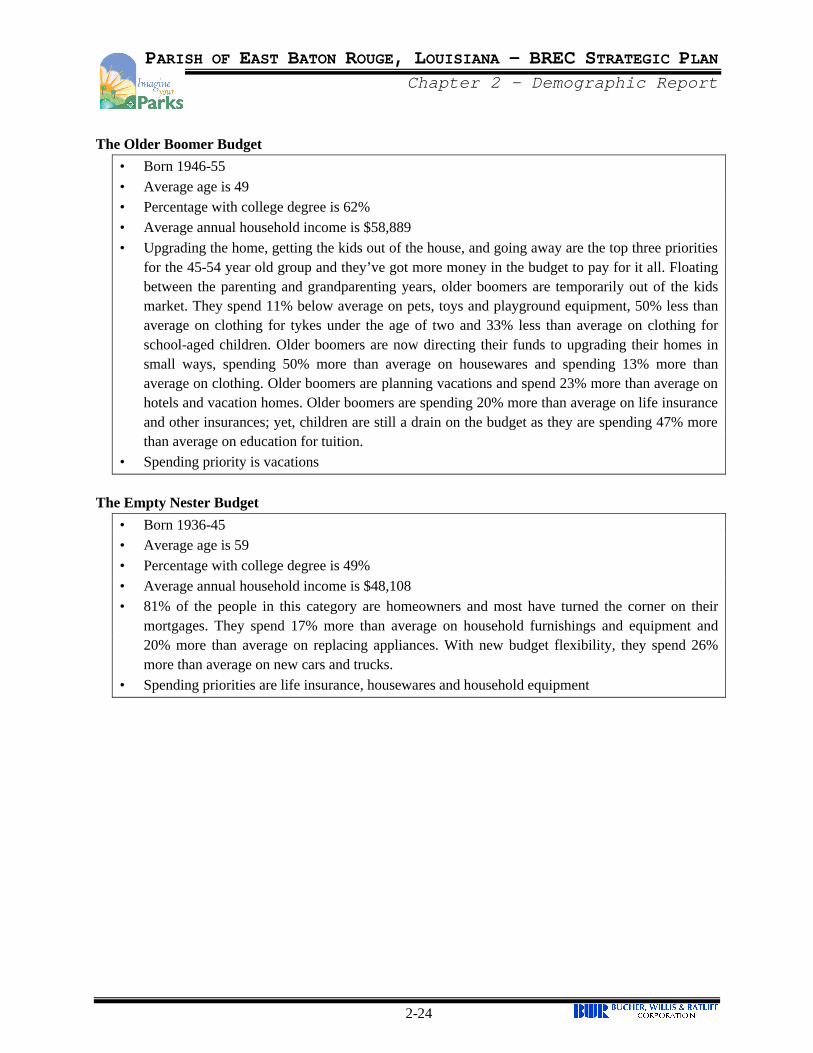
The Older Boomer Budget • Born 1946-55 • Average age is 49 • Percentage with college degree is 62% • Average annual household income is $58,889 • Upgrading the home, getting the kids out of the house, and going away are the top three priorities
for the 45-54 year old group and they’ve got more money in the budget to pay for it all. Floating between the parenting and grandparenting years, older boomers are temporarily out of the kids market. They spend 11% below average on pets, toys and playground equipment, 50% less than average on clothing for tykes under the age of two and 33% less than average on clothing for school-aged children. Older boomers are now directing their funds to upgrading their homes in small ways, spending 50% more than average on housewares and spending 13% more than average on clothing. Older boomers are planning vacations and spend 23% more than average on hotels and vacation homes. Older boomers are spending 20% more than average on life insurance and other insurances; yet, children are still a drain on the budget as they are spending 47% more than average on education for tuition.
• Spending priority is vacations The Empty Nester Budget
• Born 1936-45 • Average age is 59 • Percentage with college degree is 49% • Average annual household income is $48,108 • 81% of the people in this category are homeowners and most have turned the corner on their
mortgages. They spend 17% more than average on household furnishings and equipment and 20% more than average on replacing appliances. With new budget flexibility, they spend 26% more than average on new cars and trucks.
• Spending priorities are life insurance, housewares and household equipment
PARISH OF EAST BATON ROUGE, LOUISIANA – BREC STRATEGIC PLAN Chapter 2 – Demographic Report
2-25
The Senior Budget
• Born 1935 and earlier • Average age is 75 • Percentage with college degree is 36% • Average annual household income is $25,220 • Fixed incomes mean tighter budgets, and as many seniors transition into their retirement years,
average household income and spending declines substantially. Seniors spend money maintaining what they’ve already accumulated. Preserving the home, for example, eats up a large share of the budget – 86% more than in the average household. Given the amount of time spent at home, seniors also direct a larger chunk of their budgets to food to be eaten there. For example, they spend 50% more than average on fresh fruits and vegetables, 33% more than average on fresh milk and cream and 25% more than average on baked goods. And while a growing number of seniors are in good health, the data shows that seniors spend an average of $3,247 a year on health care, six times more than the average person under the age of 25.
• Spending priorities are health care. NATIONAL TRENDS: CONSUMER BEHAVIOR IS DRIVEN BY NATIONALITY, LIFESTAGE AND VALUES According to The Roper Starch Worldwide’s ValueScope Service, three main factors drive consumer behavior: nationality, lifestage and values. With few exceptions, nationality – encompassing people’s social, economic and cultural environment – has been and remains the major driver. It has been the key force behind social evolution over the past 200 years. Lifestage includes demographic measures of age, family status and employment status and is the main driver in sports participation, health-related concerns, print media usage and certain leisure interests and activities. Besides nationality and lifestage, people are also united by personal values. The World’s Top Ten Values
1. Protecting the family 2. Honesty 3. Health and fitness 4. Self-esteem 5. Self-reliance 6. Justice 7. Freedom 8. Friendship 9. Knowledge 10. Learning
PARISH OF EAST BATON ROUGE, LOUISIANA – BREC STRATEGIC PLAN Chapter 2 – Demographic Report
2-26
National Trends: Projections
• Families will be smaller, there will be more households headed by single adults which will outnumber married couples with children, more unstable marriages, higher education levels and greater population segments in retirement and “very old” periods of the life course with 4 to 6 generations of adults.
• Many children will be unsupervised. • People will continue working long hours. • People are moving from the cities. • An infinite expansion of the annual average household income spent on recreation cannot
continue beyond the current average of 8% as other demands on the budget are increasing at a very fast pace.
• The distance costs of traveling to recreation programs continue to mount. • Travel opportunities will continue to be important for adults. • Developmental aims for families with children will be important in selecting recreation
investments. • Every younger generation will have a higher level of education with consequent variety of leisure
interests and experiences. Level and quality of education are significant predictors of recreational behavior, especially in the arts and developmental activities.
• The trend toward securing a block of time, long weekends as well as vacations, for leisure opportunities will continue. Travel-based activity will remain special but somewhat more frequent with mini vacations punctuating the time between major vacations.
• The trend toward more self-reliance and independence for women will also continue. National Trends: Market Segmentation Market segmentation should be considered when designing programs. Segmentation categories include both stable and changing market segments.
1. Stable market segments include high-end consumers, blue collar workers and the poverty class. High-end consumers have sufficient income and assets to afford major expenditures for whatever leisure they value most. Blue collar workers tend to spend their discretionary leisure dollars prior to age 50 on close-to-home activities with low cost thresholds. The poverty class will pursue leisure activities close to home and relatively cost free.
2. Changing market segments include the new class with university degrees and managerial or
technical employment and the middle class. The new class has considerable discretionary income and expect to spend it on leisure. They take the nurturing of one or two children very seriously and almost all are married and dual income households. The middle class will likely have two incomes, experience marital instability and have small families. Their tastes are not sophisticated but they enjoy social activity. They travel on a budget and usually by car. They tend to be very price conscious but may invest in major items such as boats or vehicles that facilitate major interests employing local and regional resources.
PARISH OF EAST BATON ROUGE, LOUISIANA – BREC STRATEGIC PLAN Chapter 2 – Demographic Report
2-27
National Trends: Baby Boomers Baby Boomers are creating a new definition of retirement; they differ greatly from those 65 and over in their reasons for retirement. 70% of mature workers, many of them the leading edge of the baby boomer generation are employed full-time and doing so by choice. It is important for employers to realize that for older workers, the human elements of a job are critical: a friendly atmosphere, respect from managers and co-workers, and opportunities for learning and growth. The New Seniors do not consider themselves old. They are young at heart and of age. The face of retirement is changing. Income, health and work ethic all factor into decisions about retirement. Downsizing, right-sizing and retirement packages too good to pass up may bring on early retirement. Many of these retirees will be healthy, educated and will have the time and money to participate in leisure programs. For example:
• Not everyone has a place in Florida or Arizona. Many new seniors are staying in place longer than you think. Thus, winter will not always be your slow time; strong year-round programs will become more important than ever.
• People are living longer, healthier lives. Life expectancy rates have soared over he last 50 years
and show no sign of slowing down. In 1900, life expectancy was 46. By 2010, women are expected to live an average of 86 years, men to 81.2. Our fitness, health/wellness and educational programs are often just the medicine they are looking for.
• Leisure activities that focus on learning new skills are important to the new senior. AARP
research suggests that 62% of older adults are interested in learning more about favorite leisure activities.
• Travel is a gateway to new members. Today’s travelers are young in spirit and heart. They don’t
want to take the same trips their parents took. Seniors hold half of all passports issued in America, even though they only make up 30% of the population. Active travel programs create win/win situations for agencies and their older adults. These programs are the gateway to young, new members, allow patrons to travel within the safety net of our agencies and are probably one of the most efficient ways to generate revenue.
• Many older adults perceive themselves to be 14 years younger than they are. Programs your
agency provides for your general adult population will be well received by the new senior population.
• Not everything you offer should be, or has to be, free. According to AARP, the new senior is
willing to spend up to $101 on an interest they have always wanted to try. For the new senior, free programs and services aren’t always the ticket. As a matter of fact, free services may turn them off. This group is comprised of savvy consumers who will comparison-shop other agencies and venues. Although value is always an important factor to consider, perceived quality is equally as important.
PARISH OF EAST BATON ROUGE, LOUISIANA – BREC STRATEGIC PLAN Chapter 2 – Demographic Report
2-28
• Great places to monitor local and national trends are in the USA Today, Newsweek, The Wall Street Journal, LERN Publications and American Demographics.
• Based on trends, some hot programs are: fitness and the mind-body connection, home
improvement, dancing, foreign language, one-day and extended trips and volunteering.
• Offer programs which meet varied abilities. For example, a well-rounded fitness program includes offerings that appeal to the couch potato wanting to start a fitness program through the competitive, fit athlete. Many programs have the ability to adjust to fitness levels within a program.
• Meeting the demand for a wide range of program interests and income levels is a considerable
task. Offer a wide variety of programs with the full spectrum of prices and physical abilities. Balance your offering price wisely so that everyone can attend.
National Trends: Basic Baby Boomer Facts
• Another baby boomer turns 50 every 7 seconds • By 2005, 42% of Americans over the age of 50 will be baby boomers with the number of 50-
something boomers expected to peak to 42.8 million in 2015. • Look for them to pursue individualistic escapes, healthy pleasures, youthful opportunities, quests
for self-improvement and personal development, customized leisure experiences • Their slogan will be “reinvent not retire”
PARISH OF EAST BATON ROUGE TRENDS AND PLANNING IMPLICATIONS Popular Programs by Age Group Generation Y – this age group will get many of its activities at school; they like drop-in activities at Parish facilities for fitness, weight room and open gymnasium. Generation X – this age group will need services to accommodate its busy schedule; they like classes which are shorter in length (4 week classes or 1 day workshops); child care, drop-in fitness facilities, Friday night drop-in programs where they can have supervised care so they can have a few hours to themselves as parents, sports camps, after school programs. Younger Boomers – this age group typically has kids in school; they like one day seminars for learning opportunities such as financial planning, photography and gardening; and fitness programs. Older Boomers – this age group will need fitness and wellness classes, hobby programs such as quilting and has more discretionary income to spend on trips than younger ages. Empty Nesters – this age group will need low impact fitness and wellness classes and they particularly like the social element of programs in which they participate.
PARISH OF EAST BATON ROUGE, LOUISIANA – BREC STRATEGIC PLAN Chapter 2 – Demographic Report
2-29
Seniors – this age group needs low impact fitness and wellness programs such as chair aerobics; they like the social interaction provided in programs; meal functions are big and services such as income tax assistance, trips, grocery shopping, Wal-Mart trips and meals at restaurants are popular; and, activities are limited to day-time as many do not drive at night.