park-and-ride lot study...park‐and‐ride lot study page i final report (draft) the opinions,...
TRANSCRIPT

Park-and-RideLot Study
Final ReportSeptember 2014
Submitted by In association with

Park‐and‐Ride Lot Study Page I Final Report (Draft)
The opinions, findings, and conclusions in this publication are those of the author(s) and those individuals who are responsible for the facts and the accuracy of the data presented herein. The
contents of this report do not necessarily reflect the views or policies of the Department of Transportation, State of Georgia, the Federal Highway Administration, or the Federal Transit
Administration. This report does not constitute a standard, specification of regulation.
The Chatham County-Savannah Metropolitan Planning Commission (MPC) and Coastal Region Metropolitan Planning Organization (CORE MPO) are committed to the principle of affirmative action and prohibit discrimination against otherwise qualified persons on the basis of race, color,
religion, national origin, age, physical or mental handicap, or disability, and where applicable, sex (including gender identity and expression), marital status, familial status, parental status, religion,
sexual orientation, political beliefs, genetic information, reprisal, or because all or part of an individual's income is derived from any public assistance program in its recruitment, employment,
facility and program accessibility or services.
Prepared in cooperation with and funding from the U.S. Department of Transportation, Federal Highway Administration and Federal Transit Administration and the Georgia Department of
Transportation.

Park‐and‐Ride Lot Study Page II Final Report (Draft)
COASTAL REGION METROPOLITAN PLANNING ORGANIZATION
Chairman Al Scott Chatham County Commission
James Aberson, Chairman CORE MPO Advisory Committee on Accessible Transportation Lt. Col. Clarence W. Bowman III, Garrison Commander Hunter Army Airfield Mayor Jason Buelterman City of Tybee Island Shedrick Coleman, Chairman Chatham County-Savannah Metropolitan Planning Commission Stephanie Cutter, City Manager City of Savannah Mark Egan, Chairman CORE MPO Citizens Advisory Committee Curtis J. Foltz, Executive Director Georgia Ports Authority Keith Golden, Commissioner Georgia Department of Transportation Mayor Tennyson Holder City of Garden City William W. Hubbard, President and CEO Savannah Area Chamber of Commerce Mayor James Hungerpiller Town of Vernonburg
Mayor Edna Jackson City of Savannah Mayor Glenn Jones City of Port Wentworth Gregory B. Kelly, Executive Director Savannah Airport Commission Mayor Mike Lamb City of Pooler Pete Liakakis, Chairman Chatham Area Transit Authority Board of Directors Chadwick Reese, Executive Director Chatham Area Transit Authority Lee Smith, County Manager Chatham County Mayor Beth Goette Town of Thunderbolt Mayor Ben Rozier City of Bloomingdale Trip Tollison, President and CEO Savannah Economic Development Authority
Park‐and‐Ride Lot Study Page iii Final Report (Draft)
COASTAL REGION METROPOLITAN PLANNING ORGANIZATION TECHNICAL COORDINATING COMMITTEE
Chairman Tom Thomson, Executive Director
Chatham County-Savannah Metropolitan Planning Commission John Bennett Savannah Bicycle Campaign
Robert H. Bonner Jr., Vice President LDH Corporation
Robbie Byrd, Director of Planning and Public Works City of Pooler
Phillip Claxton, City Administrator City of Port Wentworth
Stephanie Cutter, City Manager City of Savannah Leon Davenport, County Engineer Chatham County
Curtis J. Foltz, Executive Director Georgia Ports Authority
Will Ingram, Master Planning Branch Chief Fort Steward/Hunter Army Airfield
Karon Ivery, District Engineer Georgia Department of Transportation
Gregory B. Kelly, Executive Director Savannah Airport Commission
Aries Little, Transportation Planner Georgia Department of Transportation
Lupita McClenning Coastal Regional Commission
Caroline Nguyen, Town Administrator Town of Thunderbolt
Dianne Otto, Planning and Zoning Manager City of Tybee Island
Chadwick Reese, Executive Director Chatham Area Transit Authority
Peter Shonka, Assistant City Manager City of Savannah
Lee Smith, County Manager Chatham County
Vice President Savannah Area Chamber of Commerce
Mike Weiner, Traffic Engineering Director City of Savannah
Mark Wilkes, Director of Transportation Planning Chatham County-Savannah Metropolitan Planning Commission
Director of Planning and Economic Development City of Garden City
Superintendent of Terminals Norfolk Southern Railroad Industry
Terminal Manager CSX Transportation
Vice Chair CORE MPO Citizens Advisory Committee
Vice Chair CORE MPO Advisory Committee on Accessible Transportation

Park‐and‐Ride Lot Study Page IV Final Report (Draft)
COASTAL REGION METROPOLITAN PLANNING ORGANIZATION
CITIZENS ADVISORY COMMITTEE
Chairman Mark Egan Chatham County
Anthony H. Abbott Chatham County Nicholas Allen-Tunsil City of Savannah Thomas E. Branch, III City of Savannah Daniel Brantley Chatham County John Chapman City of Savannah Gerald Cook City of Bloomingdale Phillip Cooper Chatham County Phyllis Hardeman Town of Thunderbolt Paula Kreissler City of Savannah Larry Longo City of Port Wentworth Helen McCracken Town of Thunderbolt
Christopher Middleton City of Savannah Larry Miles City of Savannah Harris Odell Chatham County Ryan Sewell City of Savannah Linda Smith City of Port Wentworth Joseph Steffen Chatham County Dale Thorpe Chatham County Robert Tully Chatham County
Park‐and‐Ride Lot Study Page V Final Report (Draft)
COASTAL REGION METROPOLITAN PLANNING ORGANIZATION ADVISORY COMMITTEE ON ACCESSIBLE TRANSPORTATION
Chairman James Aberson Chatham County
Kim Anderson, Project Manager Teleride
Mohsen Badran, Executive Director Goodwill Industries of the Coastal Empire
Denise Boehner Savannah Council of the Blind
William K. Broker, Managing Attorney Georgia Legal Services
Wayne Dawson, Executive Director Savannah - Chatham County Fair Housing Council
Jan Elders Savannah-Chatham Council on Disability Issues
Yolanda Fontaine, Resident Service Coordinator Housing Authority of Savannah
William Gardener National Federation of the Blind
Bob Habas Living Independence for Everyone Inc.
Patricia Heagarty Interested Citizen Carol Hunt, Executive Secretary NAACP - Savannah Branch Hunter Hurst, Executive Director Georgia Infirmary Day Center for Rehabilitation
McArthur Jarrett Interested Citizen Robert Kozlowski, Executive Director Kicklighter Resource Center Tom Lamar Interested Citizen Jane Love, Transportation Planner Chatham County-Savannah Metropolitan Planning Commission Patti Lyons, President Senior Citizens Savannah - Chatham County Inc. Jessie Fernandez-Gatti, Transit Planner Chatham Area Transit Authority
Clealice Timmons, Ancillary Supervisor Coastal Center for Development Services Steve Tomlinson Intermodal Program District Representative Georgia Department of Transportation Terri White Savannah Association of the Blind Ettajane Williams-Robbins Interested Citizen Leslie Wilson Economic Opportunity Authority
Park‐and‐Ride Lot Study Page vi Final Report (Draft)
COASTAL REGION METROPOLITAN PLANNING ORGANIZATION
STAFF MEMBERS
Thomas L. Thomson, PE, AICP, Executive Director Chatham County-Savannah Metropolitan Planning Commission Mark Wilkes, PE, AICP, Director of Transportation Planning Chatham County-Savannah Metropolitan Planning Commission Zhongze (Wykoda) Wang, Transportation Administrator Chatham County-Savannah Metropolitan Planning Commission Jane Love, Transportation Planner Chatham County-Savannah Metropolitan Planning Commission Jessica Hagan, Administrative Assistant Chatham County-Savannah Metropolitan Planning Commission

Park‐and‐Ride Lot Study Page vii Final Report (Draft)
PRIME CONSULTING FIRM: CONNETICS TRANSPORTATION GROUP
SUB-CONSULTING FIRMS: SYMBIOSCITY
MOFFATT & NICHOL
CONSULTANT STAFF MEMBERS
James Baker, Vice President Connetics Transportation Group Milbrey Heard, AICP, Vice President Connetics Transportation Group Denise Grabowski, AICP, Principal Symbioscity Joel Graeff, AICP, Senior Transportation Planner Moffatt & Nichol
Park‐and‐Ride Lot Study Page viii Final Report (Draft)
Thank you to the community stakeholders who provided extensive input and feedback during the development of this study and recommendations. Your time, participation, and interest are most
sincerely appreciated. The stakeholder groups listed below participated through interviews, small group meetings, and/or regularly-scheduled stakeholder committee meetings.
Armstrong Atlantic State University
Bryan County Chatham Area Transit City of Richmond Hill
City of Rincon City of Savannah
Coastal Regional Commission of Georgia Crossroads Owners Association
Effingham County Effingham County Chamber of Commerce
Effingham County Industrial Development Authority Georgia Ports Authority
Georgia Southern University Gulfstream
Hunter Army Airfield /Ft. Stewart Jasper County
Lowcountry Council of Governments Memorial Health Palmetto Breeze
Richmond Hill-Bryan County Chamber of Commerce Savannah State University
Savannah Technical College Savannah-Chatham County Public School System
Savannah Economic Development Authority (SEDA)

Park‐and‐Ride Lot Study Page ix Final Report (Draft)
Table of Contents Executive Summary ....................................................................................................................................... 1
Introduction and Study Objectives ............................................................................................................... 4
Existing Park‐and‐Ride Lots in the Greater Savannah Area .......................................................................... 6
Greater Savannah Demographics ................................................................................................................. 8
Greater Savannah Employment .................................................................................................................. 11
Savannah’s Major Commute Corridors ....................................................................................................... 13
Proposed Park‐and‐Ride Lot Locations ....................................................................................................... 14
Park‐and‐Ride Lot Development Costs ....................................................................................................... 17
Transit Service Opportunities ..................................................................................................................... 20
Implementing the Park‐and‐Ride Program ................................................................................................. 29
List of Figures Figure ES‐1: Recommended Park‐and‐Ride Lot Locations ............................................................................ 3
Figure 1: Park‐and‐Ride Study Area .............................................................................................................. 5
Figure 2: Existing Park‐and‐Ride Lot Locations ............................................................................................. 7
Figure 3: 2000 to 2010 Population Change for the Seven‐County Region ................................................... 9
Figure 4: County‐Level Population Estimates and 2040 Projections .......................................................... 10
Figure 5: Proportion of Employment by Location, 2009‐2011 ACS ............................................................ 11
Figure 6: Recommended Park‐and‐Ride Lot Locations ............................................................................... 16
Figure 7: Northwest Corridor Proposed Transit Routes ............................................................................. 21
Figure 8: West Corridor Proposed Transit Routes ...................................................................................... 22
Figure 9: South Corridor Proposed Transit Routes ..................................................................................... 23
List of Tables Table 1: Proportion of Employment by Location, 2009‐2011 ACS ............................................................. 11
Table 2: CORE MPO Travel Demand Model Employment Data .................................................................. 12
Table 3: Order of Magnitude Park‐and‐Ride Lot Capital and Annual Maintenance/Lease Costs ............... 19
Table 4: Proposed Transit Service Plan to/from Downtown Savannah ...................................................... 24
Table 5: Proposed Transit Service Plan to/from Airport/Gulfstream/Crossroads Area ............................. 25
Table 6: Estimated Annual O&M Costs (2014 dollars) ................................................................................ 27
Table 7: 2040 Horizon Year Revenue and Subsidy Estimates ..................................................................... 28

Park‐and‐Ride Lot Study Page 1 Final Report (Draft)
Executive Summary
This Park‐and‐Ride Study of the Coastal Region Metropolitan Planning Organization (CORE MPO) has
evaluated the feasibility of implementing a regional park‐and‐ride lot program for the Coastal Savannah
region.
Analyses of the commuter travel market in the greater Savannah region clearly show that demand for
expanded park‐and‐ride facilities is present today. While completing fieldwork for this project, it was
quite evident that there is a significant amount of informal park‐and‐ride (carpool) activity at
commercial businesses around the Savannah region (e.g., parking at the fringe of grocery and hardware
store parking lots). The provision of safe and convenient formal park‐and‐ride lots will further
encourage rideshare activities in the short term, with possible provision of commuter transit services in
the longer‐term.
A regional park‐and‐ride program, with the promotion of ridesharing activities and potential commuter
transit services will benefit local governments, area employers and the region’s commuters. Local
governments and employers will benefit from the reduced need for parking at destination locations.
The proposed transit service plan presented in this study can result in a reduced need of more than 400
parking spaces for Downtown Savannah and the Airport/Gulfstream/Crossroads area. The
encouragement of carpooling would further reduce parking demand at all major employment
destinations. Rideshare activities also benefit local governments by reducing traffic volumes on the
region’s congested roadways.
There is also a financial benefit for park‐and‐ride users. Carpoolers and transit riders to Downtown
Savannah could save an average of $6.00 in fuel charge per day (based on average commute distances)
and save in parking costs (monthly parking at the City’s parking garages ranges from $30 to $80).
Further savings would be realized by park‐and‐ride users from the reduction of automobile maintenance
costs. Environmental benefits would be realized in the form of reduced air pollution.
An extensive evaluation of regional commute patterns has determined that the three primary long‐
distance commute corridors in the region are:
The Northwest (SR 21) Corridor,
The West (I‐16 and US 80) Corridor, and
The South (I‐95 and US 17) Corridor.
There are Georgia Department of Transportation (GDOT) park‐and‐ride facilities in each of these
corridors. However, they tend to be small in size and in need of improvements such as signing and
lighting. New and expanded park‐and‐ride lots are proposed in each corridor. Figure ES‐1 shows the
general proposed locations for these park‐and‐ride lots. An initial supply of approximately 150 spaces is
proposed for each corridor, to be expanded to approximately 200 spaces in each corridor as demand
increases over time.

Park‐and‐Ride Lot Study Page 2 Final Report (Draft)
Some of the proposed locations are existing park‐and‐ride lots (e.g., I‐95 and SR 21), where
improvement or expansion is warranted. Other proposed locations would require either construction of
a new lot or a shared use lease with an existing property owner (e.g., a shopping center or a church).
For purposes of preparing a cost estimate, a development scenario was assumed that includes a mix of
park‐and‐ride lot expansion, new lot construction and shared use lease arrangements. Estimated capital
costs (in 2014 dollars) are as follows:
Initial Supply (about 150 spaces in each corridor) = $3 million
Horizon Year Supply (about 200 spaces in each corridor = Additional $1.3 million
Total Capital Cost Estimate = $4.3 million
Estimated annual parking lot maintenance and lease costs are $70,000 a year for the initial proposed
supply, increasing to just over $90,000 a year for the proposed horizon year supply. Note that this cost
estimate assumes specific assumptions with regards to existing lot expansion, new lot construction and
shared use lease arrangements. These cost estimates could change, depending on the actual lot
development process.
Additional analysis was completed to determine the feasibility of regional transit services to the
proposed regional park‐and‐ride lots. The two employment destinations that were determined to have
the greatest feasibility for regional transit service were Downtown Savannah and the
Gulfstream/Crossroads/Airport area. Hunter Army Airfield may also be viable at some point –
particularly from the south I‐95/US 17 corridor. However, the current demand for Hunter Army Airfield
commuters was not as strong as the other two locations, thus was not included as a potential “first tier”
of regional commuter transit service.
A transit service plan was prepared that assumes three morning and three afternoon transit trips from
each corridor to both Downtown Savannah and the Gulfstream/Crossroads/Airport area, with
guaranteed ride home midday service. Costs for this service depend on the delivery of service method.
For purposes of this study, contracted service was assumed, with buses provided by the contracted
operator. Annual costs for providing regional transit service to the proposed park‐and‐ride lots are
estimated to be $1.4 million for all three corridors. Daily ridership is estimated to be 810 trips per day
by the horizon year (206,000 annual trips). Assuming a cash fare of $2.50 per trip, the annual subsidy
required to provide the transit service is $940,000. Service to/from Downtown Savannah is anticipated
to have a lower annual subsidy requirement than service to/from the Gulfstream/Crossroads/Airport
area.
It is recommended that expansion of park‐and‐ride lot spaces and ridesharing activities be realized
through a three‐pronged effort that is concentrated on the following activities:
Park‐and‐Ride Lot Development and Expansion,
Carpool & Vanpool Program Promotion, and
Regional Commuter Transit Service Implementation.

Park‐and‐Ride Lot Study Page 3 Final Report (Draft)
Activities to develop and expand park‐and‐ride lots can begin immediately, independent of the other
two activities. The other two activities, however, will not be fully successful until there is a regional
park‐and‐ride lot program. This program can be phased, with initial park‐and‐ride lot expansion
provided through shared use lease arrangements, and eventual construction of new lots. The provision
of regional commuter transit service can also be phased, and does not need to be implemented
concurrent with regional park‐and‐ride lot development.
Figure ES‐1: Recommended Park‐and‐Ride Lot Locations
Park‐and‐Ride Lot Study Page 4 Final Report (Draft)
Introduction and Study Objectives
The Coastal Region Metropolitan Planning Organization (CORE MPO) completed a Transit Mobility Vision
Plan (TMVP) in 2011. The intent of this plan was to present a regional vision for transit in the Savannah
region. One of the recommendations of this plan was the development of park‐and‐ride lots and
supporting transit services in the greater Savannah region. This Park and Ride Study has been
conducted to advance the TMVP’s park‐and‐ride lot development recommendations.
The study area of this Park and Ride Study includes Chatham County, Bryan County, Effingham County,
Bulloch County, and Liberty County in Georgia as well as Jasper County and Beaufort County in South
Carolina, and is shown in Figure 1. The primary objectives for this study are to:
Identify major travel shed corridors and trip volumes based on current and anticipated future
commuting patterns;
Identify and evaluate potential park‐and‐ride lot locations within those corridors;
Develop regional bus service plans that serve the commute corridors and park‐and‐ride lot
locations, with service plans tailored to meet anticipated demand;
Determine likely costs, revenues and potential funding sources;
Identify an implementation strategy for advancing study recommendations; and
Engage stakeholders through all phases of the project.
Five stakeholder meetings were held during the course of this study to solicit input on study findings and
recommendations. A series of stakeholder interviews were also held at the beginning of this project.
This report presents a summary of the analysis conducted and recommendations developed during
completion of this 12‐month study. Additional study information and findings can be found in the series
of Technical Memoranda that were produced during the course of this study.

Park‐and‐Ride Lot Study Page 5 Final Report (Draft)
Figure 1: Park‐and‐Ride Study Area

Park‐and‐Ride Lot Study Page 6 Final Report (Draft)
Existing Park-and-Ride Lots in the Greater Savannah Area
The Georgia Department of Transportation (GDOT) Intermodal Division offers Georgia residents a
network of park‐and‐ride lots located throughout the state. Of these, six are located within the five
Georgia counties in the study area. Figure 2 provides location information and the number of parking
spaces at each lot.
A windshield survey of these lots revealed the following general characteristics regarding utilization,
lighting, signage, accessibility, and expansion potential.
Capacity typically ranges from 20 to 35 spaces at each lot.
Utilization varies by location (40% ‐ 110%).
Limited way‐finding signage.
Most require restriping and lighting.
Expansion opportunities appear to exist at many of the locations.
The park‐and‐ride lot located at I‐95 and SR 21 has the highest utilization and is typically at capacity
during the day. The next busiest park‐and‐ride lot is located at I‐95 and SR 204. This lot is typically 60%
or more full. The remaining park‐and‐ride lots tend to be less than 50% utilized.
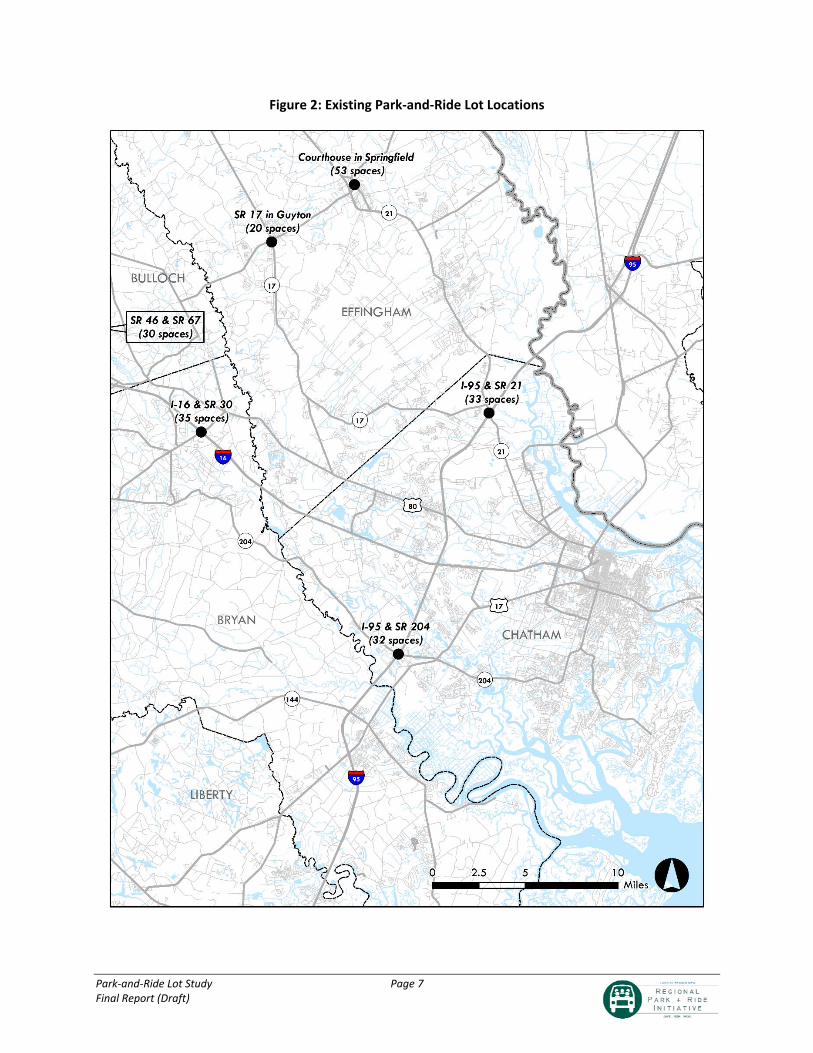
Park‐and‐Ride Lot Study Page 7 Final Report (Draft)
Figure 2: Existing Park‐and‐Ride Lot Locations
Park‐and‐Ride Lot Study Page 8 Final Report (Draft)
Greater Savannah Demographics
A comprehensive assessment of existing population and future trends is the first step in assessing park‐
and‐ride lot and regional commuter transit service needs. For this project, regional demographics have
been evaluated with U.S. Census data and demographic data that is available from the CORE MPO travel
demand model. Demographic information has been collected for the following five Georgia and two
South Carolina Counties:
Chatham County
Bryan County
Effingham County
Bulloch County
Liberty County
Jasper County (South Carolina)
Beaufort County (South Carolina)

Park‐and‐Ride Lot Study Page 9 Final Report (Draft)
Population estimates for the 2000 to 2010 decade from the U.S. Census Bureau show a steady
population increase for the seven‐county region, as illustrated in Figure 3. Overall, the region grew by
21%, adding nearly 116,000 people. Beaufort and Chatham Counties support the largest share of
population and led the region in terms of absolute population growth, growing by 41,300 and 32,800,
respectively. In terms of percentage growth, all but one county (Liberty County) experienced double‐
digit growth. Effingham and Beaufort Counties led the region with 39% and 34% growth, respectively.
Figure 3: 2000 to 2010 Population Change for the Seven‐County Region
Source: U.S. Census Bureau
Turning to more recent estimates and future projections, Figure 4 presents state estimates for 2010 and
2012 and projections for 2040. In 2010, State population estimates for the seven‐county region was
approximately 669,000 and had climbed to around 694,000 two years later. Total population for the
seven ‐ county region is anticipated to grow by nearly 23%, with the highest growth rates occurring in
Bryan and Effingham Counties (36.7% and 33.6% respectively).
0
50,000
100,000
150,000
200,000
250,000
300,000
2000 2001 2002 2003 2004 2005 2006 2007 2008 2009 2010
Chatham
Beaufort
BullochLiberty
EffinghamBryan
Jasper

Park‐and‐Ride Lot Study Page 10 Final Report (Draft)
Figure 4: County‐Level Population Estimates and 2040 Projections
Sources: 2010 & 2012: Georgia Office of Planning and Budget, South Carolina Budget &
Control Board; 2040: Georgia Statewide Model and CORE MPO Travel Demand Model
demographic data
0
50,000
100,000
150,000
200,000
250,000
300,000
350,000
2010 2012 2040
Chatham
Beaufort
Bulloch Liberty
Effingham
Bryan Jasper

Park‐and‐Ride Lot Study Page 11 Final Report (Draft)
Greater Savannah Employment
Where people work and how long it takes them to travel there are two important questions when
attempting to address access needs in the greater Savannah region. Data from the 2009 through 2011
American Community Survey (ACS) was assessed in order to answer those questions. Table 1 presents
proportions of employment for the seven‐county region by where people worked. The data shows
whether workers stayed within the county they listed as their permanent residence, traveled to a county
outside of their resident county, or traveled into a different state, which in this case was more than
likely between South Carolina and Georgia. Figure 5 graphically illustrates the same data.
Table 1: Proportion of Employment by Location, 2009‐2011 ACS
Source: U.S. Census Bureau, American Community Survey
Figure 5: Proportion of Employment by Location, 2009‐2011 ACS
2009-11 Employees
Within County
Other County
Other State
Bryan 14,078 29.70% 66.10% 4%Bulloch 28,822 74.80% 24.40% 0.80%Chatham 115,905 92.30% 5.30% 2.40%
Effingham 23,488 33.50% 61.90% 4.60%Liberty 28,328 79.10% 18.90% 1.90%
Beaufort 70,703 92.50% 3.10% 4.50%Jasper 10,455 50.30% 39.90% 9.80%
0% 10% 20% 30% 40% 50% 60% 70% 80% 90% 100%
Jasper
Beaufort
Liberty
Effingham
Chatham
Bulloch
Bryan
Within County Other County Other State
Park‐and‐Ride Lot Study Page 12 Final Report (Draft)
It is evident that workers living in Bulloch, Chatham, Liberty, and Beaufort Counties overwhelmingly stay
within their own county to work, illustrating a strong local presence of employment. Workers in Bryan,
Effingham, and Jasper Counties, however, overwhelmingly travel outside of their home counties in order
to get to work. Jasper County has the largest percentage (9.8%) of workers crossing state lines in order
to get to employment. In this case, the most likely crossing is from South Carolina into Georgia.
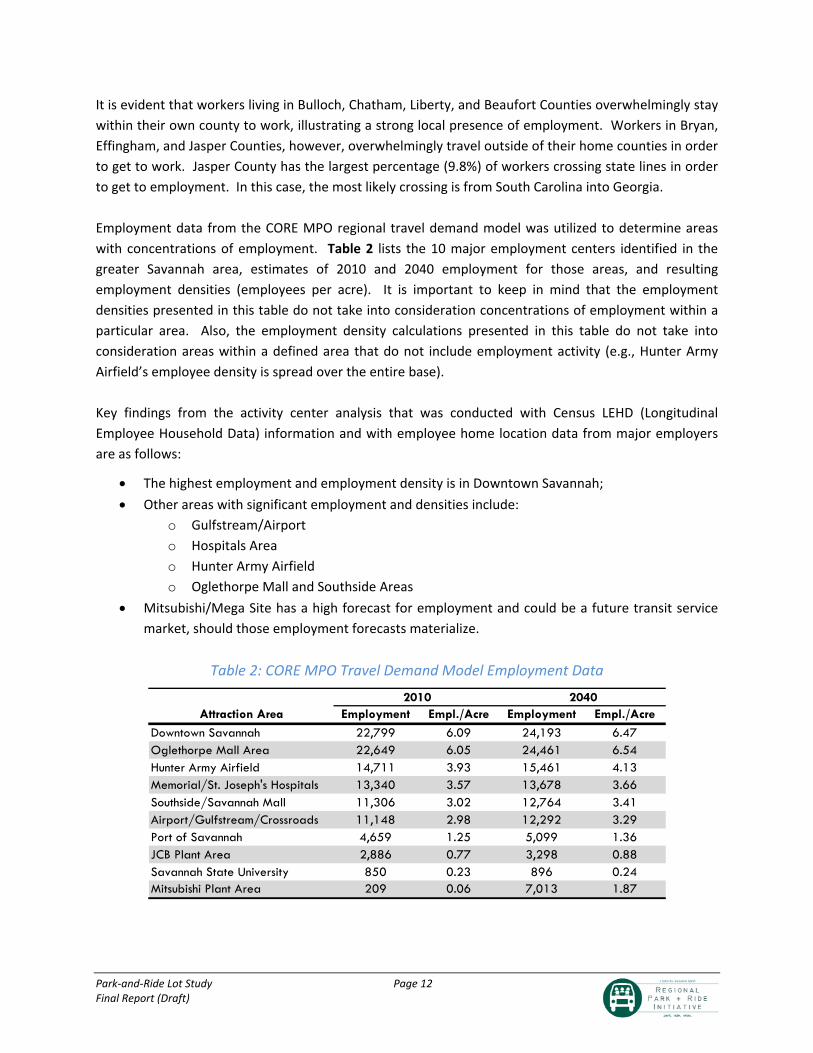
Employment data from the CORE MPO regional travel demand model was utilized to determine areas
with concentrations of employment. Table 2 lists the 10 major employment centers identified in the
greater Savannah area, estimates of 2010 and 2040 employment for those areas, and resulting
employment densities (employees per acre). It is important to keep in mind that the employment
densities presented in this table do not take into consideration concentrations of employment within a
particular area. Also, the employment density calculations presented in this table do not take into
consideration areas within a defined area that do not include employment activity (e.g., Hunter Army
Airfield’s employee density is spread over the entire base).
Key findings from the activity center analysis that was conducted with Census LEHD (Longitudinal
Employee Household Data) information and with employee home location data from major employers
are as follows:
The highest employment and employment density is in Downtown Savannah;
Other areas with significant employment and densities include:
o Gulfstream/Airport
o Hospitals Area
o Hunter Army Airfield
o Oglethorpe Mall and Southside Areas
Mitsubishi/Mega Site has a high forecast for employment and could be a future transit service
market, should those employment forecasts materialize.
Table 2: CORE MPO Travel Demand Model Employment Data
2010 2040Attraction Area Employment Empl./Acre Employment Empl./Acre
Downtown Savannah 22,799 6.09 24,193 6.47Oglethorpe Mall Area 22,649 6.05 24,461 6.54Hunter Army Airfield 14,711 3.93 15,461 4.13Memorial/St. Joseph's Hospitals 13,340 3.57 13,678 3.66Southside/Savannah Mall 11,306 3.02 12,764 3.41Airport/Gulfstream/Crossroads 11,148 2.98 12,292 3.29Port of Savannah 4,659 1.25 5,099 1.36JCB Plant Area 2,886 0.77 3,298 0.88Savannah State University 850 0.23 896 0.24Mitsubishi Plant Area 209 0.06 7,013 1.87
Park‐and‐Ride Lot Study Page 13 Final Report (Draft)
Savannah’s Major Commute Corridors
U.S. Census data (Longitudinal Employee Household Data – LEHD) was utilized to determine commuting
travel patterns to each of the ten (10) employment areas. This information identifies typical commuting
distances and the direction of travel of commuters. This information was supplemented with additional
employee home location data that was provided by Gulfstream, Home Depot (the Crossroads
distribution center), Hunter Army Airfield, and Georgia Southern University.
The spatial analysis of work travel patterns indicates that the primary long distance commuter corridors
are:
Northwest (SR 21)
West (I‐16 and US 80)
South (I‐95 and US 17)
These corridors appear to be major commuter shed corridors for multiple employment centers. For
example, the Georgia Highway 21 corridor is a major commuter corridor for Downtown Savannah and
Airport/Gulfstream employment trips. The southern I‐95 and US Highway 17 corridor is a major
commuter corridor for Downtown Savannah, Hunter Army Airfield, Southside employment zones and
the Airport/Gulfstream area.
There are existing GDOT rideshare lots within these corridors, but these lots tend to be small in size, not
well‐marked and sometimes difficult to access. It is recommended that candidate park‐and‐ride lot sites
be located in these three key long distance commuter corridors.

Park‐and‐Ride Lot Study Page 14 Final Report (Draft)
Proposed Park-and-Ride Lot Locations
Within each of the three long distance commuter corridors, several locations were identified as
potential park‐and‐ride lot sites. Preferred locations within each of these corridors were determined
through:
A comprehensive site suitability evaluation process that scored each potential park‐and‐ride lot
location;
A travel market demand analysis that estimated potential home‐to‐work travel from park‐and‐
ride catchment areas to various employment centers in the Savannah area; and
Input from stakeholders that have been participating in this project.
Recommended locations advanced for further consideration are shown in Figure 6 and are described
below.
Northwest (SR 21) Corridor
SR 21 South of Rincon is located on the boundary of Chatham and Effingham Counties. This site scored
well on the site suitability analysis and had a high number of work trips in its catchment area. This site
was also identified as a preferred location by project stakeholders. This area along SR 21 contains
numerous opportunities for joint park‐and‐ride usage (e.g., Lowe’s and a vacant grocery store’s parking
lot). There are other vacant parcels and commercial strip areas which could also be used for a lot. The
City of Rincon owns a parcel located off of SR 21 that is presently used for special events and is
eventually planned to be developed as a park.
I‐95 & SR 21 is an existing lot located in Chatham County that has a high site suitability score and a high
number of work trips in its catchment area. It was also identified by the stakeholder committee as a
preferred site. An advantage of this site is its close proximity to I‐95, making it well suited for capturing
trips from South Carolina. Expansion of the existing park‐and‐ride lot is recommended.
There are two other existing park‐and‐ride lots located in this corridor. It is recommended that the
existing lot on SR 17 in Guyton continue to be a part of the regional park‐and‐ride lot system since the
facility already exists. The existing lot at Effingham County Courthouse park‐and‐ride lot, however, is
not recommended for continued park‐and‐ride usage. This is a shared use facility that does not have
any parking spaces specifically designated for park‐and‐ride use. The courthouse parking lot is also fully
utilized on court days. Therefore, it is recommended that this lot be removed from the regional park‐
and‐ride lot system.
West (I‐16 and US 80) Corridor
It is recommended that travel in this corridor be supported by the following two park‐and‐ride lot
locations.

Park‐and‐Ride Lot Study Page 15 Final Report (Draft)
US 80 & Bloomingdale Road is a site located in Chatham County. This site scored reasonably high in the
suitability analysis and had the second highest number of work trips in its catchment area of the five
west corridor sites that were evaluated. The stakeholder committee also identified this location as a
preferred site, noting that it has the potential to capture trips from Effingham County coming in from SR
17. There are undeveloped parcels in the area that could be investigated for park‐and‐ride
development. There are few commercial uses in the area that could be used for shared park‐and‐ride
usage; however, there are some churches located in the area that could possibly be utilized.
I‐16 & US 280/SR 30 is an existing park‐and‐ride lot located in Bryan County. It did not score as well as
the US 80 and Bloomingdale Road location in the suitability analysis. The stakeholder committee noted
that this site seemed too far away from the corridor’s commuter travel shed, which was verified in the
travel market analysis. However, since the lot presently exists, and travel demand is expected to
continue to grow in this corridor, it is recommended that it continue to be a part of the regional park‐
and‐ride lot system.
South (I‐95 and US 17) Corridor
It is recommended that travel in this corridor be supported by the following two park‐and‐ride lot
locations.
US 17 in the vicinity of Wal‐Mart in Chatham County achieved a high suitability score. This location also
had the highest number of work trips in its catchment area of the seven south corridor sites that were
evaluated. It was the preferred location by stakeholders, noting it is in a location that captures demand
from both the SR 204 and US 17 corridors, and is located before peak period traffic congestion on SR
204 occurs. This area is also presently served by Chatham Area Transit (CAT). A potential new lot could
be constructed along this US 17 segment, or a joint‐use location with an existing commercial use could
be utilized. CAT is presently in the process of securing park‐and‐ride spaces at the Savannah Mall to
address near‐term park‐and‐ride needs. Longer‐term, however, this study has identified the US 17 near
Wal‐Mart as the desired location for a park‐and‐ride lot for the South Corridor.
A second location is also recommended for this corridor, either at US 17 & SR 144 or I‐95 & SR 144 in
Bryan County. The US 17 & SR 144 site scored better from a suitability standpoint. The I‐95 & SR 144
location, however, had a higher number of trips in its catchment area (second highest number of work
trips in its catchment area of the seven sites that were evaluated for this corridor). There are potential
shared use opportunities at the US 17 & SR 144 location. New park‐and‐ride lot construction would
likely be required at the I‐95 & SR 144 location.
There is an existing park‐and‐ride lot located in the South Corridor at I‐95 and SR 204. This lot is
relatively small in size and has limited expansion potential. Stakeholder committee members felt that
usage of this lot would drop if an alternative park‐and‐ride facility were provided at US 17 in the vicinity
of Wal‐Mart. It is recommended that this park‐and‐ride lot remain a part of the regional park‐and‐ride

Park‐and‐Ride Lot Study Page 16 Final Report (Draft)
lot system, but eventually be removed should demand at this location diminish as other facilities open in
this corridor.
Figure 6: Recommended Park‐and‐Ride Lot Locations
Park‐and‐Ride Lot Study Page 17 Final Report (Draft)
Park-and-Ride Lot Development Costs
For each park‐and‐ride lot, there are both one‐time capital costs and recurring annual costs. One‐time
capital costs include land acquisition, engineering costs, and construction costs. Land acquisition costs
can vary significantly from location to location depending on factors such as accessibility to major
roadways, distance from downtown, adjacent development, and existing zoning. Engineering costs,
whether for a new or an expanded park‐and‐ride lot, are an important cost component. Engineering
costs typically include preliminary engineering, final design, construction plans, and preparation of
specifications. These costs are generally derived as a percentage of construction costs. For new publicly
owned dedicated lots, a conceptual Opinion of Probable Cost of $820,000 was developed for a 100‐
space park‐and‐ride lot in the Savannah area.
Construction costs may also include improvements and fixtures at both existing and recommended
shared use park‐and‐ride lots. The level of investment in each lot will vary depending on a number of
factors, including lot configuration and current conditions. For cost estimation purposes, a conservative
estimate of $1,600 per parking space is assumed. This amounts to approximately 20% of construction
costs for a new dedicated lot.
Recurring annual costs include routine maintenance and lease costs, where applicable. Routine
maintenance would be a recurring annual cost for each park‐and‐ride lot. Proactive maintenance
ensures safety for individuals using the lot and extends the life of the lot before expensive
reconstruction, repair, or replacements are needed. Routing maintenance generally includes items such
as maintenance of pavement, lighting, landscaping, signage, shelters, and other features, as well as trash
removal and cleaning. A figure of $100 per parking space per year was used for routine maintenance
costs. For shared‐use lots, formal agreements delineating lease terms for shared use park‐and‐ride lots
are highly encouraged. A review of several park‐and‐ride lease agreements between GRTA and private
property owners (shopping centers and churches) suggests a cost of $10 per parking space per month,
or $120 per space annually. This unit cost is assumed for cost estimating purposes.
Order of magnitude costs for both one‐time capital costs and annual costs associated with the proposed
park‐and‐ride lots were calculated using the assumptions described above. Estimates were developed
for both an initial year (assumed to be 2020) and a horizon year of 2040. New dedicated park‐and‐ride
lots or expansions of lots assume either 50 or 100 spaces, requiring a half acre or one acre of land,
respectively.
The total number of park‐and‐ride spaces in the initial year (assumed to be 2020) is generally proposed
to be in the 135 to 155 space range per corridor. For the horizon year (2040), the total number of park‐
and‐ride spaces is generally proposed to be in the 185 to 205 space range per corridor. These parking
space recommendations are sufficient to meet corridor park‐and‐ride demand estimates for both the
initial year and the horizon year.

Park‐and‐Ride Lot Study Page 18 Final Report (Draft)
Specific assumptions applied to each corridor and park‐and‐ride lot for determining potential capital and
annual maintenance/lease costs are summarized below. Note that these are assumptions applied only
for the purpose of determining an order‐of‐magnitude cost estimate. Actual costs will vary depending
on final lease vs. construction decisions and actual park‐and‐ride lot size determination within each
corridor.
Northwest (SR 21) Corridor
I‐95 & SR 21. This existing 33‐space GDOT lot is assumed to be expanded by 50 spaces to 83
spaces.
SR 21 South of Rincon. A shared use (leased) park‐and‐ride facility is initially assumed as a 50‐
space lot, eventually expanded to 100 spaces by the horizon year.
SR 17 in Guyton. This existing 20‐space GDOT lot is assumed to remain its current size in both
the initial and horizon years.
West (I‐16 and US 80) Corridor
I‐16 & US 280/SR 30. This existing 35‐space GDOT lot is assumed to initially remain its current
size but be improved, with expansion of 50 spaces to 85 spaces by the horizon year.
US 80 & Bloomingdale Road. A newly constructed park‐and‐ride facility is assumed as a 100‐
space lot in both the initial and horizon years.
South (I‐95 and US 17) Corridor
I‐95 & SR 204. This lot is assumed to be phased out as recommended new park‐and‐ride lots in
this corridor come on‐line.
US 17 in Vicinity of Walmart. A shared use (leased) park‐and‐ride lot of 100 spaces is assumed
at this location in both the initial and horizon years.
I‐95 & SR 144. A newly constructed park‐and‐ride facility is initially assumed as a 50‐space lot,
eventually expanded to 100 spaces by the horizon year.
Table 3 presents estimated park‐and‐ride lot costs for the initial year (assumed to be 2020) and the
horizon year (assumed to be 2040) in current (2014) dollars. Total estimated one‐time capital costs are
just over $3 million and annual maintenance and lease costs are estimated at $70,300 for the initial year
(2020), with a total park‐and‐ride supply of 440 spaces. By the horizon year (2040), the number of park‐
and‐ride spaces would increase to a total of 590. Total estimated one‐time capital costs would increase
by $1,275,500 to almost $4.3 million. Recurring maintenance and lease costs would increase by $21,000
to $91,300 per year.

Park‐and‐Ride Lot Study Page 19 Final Report (Draft)
Table 3: Order of Magnitude Park‐and‐Ride Lot Capital and Annual Maintenance/Lease Costs
2020 2040 One‐Time Costs Annual Maintenance
Existing Proposed Proposed Land, Engineering, Construction and/or Lease Costs
Corridor Park‐and‐Ride Lot Improvement Type Spaces Spaces Spaces 2020 2040 Total 2020 2040
Northwest I‐95 & SR 21 Expand Existing Lot 33 85 85 $809,700 $0 $809,700 $8,500 $8,500
Corridor SR 21 South of Rincon New Leased Lot 0 50 100 $96,000 $96,000 $192,000 $19,500 $30,500
SR 17 in Guyton Existing Lot ‐ Not Change 20 20 20 $38,400 $0 $38,400 $2,000 $2,000
Corridor Total 53 155 205 $944,100 $96,000 $1,040,100 $30,000 $41,000
West I‐16 & US 280/SR 30 Expand Existing Lot 35 35 85 $63,400 $525,000 $588,400 $3,300 $8,300
Corridor US 80 & Bloomingdale Rd. New Public‐Owned Lot 0 100 100 $1,162,100 $0 $1,162,100 $10,000 $10,000
Corridor Total 35 135 185 $1,225,500 $525,000 $1,750,500 $13,300 $18,300
South I‐‐95 & SR 204 Existing Lot 32 0 0 $0 $0 $0 $0 $0
Corridor US 17 & Vicinity of Wal‐Mart New Leased Lot 0 100 100 $192,000 $0 $192,000 $22,000 $22,000
I‐95 & SR 144 New Public‐Owned Lot 0 50 100 $654,500 $654,500 $1,309,000 $5,000 $10,000
Corridor Total 32 150 200 $846,500 $654,500 $1,501,000 $27,000 $32,000
REGIONAL TOTALS 120 440 590 $3,016,100 $1,275,500 $4,291,600 $70,300 $91,300
Note: Costs in 2014 dollars.

Park‐and‐Ride Lot Study Page 20 Final Report (Draft)
Transit Service Opportunities
Major employment centers were identified in the greater Savannah region with significant employment
densities. Work‐related travel demand was estimated for each proposed park‐and‐ride lot location to
each major employment areas. Through this process, it was determined that the two employment
centers most likely to support commuter transit services were: Downtown Savannah and the
Gulfstream/Crossroads/Airport area. Hunter Army Airfield may also be viable at some point –
particularly from the south I‐95/US 17 corridor. However, the current demand for Hunter Army Airfield
commuters was not as strong as the other two locations, thus was not included as a potential “first tier”
of regional commuter transit service.
Proposed Service For each corridor, it is proposed that there be one route to each destination (i.e., one route to
Downtown Savannah and one route to the Airport/Gulfstream/Crossroads area). Each route would start
from the farthest park‐and‐ride lot, make a mid‐route stop at the closest park‐and‐ride lot, and then
continue non‐stop to the employment destination. Figures 7 through 8 illustrate proposed routing from
each corridor to these two destinations.
A key attribute to attracting ridership is providing the riders with a sufficient number of trip choices for
traveling to and from their destinations. It is proposed that each route consists of three morning and
three afternoon trips, weekdays only (excluding holidays). Three trips is the recommended minimum
number for each peak period to provide potential customers with the option of trip choices over an
approximate 90‐minute period.
Tables 4 and 5 present potential schedules for transit service for each corridor to/from Downtown
Savannah and the Airport/Gulfstream/Crossroads area. Two buses have been identified for each route.
In the morning the first scheduled bus trip makes a non‐revenue trip back to the park‐and‐ride lots to
make the third scheduled inbound trip. Similarly, in the afternoon the first scheduled bus trip makes a
non‐revenue trip back to the destination to make the third scheduled outbound trip. Overall, twelve
(12) buses are required to provide service to both Downtown Savannah and the
Airport/Gulfstream/Crossroads area from all three corridors.
A key element to providing successful park‐and‐ride transit services is providing a guaranteed means of
returning to the park‐and‐ride lot in the midday in the event of an emergency (e.g., to pick‐up a sick
child from school). Included in the statistics is the assumption that one bus remains available for midday
guaranteed ride home service for each destination.

Park‐and‐Ride Lot Study Page 21 Final Report (Draft)
Figure 7: Northwest Corridor Proposed Transit Routes

Park‐and‐Ride Lot Study Page 22 Final Report (Draft)
Figure 8: West Corridor Proposed Transit Routes
Park‐and‐Ride Lot Study Page 23 Final Report (Draft)
Figure 9: South Corridor Proposed Transit Routes

Park‐and‐Ride Lot Study Page 24 Final Report (Draft)
Table 4: Proposed Transit Service Plan to/from Downtown Savannah
Corridor AM Service Plan PM Service Plan
Northwest Bus Rincon SR 21/I‐95 Downtown Bus Downtown SR 21/I‐95 Rincon
1 6:30 AM 6:40 AM 7:20 AM 1 4:30 PM 5:10 PM 5:20 PM
2 7:00 AM 7:10 AM 7:50 AM 2 5:15 PM 5:55 PM 6:05 PM
1 8:00 AM 8:10 AM 8:50 AM 1 6:00 PM 6:10 PM 6:50 PM
West Bus US 280/I‐16 Bloomingdale Downtown Bus Downtown Bloomingdale US 280/I‐16
1 6:25 AM 6:42 AM 7:20 AM 1 4:30 PM 5:08 PM 5:25 PM
2 6:55 AM 7:12 AM 7:50 AM 2 5:15 PM 5:53 PM 6:10 PM
1 8:05 AM 8:22 AM 9:00 AM 1 6:10 PM 6:48 PM 7:05 PM
South Bus SR 144 Walmart Downtown Bus Downtown Walmart SR 144
1 6:35 AM 6:45 AM 7:20 AM 1 4:30 PM 5:05 PM 5:15 PM
2 7:05 AM 7:15 AM 7:50 AM 2 5:15 PM 5:52 PM 6:09 PM
1 7:55 AM 8:05 AM 8:40 AM 1 5:50 PM 6:27 PM 6:44 PM
Summary of Statistics Daily Annual
Service Peak Buses 6 n/a
Requirements Rev. Miles 489 124,206
Rev. Hours 15.0 3,810
Midday Hours 7.5 1,905
Deadhead Hrs. 8.5 2,159
Total Hours 31.0 7,874
Notes: Revenue‐Miles and Revenue‐Hours are the number of miles and hours that a bus is in service, avalable for passengers to board.
Annualization of statistics based on weekday service only, excluding holidays (254 service days a year)
Park‐and‐Ride Lot Study Page 25 Final Report (Draft)
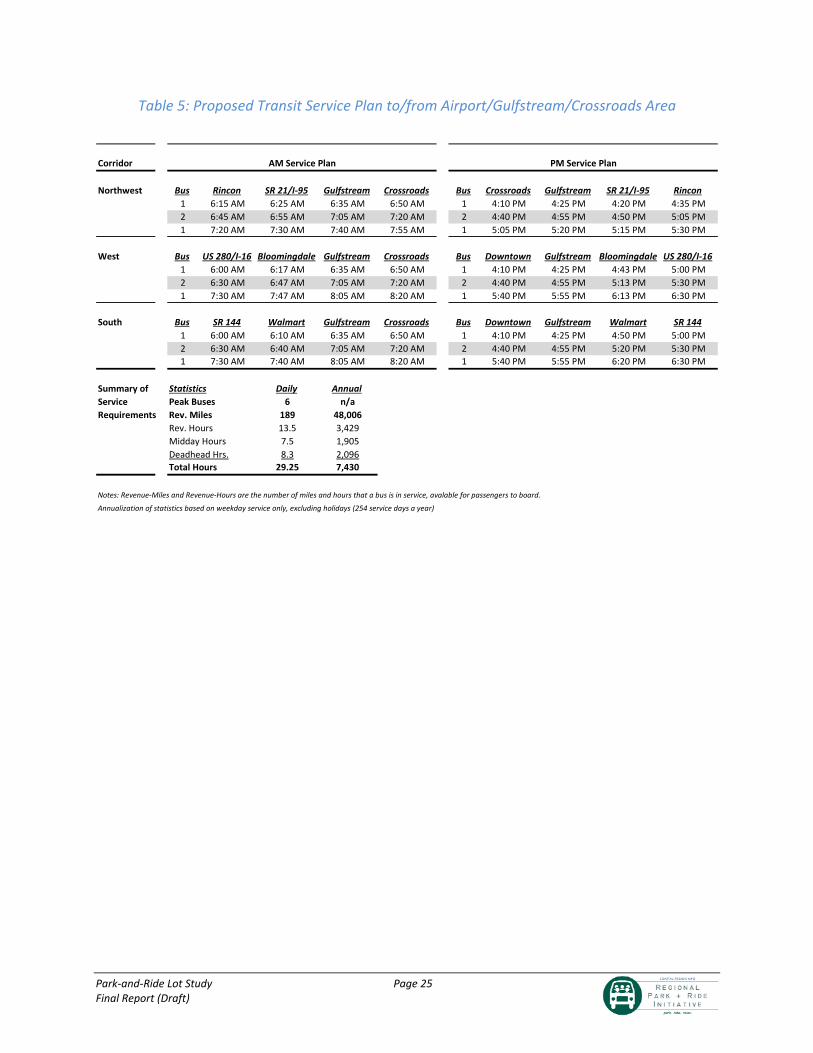
Table 5: Proposed Transit Service Plan to/from Airport/Gulfstream/Crossroads Area
Corridor AM Service Plan PM Service Plan
Northwest Bus Rincon SR 21/I‐95 Gulfstream Crossroads Bus Crossroads Gulfstream SR 21/I‐95 Rincon
1 6:15 AM 6:25 AM 6:35 AM 6:50 AM 1 4:10 PM 4:25 PM 4:20 PM 4:35 PM
2 6:45 AM 6:55 AM 7:05 AM 7:20 AM 2 4:40 PM 4:55 PM 4:50 PM 5:05 PM
1 7:20 AM 7:30 AM 7:40 AM 7:55 AM 1 5:05 PM 5:20 PM 5:15 PM 5:30 PM
West Bus US 280/I‐16 Bloomingdale Gulfstream Crossroads Bus Downtown Gulfstream Bloomingdale US 280/I‐16
1 6:00 AM 6:17 AM 6:35 AM 6:50 AM 1 4:10 PM 4:25 PM 4:43 PM 5:00 PM
2 6:30 AM 6:47 AM 7:05 AM 7:20 AM 2 4:40 PM 4:55 PM 5:13 PM 5:30 PM
1 7:30 AM 7:47 AM 8:05 AM 8:20 AM 1 5:40 PM 5:55 PM 6:13 PM 6:30 PM
South Bus SR 144 Walmart Gulfstream Crossroads Bus Downtown Gulfstream Walmart SR 144
1 6:00 AM 6:10 AM 6:35 AM 6:50 AM 1 4:10 PM 4:25 PM 4:50 PM 5:00 PM
2 6:30 AM 6:40 AM 7:05 AM 7:20 AM 2 4:40 PM 4:55 PM 5:20 PM 5:30 PM
1 7:30 AM 7:40 AM 8:05 AM 8:20 AM 1 5:40 PM 5:55 PM 6:20 PM 6:30 PM
Summary of Statistics Daily Annual
Service Peak Buses 6 n/a
Requirements Rev. Miles 189 48,006
Rev. Hours 13.5 3,429
Midday Hours 7.5 1,905
Deadhead Hrs. 8.3 2,096
Total Hours 29.25 7,430
Notes: Revenue‐Miles and Revenue‐Hours are the number of miles and hours that a bus is in service, avalable for passengers to board.
Annualization of statistics based on weekday service only, excluding holidays (254 service days a year)
Park‐and‐Ride Lot Study Page 26 Final Report (Draft)
Potential Ridership and Costs
Order‐of‐magnitude ridership estimates were prepared by utilizing corridor travel demand estimates
and applying typical express route mode share rates. Daily one‐way passenger trips for the three
Downtown Savannah routes (combined) is estimated to be approximately 400 with today’s regional
population and 560 with Year 2040 regional population forecasts. Daily ridership for the three
Airport/Gulfstream/Crossroads routes (combined) is estimated to be approximately 170 with today’s
regional population and 250 with Year 2040 regional population forecasts. The Downtown Savannah
ridership is estimated to be twice as high as the Airport/Gulfstream/Crossroads ridership due partially to
stronger travel demand to/from Downtown Savannah. It is also because Downtown Savannah is farther
in distance from most of the park‐and‐ride lots where service is proposed (employees are more likely to
use express route services as distances between home and the workplace increases). There are also
higher employment densities, thus concentrations of employees in Downtown Savannah. Many
employees must pay for downtown parking, an influencing factor for encouraging transit usage.
Monthly parking at the City of Savannah’s (City’s) parking garages is $30/month at the Liberty Street
garage, and $80/month at the City’s other four garages (Bryan Street, Robinson, State Street and
Whitaker Street). There are also higher levels of traffic congestion in Downtown Savannah. Studies
have shown that transit usage is heavily influenced by time (i.e., is the transit travel time competitive
with the auto travel time) and cost (i.e., is the transit fare competitive with the cost of driving).
It is recommended that a large‐sized bus be utilized for the Downtown Savannah service (i.e., 29’ or
more in length) and a small‐sized bus (typically referred to as “cutaways”) be used for the
Airport/Gulfstream/Crossroads routes (e.g., 22’).
Costs for transit services are dependent on the service contracting arrangements. For this analysis, a
contract service provider arrangement is assumed, where the sponsoring agency contracts with a
private service provider to operate the service and maintain the buses. At this point, it is not known
who the sponsoring public agency (or agencies) may be. A contract service provider arrangement is
similar to CAT’s operations prior to 2013 when CAT contracted with a service provider. The only costs
incurred directly by CAT were fuel and administrative costs. For this analysis, it is also assumed that the
contract service provider’s hourly rate will include the provision of buses (i.e., the sponsoring agency will
not be purchasing buses, rather the contract service provider builds the cost for supplying buses into the
hourly rate). A total of 12 buses are needed for the proposed service plan (six for each destination).
Two spare buses are assumed for each service, resulting in a total of 16 buses.
Table 6 presents estimated costs for the provision of transit service per the operating plan described
above. This cost could be reduced by phasing implementation of transit service (e.g., do not start with
transit service in all three corridors or to both destinations).

Park‐and‐Ride Lot Study Page 27 Final Report (Draft)
Table 6: Estimated Annual O&M Costs (2014 dollars)
From a benefits standpoint, the projected 2040 ridership can result in a reduced need of over 400
parking spaces for Downtown Savannah and the Airport/Gulfstream/Crossroads area. This is parking
that would not be required of employers or businesses served by the proposed transit routes. It also
does not include additional potential savings in parking requirements resulting from carpoolers.
For riders of the service, there is also a financial benefit. For riders destined to Downtown Savannah,
fuel savings are estimated to range from $2.40 to $4.60 per one‐way trip, with an average savings of
$2.90 per one‐way trip (i.e., $5.80 round trip). For riders destined to the Airport/Gulfstream/Crossroads
area, fuel savings are estimated to range from $1.50 to $4.00 per one‐way trip, with an average savings
of $2.60 per one‐way trip (i.e., $5.20 round trip). These calculations are based on the 2040 ridership
projections, distances to and from each park‐and‐ride lot, an average 24 mpg fuel consumption rate and
a fuel cost of $3.50 per gallon. In addition to fuel costs, riders destined to Downtown Savannah also
realize a savings in parking costs. Monthly parking fee at the City’s parking garages ranges from $30 to
$80. Assuming an average rate of $50 per month, a downtown‐destined rider could be saving over
$8.00 in fuel and parking costs a day ($5.80 in round trip fuel costs and $2.25 in average daily parking
costs).
Finally, there are less quantifiable benefits associated with park‐and‐ride and transit usage. There are
environmental benefits in the form of reduced traffic congestion and air pollution, and less usage of
automobiles results in reduced auto maintenance costs for the auto owner. The AAA estimates auto
maintenance costs average 5 cents for every mile driven.
CostCost Item Unit Cost Unit Type Units Estimate
Contract Operator O&M $56.00 per Total Bus Hr. 15,304 $857,000Fuel & Agency G&A = $11.00 per Total Bus Hr. 15,304 $168,300Small Bus Costs = $18,000 per Bus 8 $144,000Large Bus Costs = $29,000 per Bus 8 $232,000Total Annual O&M Cost Estimate $1,401,300
Notes:1. O&M - operating and maintenance costs.2. G&A - general administrative costs3. Small (cutaway) bus estimated to be $90,000 with a 5-year useful life4. Larger (29' or more) diesel bus estimated to be $350,000 with a 12-year useful life5. Costs are in 2014 dollars.

Park‐and‐Ride Lot Study Page 28 Final Report (Draft)
Potential Farebox Revenues and Subsidy Requirements In addition to ridership and costs, it is important to determine likely farebox revenues so the sponsoring
agency (or agencies) has an understanding of potential service subsidy requirements. For this analysis, a
$2.50 cash fare has been assumed with multi‐ride and monthly pass discounts that bring the net
effective fare to $2.25 (10% lower than the cash fare). This fare assumption is based on a review of
express fares in other regions, and has been applied to each route’s ridership estimates to determine
potential farebox revenues. Annual O&M costs (including the lease of buses) have been calculated for
each route. This provides the ability to calculate the subsidy required on a route‐level basis. Table 7
presents these calculations for 2040 horizon year forecasts. All cost figures in these tables are in 2014
dollars. As shown in this table, subsidy requirements are less for the Downtown Savannah transit
service.
It is important to note that transit service does not necessarily have to begin concurrent with the
opening of corridor park‐and‐ride lots. Rideshare and vanpool programs/promotions can be an initial
step in the encouragement of park‐and‐ride lot usage. Transit services can also be phased (e.g., begin
with the Downtown Savannah service and then expand to the Airport/Gulfstream/Crossroads service, or
begin service in a particular corridor and then expand to other corridors).
Table 7: 2040 Horizon Year Revenue and Subsidy Estimates
Daily Annual Total Fare Annual Farebox Subsidy Subusidy/
Service Corridor Ridership Ridership Bus‐Hours Revenues O&M Costs Recovery % Required 1‐Way Trip
Downtown Northwest 120 30,480 2,625 $68,580 $223,900 31% $155,320 $5.10
Routes West 250 63,500 2,887 $142,875 $241,400 59% $98,525 $1.55
South 190 48,260 2,362 $108,585 $206,300 53% $97,715 $2.02
Downtown Totals 560 142,240 7,874 $320,040 $671,600 48% $351,560 $2.47
Gulfstream/ Northwest 90 22,860 1,926 $51,435 $206,400 25% $154,965 $6.78
Crossroads West 100 25,400 2,752 $57,150 $261,700 22% $204,550 $8.05
Routes South 60 15,240 2,752 $34,290 $261,700 13% $227,410 $14.92
Gulfstream Totals 250 63,500 7,430 $142,875 $729,800 20% $586,925 $9.24
FULL SYSTEM TOTALS 810 205,740 15,304 $462,915 $1,401,400 33% $938,485 $4.56
Notes
1. Ridership Annualizaton Factor = 254
2. Fare per Passenger Trip = $2.25
3. Hours distributed to routes based on each route's 1‐way trip revenue time. Midday hours are shared proportionally.
4. Costs for spare buses shared proportionally in O&M cost calculations.
5. Costs presented in 2014 dollars.

Park‐and‐Ride Lot Study Page 29 Final Report (Draft)
Implementing the Park-and-Ride Program
Analyses of the commuter travel market in the greater Savannah region clearly show that the demand
for expanded park‐and‐ride facilities is present today. While completing fieldwork for this project, it was
quite evident that there is a significant amount of informal park‐and‐ride (carpool) activity at
commercial businesses around the Savannah region (e.g., parking at the fringe of grocery store and
hardware store parking lots). The provision of safe and convenient formal park‐and‐ride lots will further
encourage carpooling activities in the short term, with possible provision of commuter transit services in
the longer‐term.
It is recommended that expansion of park‐and‐ride lot spaces and ridesharing activities be realized
through a three‐pronged effort that is concentrated on the following activities:
All three activities will require extensive coordination among the CORE MPO, GDOT, local jurisdictions,
and public transit providers in the greater Savannah region. Specific efforts recommended within each
of these activities are described below.
Park‐and‐Ride Lot Development and Expansion This study has identified general locations where park‐and‐ride lot development, lease arrangements
and/or expansion of existing lots is appropriate. Multi‐agency participation will be required to
determine specific sites that should be advanced to development, and to establish funding
arrangements for engineering, land acquisition, construction, lease payments and annual maintenance.
Following are descriptions of coordination efforts that will be required for each proposed lot location
within each of the three primary travel corridors.
Northwest (SR 21) Corridor
Work with GDOT in the programming of I‐95 and SR 21 lot expansion. Eliminate Effingham
County Courthouse from GDOT park‐and‐ride lot inventory.

Park‐and‐Ride Lot Study Page 30 Final Report (Draft)
Work with City of Rincon and Effingham County to further investigate potential sites in the
vicinity of the existing Lowes and Wal‐Mart (lease options and lot development options), and
potential funding strategies for capital and ongoing lease/maintenance costs.
West (I‐16 and US 80) Corridor
Work with GDOT in programming lot improvements for the existing I‐16 and US 280/SR 30 park‐
and‐ride lot.
Work with City of Bloomingdale and Chatham County to further investigate potential sites (lease
options and lot development options), and potential funding strategies for capital and ongoing
lease/maintenance costs.
South (I‐95 and US 17) Corridor
Work with City of Savannah and Chatham County to further investigate potential sites (lease
options and lot development options) around the existing Wal‐Mart on US 17 at SR 204, and
potential funding strategies for capital and ongoing lease/maintenance costs. As noted earlier,
CAT is presently in the process of securing shared‐use park‐and‐ride spaces at the Savannah
Mall to address near‐term park‐and‐ride space needs. Longer‐term, however, the US 17/SR 204
site, in the vicinity of Wal‐Mart, is seen as a preferable site to address South Corridor commuter
needs.
Work with City of Richmond Hill and Bryan County to further investigate potential sites around
SR 144/I‐95/US 17 (lease options and lot development options), and potential funding strategies
for capital and ongoing lease/maintenance costs.
Carpool and Vanpool Program Promotion CORE MPO presently administers the region’s Coastal Commuters program. Currently the program
mainly consists of a ridematching system that can be used by individuals or by employers who request
to have a dedicated network within the system. Although the system can potentially be used to set up
vanpools, the necessary management activity for that is not funded and staffed at this time. Coastal
Commuters participants are able to enter commute origin and destination information at the Coastal
Commuters website (http://www.coastalcommuters.org), and look for matches for potential
ridesharing. In recent years, there has not been an extensive effort to promote this program. A
challenge for participants in this program is the lack of collection points at the origin (home) end of the
trip for participants to meet and carpool together. Expansion of park‐and‐ride lots will provide these
much needed collection points and should result in increased participation in the program. Another
challenge is the rapidly changing environment of tools available to reach out to potential participants.
Reliance on web sites to find a potential ridematch is no longer sufficient. Social media sites must also
be used to successfully reach out to commuters.
In conjunction with the park‐and‐ride lot expansion program, it is recommended that efforts be made to
expand promotion of the Coastal Commuters program (or successor program) for commuters to find
Park‐and‐Ride Lot Study Page 31 Final Report (Draft)
ridematching opportunities. Chatham Area Transit (CAT) has expressed an interest in providing a
ridesharing/vanpooling program, and CAT staff has discussed this with CORE MPO staff. Whatever
agency handles the ridematching system in the future, it is recommended that they initiate the
expanded promotional effort by first conducting an evaluation of ridematching programs in other
similar‐sized cities in the country. The focus of this peer review would be to identify demonstrated
successful outreach activities to both employers and their employees. Such activities may include
ridesharing incentive programs, sign‐up drives at major employers and use of social media apps. Results
of the peer review should then be used to define a program for improving promotion of a rideshare
program in the Savannah region.
A successful carpool/vanpool program requires a full time mobility manager to manage the various
activities necessary to attract participants. Responsibilities for the mobility manager include maintaining
and marketing the rideshare database, and promoting park‐and‐ride use to both employers and
employees through various traditional and social media marketing efforts. Funding for a full‐time
mobility manager, within an appropriate agency, is recommended.
Promotion and incentives for park‐and‐ride use must also occur at the destination end of the trip. As
noted throughout this study, Downtown Savannah has the greatest potential for park‐and‐ride use by
downtown employees because of high employment densities, relatively long‐distance trips from home
origins to Downtown Savannah, roadway congestion to and from Downtown Savannah and parking
costs. The City benefits from increased park‐and‐ride use through reduced downtown traffic volumes
and parking space demand. A pilot park‐and‐ride incentive program is recommended at City‐owned
parking facilities. Incentives could include preferential parking and/or lower parking costs for
carpoolers. The Chatham County ‐ Savannah Metropolitan Planning Commission (MPC), on behalf of the
CORE MPO and in partnership with the City of Savannah, is about to initiate a Parking and Mobility
Study. Specific actions that will encourage and incentivize park‐and‐ride activities should be considered
as a part of this study.
Finally, The Coastal Regional Commission (CRC) is currently conducting a study to determine the
potential market for a vanpool program. Similar to the rideshare program, expansion of park‐and‐ride
lots will greatly increase the success of a vanpool program, for the park‐and‐ride lots can be used as
collection points. CORE MPO should continue to support the CRC in this study, with recommendations
from that study folded into this study’s overall recommendations.
Regional Commuter Transit Service Implementation This study has determined that regional commuter transit service is likely viable for Downtown
Savannah and the Gulfstream/Airport/Crossroads area. Regional transit service may also be viable
longer‐term for other major employment areas. For example, there appears to be a strong travel
demand to Hunter Army Airfield in the South I‐95/US 17 corridor.
Park‐and‐Ride Lot Study Page 32 Final Report (Draft)
The provision of regional commuter transit service will greatly enhance use of expanded park‐and‐ride
lots. However, we do not believe it is an essential first step. There appears to be a significant
carpool/vanpool market that will benefit from new and expanded park‐and‐ride lots. The provision of
regional commuter transit service will be the most challenging recommendation to implement. Thus, it
is envisioned as a longer‐term recommendation. Transit service has a high on‐going annual cost for
operations and maintenance and requires sustainable funding sources. There is presently no
mechanism in place in the greater Savannah region to fund a regional commuter transit service that
would be multi‐jurisdictional.
CAT and CRC are the two public transit service providers in the Savannah region. Both agencies could be
the service provider for regional commuter transit service. Both, however, have funding restrictions.
CAT is funded by a millage rate within portions of Chatham County. CAT could enter into inter‐local
agreements to operate some or all proposed transit routes, with these agreements specifying funding
arrangements for jurisdictions outside of CAT’s current millage‐rate supported service district. CRC
provides rural and human services transportation in the coastal region. As a Section 5311 recipient, CRC
can only provide service for rural‐to‐rural, urban‐to‐rural and rural‐to‐urban trips. Some of the
proposed park‐and‐ride lots are located within the Savannah Urbanized Area Boundary. CRC could,
however, still provide services to and from these park‐and‐ride lots through inter‐local funding
agreements that do not utilize CRC’s Section 5311 funds.
Further discussions are needed regarding governance, funding and service delivery options for regional
commuter transit service. Tech Memo 5 of this study presented potential federal, state and local
funding sources and transit service delivery options that could potentially be used for regional
commuter bus service in the Savannah region. These discussions must involve both administrative staff
and elected representatives of the affected jurisdictions. CORE MPO, through its role as the region’s
MPO, is in a position to coordinate these discussions. These discussions should be initiated through
existing CORE MPO committees, and include participation by both CAT and CRC representatives.