park settlement mhp
TRANSCRIPT
PARK SETTLEMENT MHP2080 Park Settlement Road | Owego, NYOFFERING MEMORANDUM
Park Settlement MHP CONTENTS
Exclusively Marketed by:
Steven [email protected]
We obtained the following information above from sources we believe to be reliable. However, we have not verified its accuracy and make no guarantee, warranty or representation about it. It is submitted subject to the possibility of errors, omissions, change of price, rental or otherconditions, prior sale, lease or financing, or withdrawal without notice. We include projections, opinions, assumptions or estimates for example only, and they may not represent the current or future performance of the property. You and your tax and legal advisors should conduct yourown investigation of the property and transaction.
01 Executive Summary Investment Summary Location Summary
02 Property Description Aerial Map
03 Rent Roll Rent Roll
04 Financial Analysis Income & Expense Analysis Multi-Year Cash Flow Assumptions Cash Flow Analysis
05 Demographics Demographics Demographic Charts

Park Settlement M
HP | Executive Sum
mary
Executive Summary
PAR
K SE
TTLE
MEN
T M
HP
01
......
......
......
......
......
......
......
......
Investment Summary
Unit Mix Summary
Location Summary

Investment Summary | Park Settlement MHP 4
OFFERING SUMMARYADDRESS 2080 Park Settlement Road
Owego NY 14892COUNTY Tioga CountyMARKET New York StateSUBMARKET Binghamton Metro AreaLAND ACRES 2.4NUMBER OF UNITS 11OWNERSHIP TYPE Fee Simple
FINANCIAL SUMMARYOFFERING PRICE $350,000PRICE PER UNIT $31,818NOI (CURRENT) $48,060NOI (Pro Forma) $50,293CAP RATE (CURRENT) 13.73 %CAP RATE (Pro Forma) 14.37 %GRM (CURRENT) 4.70GRM (Pro Forma) 4.56
PROPOSED FINANCINGLOAN TYPE AmortizedDOWN PAYMENT $122,500LOAN AMOUNT $227,500INTEREST RATE 4.00 %LOAN TERMS 25ANNUAL DEBT SERVICE $14,410LOAN TO VALUE 65 %AMORTIZATION PERIOD 25 Years
DEMOGRAPHICS 1 MILE 3 MILE 5 MILE2020 Population 243 2,584 9,8992020 Median HH Income $59,392 $60,204 $57,0942020 Average HH Income $70,478 $70,330 $70,261
Private Water• Park has a private well
Septic• Park has 11 Septic Tanks

Location Summary | Park Settlement MHP 5
Regional Map
Locator Map
LOCATION SUMMARY
• -Located in the Binghamton Metro Area -245,446 People in Metro Area-Just 30 min outside of Binghamton
10 Minutes from:
• -Town of Owego-Dunkin Donuts-Mobil Gas Station-Tioga County Historical Society-Susquehanna River-Hickories Park-The Cellar Restaurant & Bar on the River-MJ's Bar and Restaurantand many more local restaurants!

Park Settlement M
HP | Property D
escription
Property Description
PAR
K SE
TTLE
MEN
T M
HP
02
......
......
......
......
......
......
......
......
Aerial Map
Parcel Map

Aerial Map | Park Settlement MHP 7
Park Settlement M
HP | R
ent Roll
Rent Roll
PAR
K SE
TTLE
MEN
T M
HP
03
......
......
......
......
......
......
......
......
Rent Roll Details

Park Settlement MHP Rent Roll
Lot # Type of Home Rent 1 Park Owned Home $550.002 Park Owned Home $550.003 Park Owned Home $695.004 Tenant Owned Home $225.005 Park Owned Home $500.006 Park Owned Home $525.007 Maintenance Man $625.008 Park Owned Home $550.009 Tenant Owned Home $285.0010 Stick Built Home $1,100.0011 Park Owned Home $600.00

Park Settlement M
HP | Financial Analysis
Financial Analysis
PAR
K SE
TTLE
MEN
T M
HP
04
......
......
......
......
......
......
......
......
Income & Expense
Multiyear Cash Flow Assumptions
Multiyear Cash Flow Projections
Income & Expense Analysis | Park Settlement MHP 11
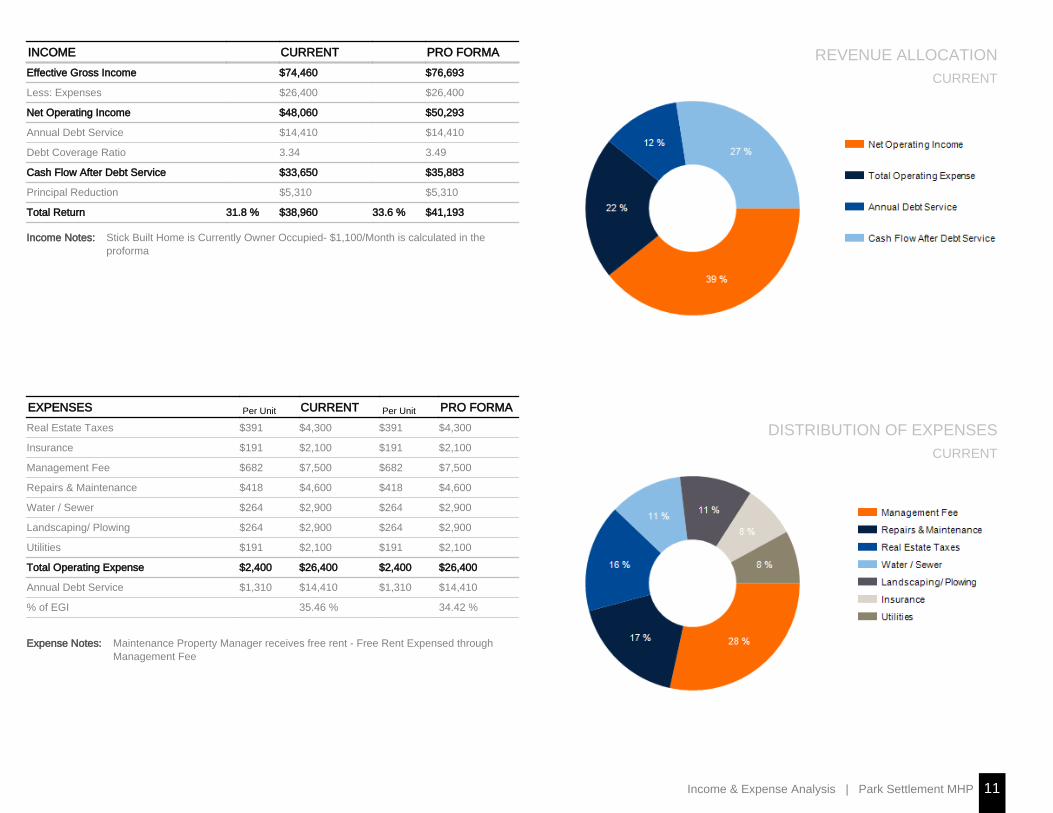
INCOME CURRENT PRO FORMAEffective Gross Income $74,460 $76,693
Less: Expenses $26,400 $26,400
Net Operating Income $48,060 $50,293
Annual Debt Service $14,410 $14,410
Debt Coverage Ratio 3.34 3.49
Cash Flow After Debt Service $33,650 $35,883
Principal Reduction $5,310 $5,310
Total Return 31.8 % $38,960 33.6 % $41,193
Income Notes: Stick Built Home is Currently Owner Occupied- $1,100/Month is calculated in theproforma
EXPENSES CURRENT PRO FORMAReal Estate Taxes $391 $4,300 $391 $4,300
Insurance $191 $2,100 $191 $2,100
Management Fee $682 $7,500 $682 $7,500
Repairs & Maintenance $418 $4,600 $418 $4,600
Water / Sewer $264 $2,900 $264 $2,900
Landscaping/ Plowing $264 $2,900 $264 $2,900
Utilities $191 $2,100 $191 $2,100
Total Operating Expense $2,400 $26,400 $2,400 $26,400
Annual Debt Service $1,310 $14,410 $1,310 $14,410
% of EGI 35.46 % 34.42 %
Per Unit Per Unit
Expense Notes: Maintenance Property Manager receives free rent - Free Rent Expensed throughManagement Fee
REVENUE ALLOCATIONCURRENT
DISTRIBUTION OF EXPENSESCURRENT

Multi-Year Cash Flow Assumptions | Park Settlement MHP 12
GLOBALOffering Price $350,000
INCOME - Growth RatesGross Potential Rent 4.00 %
EXPENSES - Growth RatesReal Estate Taxes 1.50 %Insurance 1.50 %Management Fee 1.50 %Repairs & Maintenance 1.50 %Water / Sewer 1.50 %
PROPOSED FINANCINGLoan Type AmortizedDown Payment $122,500Loan Amount $227,500Interest Rate 4.00 %Loan Terms 25Annual Debt Service $14,410Loan to Value 65 %Amortization Period 25 Years

Cash Flow Analysis | Park Settlement MHP 13
CASH FLOWCalendar Year CURRENT Year 1 Year 2 Year 3 Year 4 Year 5 Year 6 Year 7 Year 8 Year 9 Year 10Gross Potential RevenueGross Rental Income $74,460 $76,693 $79,761 $82,951 $86,269 $89,720 $93,309 $97,041 $100,923 $104,960 $109,158Effective Gross Income $74,460 $76,693 $79,761 $82,951 $86,269 $89,720 $93,309 $97,041 $100,923 $104,960 $109,158Operating ExpensesReal Estate Taxes $4,300 $4,300 $4,365 $4,430 $4,496 $4,564 $4,632 $4,702 $4,772 $4,844 $4,917Insurance $2,100 $2,100 $2,132 $2,163 $2,196 $2,229 $2,262 $2,296 $2,331 $2,366 $2,401Management Fee $7,500 $7,500 $7,613 $7,727 $7,843 $7,960 $8,080 $8,201 $8,324 $8,449 $8,575Repairs & Maintenance $4,600 $4,600 $4,669 $4,739 $4,810 $4,882 $4,956 $5,030 $5,105 $5,182 $5,260Water / Sewer $2,900 $2,900 $2,944 $2,988 $3,032 $3,078 $3,124 $3,171 $3,219 $3,267 $3,316Landscaping/ Plowing $2,900 $2,900 $2,900 $2,900 $2,900 $2,900 $2,900 $2,900 $2,900 $2,900 $2,900Utilities $2,100 $2,100 $2,100 $2,100 $2,100 $2,100 $2,100 $2,100 $2,100 $2,100 $2,100Total Operating Expense $26,400 $26,400 $26,721 $27,047 $27,378 $27,713 $28,054 $28,400 $28,751 $29,107 $29,469Net Operating Income $48,060 $50,293 $53,040 $55,904 $58,892 $62,007 $65,255 $68,641 $72,172 $75,853 $79,690Annual Debt Service $14,410 $14,410 $14,410 $14,410 $14,410 $14,410 $14,410 $14,410 $14,410 $14,410 $14,410Cash Flow $33,650 $35,883 $38,630 $41,494 $44,482 $47,597 $50,845 $54,231 $57,762 $61,443 $65,279
Effective Gross Income vs Operating Expenses Cash Flow

Park Settlement M
HP | D
emographics
Demographics
PAR
K SE
TTLE
MEN
T M
HP
05
......
......
......
......
......
......
......
......
Demographic Details
Demographic Charts

Demographics | Park Settlement MHP 15
POPULATION 1 MILE 3 MILE 5 MILE
2000 Population 262 2,712 10,113
2010 Population 250 2,646 10,133
2020 Population 243 2,584 9,899
2025 Population 236 2,519 9,648
2020 African American 3 30 163
2020 American Indian 0 7 42
2020 Asian 1 8 67
2020 Hispanic 8 79 293
2020 Other Race 1 8 50
2020 White 232 2,479 9,366
2020 Multiracial 5 49 205
2020-2025: Population: Growth Rate -2.90 % -2.55 % -2.55 %
2020 HOUSEHOLD INCOME 1 MILE 3 MILE 5 MILE
less than $15,000 14 124 530
$15,000-$24,999 6 69 308
$25,000-$34,999 11 99 383
$35,000-$49,999 12 107 450
$50,000-$74,999 23 217 869
$75,000-$99,999 15 152 571
$100,000-$149,999 18 176 604
$150,000-$199,999 8 65 186
$200,000 or greater 1 11 101
Median HH Income $59,392 $60,204 $57,094
Average HH Income $70,478 $70,330 $70,261
HOUSEHOLDS 1 MILE 3 MILE 5 MILE
2000 Total Housing 125 1,085 4,333
2010 Total Households 109 1,019 4,016
2020 Total Households 108 1,020 4,002
2025 Total Households 106 1,003 3,927
2020 Average Household Size 2.16 2.46 2.42
2000 Owner Occupied Housing 92 846 2,796
2000 Renter Occupied Housing 17 160 1,133
2020 Owner Occupied Housing 88 822 2,688
2020 Renter Occupied Housing 20 198 1,314
2020 Vacant Housing 22 113 473
2020 Total Housing 130 1,133 4,475
2025 Owner Occupied Housing 87 816 2,687
2025 Renter Occupied Housing 19 187 1,240
2025 Vacant Housing 25 140 585
2025 Total Housing 131 1,143 4,512
2020-2025: Households: Growth Rate -1.85 % -1.70 % -1.90 %
Source: esri

Demographics | Park Settlement MHP 16
2020 POPULATION BY AGE 1 MILE 3 MILE 5 MILE
2020 Population Age 30-34 13 150 590
2020 Population Age 35-39 12 132 564
2020 Population Age 40-44 15 150 533
2020 Population Age 45-49 12 139 525
2020 Population Age 50-54 17 175 627
2020 Population Age 55-59 21 220 798
2020 Population Age 60-64 19 197 743
2020 Population Age 65-69 17 181 665
2020 Population Age 70-74 16 163 567
2020 Population Age 75-79 11 115 404
2020 Population Age 80-84 6 65 265
2020 Population Age 85+ 5 55 260
2020 Population Age 18+ 198 2,083 7,937
2020 Median Age 47 46 44
2020 INCOME BY AGE 1 MILE 3 MILE 5 MILE
Median Household Income 25-34 $66,862 $68,416 $60,744
Average Household Income 25-34 $80,404 $83,033 $76,775
Median Household Income 35-44 $75,000 $77,675 $68,312
Average Household Income 35-44 $74,965 $79,352 $80,203
Median Household Income 45-54 $66,667 $77,639 $73,835
Average Household Income 45-54 $82,902 $82,349 $83,899
Median Household Income 55-64 $64,084 $65,366 $64,257
Average Household Income 55-64 $70,833 $72,018 $74,592
Median Household Income 65-74 $53,382 $55,168 $53,640
Average Household Income 65-74 $70,187 $67,649 $65,773
Average Household Income 75+ $47,101 $45,331 $46,533
2025 POPULATION BY AGE 1 MILE 3 MILE 5 MILE
2025 Population Age 30-34 13 143 580
2025 Population Age 35-39 14 155 603
2025 Population Age 40-44 12 130 531
2025 Population Age 45-49 16 158 542
2025 Population Age 50-54 12 131 534
2025 Population Age 55-59 17 175 590
2025 Population Age 60-64 20 211 749
2025 Population Age 65-69 18 186 688
2025 Population Age 70-74 15 163 611
2025 Population Age 75-79 13 137 472
2025 Population Age 80-84 8 86 338
2025 Population Age 85+ 6 61 266
2025 Population Age 18+ 196 2,049 7,767
2025 Median Age 47 47 45
2025 INCOME BY AGE 1 MILE 3 MILE 5 MILE
Median Household Income 25-34 $66,862 $75,615 $63,969
Average Household Income 25-34 $87,631 $92,851 $83,565
Median Household Income 35-44 $75,000 $82,830 $75,968
Average Household Income 35-44 $83,780 $87,444 $90,316
Median Household Income 45-54 $80,000 $86,624 $79,286
Average Household Income 45-54 $90,836 $94,169 $92,823
Median Household Income 55-64 $69,161 $70,039 $69,803
Average Household Income 55-64 $77,674 $79,728 $83,478
Median Household Income 65-74 $62,500 $63,462 $59,662
Average Household Income 65-74 $80,603 $79,686 $76,782
Average Household Income 75+ $52,552 $52,784 $52,663

Demographic Charts | Park Settlement MHP 17
1 Mile Radius 3 Mile Radius 5 Mile Radius
2020 Household Income
1 Mile Radius 3 Mile Radius 5 Mile Radius
2020 Population by Race

Demographic Charts | Park Settlement MHP 18
2020 Household Occupancy - 1 Mile Radius
Average Income Median Income
2020 Household Income Average and Median

Park Settlement MHP
Exclusively Marketed by:
Steven [email protected]
CONFIDENTIALITY and DISCLAIMERThe information contained in the following offering memorandum is proprietary andstrictly confidential. It is intended to be reviewed only by the party receiving it fromIRE Investment and it should not be made available to any other person or entitywithout the written consent of IRE Investment.
By taking possession of and reviewing the information contained herein the recipientagrees to hold and treat all such information in the strictest confidence. Therecipient further agrees that recipient will not photocopy or duplicate any part of theoffering memorandum. If you have no interest in the subject property, pleasepromptly return this offering memorandum to IRE Investment. This offeringmemorandum has been prepared to provide summary, unverified financial andphysical information to prospective purchasers, and to establish only a preliminarylevel of interest in the subject property.
The information contained herein is not a substitute for a thorough due diligenceinvestigation. IRE Investment has not made any investigation, and makes nowarranty or representation with respect to the income or expenses for the subjectproperty, the future projected financial performance of the property, the size andsquare footage of the property and improvements, the presence or absence ofcontaminating substances, PCBs or asbestos, the compliance with local, state andfederal regulations, the physical condition of the improvements thereon, or financialcondition or business prospects of any tenant, or any tenant’s plans or intentions tocontinue its occupancy of the subject property.
The information contained in this offering memorandum has been obtained fromsources we believe reliable; however, IRE Investment has not verified, and will notverify, any of the information contained herein, nor has IRE Investment conductedany investigation regarding these matters and makes no warranty or representationwhatsoever regarding the accuracy or completeness of the information provided. Allpotential buyers must take appropriate measures to verify all of the information setforth herein. Prospective buyers shall be responsible for their costs and expenses ofinvestigating the subject property.
powered by CREOP