parker drilling company 2016 annual reportannualreports.co.uk/hosteddata/annualreportarchive/... ·...
TRANSCRIPT

March 30, 2017
Dear Shareholders,
The last two years have represented the most challenging downturn in the energy sector in my nearly 30-year career. Overall, comparing 2016 to 2015 annual averages, Brent Crude Oil prices were down 16% and rig counts were down approximately 20% internationally and 50% in the United States. The impact of lower commodity prices and the resulting decline in global rig count were reflected in our financial results for the year as Parker Drilling’s revenues were down 40% in 2016 compared to 2015. Customer activity was down across all our business lines. As a result, utilization in our Drilling Services business declined and our Rental Tools Services business experienced lower equipment demand.
While our overall activity was lower, we made some notable achievements in 2016. We extended and added a customer-owned rig to our Sakhalin Island Operations and Management (O&M) contract. We won a 7-year O&M contract for the Hibernia platform offshore Atlantic Canada and we extended our contract for two Parker-owned rigs in Kazakhstan. These achievements resulted in an increase in our contracted backlog of 30%, to $379 million, when compared to the end of 2015. We accomplished all of this while achieving the lowest Total Recordable Incident Rate (TRIR) in our Company’s history, which continues to be better than the industry average, and setting a new rig performance record with only 0.77% downtime.
We also complied with all of our obligations under the Deferred Prosecution Agreement (DPA) and on May 20, 2016, the case was dismissed and the DPA was terminated. We remain committed to strict adherence with applicable legal requirements and are pleased to have this historical overhang behind us as we continue to strive ahead.
Throughout 2016, we remained focused on disciplined cost control and cash flow management, including proactive receivable collections. We reduced total capital expenditures from $88 million in 2015 to $29 million in 2016. Also, mid-year we amended our credit agreement, providing additional financial flexibility. As a result, we ended the year with $210 million in liquidity including $120 million in cash and $90 million available on our undrawn revolver.
Near the end of 2016 and early 2017 we began seeing some green shoots of activity in our Rental Tools Services business that we believe indicate a brighter 2017. By the end of the 2016, our U.S. Rental Tools Tubular Goods Utilization Index had increased 65% since bottoming in May 2016, in line with the increase in U.S. rig count. We were also awarded several new contracts for our International Rentals Tools segment in the Middle East, many utilizing the casing running tool technology we acquired in 2015.
Continuing to look forward, we are seeing a number of new opportunities develop, and there are increasing signs the stage is set for a more favorable business environment in 2017. Though the pace and magnitude of the recovery are unclear, we believe market confidence in a sustained upturn is gaining momentum.
In our U.S. (Lower 48) Drilling segment, we see opportunity for higher rig utilization in response to improved, more stable oil prices. For our International & Alaska Drilling segment, we expect activity to remain flat through the first half of 2017. However, we are seeing increased rig tendering activity in many of our markets for work anticipated to begin in the second half of 2017 and into 2018.
In our U.S. Rental Tools segment, we anticipate higher utilization of our rental equipment as U.S. land drilling activity increases. For our International Rental Tools segment, we expect higher activity levels largely driven by the startup and execution of well construction projects we were awarded late in 2016.
Our capital expenditures in 2017 are estimated to range from $40 to 50 million. In addition to maintenance expenditures, this amount includes planned investments in our rental tools business for tubular running services equipment needed to support recent contract awards and larger diameter, premium drill pipe. We expect the majority of our capital expenditures will occur in the first half of 2017.
We believe many of our markets will return to or exceed pre-downturn activity levels. To help prepare for this, on February 21, 2017, we raised approximately $72 million in cash through the issuance of 12 million shares of common stock and 500,000 shares of 7.25% Series A Mandatory Convertible Preferred Stock. We plan on using the net proceeds from the offerings for general corporate purposes, including working capital, capital expenditures, acquisitions or the repayment, redemption or refinancing of a portion of our indebtedness. Our main objective is to have sufficient cash to capture opportunities as the market recovers without incurring additional debt. We recognize the dilution incurred by our existing shareholders, so this decision was not made lightly, but we believe it is in the best interest of all shareholders and the Company.
Before concluding, I would like to take a moment to reflect on the passing of Robert L. Parker, Sr., the Company’s Chairman of the Board from 1969 until 2006. Starting in 1947, Mr. Parker spent the next 59 years with the Company. The son of the Company's founder, Mr. Parker was a visionary in the drilling industry. Under his leadership, Parker Drilling grew to become one of the most respected and trusted drilling companies in the world, ultimately operating in more than 50 countries. Mr. Parker and his son, Bobby Parker, were instrumental in establishing health, safety and environmental practices that have since been adopted throughout the drilling industry.
We continue to build on Mr. Parker’s legacy by delivering world record wells, down-time free operations and industry-beating safety records – and we are not finished. We will continue our journey to be better tomorrow than we were yesterday.
I look forward to reporting to you again next year,
Gary G. Rich Chairman, President & Chief Executive Officer

UNITED STATES SECURITIES AND EXCHANGE COMMISSIONWashington, D.C. 20549
Form 10-K(MARK ONE)
Annual Report Pursuant to Section 13 or 15(d) of the Securities Exchange Act of 1934
For the Fiscal Year Ended December 31, 2016 Or
Transition Report Pursuant to Section 13 or 15(d) of the Securities Exchange Act of 1934
FOR THE TRANSITION PERIOD FROM TO COMMISSION FILE NUMBER 1-7573
PARKER DRILLING COMPANY(Exact name of registrant as specified in its charter)
Delaware 73-0618660(State or other jurisdiction of
incorporation or organization) (I.R.S. Employer
Identification No.)
5 Greenway Plaza,Suite 100, Houston, Texas 77046
(Address of principal executive offices) (Zip code)
Registrant’s telephone number, including area code:(281) 406-2000
Securities registered pursuant to Section 12(b) of the Act:
Title of Each Class Name of Each Exchange on Which Registered:
Common Stock, par value $0.16 2/3 per share New York Stock ExchangeSecurities registered pursuant to Section 12(g) of the Act:
NoneIndicate by check mark if the registrant is a well-known seasoned issuer, as defined in Rule 405 of the Securities Act.
Yes No Indicate by check mark if the registrant is not required to file reports pursuant to Section 13 or Section 15(d) of the
Exchange Act. Yes No Indicate by check mark whether the registrant (1) has filed all reports required to be filed by Section 13 or 15(d) of the
Securities Exchange Act of 1934 during the preceding 12 months (or for such shorter period that the registrant was required to file such reports), and (2) has been subject to such filing requirements for the past 90 days. Yes No
Indicate by check mark whether the registrant has submitted electronically and posted on its corporate website, if any, every Interactive Data File required to be submitted and posted pursuant to Rule 405 of Regulation S-T during the preceding 12 months (or for such shorter period that the registrant was required to submit and post such files). Yes No
Indicate by check mark if disclosure of delinquent filers pursuant to Item 405 of Regulation S-K is not contained herein, and will not be contained, to the best of registrant’s knowledge, in definitive proxy or information statements incorporated by reference in Part III of this Form 10-K or any amendment to this Form 10-K.
Indicate by check mark whether the registrant is a large accelerated filer, an accelerated filer, a non-accelerated filer, or a smaller reporting company. See the definitions of “large accelerated filer,” “accelerated filer” and “smaller reporting company” in Rule 12b-2 of the Exchange Act. (Check one):
Large accelerated filer Accelerated filer Non-accelerated filer Smaller reporting company (Do not check if a smaller reporting company)
Indicate by check mark whether the registrant is a shell company (as defined in Rule 12b-2 of the Act). Yes No The aggregate market value of our common stock held by non-affiliates on June 30, 2016 was $274.1 million. At
February 16, 2017, there were 125,227,182 shares of our common stock outstanding. DOCUMENTS INCORPORATED BY REFERENCE
Portions of our definitive proxy statement for the Annual Meeting of Shareholders to be held on May 9, 2017 are incorporated by reference in Part III.
TABLE OF CONTENTS
Page
PART IItem 1. BusinessItem 1A. Risk FactorsItem 1B. Unresolved Staff CommentsItem 2. PropertiesItem 3. Legal ProceedingsItem 4. Mine Safety Disclosures
PART IIItem 5. Market for Registrant’s Common Equity, Related Stockholder Matters and Issuer Purchases of Equity
SecuritiesItem 6. Selected Financial DataItem 7. Management’s Discussion and Analysis of Financial Condition and Results of OperationsItem 7A. Quantitative and Qualitative Disclosures about Market RiskItem 8. Financial Statements and Supplementary DataItem 9. Changes in and Disagreements with Accountants on Accounting and Financial DisclosureItem 9A. Controls and ProceduresItem 9B. Other Information
PART IIIItem 10. Directors, Executive Officers and Corporate GovernanceItem 11. Executive CompensationItem 12. Security Ownership of Certain Beneficial Owners, Management and Related Stockholder MattersItem 13. Certain Relationships and Related Transactions, and Director IndependenceItem 14. Principal Accounting Fees and Services
PART IVItem 15. Exhibits and Financial Statement SchedulesSignaturesEX-12.1EX-21EX-23.1EX-31.1EX-31.2EX-32.1EX-32.2
19
19192121
2122234143868687
8888888888
8994
1
PART I
Item 1. Business
General
Unless otherwise indicated, the terms “Company,” “Parker,” “we,” “us” and “our” refer to Parker Drilling Company together with its subsidiaries and "Parker Drilling" refers solely to the parent, Parker Drilling Company. Parker Drilling was incorporated in the state of Oklahoma in 1954 after having been established in 1934. In March 1976, the state of incorporation of the Company was changed to Delaware. Our principal executive offices are located at 5 Greenway Plaza, Suite 100, Houston, Texas 77046.
We are an international provider of contract drilling and drilling-related services as well as rental tools and services. We have operated in over 50 countries since beginning operations in 1934, making us among the most geographically experienced drilling contractors and rental tools providers in the world. We currently have operations in 20 countries. Parker has participated in numerous world records for deep and extended-reach drilling land rigs and is an industry leader in quality, health, safety and environmental practices.
Our business is comprised of two business lines: (1) Drilling Services and (2) Rental Tools Services. We report our Drilling Services business as two reportable segments: (1) U.S. (Lower 48) Drilling and (2) International & Alaska Drilling. We report our Rental Tools Services business as two reportable segments: (1) U.S. Rental Tools and (2) International Rental Tools. For information regarding our reportable segments and operations by geographic areas for the years ended December 31, 2016, 2015 and 2014, see Note 12 - Reportable Segments in Item 8. Financial Statements and Supplementary Data and Item 7. Management's Discussion and Analysis of Financial Condition and Results of Operations.
Our Drilling Services Business
In our Drilling Services business, we drill oil and natural gas wells for customers in both the U.S. and international markets. We provide this service with both Company-owned rigs and customer-owned rigs. We refer to the provision of drilling services with customer-owned rigs as our operations and maintenance (O&M) service in which operators own their own drilling rigs but choose Parker Drilling to operate and maintain the rigs for them. The nature and scope of activities involved in drilling an oil and natural gas well is similar whether it is drilled with a Company-owned rig (as part of a traditional drilling contract) or a customer-owned rig (as part of an O&M contract). In addition, we provide project-related services, such as engineering, procurement, project management and commissioning of customer-owned drilling facility projects. We have extensive experience and expertise in drilling geologically difficult wells and in managing the logistical and technological challenges of operating in remote, harsh and ecologically sensitive areas.
U.S. (Lower 48) Drilling
Our U.S. (Lower 48) Drilling segment provides drilling services with our Gulf of Mexico (GOM) barge drilling rig fleet, and markets our U.S. (Lower 48) based O&M services. Our GOM barge drilling fleet operates barge rigs that drill for oil and natural gas in shallow waters in and along the inland waterways and coasts of Louisiana, Alabama and Texas. The majority of these wells are drilled in shallow water depths ranging from 6 to 12 feet. Our rigs are suitable for a variety of drilling programs, from inland coastal waters requiring shallow draft barges, to open water drilling on both state and federal water projects requiring more robust capabilities. The barge drilling industry in the GOM is characterized by cyclical activity where utilization and dayrates are typically driven by oil and natural gas prices and our customers’ access to project financing. Contract terms typically consist of well-to-well or multi-well programs, most commonly ranging from 20 to 120 days.
International & Alaska Drilling
Our International & Alaska Drilling segment provides drilling services, using both Company-owned rigs and O&M contracts, and project-related services. We strive to deploy our fleet of Company-owned rigs in markets where we expect to have opportunities to keep the rigs consistently utilized and build a sufficient presence to achieve efficient operating scale. During the year ended December 31, 2016, we had rigs operating on Sakhalin Island, Russia and in Alaska, Kazakhstan, Indonesia, the Kurdistan Region of Iraq, Guatemala, and Mexico. In addition, we have O&M and ongoing project-related services for customer-owned rigs in Abu Dhabi, Kuwait, Canada and on Sakhalin Island, Russia.
The drilling markets in which this segment operates have one or more of the following characteristics:
• customers that typically are major, independent or national oil and natural gas companies or integrated service providers;

2
• drilling programs in remote locations with little infrastructure, requiring a large inventory of spare parts and other ancillary equipment and self-supported service capabilities;
• complex wells and/or harsh environments (such as high pressures, deep depths, hazardous or geologically challenging conditions and sensitive environments) requiring specialized equipment and considerable experience to drill; and
• drilling and O&M contracts that generally cover periods of one year or more.
Our Rental Tools Services Business
In our Rental Tools Services business, we provide premium rental equipment and services to exploration and production (E&P) companies, drilling contractors and service companies on land and offshore in the U.S. and select international markets. Tools we provide include standard and heavy-weight drill pipe, all of which are available with standard or high-torque connections, tubing, pressure control equipment, including blow-out preventers (BOPs), drill collars and more. We also provide well construction services, which include tubular running services and downhole tools, and well intervention services, which include whipstock, fishing and related services, as well as inspection and machine shop support. Rental tools are used during drilling programs and are requested by the customer when they are needed, requiring us to keep a broad inventory of rental tools in stock. Rental tools are usually rented on a daily or monthly basis. On April 17, 2015, we acquired 2M-Tek, a Louisiana-based manufacturer of equipment for tubular running and related well services (the 2M-Tek Acquisition). See Note 2 - Acquisitions in Item 8. Financial Statements and Supplementary Data for further discussion.
U.S. Rental Tools
Our U.S. rental tools segment is headquartered in New Iberia, Louisiana. We maintain an inventory of rental tools for deepwater, drilling, completion, workover, and production applications at facilities in Louisiana, Texas, Oklahoma, Wyoming, North Dakota and West Virginia.
Our largest single market for rental tools is U.S. land drilling, a cyclical market driven primarily by oil and natural gas prices and our customers' access to project financing. A portion of our U.S. rental tools business is supplying tubular goods and other equipment to offshore GOM customers.
International Rental Tools
Our international rental tools segment is headquartered in Dubai, United Arab Emirates (UAE). We maintain an inventory of rental tools and provide well construction, well intervention, and surface and tubular services to our customers in the Middle East, Latin America, United Kingdom, Europe, and Asia-Pacific regions.
Our Business Strategy
We intend to successfully compete in select energy services businesses that benefit our customers’ exploration, appraisal and development programs, and in which operational execution is the key measure of success. We will do this by:
• Consistently delivering innovative, reliable, and efficient results that help our customers reduce their operational risks and manage their operating costs; and
• Investing to improve and grow our existing business lines and to expand the scope of products and services we offer, both organically and through acquisitions.
Our Core Competencies
We believe our core competencies are the foundation for delivering operational excellence to our customers. Applying and strengthening these core competencies will be a key factor in our success:
Customer-Aligned Operational Excellence: Our daily focus is meeting the needs of our customers. We strive to anticipate our customers’ challenges and provide innovative, reliable and efficient solutions to help them achieve their business objectives.
Rapid Personnel Development: Motivated, skilled and effective people are critical to the successful execution of our strategy. We strive to attract and retain the best people, to develop depth and strength in key skills, and to provide a safety-and solutions-oriented workforce to our customers.
Selective and Effective Market Entry: We are selective about the services we provide, geographies in which we operate, and customers we serve. We intend to build Parker’s business in markets with the best potential for sustained growth, profitability

3
and operating scale. We are strategic, timely and intentional when we enter new markets and when we grow organically or through acquisitions or investments in new business ventures.
Enhanced Asset Management and Predictive Maintenance: We believe well-maintained rigs, equipment and rental tools are critical to providing reliable results for our customers. We employ predictive and preventive maintenance programs and training to sustain high levels of effective utilization and to provide reliable operating performance and efficiency.
Standard, Modular and Configurable Processes and Equipment: To address the challenging and harsh environments in which our customers operate, we develop standardized processes and equipment that can be configured to meet each project’s distinct technological requirements. Repeatable processes and modular equipment leverage our investments in assets and employees, increase efficiency and reduce disruption.
We believe there are tangible rewards from delivering value to our customers through superior execution of our core competencies. When we deliver innovative, reliable and efficient solutions aligned with our customers’ needs, we believe we are well-positioned to earn premium rates, generate follow-on business and create growth opportunities that enhance our financial performance and advance our strategy.
Customers and Scope of Operations
Our customer base consists of major, independent and national oil and natural gas E&P companies and integrated service providers. Each of our segments depends on a limited number of key customers and the loss of any one or more key customers could have a material adverse effect on a segment. In 2016, our largest customer, Exxon Neftegas Limited (ENL), accounted for approximately 38.7 percent of our total revenues. In 2016, our second largest customer, BP Exploration Alaska, Inc. (BP), constituted approximately 12.0 percent of our consolidated revenues. For information regarding our reportable segments and operations by geographic areas for the years ended December 31, 2016, 2015 and 2014, see Note 12 - Reportable Segments in Item 8. Financial Statements and Supplementary Data and Item 7. Management's Discussion and Analysis of Financial Condition and Results of Operations.
Competition
We operate in competitive businesses characterized by high capital requirements, rigorous technological challenges, evolving regulatory requirements and challenges in securing and retaining qualified field personnel.
In drilling markets, most contracts are awarded on a competitive bidding basis and operators often consider reliability, efficiency and safety in addition to price. We have been successful in differentiating ourselves from competitors through our drilling performance and safety record, and through providing services that help our customers manage their operating costs and mitigate their operational risks.
In international drilling markets, we compete with a number of international drilling contractors as well as local contractors. Although local drilling contractors often have lower labor and mobilization costs, we are generally able to distinguish ourselves from these companies based on our technical expertise, safety performance, quality of service, and experience. We believe our expertise in operating in challenging environments has been a significant factor in securing contracts.
In the GOM barge drilling market, we compete with a small number of contractors. We have the largest number and greatest diversity of rigs available in this market, allowing us to provide equipment and services that are well-matched to customers’ requirements. We believe the market for drilling contracts will continue to be competitive with continued focus on reliability, efficiency and safety, in addition to price.
In rental tools markets, we compete with suppliers both larger and smaller than our business, some of which are part of larger enterprises. We compete against other rental tools companies based on breadth of inventory, availability and price of product and quality of service. In the U.S. market, our network of locations provides broad and efficient product availability. In international markets, some of our rental tools business is obtained in conjunction with our drilling and O&M projects.
Contracts
Most drilling contracts are awarded based on competitive bidding. The rates specified in drilling contracts vary depending upon the type of rig employed, equipment and services supplied, crew complement, geographic location, term of the contract, competitive conditions and other variables. Our contracts generally provide for an operating dayrate during drilling operations, with lower rates for periods of equipment downtime, customer stoppage, well-to-well rig moves, adverse weather or other conditions, and no payment when certain conditions continue beyond contractually established parameters. Contracts typically provide for a different dayrate or specified fixed payments during mobilization or demobilization. The terms of most of our contracts are based on either a specified period of time or a specified number of wells. The contract term in some instances may be extended

4
by the customer exercising options for an additional time period or for the drilling of additional wells, or by exercising a right of first refusal. Most of our contracts allow termination by the customer prior to the end of the term without penalty under certain circumstances, such as the loss of or major damage to the drilling unit or other events that cause the suspension of drilling operations beyond a specified period of time. See “Certain of our contracts are subject to cancellation by our customers without penalty and with little or no notice.” in Item 1A. Risk Factors. Certain contracts require the customer to pay an early termination fee if the customer terminates a contract before the end of the term without cause. Our project services contracts include engineering, procurement, and project management consulting, for which we are compensated through labor rates and cost plus markup basis for non-labor items.
Rental tools contracts are typically on a dayrate basis with rates determined based on type of equipment and competitive conditions. Historically, rental rates generally applied from the time the equipment leaves our facility until it is returned; however, due to current market conditions, rental rates may apply only when the customer is actually using the equipment and the customer is not charged when the equipment is not in use. Rental contracts generally require the customer to pay for lost-in-hole or damaged equipment. Some of the services provided in the rental tools segment are billed per well section with pricing determined by the length and diameter of the well section.
Seasonality
Our rigs in the inland waters of the GOM are subject to severe weather during certain periods of the year, particularly during hurricane season from June through November, which could halt operations for prolonged periods or limit contract opportunities during that period. In addition, mobilization, demobilization, or well-to-well movements of rigs in arctic regions can be affected by seasonal changes in weather or weather so severe that conditions are deemed too unsafe to operate.
Backlog
Backlog is our estimate of the dollar amount of drilling contract revenues we expect to realize in the future as a result of executing awarded contracts. The Company's backlog of firm orders was approximately $379 million at December 31, 2016 and $291 million at December 31, 2015 and is primarily attributable to the International & Alaska segment of our Drilling Services business. We estimate that, as of December 31, 2016, 43.0 percent of our backlog will be recognized as revenues within one year.
The amount of actual revenues earned and the actual periods during which revenues are earned could be different from amounts disclosed in our backlog calculations due to a lack of predictability of various factors, including unscheduled repairs, maintenance requirements, weather delays, contract terminations or renegotiations, new contracts and other factors. See "Our backlog of contracted revenue may not be fully realized and may reduce significantly in the future, which may have a material adverse effect on our financial position, results of operations or cash flows" in Item 1A. Risk Factors.
Insurance and Indemnification
Substantially all of our operations are subject to hazards that are customary for oil and natural gas drilling operations, including blowouts, reservoir damage, loss of production, loss of well control, lost or stuck drill strings, equipment defects, cratering, oil and natural gas well fires and explosions, natural disasters, pollution, mechanical failure and damage or loss during transportation. Some of our fleet is also subject to hazards inherent in marine operations, either while on-site or during mobilization, such as capsizing, sinking, grounding, collision, damage from severe weather and marine life infestations. These hazards could result in damage to or destruction of drilling equipment, personal injury and property damage, suspension of operations or environmental damage, which could lead to claims by third parties or customers, suspension of operations and contract terminations. We have had accidents in the past due to some of these hazards.
Our contracts provide for varying levels of indemnification between ourselves and our customers. We maintain insurance with respect to personal injuries, damage to or loss of equipment and various other business risks, including well control and subsurface risk. Our insurance policies typically have 12-month policy periods.
Our insurance program provides coverage, to the extent not otherwise paid by the customer under the indemnification provisions of the drilling or rental tool contract, for liability due to well control events and liability arising from third-party claims, including wrongful death and other personal injury claims by our personnel as well as claims brought on behalf of individuals who are not our employees. Generally, our insurance program provides liability coverage up to $350.0 million, with retentions of $1.0 million or less.
Well control events generally include an unintended flow from the well that cannot be contained by using equipment on site (e.g., a BOP), by increasing the weight of drilling fluid or by diverting the fluids safely into production. Our insurance program provides coverage for third-party liability claims relating to sudden and accidental pollution from a well control event up to $350.0 million per occurrence. A separate limit of $10.0 million exists to cover the costs of re-drilling of the well and well control

5
costs under a Contingent Operators Extra Expense policy. For our rig-based operations, remediation plans are in place to prevent the spread of pollutants and our insurance program provides coverage for removal, response and remedial actions. We retain the risk for liability not indemnified by the customer below the retention and in excess of our insurance coverage.
Based upon a risk assessment and due to the high cost, high self-insured retention and limited coverage for windstorms in the GOM, we have elected not to purchase windstorm insurance for our barge rigs in the GOM. Although we have retained the risk for physical loss or damage for these rigs arising from a named windstorm, we have procured insurance coverage for removal of a wreck caused by a windstorm.
Our contracts provide for varying levels of indemnification from our customers and may require us to indemnify our customers. Liability with respect to personnel and property is customarily assigned on a “knock-for-knock” basis, which means we and our customers customarily assume liability for our respective personnel and property regardless of fault. In addition, our customers typically indemnify us for damage to our equipment down-hole, and in some cases our subsea equipment, generally based on replacement cost minus some level of depreciation. However, in certain contracts we may assume liability for damage to our customer’s property and other third-party property on the rig and in other contracts we are not indemnified by our customers for damage to their property and, accordingly, could be liable for any such damage under applicable law.
Our customers typically assume responsibility for and indemnify us from any loss or liability resulting from pollution, including clean-up and removal and third-party damages, arising from operations under the contract and originating below the surface of the land or water, including losses or liability resulting from blowouts or cratering of the well. In some contracts, however, we may have liability for damages resulting from such pollution or contamination caused by our gross negligence or, in some cases, ordinary negligence.
We generally indemnify the customer for legal and financial consequences of spills of industrial waste, lubricants, solvents and other contaminants (other than drilling fluid) on the surface of the land or water originating from our rigs or equipment. We typically require our customers to retain liability for spills of drilling fluid (sometimes called “mud”) which circulates down-hole to the drill bit, lubricates the bit and washes debris back to the surface. Drilling fluid often contains a mixture of synthetics, the exact composition of which is prescribed by the customer based on the particular geology of the well being drilled.
The above description of our insurance program and the indemnification provisions typically found in our contracts is only a summary as of the date hereof and is general in nature. Our insurance program and the terms of our drilling and rental tool contracts may change in the future. In addition, the indemnification provisions of our contracts may be subject to differing interpretations, and enforcement of those provisions may be limited by public policy and other considerations.
If any of the aforementioned operating hazards results in substantial liability and our insurance and contractual indemnification provisions are unavailable or insufficient, our financial condition, operating results or cash flows may be materially adversely affected.
Employees
The following table sets forth the composition of our employee base:
December 31, 2016 2015
U.S. (Lower 48) Drilling 111 160International & Alaska Drilling 1,078 1,286U.S. Rental Tools 198 248International Rental Tools 636 694Corporate 176 179
Total employees 2,199 2,567
Environmental Considerations
Our operations are subject to numerous U.S. federal, state, and local laws and regulations, as well as the laws and regulations of other jurisdictions in which we operate, pertaining to the environment or otherwise relating to environmental protection. Numerous governmental agencies, such as the U.S. Environmental Protection Agency (EPA), issue regulations to implement and enforce laws pertaining to the environment, which often require difficult and costly compliance measures that carry substantial administrative, civil and criminal penalties or may result in injunctive relief for failure to comply. These laws and regulations may require the acquisition of a permit before drilling commences; restrict the types, quantities and concentrations

6
of various substances that can be released into the environment in connection with drilling and production activities; limit or prohibit construction or drilling activities on certain lands lying within wilderness, wetlands, ecologically sensitive and other protected areas; require remedial action to clean up pollution from former operations; and impose substantial liabilities for pollution resulting from our operations. Changes in environmental laws and regulations occur frequently, and any changes that result in more stringent and costly compliance could adversely affect our operations and financial position, as well as those of similarly situated entities operating in the same markets. While our management believes that we comply with current applicable environmental laws and regulations, there is no assurance that compliance can be maintained in the future.
As an owner or operator of both onshore and offshore facilities, including mobile offshore drilling rigs in or near waters of the United States, we may be liable for the costs of clean up and damages arising out of a pollution incident to the extent set forth in federal statutes such as the Federal Water Pollution Control Act (commonly known as the Clean Water Act (CWA)), as amended by the Oil Pollution Act of 1990 (OPA); the Clean Air Act (CAA); the Outer Continental Shelf Lands Act (OCSLA); the Comprehensive Environmental Response, Compensation and Liability Act (CERCLA); the Resource Conservation and Recovery Act (RCRA); the Emergency Planning and Community Right to Know Act (EPCRA); and the Hazardous Materials Transportation Act (HMTA) as well as comparable state laws. In addition, we may also be subject to civil claims arising out of any such incident.
The OPA and related regulations impose a variety of regulations on “responsible parties” related to the prevention of spills of oil or other hazardous substances and liability for damages resulting from such spills. “Responsible parties” include the owner or operator of a vessel, pipeline or onshore facility, or the lessee or permittee of the area in which an offshore facility is located. The OPA assigns liability for oil removal costs and a variety of public and private damages to each responsible party. The OPA also requires some facilities to demonstrate proof of financial responsibility and to prepare an oil spill response plan. Failure to comply with ongoing requirements or inadequate cooperation in a spill may subject a responsible party to civil or criminal enforcement actions.
The OCSLA authorizes regulations relating to safety and environmental protection applicable to lessees and permittees operating on the Outer Continental Shelf. Specific design and operational standards may apply to Outer Continental Shelf vessels, rigs, platforms, vehicles and structures. The Bureau of Safety and Environmental Enforcement (BSEE) regulates the design and operation of well control and other equipment at offshore production sites, implementation of safety and environmental management systems, and mandatory third-party compliance audits, among other requirements. Violations of environmentally related lease conditions or regulations issued pursuant to the OCSLA can result in substantial civil and criminal penalties as well as potential court injunctions curtailing operations and the cancellation of leases. Such enforcement liabilities, delay or restriction of activities can result from either governmental or citizen prosecution.
Our operations are also governed by laws and regulations related to workplace safety and worker health, primarily the Occupational Safety and Health Act and regulations promulgated thereunder. In addition, various other governmental and quasi-governmental agencies require us to obtain certain miscellaneous permits, licenses and certificates with respect to our operations. The kind of permits, licenses and certificates required by our operations depend upon a number of factors. We believe we have the necessary permits, licenses and certificates that are material to the conduct of our existing business.
CERCLA (also known as “Superfund”) and comparable state laws impose potential liability without regard to fault or the legality of the activity, on certain classes of persons who are considered to be responsible for the release of “hazardous substances” into the environment. While CERCLA exempts crude oil from the definition of hazardous substances for purposes of the statute, our operations may involve the use or handling of other materials that may be classified as hazardous substances. CERCLA assigns strict liability to a broad class of potentially responsible parties for all response and remediation costs, as well as natural resource damages. In addition, persons responsible for release of hazardous substances under CERCLA may be subject to joint and several liability for the cost of cleaning up the hazardous substances released into the environment and for damages to natural resources.
RCRA and comparable state laws regulate the management and disposal of solid and hazardous wastes. Current RCRA regulations specifically exclude from the definition of hazardous waste “drilling fluids, produced waters, and other wastes associated with the exploration, development or production of crude oil, natural gas or geothermal energy.” However, these wastes and other wastes may be otherwise regulated by EPA or state agencies. Moreover, ordinary industrial wastes, such as paint wastes, spent solvents, laboratory wastes, and used oils, may be regulated as hazardous waste. Although the costs of managing solid and hazardous wastes may be significant, we do not expect to experience more burdensome costs than competitor companies involved in similar drilling operations.
The CAA and similar state laws and regulations restrict the emission of air pollutants and may also impose various monitoring and reporting requirements. In addition, those laws may require us to obtain permits for the construction, modification, or operation of certain projects or facilities and the utilization of specific equipment or technologies to control emissions. For example, the EPA has adopted regulations known as “RICE MACT” that require the use of “maximum achievable control

7
technology” to reduce formaldehyde and other emissions from certain stationary reciprocating internal combustion engines, which can include portable engines used to power drilling rigs.
Some scientific studies have suggested that emissions of certain gases including carbon dioxide and methane, commonly referred to as “greenhouse gases” (GHGs), may be contributing to the warming of the atmosphere resulting in climate change. There are a variety of legislative and regulatory developments, proposals, requirements, and initiatives that have been introduced in the U.S. and international regions in which we operate that are intended to address concerns that emissions of GHGs are contributing to climate change and these may increase costs of compliance for our drilling services or our customer's operations. Among these developments, the Kyoto Protocol to the 1992 United Nations Framework Convention on Climate Change (UNFCC) established a set of emission targets for GHGs that became binding on all those countries that had ratified it. The Kyoto Protocol was followed by the Paris Agreement of the 2015 UNFCC. In April 2016, the United States signed the Paris Agreement, which requires ratifying countries to set more ambitious GHG emission targets.
Because our business depends on the level of activity in the oil and natural gas industry, existing or future laws, regulations, treaties or international agreements related to GHGs and climate change, including incentives to conserve energy or use alternative energy sources, could have a negative impact on our business if such laws, regulations, treaties or international agreements reduce the worldwide demand for oil and natural gas or otherwise result in reduced economic activity generally. In addition, such laws, regulations, treaties or international agreements could result in increased compliance costs or additional operating restrictions, which may have a negative impact on our business. In addition to potential impacts on our business directly or indirectly resulting from climate-change legislation or regulations, our business also could be negatively affected by climate-change related physical changes or changes in weather patterns. An increase in severe weather patterns could result in damages to or loss of our rigs, impact our ability to conduct our operations and result in a disruption of our customers’ operations.
Executive Officers
Officers are elected each year by the board of directors following the annual shareholders' meeting for a term of one year or until the election and qualification of their successors. The current executive officers of the Company and their ages, positions with the Company and business experience are presented below:
• Gary G. Rich, 58, joined the Company in October 2012 as the president and chief executive officer. Mr. Rich also serves as Chairman of the Company’s board of directors. He is an industry veteran with over 30 years of global technical, commercial and operations experience. Mr. Rich came to Parker Drilling after a 25-year career with Baker Hughes Incorporated. Mr. Rich served as vice president of global sales for Baker Hughes from August 2011 to October 2012, and prior to that role, he served as president of that company’s European operations from April 2009 to August 2011. Previously, Mr. Rich was president of Hughes Christensen Company, a division of Baker Hughes primarily focused on the production and distribution of drilling bits for the petroleum industry.
• Christopher T. Weber, 44, joined the Company in May 2013 as the senior vice president and chief financial officer. Prior to joining the Company, Mr. Weber served as the vice president and treasurer of Ensco plc, a public offshore drilling company, from 2011 to May 2013. From 2009 to 2011, Mr. Weber served as vice president, operations for Pride International, Inc., prior to which he served as director, corporate planning and development from 2006 to 2009.
• Jon-Al Duplantier, 49, is the senior vice president, chief administrative officer, general counsel, and secretary of the Company, a position held since 2013. Mr. Duplantier has over 20 years' experience in the oil and natural gas industry. Mr. Duplantier joined the Company in 2009 as vice president and general counsel. From 1995 to 2009, Mr. Duplantier served in several legal and business roles at ConocoPhillips, including senior counsel – Exploration and Production, vice president and general counsel – Conoco Phillips Indonesia, and vice president and general counsel – Dubai Petroleum Company. Prior to joining ConocoPhillips, he served as a patent attorney for DuPont from 1992 to 1995.
• Bryan R. Collins, 50, was appointed president of drilling operations for the Company on January 1, 2017. Prior to this appointment, Mr. Collins served as vice president - Arctic and Latin America operations from April 2016 to December 2016, vice president of Arctic operations from March 2013 to April 2016, and global director of business development from February 2012 to March 2013. Before joining the Company, Mr. Collins served in various operational and senior management roles at Schlumberger, Ltd., including vice president for drilling and measurements operations in Russia. Prior to his time at Schlumberger, Mr. Collins served as a global account manager for ExxonMobil’s worldwide drilling operations.
Other Parker Drilling Company Officers
• Leslie K. Nagy, 42, was appointed principal accounting officer and controller on April 1, 2014. Mrs. Nagy served as director of finance and assistant controller of the Company from December 2012 through March 2014, as assistant

8
controller of the Company from May 2011 to December 2012, and as manager of external reporting and general accounting of the Company from August 2010 to May 2011. Prior to joining Parker Drilling, Mrs. Nagy worked for Ernst & Young LLP from 1997 to 2010.
• David W. Tucker, 61, treasurer, joined the Company in 1978 as a financial analyst and served in various financial and accounting positions before being named chief financial officer of our formerly wholly-owned subsidiary, Hercules Offshore Corporation, in February 1998. Mr. Tucker was named treasurer of the Company in 1999.
Departure of Officers
On January 4, 2017, the Company announced that David R. Farmer, senior vice president - Europe, Middle East and Asia and Philip L. Agnew, senior vice president and chief technical officer both left the Company, effective January 1, 2017. Additionally, Philip A. Schlom, vice president, global compliance and internal audit, resigned effective December 31, 2016. The global compliance and internal audit functions continue to report to Mr. Duplantier.
Available Information
Our annual reports on Form 10-K, quarterly reports on Form 10-Q, current reports on Form 8-K and amendments to those reports are made available free of charge on our website at http://www.parkerdrilling.com as soon as reasonably practicable after we electronically file such material with, or furnish such material to, the Securities and Exchange Commission (SEC). The public may read and copy any materials we have filed with the SEC at the SEC's Public Reference Room at 100 F Street, N.E., Washington, D.C. 20549. Information on the operation of the Public Reference Room may be obtained by calling the SEC at 1-800-SEC-0330. Additionally, our reports, proxy and information statements and our other SEC filings are available on an Internet website maintained by the SEC at http://www.sec.gov.
9
Item 1A. Risk Factors
Our businesses involve a high degree of risk. You should consider carefully the risks and uncertainties described below and the other information included in this Form 10-K, including Item 7. Management’s Discussion and Analysis of Financial Condition and Results of Operations and Item 8. Financial Statements and Supplementary Data. While these are the risks and uncertainties we believe are most important for you to consider, they are not the only risks or uncertainties facing us or which may adversely affect our business. If any of the following risks or uncertainties actually occurs, our business, financial condition or results of operations could be adversely affected.
Oil and natural gas prices have declined substantially since 2014 and are expected to remain depressed for the foreseeable future. Sustained depressed prices of oil and natural gas will adversely affect our financial condition, results of operations and cash flows.
Oil and natural gas prices and market expectations regarding potential changes in these prices are volatile and are likely to continue to be volatile in the future. Increases or decreases in oil and natural gas prices and expectations of future prices could have an impact on our customers’ long-term exploration and development activities, which in turn could materially affect our business and financial performance. Furthermore, higher oil and natural gas prices do not necessarily result immediately in increased drilling activity because our customers’ expectations of future oil and natural gas prices typically drive demand for our drilling services. The oil and natural gas industry has historically experienced periodic downturns, which have been characterized by diminished demand for oilfield services and downward pressure on the prices we charge. A prolonged downturn in the oil and natural gas industry could result in a further reduction in demand for oilfield services and could continue to adversely affect our financial condition, results of operations and cash flows. The average price of oil during the fourth quarter of 2016 was $49.29 per barrel, which represented a 17 percent increase compared to the fourth quarter of 2015 and a 10 percent increase compared to the third quarter of 2016. These average oil prices remain well below the average prices in 2014. Oil and natural gas prices and demand for our services also depend upon numerous factors which are beyond our control, including:
• the demand for oil and natural gas;
• the cost of exploring for, producing and delivering oil and natural gas;
• expectations regarding future energy prices;
• advances in exploration, development and production technology;
• the ability of the Organization of Petroleum Exporting Countries (OPEC) to set and maintain production levels and prices;
• the level of production by non-OPEC countries;
• the adoption or repeal of laws and government regulations, both in the United States and other countries;
• the imposition or lifting of economic sanctions against certain regions, persons and other entities;
• the number of ongoing and recently completed rig construction projects which may create overcapacity;
• local and worldwide military, political and economic events, including events in the oil producing regions of Africa, the Middle East, Russia, Central Asia, Southeast Asia and Latin America;
• weather conditions;
• expansion or contraction of worldwide economic activity, which affects levels of consumer and industrial demand;
• the rate of discovery of new oil and natural gas reserves;
• domestic and foreign tax policies;
• acts of terrorism in the United States or elsewhere;
• the development and use of alternative energy sources; and
• the policies of various governments regarding exploration and development of their oil and natural gas reserves.

10
Demand for the majority of our services is substantially dependent on the levels of expenditures by the oil and natural gas industry. A substantial or an extended decline in oil and natural gas prices could result in lower expenditures by the oil and natural gas industry, which could have a material adverse effect on our financial condition, results of operations and cash flows.
Demand for the majority of our services depends substantially on the level of expenditures for the exploration, development and production of oil or natural gas reserves by the major, independent and national oil and natural gas E&P companies and large integrated service companies that comprise our customer base. These expenditures are generally dependent on the industry’s view of future oil and natural gas prices and are sensitive to the industry’s view of future economic growth and the resulting impact on demand for oil and natural gas. Declines in oil and natural gas prices have and may continue to result in project modifications, delays or cancellations, general business disruptions, and delays in payment of, or nonpayment of, amounts that are owed to us, any of which could continue to have a material adverse effect on our financial condition, results of operations and cash flows. Historically, when drilling activity and spending decline, utilization and dayrates also decline and drilling may be reduced or discontinued, resulting in an oversupply of drilling rigs. The recent decrease in oil prices has in turn caused a significant decline in the demand for drilling services. The rig utilization rate of our International & Alaska Drilling segment has fallen from 59 percent for the year ended December 31, 2015 to 40 percent as for the year ended December 31, 2016. Similarly, the rig utilization rate of our U.S. (Lower 48) Drilling segment has declined from 15 percent for the year ended December 31, 2015 to 5 percent for the year ended December 31, 2016. Furthermore, operators implemented significant reductions in capital spending in their budgets, including the cancellation or deferral of existing programs, and are expected to continue to operate under reduced budgets for the foreseeable future.
Our debt levels and debt agreement restrictions may limit our liquidity and flexibility in obtaining additional financing and in pursuing other business opportunities.
As of December 31, 2016, we had:
• $585.0 million principal amount of long-term debt;
• $37.3 million of operating lease commitments; and
• $9.8 million of standby letters of credit.
Our ability to meet our debt service obligations depends on our ability to generate positive cash flows from operations. We have in the past, and may in the future, incur negative cash flows from one or more segments of our operating activities. Our future cash flows from operating activities will be influenced by the demand for our drilling services, the utilization of our rigs, the dayrates that we receive for our rigs, demand for our rental tools, oil and natural gas prices, general economic conditions, and other factors affecting our operations, many of which are beyond our control.
If we are unable to service our debt obligations, we may have to take one or more of the following actions:
• delay spending on capital projects, including maintenance projects and the acquisition or construction of additional rigs, rental tools and other assets;
• issue additional equity;
• sell assets; or
• restructure or refinance our debt.
Additional indebtedness or equity financing may not be available to us in the future for the refinancing or repayment of existing indebtedness, or if available, such additional indebtedness or equity financing may not be available on a timely basis, or on terms acceptable to us and within the limitations specified in our then existing debt instruments. In addition, in the event we decide to sell assets, we can provide no assurance as to the timing of any asset sales or the proceeds that could be realized from any such asset sale. Our ability to generate sufficient cash flow from operating activities to pay the principal and interest on our indebtedness is subject to certain market conditions and other factors which are beyond our control.
Increases in the level of our debt and restrictions in the covenants contained in the instruments governing our debt could have important consequences to you. For example, they could:
• result in a reduction of our credit rating, which would make it more difficult for us to obtain additional financing on acceptable terms;

11
• require us to dedicate a substantial portion of our cash flows from operating activities to the repayment of our debt and the interest associated with our debt;
• limit our operating flexibility due to financial and other restrictive covenants, including restrictions on incurring additional debt and creating liens on our properties;
• place us at a competitive disadvantage compared with our competitors that have relatively less debt; and
• make us more vulnerable to downturns in our business.
Our current operations and future growth may require significant additional capital, and the amount of our indebtedness could impair our ability to fund our capital requirements.
Our business requires substantial capital. We may require additional capital in the event of growth opportunities, unanticipated maintenance requirements or significant departures from our current business plan.
Additional financing may not be available on a timely basis or on terms acceptable to us and within the limitations contained in our Second Amended and Restated Credit Agreement (as amended, the 2015 Secured Credit Agreement) and the indentures governing our outstanding 7.50% Senior Notes due 2020 (7.50% Notes) and 6.75% Senior Notes due 2022 (6.75% Notes, and collectively with the 7.50% Notes, the Senior Notes). Failure to obtain additional financing, should the need for it develop, could impair our ability to fund capital expenditure requirements and meet debt service requirements and could have an adverse effect on our business.
Our 2015 Secured Credit Agreement and the indentures for our Senior Notes impose significant operating and financial restrictions, which may prevent us in the future from obtaining financing or capitalizing on business opportunities.
The 2015 Secured Credit Agreement, the amendments thereto, and the indentures governing our Senior Notes impose significant operating and financial restrictions on us. These restrictions limit our ability to:
• make investments and other restricted payments, including dividends;
• incur additional indebtedness;
• create liens;
• engage in sale leaseback transactions;
• repurchase our common stock or Senior Notes;
• sell our assets or consolidate or merge with or into other companies; and
• engage in transactions with affiliates.
These limitations are subject to a number of important qualifications and exceptions. Our 2015 Secured Credit Agreement also requires us to maintain ratios for consolidated leverage, asset coverage, consolidated interest coverage, and consolidated senior secured leverage. These covenants may adversely affect our ability to finance our future operations and capital needs and to pursue available business opportunities.
A breach of any of the covenants in the 2015 Secured Credit Agreement or in the Senior Notes could result in a default with respect to the related indebtedness. If a default were to occur, the lenders under our 2015 Secured Credit Agreement and the holders of our Senior Notes could elect to declare the indebtedness, if any outstanding at that time, together with accrued interest, immediately due and payable. If the repayment of the indebtedness were to be accelerated after any applicable notice or grace periods, we may not have sufficient funds to repay the indebtedness.
Our backlog of contracted revenues may not be fully realized and may reduce significantly in the future, which may have a material adverse effect on our financial position, results of operations or cash flows.
Our expected revenues under existing contracts (“contracted revenues”) may not be fully realized due to a number of factors, including rig or equipment downtime or suspension of operations. Several factors could cause downtime or a suspension of operations, many of which are beyond our control, including:
• breakdowns of our equipment or the equipment of others necessary for continuation of operations;
• work stoppages, including labor strikes;

12
• shortages of material and skilled labor;
• severe weather or harsh operating conditions;
• the occurrence or threat of epidemic or pandemic diseases or any government response to such occurrence or threat;
• the early termination of contracts; and
• force majeure events.
Liquidity issues could lead our customers to go into bankruptcy or could encourage our customers to seek to repudiate, cancel or renegotiate our contracts for various reasons. Some of our contracts permit early termination of the contract by the customer for convenience (without cause), generally exercisable upon advance notice to us and in some cases without making an early termination payment to us. There can be no assurances that our customers will be able or willing to fulfill their contractual commitments to us.
The recent decline in oil prices, the perceived risk of low oil prices for an extended period, and the resulting downward pressure on utilization is causing and may continue to cause some customers to consider early termination of select contracts despite having to pay early termination fees in some cases. In addition, customers may request to re-negotiate the terms of existing contracts. Furthermore, as our existing contracts roll off, we may be unable to secure replacement contracts for our rigs, equipment or services. We have been in discussions with some of our customers regarding these issues. Therefore, revenues recorded in future periods could differ materially from our current contracted revenues, which could have a material adverse effect on our financial position, results of operations or cash flows.
Certain of our contracts are subject to cancellation by our customers without penalty and with little or no notice.
In periods of extended market weakness similar to the current environment, our customers may not be able to honor the terms of existing contracts, may terminate contracts even where there may be onerous termination fees, or may seek to renegotiate contract dayrates and terms in light of depressed market conditions. Certain of our contracts are subject to cancellation by our customers without penalty and with relatively little or no notice. The recent decline in oil prices, the perceived risk of a further decline in oil prices, and the resulting downward pressure on utilization has caused and may continue to cause some customers to terminate contracts without cause. When drilling market conditions are depressed, a customer may no longer need a rig or rental tools that is currently under contract or may be able to obtain comparable equipment at lower dayrates. Further, due to government actions, a customer may no longer be able to operate in, or it may not be economical to operate in, certain regions. As a result, customers may leverage their termination rights in an effort to renegotiate contract terms.
Our customers may also seek to terminate contracts for cause, such as the loss of or major damage to the drilling unit or other events that cause the suspension of drilling operations beyond a specified period of time. If we experience operational problems or if our equipment fails to function properly and cannot be repaired promptly, our customers will not be able to engage in drilling operations and may have the right to terminate the contracts. If equipment is not timely delivered to a customer or does not pass acceptance testing, a customer may in certain circumstances have the right to terminate the contract. The payment of a termination fee may not fully compensate us for the loss of the contract. Early termination of a contract may result in a rig or other equipment being idle for an extended period of time. The likelihood that a customer may seek to terminate a contract is increased during periods of market weakness. The cancellation or renegotiation of a number of our contracts could materially reduce our revenues and profitability.
We derive a significant amount of our revenues from a few major customers. The loss of a significant customer could adversely affect us.
A substantial percentage of our revenues are generated from a relatively small number of customers and the loss of a significant customer could adversely affect us. In 2016, our largest customer, ENL, accounted for approximately 38.7 percent of our consolidated revenues. In 2016, our second largest customer, BP, constituted approximately 12.0 percent of our consolidated revenues. Our consolidated results of operations could be adversely affected if any of our significant customers terminate their contracts with us, fail to renew our existing contracts or do not award new contracts to us.
A slowdown in economic activity may result in lower demand for our drilling and drilling related services and rental tools business, and could have a material adverse effect on our business.
A slowdown in economic activity in the United States or abroad could lead to uncertainty in corporate credit availability and capital market access and could reduce worldwide demand for energy and result in lower crude oil and natural gas prices. For example, weakening economic growth in large emerging and developing markets, such as China, and other issues have contributed

13
to increased economic uncertainty and diminished expectations for the global economy. Concerns about global economic conditions have had a significant adverse impact on domestic and international financial markets and commodity prices, including oil and natural gas. Our business depends to a significant extent on the level of international onshore drilling activity and GOM inland and offshore drilling activity for oil and natural gas. Depressed oil and natural gas prices from lower demand as a result of slow or negative economic growth would reduce the level of exploration, development and production activity, all of which could cause our revenues and margins to decline, decrease dayrates and utilization of our rigs and use of our rental tools and limit our future growth prospects. Any significant decrease in dayrates or utilization of our rigs or use of our rental tools could materially reduce our revenues and profitability. In addition, current and potential customers who depend on financing for their drilling projects may be forced to curtail or delay projects and may also experience an inability to pay suppliers and service providers, including us. Likewise, economic conditions in the United States or abroad could impact our vendors’ and suppliers’ ability to meet obligations to provide materials and services in general. All of these factors could have a material adverse effect on our business and financial results.
The contract drilling and the rental tools businesses are highly competitive and cyclical, with intense price competition.
The contract drilling and rental tools markets are highly competitive and many of our competitors in both the contract drilling and rental tools businesses may possess greater financial resources than we do. Some of our competitors also are incorporated in countries that may provide them with significant tax advantages that are not available to us as a U.S. company and which may impair our ability to compete with them for many projects.
Contract drilling companies compete primarily on a regional basis, and competition may vary significantly from region to region at any particular time. Many drilling and workover rigs can be moved from one region to another in response to changes in levels of activity, provided market conditions warrant, which may result in an oversupply of rigs in an area. Many competitors construct rigs during periods of high energy prices and, consequently, the number of rigs available in some of the markets in which we operate can exceed the demand for rigs for extended periods of time, resulting in intense price competition. Most drilling contracts are awarded on the basis of competitive bids, which also results in price competition. Historically, the drilling service industry has been highly cyclical, with periods of high demand, limited equipment supply and high dayrates often followed by periods of low demand, excess equipment supply and low dayrates. Periods of low demand and excess equipment supply intensify the competition in the industry and often result in equipment being idle for long periods of time. During periods of decreased demand we typically experience significant reductions in dayrates and utilization. The Company, or its competition, may move rigs or other equipment from one geographic location to another location; the cost of which may be substantial. If we experience further reductions in dayrates or if we cannot keep our equipment utilized, our financial performance will be adversely impacted. Prolonged periods of low utilization and dayrates could result in the recognition of impairment charges on certain of our rigs if future cash flow estimates, based upon information available to management at the time, indicate that the carrying value of these rigs may not be recoverable.
Rig upgrade, refurbishment and construction projects are subject to risks and uncertainties, including delays and cost overruns, which could have an adverse impact on our results of operations and cash flows.
We regularly make significant expenditures in connection with upgrading and refurbishing our rig fleet. These activities include planned upgrades to maintain quality standards, routine maintenance and repairs, changes made at the request of customers, and changes made to comply with environmental or other regulations. Rig upgrade, refurbishment and construction projects are subject to the risks of delay or cost overruns inherent in any large construction project, including the following:
• shortages of equipment or skilled labor;
• unforeseen engineering problems;
• unanticipated change orders;
• work stoppages;
• adverse weather conditions;
• unexpectedly long delivery times for manufactured rig components;
• unanticipated repairs to correct defects in construction not covered by warranty;
• failure or delay of third-party equipment vendors or service providers;
• unforeseen increases in the cost of equipment, labor or raw materials, particularly steel;

14
• disputes with customers, shipyards or suppliers;
• latent damages or deterioration to hull, equipment and machinery in excess of engineering estimates and assumptions;
• financial or other difficulties with current customers at shipyards and suppliers;
• loss of revenue associated with downtime to remedy malfunctioning equipment not covered by warranty;
• unanticipated cost increases;
• loss of revenue and payments of liquidated damages for downtime to perform repairs associated with defects, unanticipated equipment refurbishment and delays in commencement of operations; and
• lack of ability to obtain the required permits or approvals, including import/export documentation.
Any one of the above risks could adversely affect our financial condition and results of operations. Delays in the delivery of rigs being constructed or undergoing upgrade, refurbishment or repair may, in many cases, delay commencement of a drilling contract resulting in a loss of revenue to us, and may also cause our customer to renegotiate the drilling contract for the rig or terminate or shorten the term of the contract under applicable late delivery clauses, if any. If one of these contracts is terminated, we may not be able to secure a replacement contract on as favorable terms, if at all. Additionally, actual expenditures for required upgrades or to refurbish or construct rigs could exceed our planned capital expenditures, impairing our ability to service our debt obligations.
Our international operations are subject to governmental regulation and other risks.
We derive a significant portion of our revenues from our international operations. In 2016, we derived approximately 70 percent of our revenues from operations in countries other than the United States. Our international operations are subject to the following risks, among others:
• political, social and economic instability, war, terrorism and civil disturbances;
• economic sanctions imposed by the U.S. government against other countries, groups, or individuals, or economic sanctions imposed by other governments against the U.S. or businesses incorporated in the U.S.;
• limitations on insurance coverage, such as war risk coverage, in certain areas;
• expropriation, confiscatory taxation and nationalization of our assets;
• foreign laws and governmental regulation, including inconsistencies and unexpected changes in laws or regulatory requirements, and changes in interpretations or enforcement of existing laws or regulations;
• increases in governmental royalties;
• import-export quotas or trade barriers;
• hiring and retaining skilled and experienced workers, some of whom are represented by foreign labor unions;
• work stoppages;
• damage to our equipment or violence directed at our employees, including kidnapping;
• piracy of vessels transporting our people or equipment;
• unfavorable changes in foreign monetary and tax policies;
• solicitation by government officials for improper payments or other forms of corruption;
• foreign currency fluctuations and restrictions on currency repatriation;
• repudiation, nullification, modification or renegotiation of contracts; and
• other forms of governmental regulation and economic conditions that are beyond our control.

15
We currently have operations in 20 countries. Our operations are subject to interruption, suspension and possible expropriation due to terrorism, war, civil disturbances, political and capital instability and similar events, and we have previously suffered loss of revenues and damage to equipment due to political violence. Civil and political disturbances in international locations may affect our operations. We may not be able to obtain insurance policies covering risks associated with these types of events, especially political violence coverage, and such policies may only be available with premiums that are not commercially reasonable.
Our international operations are subject to the laws and regulations of a number of countries with political, regulatory and judicial systems and regimes that may differ significantly from those in the U.S. Our ability to compete in international contract drilling and rental tool markets may be adversely affected by foreign governmental regulations and/or policies that favor the awarding of contracts to contractors in which nationals of those foreign countries have substantial ownership interests or by regulations requiring foreign contractors to employ citizens of, or purchase supplies from, a particular jurisdiction. Furthermore, our foreign subsidiaries may face governmentally imposed restrictions or fees from time to time on the transfer of funds to us.
In addition, tax and other laws and regulations in some foreign countries are not always interpreted consistently among local, regional and national authorities, which can result in disputes between us and governing authorities. The ultimate outcome of these disputes is never certain, and it is possible that the outcomes could have an adverse effect on our financial performance.
A portion of the workers we employ in our international operations are members of labor unions or otherwise subject to collective bargaining. We may not be able to hire and retain a sufficient number of skilled and experienced workers for wages and other benefits that we believe are commercially reasonable.
We may experience currency exchange losses where revenues are received or expenses are paid in nonconvertible currencies or where we do not take protective measures against exposure to a foreign currency. We may also incur losses as a result of an inability to collect revenues because of a shortage of convertible currency available to the country of operation, controls over currency exchange or controls over the repatriation of income or capital. Given the international scope of our operations, we are exposed to risks of currency fluctuation and restrictions on currency repatriation. We attempt to limit the risks of currency fluctuation and restrictions on currency repatriation where possible by obtaining contracts payable in U.S. dollars or freely convertible foreign currency. In addition, some parties with which we do business could require that all or a portion of our revenues be paid in local currencies. Foreign currency fluctuations, therefore, could have a material adverse effect upon our results of operations and financial condition.
The shipment of goods, services and technology across international borders subjects us to extensive trade laws and regulations. Our import activities are governed by the unique customs laws and regulations in each of the countries where we operate. Moreover, many countries, including the U.S., control the export and re-export of certain goods, services and technology and impose related export recordkeeping and reporting obligations. Governments may also impose economic sanctions against certain countries, persons and other entities that may restrict or prohibit transactions involving such countries, persons and entities. The laws and regulations concerning import activity, export recordkeeping and reporting, export control and economic sanctions are complex and constantly changing. These laws and regulations can cause delays in shipments and unscheduled operational downtime. Moreover, any failure to comply with applicable legal and regulatory trading obligations could result in criminal and civil penalties and sanctions, such as fines, imprisonment, debarment from governmental contracts, seizure of shipments and loss of import and export privileges.
Our acquisitions, dispositions, and investments may not result in the realization of savings, the creation of efficiencies, the generation of cash or income, or the reduction of risk, which may have a material adverse effect on our liquidity, consolidated results of operations, and consolidated financial condition.
We continually seek opportunities to maximize efficiency and value through various transactions, including purchases or sales of assets, businesses, investments, or joint ventures. These transactions are intended to result in the realization of savings, the creation of efficiencies, the offering of new products or services, the generation of cash or income, or the reduction of risk. Acquisition transactions may be financed by additional borrowings or by the issuance of equity. These transactions may also affect our consolidated results of operations.
These transactions also involve risks, and we cannot ensure that:
• any acquisitions would result in an increase in income or earnings per share;
• any acquisitions would be successfully integrated into our operations and internal controls;
• the due diligence prior to an acquisition would uncover situations that could result in financial or legal exposure, or that we will appropriately quantify the exposure from known risks;
16
• any disposition would not result in decreased earnings, revenues, or cash flow;
• use of cash for acquisitions would not adversely affect our cash available for capital expenditures and other uses;
• any dispositions, investments, acquisitions, or integrations would not divert management resources; or
• any dispositions, investments, acquisitions, or integrations would not have a material adverse effect on our results of operations or financial condition.
Failure to comply with anti-corruption laws, such as the U.S. Foreign Corrupt Practices Act and the U.K. Bribery Act 2010, could result in fines, criminal penalties, negative commercial consequences and an adverse effect on our business.
The U.S. Foreign Corrupt Practices Act (FCPA), the U.K. Bribery Act 2010 and similar anti-corruption laws in other jurisdictions generally prohibit companies and their intermediaries from making improper payments or providing improper benefits for the purpose of obtaining or retaining business. Our policies mandate compliance with these anti-corruption laws. However, we operate in many parts of the world that experience corruption. If we are found to be liable for violations of these laws either due to our own acts or our omissions or due to the acts or omissions of others (including our joint ventures partners, our agents or other third party representatives), we could suffer from commercial, civil and criminal penalties or other sanctions, which could have a material adverse effect on our business, financial condition and results of operations.
Failure to attract and retain skilled and experienced personnel could affect our operations.
We require skilled, trained and experienced personnel to provide our customers with the highest quality technical services and support for our drilling operations. We compete with other oilfield services businesses and other employers to attract and retain qualified personnel with the technical skills and experience we require. Competition for skilled labor and other labor required for our operations intensifies as the number of rigs activated or added to worldwide fleets or under construction increases, creating upward pressure on wages. In periods of high utilization, we have found it more difficult to find and retain qualified individuals. A shortage in the available labor pool of skilled workers or other general inflationary pressures or changes in applicable laws and regulations could make it more difficult for us to attract and retain personnel and could require us to enhance our wage and benefits packages. Increases in our operating costs could adversely affect our business and financial results. Moreover, the shortages of qualified personnel or the inability to obtain and retain qualified personnel could negatively affect the quality, safety and timeliness of our operations.
We are not fully insured against all risks associated with our business.
We ordinarily maintain insurance against certain losses and liabilities arising from our operations. However, we do not insure against all operational risks in the course of our business. Due to the high cost, high self-insured retention and limited coverage insurance for windstorms in the GOM we have elected not to purchase windstorm insurance for our inland barges in the GOM. Although we have retained the risk for physical loss or damage for these rigs arising from a named windstorm, we have procured insurance coverage for removal of a wreck caused by a windstorm. The occurrence of an event that is not fully covered by insurance could have a material adverse impact on our business activities, financial position and results of operations.
We are subject to hazards customary for drilling operations, which could adversely affect our financial performance if we are not adequately indemnified or insured.
Substantially all of our operations are subject to hazards that are customary for oil and natural gas drilling operations, including blowouts, reservoir damage, loss of production, loss of well control, lost or stuck drill strings, equipment defects, cratering, oil and natural gas well fires and explosions, natural disasters, pollution, mechanical failure and damage or loss during transportation. Some of our fleet is also subject to hazards inherent in marine operations, either while on-site or during mobilization, such as capsizing, sinking, grounding, collision, damage from severe weather and marine life infestations. These hazards could result in damage to or destruction of drilling equipment, personal injury and property damage, suspension of operations or environmental damage, which could lead to claims by third parties or customers, suspension of operations and contract terminations. We have had accidents in the past due to some of these hazards. We may not be able to insure against these risks or to obtain indemnification to adequately protect us against liability from all of the consequences of the hazards and risks described above. The occurrence of an event not fully insured against or for which we are not indemnified, or the failure of a customer or insurer to meet its indemnification or insurance obligations, could result in substantial losses. In addition, insurance may not continue to be available to cover any or all of these risks. For example, pollution, reservoir damage and environmental risks generally are not fully insurable. Even if such insurance is available, insurance premiums or other costs may rise significantly in the future, making the cost of such insurance prohibitive. For a description of our indemnification obligations and insurance, see Item 1. Business — Insurance and Indemnification.

17
Certain areas in and near the GOM are subject to hurricanes and other extreme weather conditions. When operating in and near the GOM, our drilling rigs and rental tools may be located in areas that could cause them to be susceptible to damage or total loss by these storms. In addition, damage caused by high winds and turbulent seas to our rigs, our shore bases and our corporate infrastructure could potentially cause us to curtail operations for significant periods of time until the effects of the damage can be repaired. In addition, our rigs in arctic regions can be affected by seasonal weather so severe that conditions are deemed too unsafe for operations.
Government regulations may reduce our business opportunities and increase our operating costs.
Government regulations control and often limit access to potential markets and impose extensive requirements concerning employee privacy and safety, environmental protection, pollution control and remediation of environmental contamination. Environmental regulations, including species protections, prohibit access to some locations and make others less economical, increase equipment and personnel costs, and often impose liability without regard to negligence or fault. In addition, governmental regulations, such as those related to climate change, emissions, and hydraulic fracturing, may discourage our customers’ activities, reducing demand for our products and services. We may be liable for damages resulting from pollution and, under United States regulations, must establish financial responsibility in order to drill offshore. See Item 1. Business — Environmental Considerations.
Regulation of greenhouse gases and climate change could have a negative impact on our business.
Some scientific studies have suggested that emissions of certain gases, commonly referred to as “greenhouse gases” (GHGs) and including carbon dioxide and methane, may be contributing to warming of the earth’s atmosphere and other climatic changes. Such studies have resulted in increased local, state, regional, national and international attention and actions relating to issues of climate change and the effect of GHG emissions, in particular emissions from fossil fuels. For example, the United States has been involved in international negotiations regarding greenhouse gas reductions under the UNFCCC. The U.S. was among 195 nations that participated in the creation of an international accord in December 2015, the Paris Agreement, with the objective of limiting greenhouse gas emissions. The United States signed the Paris Agreement in April 2016. The EPA has also taken action under the CAA to regulate greenhouse gas emissions. In addition, a number of states have either proposed or implemented restrictions on greenhouse gas emissions. International accords such as the Paris Agreement may result in additional regulations to control greenhouse gas emissions. Other developments focused on restricting GHG emissions include but are not limited to the Kyoto Protocol; the European Union Emission Trading System; the United Kingdom's Carbon Reduction Commitment; and, in the U.S., the Regional Greenhouse Gas Initiative, the Western Regional Climate Action Initiative, and various state programs. These regulations could also adversely affect market demand or pricing for our services, by affecting the price of, or reducing the demand for, fossil fuels or providing competitive advantages to competing fuels and energy sources.
Because our business depends on the level of activity in the oil and natural gas industry, existing or future laws, regulations, treaties or international agreements related to GHGs and climate change, including incentives to conserve energy or use alternative energy sources, could have a negative impact on our business if such laws, regulations, treaties or international agreements reduce the worldwide demand for oil and natural gas or otherwise result in reduced economic activity generally. In addition, such laws, regulations, treaties or international agreements could result in increased compliance costs or additional operating restrictions, which may have a negative impact on our business. In addition to potential impacts on our business directly or indirectly resulting from climate-change legislation or regulations, our business also could be negatively affected by climate-change related physical changes or changes in weather patterns. An increase in severe weather patterns could result in damages to or loss of our rigs, impact our ability to conduct our operations and/or result in a disruption of our customers’ operations.
We are regularly involved in litigation, some of which may be material.
We are regularly involved in litigation, claims and disputes incidental to our business, which at times may involve claims for significant monetary amounts, some of which would not be covered by insurance. We undertake all reasonable steps to defend ourselves in such lawsuits. Nevertheless, we cannot predict the ultimate outcome of such lawsuits and any resolution which is adverse to us could have a material adverse effect on our financial condition. See Note 13 - Commitments and Contingencies in Item 8. Financial Statements and Supplementary Data for a discussion of the material legal proceedings affecting us.
A catastrophic event could occur, materially impacting our liquidity, results of operations, and financial condition.
Our services are performed in harsh environments, and the work we perform can be dangerous. Catastrophic events such as a well blowout, fire, or explosion can occur, resulting in property damage, personal injury, death, pollution, and environmental damage. Typically, we are indemnified by our customers for injuries and property damage resulting from these types of events (except for injury to our employees and subcontractors and property damage to ours and our subcontractors’ equipment). However, we could be exposed to significant loss if adequate indemnity provisions or insurance are not in place, if indemnity provisions are unenforceable or otherwise invalid, or if our customers are unable or unwilling to satisfy any indemnity obligations.

18
Increased regulation of hydraulic fracturing could result in reductions or delays in drilling and completing new oil and natural gas wells, which could adversely impact the demand for rental tools.
Hydraulic fracturing is a process sometimes used in the completion of oil and natural gas wells whereby water, other liquids, sand and chemicals are injected under pressure into subsurface formations to stimulate natural gas and, to a lesser extent, oil production. Various governmental entities (within and outside the United States) are in the process of studying, restricting, regulating, or preparing to regulate hydraulic fracturing, directly and indirectly. Many state governments require the disclosure of chemicals used in the fracturing process and, due to concerns raised relating to potential impacts of hydraulic fracturing, including on groundwater quality and seismic activity, legislative and regulatory efforts at the federal level and in some state and local jurisdictions have been initiated to render permitting and compliance requirements more stringent for hydraulic fracturing or prohibit the activity altogether. We do not directly engage in hydraulic fracturing activities. However, these and other developments could cause operational delays or increased costs in exploration and production, which could adversely affect the demand for our rental tools.
A cybersecurity incident could negatively impact our business and our relationships with customers.
Our businesses and the oil and natural gas industry in general have become increasingly dependent on digital data, computer networks and connected infrastructure. If our systems for protecting against cybersecurity risks prove not to be sufficient, we could be adversely affected by, among other things, loss or damage of intellectual property, proprietary information, or customer data, having our business operations interrupted, and increased costs to prevent, respond to, or mitigate cybersecurity attacks. These risks could have a material adverse effect on our business, consolidated results of operations, and consolidated financial condition.
The market price of our common stock has fluctuated significantly.
The market price of our common stock may continue to fluctuate in response to various factors and events, most of which are beyond our control, including the following:
• the other risk factors described in this Form 10-K, including changes in oil and natural gas prices;
• a shortfall in rig utilization, operating revenues or net income from that expected by securities analysts and investors;
• changes in securities analysts’ estimates of the financial performance of us or our competitors or the financial performance of companies in the oilfield service industry generally;
• changes in actual or market expectations with respect to the amounts of exploration and development spending by oil and natural gas companies;
• general conditions in the economy and in energy-related industries;
• general conditions in the securities markets;
• political instability, terrorism or war; and
• the outcome of pending and future legal proceedings, investigations, tax assessments and other claims.
We do not anticipate paying any dividends on our common stock in the foreseeable future.
We do not anticipate paying any dividends on our common stock in the foreseeable future. Any declaration and payment of future dividends to holders of our common stock may be limited by the provisions of the Delaware General Corporation Law and our indebtedness. The future payment of dividends on our common stock will be at the sole discretion of our board of directors and will depend on many factors, including our earnings, capital requirements, financial condition and other considerations that our board of directors deems relevant.

19
FORWARD-LOOKING STATEMENTS
This Form 10-K contains statements that are “forward-looking statements” within the meaning of Section 27A of the Securities Act of 1933, as amended (the Securities Act), and Section 21E of the Securities Exchange Act of 1934, as amended, (the Exchange Act). All statements contained in this Form 10-K, other than statements of historical facts, are forward-looking statements for purposes of these provisions. In some cases, you can identify these statements by forward-looking words such as “anticipate,” “believe,” “could,” “estimate,” “expect,” “intend,” “outlook,” “may,” “should,” “will” and “would” or similar words. Forward-looking statements are based on certain assumptions and analyses we make in light of our experience and perception of historical trends, current conditions, expected future developments and other factors we believe are relevant. Although we believe that our assumptions are reasonable based on information currently available, those assumptions are subject to significant risks and uncertainties, many of which are outside of our control. Each forward-looking statement speaks only as of the date of this Form 10-K, and we undertake no obligation to publicly update or revise any forward-looking statements, whether as a result of new information, future events or otherwise. You should be aware that the occurrence of the events described in these risk factors and elsewhere in this Form 10-K could have a material adverse effect on our business, results of operations, financial condition and cash flows.
Item 1B. Unresolved Staff Comments
None.
Item 2. Properties
We lease corporate headquarters office space in Houston, Texas and own our U.S. rental tools headquarters office in New Iberia, Louisiana. We lease regional headquarters space in Dubai, UAE related to our international rental tools segment and Eastern Hemisphere drilling operations. Additionally, we own and/or lease office space and operating facilities in various other locations, domestically and internationally, including facilities where we hold inventories of rental tools and locations in close proximity to where we provide services to our customers. Additionally, we own and/or lease facilities necessary for administrative and operational support functions.

20
Land and Barge Rigs
The table below shows the locations and drilling depth ratings of our rigs as of December 31, 2016:
Name Type(1)
Year enteredinto service/
upgraded
Drillingdepth rating
(in feet) Location
International & Alaska DrillingEastern Hemisphere
Rig 231 L 1981/1997 13,000 IndonesiaRig 253 L 1982/1996 15,000 IndonesiaRig 226 HH 1989/2010 18,000 Papua New GuineaRig 107 L 1983/2009 15,000 KazakhstanRig 216 L 2001/2009 25,000 KazakhstanRig 249 L 2000/2009 25,000 KazakhstanRig 257 B 1999/2010 30,000 KazakhstanRig 258 L 2001/2009 25,000 KazakhstanRig 247 L 1981/2008 20,000 Iraq, Kurdistan RegionRig 269 L 2008 21,000 Iraq, Kurdistan RegionRig 265 L 2007 20,000 Iraq, Kurdistan RegionRig 264 L 2007 20,000 TunisiaRig 270 L 2011 21,000 Russia
Latin AmericaRig 271 L 1982/2009 30,000 ColombiaRig 266 L 2008 20,000 GuatemalaRig 122 L 1980/2008 18,000 MexicoRig 165 L 1978/2007 30,000 MexicoRig 221 L 1982/2007 30,000 MexicoRig 256 L 1978/2007 25,000 MexicoRig 267 L 2008 20,000 Mexico
AlaskaRig 272 L 2013 18,000 AlaskaRig 273 L 2012 18,000 Alaska
U.S. (Lower 48) DrillingRig 8 B 1978/2007 14,000 GOMRig 12 B 1979/2006 18,000 GOMRig 15 B 1978/2007 15,000 GOMRig 20 B 1981/2007 13,000 GOMRig 21 B 1979/2012 14,000 GOMRig 30 B 2014 18,000 GOMRig 50 B 1981/2006 20,000 GOMRig 51 B 1981/2008 20,000 GOMRig 54 B 1980/2006 25,000 GOMRig 55 B 1981/2014 25,000 GOMRig 72 B 1982/2005 25,000 GOMRig 76 B 1977/2009 30,000 GOMRig 77 B 2006/2006 30,000 GOM
(1) Type is defined as: L — land rig; B — barge rig; HH — heli-hoist land rig.
The table above excludes Rig 121 and Rig 268, located in Colombia, which are currently not available for service. Additionally, during 2016 we sold Rig 225 and Rig 252, located in Indonesia, which had been removed from service prior to December 31, 2015 for a nominal loss.

21
Item 3. Legal Proceedings
For information on Legal Proceedings, see Note 13 - Commitments and Contingencies in Item 8. Financial Statements and Supplementary Data, which information is incorporated herein by reference.
Item 4. Mine Safety Disclosures
Not applicable.
PART II
Item 5. Market for Registrant's Common Equity, Related Stockholder Matters and Issuer Purchases of Equity Securities
Parker Drilling Company’s common stock is listed for trading on the New York Stock Exchange under the symbol “PKD.” The following table sets forth the high and low sales prices per share of our common stock, as reported on the New York Stock Exchange composite tape, for the periods indicated:
2016 2015Quarter High Low High Low
First $ 2.34 $ 0.98 $ 3.74 $ 2.51Second $ 3.16 $ 2.00 $ 4.55 $ 3.25Third $ 2.44 $ 1.84 $ 3.43 $ 2.34Fourth $ 2.90 $ 1.70 $ 3.64 $ 1.75
Most of our stockholders maintain their shares as beneficial owners in “street name” accounts and are not, individually, stockholders of record. As of February 16, 2017, there were 1,560 holders of record of our shares and we had an estimated 17,800beneficial owners.
Our 2015 Secured Credit Agreement and the indentures for the Senior Notes limit the payment of dividends. In the past we have not paid dividends on our common stock and we have no present intention to pay dividends on our common stock in the foreseeable future.
Issuer Purchases of Equity Securities
The Company currently has no active share repurchase programs.

22
Item 6. Selected Financial Data
The following table presents selected historical consolidated financial data derived from the audited financial statements of Parker Drilling Company for each of the five years in the period ended December 31, 2016. The following financial data should be read in conjunction with Item 7. Management’s Discussion and Analysis of Financial Condition and Results of Operations and Item 8. Financial Statements and Supplementary Data.
Year Ended December 31,2016 2015 2014 2013 (1) 2012
Dollars in Thousands, Except Per Share Amounts
Income Statement Data
Total revenues $ 427,004 $ 712,183 $ 968,684 $ 874,172 $ 677,761Total operating income (loss) (111,257) (17,338) 120,220 101,872 107,273Net income (loss) (230,814) (94,284) 24,461 27,179 37,098Net income (loss) attributable to controlling interest (230,814) (95,073) 23,451 27,015 37,313Basic earnings per share:
Net income (loss) $ (1.86) $ (0.77) $ 0.20 $ 0.23 $ 0.32Net income (loss) attributable to controlling interest $ (1.86) $ (0.78) $ 0.19 $ 0.23 $ 0.32
Diluted earnings per share:Net income (loss) $ (1.86) $ (0.77) $ 0.20 $ 0.22 $ 0.31Net income (loss) attributable to controlling interest $ (1.86) $ (0.78) $ 0.19 $ 0.22 $ 0.31
Balance Sheet Data
Total assets (2) $ 1,103,551 $ 1,366,702 $ 1,509,000 $ 1,521,775 $ 1,248,133Total long-term debt including current portion of long-term debt (2) 576,326 574,798 603,341 640,800 471,605Total equity 339,135 568,512 666,214 633,142 590,633
(1) The 2013 results include $22.5 million of acquisition costs related to the acquisition of ITS on April 22, 2013.
(2) The Company adopted, effective January 1, 2016, newly issued accounting guidance ASU 2015-03, Interest - Imputation of Interest - Simplifying the Presentation of Debt Issuance Costs, which requires debt issuance costs related to a recognized debt liability to be presented in the balance sheet as a direct deduction from the debt liability rather than as an asset. We reflected the impact of the new accounting guidance during each of the quarterly periods in our respective Quarterly Reports on Form 10-Q filed with the SEC during 2016.

23
Item 7. Management's Discussion and Analysis of Financial Condition and Results of Operations
Management's discussion and analysis (MD&A) should be read in conjunction with Item 8. Financial Statements and Supplementary Data.
Executive Summary
The oil and natural gas industry is highly cyclical. Activity levels are driven by traditional energy industry activity indicators, which include current and expected commodity prices, drilling rig counts, footage drilled, well counts, and our customers’ spending levels allocated to exploratory and development drilling.
Historical market indicators are listed below:
2016 % Change 2015 % Change 2014Worldwide Rig Count (1)
U.S. (land and offshore) 510 (48)% 978 (47)% 1,862International (2) 955 (18)% 1,167 (13)% 1,337
Commodity Prices (annual average) (3)
Crude Oil (United Kingdom Brent) $ 45.13 (16)% $ 53.60 (46)% $ 99.45Crude Oil (West Texas Intermediate) $ 43.47 (11)% $ 48.78 (48)% $ 92.93Natural Gas (Henry Hub) $ 2.55 (3)% $ 2.63 (38)% $ 4.26
(1) Estimate of drilling activity as measured by annual average active rig count for the periods indicated - Source: Baker Hughes Incorporated Rig Count.
(2) Excludes Canadian Rig Count.
(3) Average daily commodity prices for the periods indicated based on NYMEX front-month composite energy prices.
Financial Results
In the 2016 fourth quarter we generated revenues of $94.0 million, a decrease of $54.7 million, or 36.8 percent, compared with the 2015 fourth quarter. In 2016, revenues totaled $427.0 million, a decrease of $285.2 million, or 40.0 percent, compared to 2015. All of our segments experienced revenue declines for the three and twelve months ended December 31, 2016, primarily driven by reduced customer spending and declines in worldwide rig count and commodity prices. The International & Alaska Drilling segment was the largest driver of the year-over-year decline in both the three and twelve months ended December 31, 2016, primarily due to a decline in utilization and reduced revenues per day.
Overview
Overall, 2016 was one of the most challenging operating environments in the energy services industry and in the Company's 82 years of existence. WTI crude oil prices, which began a sharp decline in late 2014, eventually found a floor in early 2016 and entered a trading range between $40 and $50 per barrel. In late November, OPEC announced it would curtail oil production to 32.5 million barrels per day resulting in WTI crude oil prices climbing above $50 per barrel and entering a new trading range between $50 and $55 per barrel. Even with the recent commodity price improvements, the average 2016 crude oil prices were 11 to 16 percent below 2015 levels and rig counts were down 18 percent for international markets and almost 50 percent for the U.S. market. This adversely impacted our rental tools activity and pricing, as well as utilization and pricing of our drilling rigs. See "Oil and natural gas prices have declined substantially since 2014 and are expected to remain depressed for the foreseeable future. Sustained depressed prices of oil and natural gas have continued to adversely affect our financial condition, results of operations and cash flows." in Item 1A. Risk Factors.
While our overall activity was lower in 2016 versus 2015, there were some notable achievements across our business:
• We were awarded an extension and an additional rig to our O&M contract on Sakhalin Island, Russia. The O&M contract term was extended through June 2019 and a newly constructed fourth customer-owned extended-reach drilling rig was added. As a result of the extension and additional rig, over $180 million in revenues was added to our contracted backlog. Our operation on Sakhalin Island now includes a total of five rigs, including one Company-owned rig.
• We were awarded a seven-year O&M contract for the Hibernia platform located off the Atlantic Coast of Canada.

24
• Since the end of 2015, we increased our contracted backlog 30 percent to $379 million.
• We were awarded several new contracts for our International Rentals Tools segment in the Middle East utilizing the technology acquired in the 2M-Tek Acquisition.
• Our U.S. Rental Tools Tubular Goods Utilization Index increased 65 percent since bottoming in May 2016.
• We set a safety record with the lowest total recordable rate in the Company's history.
• Our Drilling Services business, including Company-owned and customer-owned rigs, achieved a record low 0.77 percent downtime for the year with four of the rigs operating the full year with zero downtime.
• In May 2016, we amended our credit agreement to provide covenant relief and flexibility to help navigate the prolonged industry downturn.
• We were able to finish 2016 with almost $210 million in total liquidity, primarily due to our emphasis on cash flow and our proactive management of receivables.
• We complied with all of our obligations under the Deferred Prosecution Agreement (“DPA”) and on May 20, 2016, the United States’ case against the Company was dismissed and the DPA was terminated.
Outlook
Although market conditions are still weak, we are seeing a number of new opportunities develop, and there are increasing signs the stage is set for a more favorable business environment in 2017. Though the pace and magnitude of the recovery are unclear, we believe market confidence in a sustained upturn is gaining momentum. Looking at the fourth quarter of 2016 and the first quarter of 2017, we believe our business is at or near the trough and our financial performance should improve as we progress through 2017.
In our U.S. (Lower 48) Drilling segment, we see opportunity for higher rig utilization in response to improved, more stable oil prices. For our International & Alaska Drilling segment, we expect activity to remain flat through the first half of 2017. However, we are seeing increased rig tendering activity in many of our markets for work anticipated to begin in the second half of 2017 and into 2018.
In our U.S. Rental Tools segment, we anticipate higher utilization of our rental equipment as U.S. land oil and gas drilling activity increases. For our International Rental Tools segment, we expect higher activity levels largely driven by the startup and execution of well construction projects we were awarded late in 2016.

25
Results of Operations
Our business is comprised of two business lines: (1) Drilling Services and (2) Rental Tools Services. We report our Drilling Services business as two reportable segments: (1) U.S. (Lower 48) Drilling and (2) International & Alaska Drilling. We report our Rental Tools Services business as two reportable segments: (1) U.S. Rental Tools and (2) International Rental Tools. We eliminate inter-segment revenues and expenses.
We analyze financial results for each of our reportable segments. The reportable segments presented are consistent with our reportable segments discussed in our consolidated financial statements. See Note 12 - Reportable Segments in Item 8. Financial Statements and Supplementary Data for further discussion. We monitor our reporting segments based on several criteria, including operating gross margin and operating gross margin excluding depreciation and amortization. Operating gross margin excluding depreciation and amortization is computed as revenues less direct operating expenses, and excludes depreciation and amortization expense, where applicable. Operating gross margin percentages are computed as operating gross margin as a percent of revenues. The operating gross margin excluding depreciation and amortization amounts and percentages should not be used as a substitute for those amounts reported under accounting policies generally accepted in the United States (U.S. GAAP), but should be viewed in addition to the Company’s reported results prepared in accordance with U.S. GAAP. Management believes this information provides valuable insight into the information management considers important in managing the business.
Year Ended December 31, 2016 Compared with Year Ended December 31, 2015
Revenues decreased $285.2 million, or 40.0 percent, to $427.0 million for the year ended December 31, 2016 as compared to revenues of $712.2 million for the year ended December 31, 2015. Operating gross margin decreased $105.0 million to a loss of $75.3 million for the year ended December 31, 2016 as compared to $29.7 million for the year ended December 31, 2015.

26
The following is an analysis of our operating results for the comparable periods by reportable segment:
Year Ended December 31, 2016 2015Dollars in Thousands
Revenues:Drilling Services:U.S. (Lower 48) Drilling $ 5,429 1 % $ 30,358 4 %International & Alaska Drilling 287,332 67 % 435,096 61 %
Total Drilling Services 292,761 68 % 465,454 65 %Rental Tools Services:U.S. Rental Tools 71,613 17 % 141,889 20 %International Rental Tools 62,630 15 % 104,840 15 %
Total Rental Tools Services 134,243 32 % 246,729 35 %Total revenues 427,004 100 % 712,183 100 %Operating gross margin (loss) excluding depreciation and amortization:
Drilling Services:U.S. (Lower 48) Drilling (14,304) (263)% (5,889) (19)%International & Alaska Drilling 64,508 22 % 109,750 25 %
Total Drilling Services 50,204 17 % 103,861 22 %Rental Tools Services:U.S. Rental Tools 21,397 30 % 64,833 46 %International Rental Tools (7,118) (11)% 17,199 16 %
Total Rental Tools Services 14,279 11 % 82,032 33 %Total operating gross margin (loss) excluding depreciation and amortization 64,483 15 % 185,893 26 %
Depreciation and amortization (139,795) (156,194)Total operating gross margin (loss) (75,312) 29,699
General and administrative expense (34,332) (36,190)Provision for reduction in carrying value of certain assets — (12,490)Gain (loss) on disposition of assets, net (1,613) 1,643
Total operating income (loss) $ (111,257) $ (17,338)
Operating gross margin (loss) amounts are reconciled to our most comparable U.S. GAAP measure as follows:
Dollars in ThousandsU.S. (Lower 48)
Drilling
International& AlaskaDrilling
U.S. RentalTools
InternationalRental Tools Total
Year Ended December 31, 2016
Operating gross margin (loss)(1) $ (34,353) $ 9,272 $ (22,372) $ (27,859) $ (75,312)Depreciation and amortization 20,049 55,236 43,769 20,741 139,795Operating gross margin (loss) excludingdepreciation and amortization $ (14,304) $ 64,508 $ 21,397 $ (7,118) $ 64,483Year Ended December 31, 2015
Operating gross margin (loss)(1) $ (28,309) $ 45,211 $ 17,380 $ (4,583) $ 29,699Depreciation and amortization 22,420 64,539 47,453 21,782 156,194Operating gross margin (loss) excludingdepreciation and amortization $ (5,889) $ 109,750 $ 64,833 $ 17,199 $ 185,893
(1) Operating gross margin (loss) is calculated as revenues less direct operating expenses, including depreciation and amortization expense.

27
The following table presents our average utilization rates and rigs available for service for the years ended December 31, 2016 and 2015, respectively:
December 31,2016 2015
U.S. (Lower 48) Drilling
Rigs available for service (1) 13.0 13.0Utilization rate of rigs available for service (2) 5% 15%
International & Alaska Drilling
Eastern HemisphereRigs available for service (1) 13.0 13.0Utilization rate of rigs available for service (2) 40% 66%
Latin America RegionRigs available for service (1) 7.0 9.0Utilization rate of rigs available for service (2) 23% 40%
AlaskaRigs available for service (1) 2.0 2.0Utilization rate of rigs available for service (2) 100% 100%
Total International & Alaska DrillingRigs available for service (1) 22.0 24.0Utilization rate of rigs available for service (2) 40% 59%
(1) The number of rigs available for service is determined by calculating the number of days each rig was in our fleet and was under contract or available for contract. For example, a rig under contract or available for contract for six months of a year is 0.5 rigs available for service during such year. Our method of computation of rigs available for service may not be comparable to other similarly titled measures of other companies.
(2) Rig utilization rates are based on a weighted average basis assuming total days availability for all rigs available for service. Rigs acquired or disposed of are treated as added to or removed from the rig fleet as of the date of acquisition or disposal. Rigs that are in operation or fully or partially staffed and on a revenue-producing standby status are considered to be utilized. Rigs under contract that generate revenues during moves between locations or during mobilization or demobilization are also considered to be utilized. Our method of computation of rig utilization may not be comparable to other similarly titled measures of other companies.
Drilling Services Business
U.S. (Lower 48) Drilling
U.S. (Lower 48) Drilling segment revenues decreased $25.0 million, or 82.2 percent, to $5.4 million for the year ended December 31, 2016, as compared with revenues of $30.4 million for the year ended December 31, 2015. The decrease was largely due to lower utilization driven by substantial reductions in drilling activity by operators in the inland waters of the GOM resulting from lower oil prices. Utilization declined to 5.0 percent for the year ended December 31, 2016 from 15.0 percent for the year ended December 31, 2015, resulting in a $15.2 million decrease in revenues. The remainder of the decrease in revenues was primarily due to a decrease of $6.8 million from our O&M contract supporting three platform operations located offshore California that ended during the 2015 fourth quarter, as well as $2.2 million resulting from reduced dayrates and reimbursable revenues.
U.S. (Lower 48) Drilling segment operating gross margin excluding depreciation and amortization decreased $8.4 million, or 142.4 percent, to a loss of $14.3 million for the year ended December 31, 2016, compared with a loss $5.9 million for the year ended December 31, 2015. This decrease was primarily due to the decline in utilization and reduced dayrates discussed above.
International & Alaska Drilling
International & Alaska Drilling segment revenues decreased $147.8 million, or 34.0 percent, to $287.3 million for the year ended December 31, 2016, compared with $435.1 million for the year ended December 31, 2015.

28
The decrease in revenues was primarily due to the following:
• a decrease of $62.3 million, excluding revenues from reimbursable costs ("reimbursable revenues"), resulting from decreased utilization for Company-owned rigs. Utilization for the segment decreased to 40.0 percent for the year ended December 31, 2016 from 59.0 percent for the year ended December 31, 2015. The decline in utilization was primarily due to the decline in oil prices which led to reduced customer activity;
• a decrease of $39.8 million driven by a decline in average revenues per day resulting from certain Company-owned and customer-owned rigs shifting to standby mode during 2016 compared with operating mode during 2015, as well as a reduction in average dayrates due to pricing pressures from customers resulting from the decline in oil prices;
• a decrease in reimbursable revenues of $17.4 million, which decreased revenues but had a minimal impact on operating margins;
• a decrease of $16.7 million in revenues earned from mobilization and demobilization activities; and
• a decrease of $12.5 million in revenues related to our project services activities.
International & Alaska Drilling segment operating gross margin excluding depreciation and amortization decreased $45.3 million, or 41.3 percent, to $64.5 million for the year ended December 31, 2016, compared with $109.8 million for the year ended December 31, 2015. The decrease in operating gross margin excluding depreciation and amortization was primarily due to the impact of reduced utilization and reduced revenues per day discussed above.
Rental Tools Services Business
U.S. Rental Tools
U.S. Rental Tools segment revenues decreased $70.3 million, or 49.5 percent, to $71.6 million for the year ended December 31, 2016 compared to $141.9 million for the year ended December 31, 2015. The decrease was primarily driven by continued reduction in customer activity and pricing pressures resulting from lower oil prices impacting both U.S. land and offshore GOM rentals.
U.S. Rental Tools segment operating gross margin excluding depreciation and amortization decreased $43.4 million, or 67.0 percent, to $21.4 million for the year ended December 31, 2016 compared with $64.8 million for the year ended December 31, 2015. The decrease was due to the declines in oil prices and customer activity discussed above, partially offset by lower operating costs resulting from cost reduction efforts.
International Rental Tools
International Rental Tools segment revenues decreased $42.2 million, or 40.3 percent, to $62.6 million for the year ended December 31, 2016 compared with $104.8 million for the year ended December 31, 2015. The decrease was due to the continued reduction in customer activity and price erosion resulting from lower oil prices across most of our markets, with the largest declines in our U.K. North Sea, Asia Pacific and Latin America operations.
International Rental Tools segment operating gross margin excluding depreciation and amortization decreased $24.3 million, or 141.3 percent, to a loss of $7.1 million for the year ended December 31, 2016 compared with gross margin of $17.2 million for the year ended December 31, 2015. The decrease was due to the declines in oil prices and customer activity discussed above, partially offset by lower operating costs resulting from cost reduction efforts.
Other Financial Data
General and administrative expense
General and administrative expense decreased $1.9 million to $34.3 million for the year ended December 31, 2016, compared with $36.2 million for the year ended December 31, 2015. General and administrative expense for the year ended December 31, 2016 benefited from reduced personnel costs and lower legal and professional fees resulting from cost savings initiatives. These benefits were partially offset by a $0.9 million net severance charge recorded in the fourth quarter of 2016 related to executive departures. See Item 1. Business for further discussion. In addition, during the year ended December 31, 2015 we incurred higher professional and information technology expenses as we implemented the second phase of our new enterprise resource planning system in 2015.

29
Provision for reduction in carrying value of certain assets
There was no provision for reduction in carrying value of certain assets recorded during the year ended December 31, 2016. During the year ended December 31, 2015, we recorded $12.5 million of provisions for reduction in carrying value of assets including, $4.8 million associated with management’s decision to exit the Drilling Services business in Colombia and $7.5 million resulting from lower levels of activity impacting certain international rental tools and drilling equipment that management concluded were no longer marketable and the carrying value was no longer recoverable.
Gain on disposition of assets
Net losses recorded on asset dispositions for the year ended December 31, 2016 were $1.6 million and net gains recorded on asset dispositions for December 31, 2015 were $1.6 million. Activity in both periods included the results of asset sales. Additionally, we periodically sell equipment deemed to be excess, obsolete, or not currently required for operations. The net gains for the year ended December 31, 2015 were primarily due to an insurance settlement received during the period related to previously realized asset losses, partially offset by losses incurred during the 2015 fourth quarter related to equipment retirements.
Interest income and expense
Interest expense increased $0.6 million to $45.8 million for the year ended December 31, 2016 compared with $45.2 million for the year ended December 31, 2015. The increase in interest expense was primarily related to a write off of $1.1 million of debt issuance costs during the second quarter of 2016 in conjunction with the execution of the Third Amendment to the 2015 Secured Credit Agreement on May 27, 2016, which resulted in the reduction of total lender commitments under our revolving credit facility (Revolver) by 50 percent. Interest income during each of the years ended December 31, 2016 and 2015 was nominal.
Other income and expense
Other income and expense was $0.4 million of income and $9.7 million of expense for the years ended December 31, 2016 and December 31, 2015, respectively. Foreign currency exchange losses decreased $2.3 million for the year ended December 31, 2016 compared with the year ended December 31, 2015. In addition, during the year ended December 31, 2016 we reclassed$1.9 million of realized foreign currency translation gains from accumulated other comprehensive income. Other expense for the year ended December 31, 2015 included a $4.8 million loss on the sale of our controlling interest in a consolidated joint venture in Egypt, and a $0.9 million loss on the divestiture of our controlling interest in a consolidated joint venture in Russia.
Income tax expense
Income tax expense was $74.2 million on a pre-tax loss of $156.6 million for the year ended December 31, 2016, compared with $22.3 million on pre-tax loss of $72.0 million for the year ended December 31, 2015. Our effective tax rate was negative 47.4 percent for the year ended December 31, 2016, compared with negative 31.0 percent for the year ended December 31, 2015. Income tax expense and our annual effective tax rate are primarily affected by recurring items, such as the relative amounts of income or loss we earn in tax paying and non-tax paying jurisdictions, the statutory tax rates applied in the jurisdictions where the income or losses are earned, and our ability to receive tax benefits for losses incurred. It is also affected by discrete items, such as return-to-accrual adjustments and changes in valuation allowances, and changes in reserves for uncertain tax positions, which may occur in any given year but are not consistent from year to year.
Despite the pre-tax loss for the year ended December 31, 2016, we recognized income tax expense as a result of a change in valuation allowance of $117.7 million primarily on U.S. net operating losses and other deferred tax assets of $104.7 million and certain foreign net operating losses and other deferred tax assets of $13.0 million. We established the valuation allowance based on the weight of available evidence, both positive and negative, including results of recent and current operations and our estimates of future taxable income or loss by jurisdiction in which we operate. In order to determine the amount of deferred tax assets or liabilities, as well as the valuation allowances, we must make estimates and assumptions regarding future taxable income, where rigs will be deployed and other business considerations. Changes in these estimates and assumptions, including changes in tax laws and other changes impacting our ability to recognize the underlying deferred tax assets, could require us to adjust the valuation allowances.
We are a U.S. based company that operates internationally through various branches and subsidiaries. Accordingly, our worldwide income tax provision includes the impact of income tax rates and foreign tax laws in the jurisdictions in which our operations are conducted and income is earned. We reported tax benefits for foreign statutory rates different than our U.S. statutory rate of $3.6 million and $2.7 million and tax expense of $12.7 million and $16.0 million for the impact of foreign tax laws in effect for the years ended December 31, 2016 and December 31, 2015, respectively. Differences between the U.S. and foreign tax rates and laws have a significant impact in Colombia, Iraq, Kazakhstan, Mexico, Russia, United Arab Emirates and the United Kingdom.

30
Certain tax payments to foreign jurisdictions are available as credits to reduce tax expense in the U.S. and other foreign jurisdictions. We reported no tax benefits for foreign tax credits for the year ended December 31, 2016 and tax benefits for foreign tax credits of $5.6 million for the year ended December 31, 2015, which were driven primarily by our operations in Kazakhstan. See Note 6 - Income Taxes in Item 8. Financial Statements and Supplementary Data for further discussion.
Year Ended December 31, 2015 Compared with Year Ended December 31, 2014
Revenues decreased $256.5 million, or 26.5 percent, to $712.2 million for the year ended December 31, 2015 as compared to $968.7 million for the year ended December 31, 2014. Operating gross margin decreased 80.7 percent to $29.7 million for the year ended December 31, 2015 as compared to $154.2 million for the year ended December 31, 2014.
The following is an analysis of our operating results for the comparable periods by reportable segment:
Year Ended December 31, 2015 2014Dollars in Thousands
Revenues:Drilling Services:U.S. (Lower 48) Drilling $ 30,358 4 % $ 158,405 16%International & Alaska Drilling 435,096 61 % 462,513 48%
Total Drilling Services 465,454 65 % 620,918 64%Rental Tools Services:U.S. Rental Tools 141,889 20 % 223,545 23%International Rental Tools 104,840 15 % 124,221 13%
Total Rental Tools Services 246,729 35 % 347,766 36%Total revenues 712,183 100 % 968,684 100%Operating gross margin (loss) excluding depreciation and amortization:
Drilling Services:U.S. (Lower 48) Drilling (5,889) (19)% 68,091 43%International & Alaska Drilling (1) 109,750 25 % 94,089 20%
Total Drilling Services 103,861 22 % 162,180 26%Rental Tools Services:U.S. Rental Tools 64,833 46 % 118,192 53%International Rental Tools 17,199 16 % 18,931 15%
Total Rental Tools Services 82,032 33 % 137,123 39%Total operating gross margin (loss) excluding depreciation and amortization 185,893 26 % 299,303 31%
Depreciation and amortization (156,194) (145,121)Total operating gross margin (loss) 29,699 154,182
General and administrative expense (36,190) (35,016)Provision for reduction in carrying value of certain assets (12,490) —Gain (loss) on disposition of assets, net 1,643 1,054
Total operating income (loss) $ (17,338) $ 120,220

31
Operating gross margin (loss) amounts are reconciled to our most comparable U.S. GAAP measure as follows:
Dollars in ThousandsU.S. (Lower 48)
Drilling
International& AlaskaDrilling
U.S. RentalTools
InternationalRental Tools Total
Balance at December 31, 2015
Operating gross margin(1) $ (28,309) $ 45,211 $ 17,380 $ (4,583) $ 29,699Depreciation and amortization 22,420 64,539 47,453 21,782 156,194Operating gross margin excluding depreciation andamortization $ (5,889) $ 109,750 $ 64,833 $ 17,199 $ 185,893Balance at December 31, 2014
Operating gross margin(1) $ 46,831 $ 34,405 $ 71,790 $ 1,156 $ 154,182Depreciation and amortization 21,260 59,684 46,402 17,775 145,121Operating gross margin excluding depreciation andamortization $ 68,091 $ 94,089 $ 118,192 $ 18,931 $ 299,303
(1) Operating gross margin is calculated as revenues less direct operating expenses, including depreciation and amortization expense.
The following table presents our average utilization rates and rigs available for service for the years ended December 31, 2015 and 2014, respectively:
December 31,2015 2014
U.S. (Lower 48) Drilling
Rigs available for service (1) 13.0 12.1Utilization rate of rigs available for service (2) 15% 72%
International & Alaska Drilling
Eastern HemisphereRigs available for service (1) 13.0 13.0Utilization rate of rigs available for service (2) 66% 77%
Latin America RegionRigs available for service (1) 9.0 9.0Utilization rate of rigs available for service (2) 40% 60%
AlaskaRigs available for service (1) 2.0 2.0Utilization rate of rigs available for service (2) 100% 100%
Total International & Alaska DrillingRigs available for service (1) 24.0 24.0Utilization rate of rigs available for service (2) 59% 72%
(1) The number of rigs available for service is determined by calculating the number of days each rig was in our fleet and was under contract or available for contract. For example, a rig under contract or available for contract for six months of a year is 0.5 rigs available for service during such year. Our method of computation of rigs available for service may not be comparable to other similarly titled measures of other companies.
(2) Rig utilization rates are based on a weighted average basis assuming total days availability for all rigs available for service. Rigs acquired or disposed of are treated as added to or removed from the rig fleet as of the date of acquisition or disposal. Rigs that are in operation or fully or partially staffed and on a revenue-producing standby status are considered to be utilized. Rigs under contract that generate revenues during moves between locations or during mobilization or demobilization are also considered to be utilized. Our method of computation of rig utilization may not be comparable to other similarly titled measures of other companies.

32
Drilling Services Business
U.S. (Lower 48) Drilling
U.S. (Lower 48) Drilling segment revenues decreased $128.0 million, or 80.8 percent, to $30.4 million for the year ended December 31, 2015, as compared with revenues of $158.4 million for the year ended December 31, 2014. The decrease was primarily due to lower utilization in the offshore GOM, which declined from 72 percent for the year ended December 31, 2014 to 15 percent for the year ended December 31, 2015 and resulted in a $101.0 million decrease in revenues. The decline in utilization for the barge drilling business was due to substantial reductions in drilling activity by operators in the inland waters of the GOM resulting from lower oil prices. The remainder of the decrease was primarily driven by a reduction in average dayrates for the barge drilling business and a decrease in revenues from our O&M contract supporting three platform operations located offshore California. The O&M contract ended during the 2015 fourth quarter.
U.S. (Lower 48) Drilling segment operating gross margin excluding depreciation and amortization decreased $74.0 million, or 108.7 percent, to $5.9 million loss for the year ended December 31, 2015, compared with $68.1 million for the year ended December 31, 2014. This decrease was primarily due to the decline in utilization discussed above.
International & Alaska Drilling
International & Alaska Drilling segment revenues decreased $27.4 million, or 5.9 percent, to $435.1 million for the year ended December 31, 2015, compared with $462.5 million for the year ended December 31, 2014.
The decrease in revenues was primarily due to the following:
• a decrease of $50.7 million, excluding reimbursable revenues, resulting from decreased utilization for Company-owned rigs. Utilization for the segment decreased from 72 percent to 59 percent for the years ended December 31, 2014 and 2015, respectively, primarily resulting from the decline in oil prices which led to reduced customer activity; and
• a decrease of approximately $7.4 million of revenues generated from our project service activities.
The decrease in revenues was partially offset by the following:
• an increase of $12.2 million, excluding reimbursable revenues, related to our O&M activity primarily resulting from the two-rig O&M contract in Abu Dhabi that commenced during the 2015 first quarter partially offset by the completion of an O&M contract in May 2014; and
• an increase in reimbursable revenues of $12.0 million which added to revenues but had a minimal impact on operating margins.
International & Alaska Drilling segment operating gross margin excluding depreciation and amortization increased $15.7 million, or 16.7 percent, to $109.8 million for the year ended December 31, 2015, compared with $94.1 million for the year ended December 31, 2014. The increase in operating gross margin excluding depreciation and amortization was primarily due to the benefit of higher margins earned on our project services activities which contributed $13.4 million to the increase. Margins also benefited from increased O&M activity and lower operating costs in certain locations, which helped offset the impact of lower utilization discussed above.
Rental Tools Services Business
U.S. Rental Tools
U.S. Rental Tools segment revenues decreased $81.7 million, or 36.5 percent, to $141.9 million for the year ended December 31, 2015 compared to $223.6 million for the year ended December 31, 2014. The decreases were primarily attributable to reduced customer activity and pricing pressures resulting from lower oil prices.
U.S. Rental Tools segment operating gross margin excluding depreciation and amortization decreased $53.4 million, or 45.2 percent, to $64.8 million for the year ended December 31, 2015 compared with $118.2 million for the year ended December 31, 2014. The decrease was due to the declines in oil prices and customer activity discussed above.

33
International Rental Tools
International Rental Tools segment revenues decreased $19.4 million, or 15.6 percent, to $104.8 million for the year ended December 31, 2015 compared to $124.2 million for the year ended December 31, 2014. The decreases were primarily attributable to reduced customer activity and pricing pressures resulting from lower oil prices.
International Rental Tools segment operating gross margin excluding depreciation and amortization decreased $1.7 million, or 9.0 percent, to $17.2 million for the year ended December 31, 2015 compared with $18.9 million for the year ended December 31, 2014. The decrease was due to the declines in oil prices and customer activity discussed above.
Other Financial Data
General and administrative expense
General and administrative expense increased $1.2 million to $36.2 million for the year ended December 31, 2015, compared with $35.0 million for the year ended December 31, 2014. The increase was primarily driven by expenses associated with the implementation of the second phase of our enterprise resource planning system in 2015 and a benefit for the year ended December 31, 2014 from a $2.75 million reimbursement received from an escrow account related to the acquisition of International Tubular Services Limited (ITS) and related assets (collectively, the ITS Acquisition). Excluding the benefit of the reimbursement from escrow in 2014, general and administrative expenses declined as a result of reductions in personnel and cost control activities.
Provision for reduction in carrying value of certain assets
During the year ended December 31, 2015, we recorded $12.5 million of provisions for reduction in carrying value of assets. During the 2015 fourth quarter management made a decision to exit the Drilling Services business in Colombia. As of December 31, 2015 there were three-rigs in the country. One of the rigs was marketed for operations outside of Colombia, and for the remaining two rigs, components of the rigs that were useable elsewhere in our operations were re-deployed and the carrying value of the remaining components was written-off, resulting in a provision for reduction in carrying value of $4.8 million. In addition, during the 2015 fourth quarter, to adjust to the lower level of current and expected activity, we performed a review of certain individual assets within our asset groups and recorded a $4.3 million provision for reduction in carrying value of assets primarily related to drilling equipment in our International & Alaska Drilling segment. During the 2015 second and third quarters, the Company wrote-off a combined $3.2 million related to certain international rental tools and drilling rigs that management concluded were no longer marketable and the carrying value of the rigs and equipment was no longer recoverable. During 2014, the provision for reduction in carrying value of certain assets was zero.
Gain on disposition of assets
Net gains recorded on asset dispositions for the years ended December 31, 2015 and 2014 were $1.6 million and $1.1 million, respectively. The net gains for 2015 were primarily due an insurance settlement received in the 2015 first quarter related to previously realized asset losses, partially offset by losses incurred during the 2015 fourth quarter related to equipment retirements.
The net gains for 2014 were primarily the result of long-lived asset sales, including the sale of two rigs located in Kazakhstan during the fourth quarter. Activity in both periods included the result of asset sales. We periodically sell equipment deemed to be excess, obsolete, or not currently required for operations.
Interest income and expense
Interest expense increased $0.9 million to $45.2 million for the year ended December 31, 2015 compared with $44.3 million for the year ended December 31, 2014, despite a decrease in debt related interest expense resulting from a decrease in our total amount of outstanding debt and lower interest rates during 2015. The increase in interest expense is primarily due to a lower amount of capitalized interest during 2015 as compared to 2014 and higher fees on the unused portion of the Revolver. During 2015, we increased our revolver from $80 million to $200 million, and as a result of this increased availability, we experienced a corresponding increase in fees on the unused portion of the revolver.
Interest income increased $0.1 million to $0.3 million during 2015, compared with interest income of $0.2 million during 2014.
Loss on extinguishment of debt
Loss on extinguishment of debt was zero and $30.2 million for the years ended December 31, 2015 and December 31, 2014, respectively. The loss on extinguishment of debt for 2014 related to the purchase and redemption of our 9.125% Senior Notes, due 2018 (9.125% Notes) during the first six months of 2014.

34
Other income and expense
Other income and expense was $9.7 million of expense and $2.5 million of income for the years ended December 31, 2015 and December 31, 2014, respectively. During the 2015 fourth quarter we incurred a $4.8 million loss on the sale of our controlling interest in a consolidated joint venture in Egypt and during the 2015 second quarter we incurred a $0.9 million loss on the divestiture of our controlling interest in a consolidated joint venture in Russia. Additionally, net losses related to foreign currency fluctuations increased $2.5 million for the 2015 full year compared to the 2014 full year. Other income in 2014 was primarily related to earnings from our investment in an unconsolidated subsidiary that was acquired as part of the ITS Acquisition as well as settlements of claims against a vendor.
Income tax expense
Income tax expense was $22.3 million on a pre-tax loss of $72.0 million for the year ended December 31, 2015, compared with $24.1 million on pre-tax income of $48.5 million for the year ended December 31, 2014. Our effective tax rate was negative 31.0 percent for the year ended December 31, 2015, compared with 49.6 percent for the year ended December 31, 2014. Income tax expense and our annual effective tax rate are primarily affected by recurring items, such as the relative amounts of income or loss we earn in tax paying and non-tax paying jurisdictions, the statutory tax rates applied in the jurisdictions where the income or losses are earned, and our ability to receive tax benefits for losses incurred. It is also affected by discrete items, such as return-to-accrual adjustments and changes in valuation allowances, and changes in reserves for uncertain tax positions, which may occur in any given year but are not consistent from year to year.
Despite the pre-tax loss for the year ended December 31, 2015, we recognized income tax expense as a result of a change in valuation allowance of $40.6 million primarily on U.S. foreign tax credits of $32.4 million and certain foreign net operating losses of $8.2 million. We established the valuation allowance based on the weight of available evidence, both positive and negative, including results of recent and current operations and our estimates of future taxable income or loss by jurisdiction in which we operate. In order to determine the amount of deferred tax assets or liabilities, as well as the valuation allowances, we must make estimates and assumptions regarding future taxable income, where rigs will be deployed and other business considerations. Changes in these estimates and assumptions, including changes in tax laws and other changes impacting our ability to recognize the underlying deferred tax assets, could require us to adjust the valuation allowances.
We are a U.S. based company that operates internationally through various branches and subsidiaries. Accordingly, our worldwide income tax provision includes the impact of income tax rates and foreign tax laws in the jurisdictions in which our operations are conducted and income is earned. We reported tax benefits for foreign statutory rates different than our U.S. statutory rate of $2.7 million and $3.4 million and tax expense of $16.0 million and $11.2 million for the impact of foreign tax laws in effect for the years ended December 31, 2015 and December 31, 2014, respectively. Differences between the U.S. and foreign tax rates and laws have a significant impact in Colombia, Iraq, Kazakhstan, Mexico, Russia, United Arab Emirates and the United Kingdom.
Certain tax payments to foreign jurisdictions are available as credits to reduce tax expense in the U.S. and other foreign jurisdictions. We reported tax benefits for foreign tax credits of $5.6 million and $3.0 million for the years ended December 31, 2015 and December 31, 2014, respectively, which are driven primarily by our operations in Kazakhstan. See Note 6 - Income Taxes in Item 8. Financial Statements and Supplementary Data for further discussion.

35
Liquidity and Capital Resources
We periodically evaluate our liquidity requirements, capital needs and availability of resources in view of expansion plans, debt service requirements, and other operational cash needs. To meet our short term liquidity requirements we primarily rely on our cash from operations. We also have access to cash through the Revolver, subject to our compliance with the covenants contained in the 2015 Secured Credit Agreement. We expect that these sources of liquidity will be sufficient to provide us the ability to fund our current operations and required capital expenditures. We may need to fund expansion capital expenditures, acquisitions, debt principal payments, or pursuits of business opportunities that support our strategy, through additional borrowings or the issuance of additional common stock or other forms of equity. We do not pay dividends on our common stock.
Liquidity
The following table provides a summary of our total liquidity:
December 31, 2016
Dollars in thousands
Cash and cash equivalents on hand (1) $ 119,691Availability under Revolver (2) 90,250Total liquidity $ 209,941
(1) As of December 31, 2016, approximately $39.7 million of the $119.7 million of cash and equivalents was held by our foreign subsidiaries.
(2) Availability under the Revolver included $100 million undrawn portion less $9.8 million of letters of credit outstanding. In order to access the Revolver, we must be in compliance with the covenants contained in the 2015 Secured Credit Agreement.
The earnings of foreign subsidiaries as of December 31, 2016 were reinvested to fund our international operations. If in the future we decide to repatriate earnings to the United States, the Company may be required to pay taxes on these amounts based on applicable United States tax law, which could reduce the liquidity of the Company at that time.
We do not have any unconsolidated special-purpose entities, off-balance sheet financing arrangements or guarantees of third-party financial obligations. As of December 31, 2016, we have no energy, commodity, or foreign currency derivative contracts.
Cash Flow Activity
As of December 31, 2016, we had cash and cash equivalents of $119.7 million, a decrease of $14.6 million from cash and cash equivalents of $134.3 million at December 31, 2015. The following table provides a summary of our cash flow activity for the last three years:
Dollars in thousands 2016 2015 2014
Operating Activities $ 21,285 $ 162,122 $ 202,467Investing Activities (26,513) (101,243) (173,575)Financing Activities (9,375) (35,041) (69,125)Net change in cash and cash equivalents $ (14,603) $ 25,838 $ (40,233)
Operating Activities
Cash flows provided by operating activities were $21.3 million, $162.1 million, and $202.5 million for the years ended December 31, 2016, 2015, and 2014, respectively. Cash flows from operating activities in each period were largely impacted by our earnings and changes in working capital. Changes in working capital were a source of cash of $38.8 million for the year ended December 31, 2016, a source of cash of $80.7 million for the year ended December 31, 2015, and a use of cash of $17.1 million for the year ended December 31, 2014. In addition to the impact of earnings and working capital changes, cash flows from operating activities in each period were impacted by non-cash charges such as depreciation expense, gains or losses on asset sales, deferred tax expense, stock compensation expense and amortization of debt issuance costs.
It is our long-term intention to utilize our operating cash flows to fund maintenance and growth of our rental tool assets and drilling rigs; however, given the decline in demand in the current oil and natural gas services market, our short-term focus has been to preserve liquidity by lowering our costs and capital expenditures.

36
Investing Activities
Cash flows used in investing activities were $26.5 million for the year ended December 31, 2016, compared with $101.2 million and $173.6 million for the years ended December 31, 2015 and 2014, respectively. Cash flows used in investing activities in 2016 included capital expenditures of $29.0 million and were primarily for tubular and other products for our Rental Tools Services business and rig-related maintenance.
Cash flows used in investing activities in 2015 included capital expenditures of $88.2 million, primarily for tubular and other products for our Rental Tools Services business and rig-related enhancements and maintenance. In addition, during 2015 we had a use of cash of $10.4 million, net of cash acquired, for the 2M-Tek Acquisition and $3.4 million related to the purchase of the remaining noncontrolling interest in ITS Arabia Limited.
Cash flows used in investing activities in 2014 primarily included capital expenditures of $179.5 million primarily for tubular and other products for our Rental Tools Services business, purchase of barge rig 30B, and rig-related enhancements and maintenance.
Capital expenditures for 2017 are estimated to range from $40.0 to $50.0 million and will primarily be directed to our Rental Tools Services business inventory and maintenance capital for our Drilling Services business. Any discretionary spending will be evaluated based upon adequate return requirements and available liquidity.
Financing Activities
Cash flows used in financing activities were $9.4 million, $35.0 million, and $69.1 million for the years ended December 31, 2016, 2015, and 2014, respectively. Cash flows used in financing activities for 2016 were for payments of $6.0 million of the contingent consideration related to the 2M-Tek Acquisition and a $3.4 million final payment of the purchase price for the remaining noncontrolling interest of ITS Arabia Limited.
Cash flows used in financing activities were $35.0 million for the year ended December 31, 2015 and were primarily related to the repayment of the $30.0 million borrowing on our Revolver in the first quarter of 2015.
Cash flows used in financing activities for 2014 primarily related to the repayment of $425.0 million of our 9.125% Senior Notes due 2018 (9.125% Notes), payment of $26.2 million of related tender and consent premiums, and payment of debt issuance costs of $7.6 million. Cash provided by financing activities included proceeds of $360.0 million from the issuance of our 6.75% Senior Notes due 2022 (6.75% Notes) and reborrowing of a $40.0 million Term Loan under our Amended and Restated Senior Secured Credit Agreement (2012 Secured Credit Agreement).
Long-Term Debt Summary
Our principal amount of long-term debt, including current portion, was $585.0 million as of December 31, 2016, which consisted of:
• $360.0 million aggregate principal amount of 6.75% Notes; and
• $225.0 million aggregate principal amount of 7.50% Notes.
6.75% Senior Notes, due July 2022
On January 22, 2014, we issued $360.0 million aggregate principal amount of 6.75% Senior Notes, due July 2022 (6.75% Notes) pursuant to an Indenture between the Company and The Bank of New York Mellon Trust Company, N.A., as trustee. Net proceeds from the 6.75% Notes offering plus a $40.0 million term loan draw under the 2012 Secured Credit Agreement and cash on hand were utilized to purchase $416.2 million aggregate principal amount of our outstanding 9.125% Senior Notes due 2018 pursuant to a tender and consent solicitation offer commenced on January 7, 2014.
The 6.75% Notes are general unsecured obligations of the Company and rank equal in right of payment with all of our existing and future senior unsecured indebtedness. The 6.75% Notes are jointly and severally guaranteed by all of our subsidiaries that guarantee indebtedness under the Second Amended and Restated Senior Secured Credit Agreement, as amended from time-to-time (2015 Secured Credit Agreement) and our 7.50% Senior Notes due 2020 (7.50% Notes, and collectively with the 6.75% Notes, the Senior Notes). Interest on the 6.75% Notes is payable on January 15 and July 15 of each year, beginning July 15, 2014. Debt issuance costs related to the 6.75% Notes of approximately $7.6 million ($5.5 million net of amortization as of December 31, 2016) are being amortized over the term of the notes using the effective interest rate method.
At any time prior to January 15, 2017, we were able to redeem up to 35 percent of the aggregate principal amount of the 6.75% Notes at a redemption price of 106.75 percent of the principal amount, plus accrued and unpaid interest to the redemption
37
date, with the net cash proceeds of certain equity offerings by us. We have not made any redemptions to date. On and after January 15, 2018, we may redeem all or a part of the 6.75% Notes upon appropriate notice, at a redemption price of 103.375 percent of the principal amount, and at redemption prices decreasing each year thereafter to par beginning January 15, 2020. If we experience certain changes in control, we must offer to repurchase the 6.75% Notes at 101.0 percent of the aggregate principal amount, plus accrued and unpaid interest and additional interest, if any, to the date of repurchase.
The Indenture limits our ability and the ability of certain subsidiaries to: (i) sell assets, (ii) pay dividends or make other distributions on capital stock or redeem or repurchase capital stock or subordinated indebtedness, (iii) make investments, (iv) incur or guarantee additional indebtedness, (v) create or incur liens, (vi) enter into sale and leaseback transactions, (vii) incur dividend or other payment restrictions affecting subsidiaries, (viii) merge or consolidate with other entities, (ix) enter into transactions with affiliates, and (x) engage in certain business activities. Additionally, the Indenture contains certain restrictive covenants designating certain events as Events of Default. These covenants are subject to a number of important exceptions and qualifications.
7.50% Senior Notes, due August 2020
On July 30, 2013, we issued $225.0 million aggregate principal amount of the 7.50% Notes pursuant to an Indenture between the Company and The Bank of New York Mellon Trust Company, N.A., as trustee. Net proceeds from the 7.50% Notes offering were primarily used to repay the $125.0 million aggregate principal amount of a term loan used to initially finance the ITS Acquisition, to repay $45.0 million of term loan borrowings under the 2012 Secured Credit Agreement, and for general corporate purposes.
The 7.50% Notes are general unsecured obligations of the Company and rank equal in right of payment with all of our existing and future senior unsecured indebtedness. The 7.50% Notes are jointly and severally guaranteed by all of our subsidiaries that guarantee indebtedness under the 2015 Secured Credit Agreement and the 6.75% Notes. Interest on the 7.50% Notes is payable on February 1 and August 1 of each year, beginning February 1, 2014. Debt issuance costs related to the 7.50% Notes of approximately $5.6 million ($3.2 million, net of amortization as of December 31, 2016) are being amortized over the term of the notes using the effective interest rate method.
We may redeem all or a part of the 7.50% Notes upon appropriate notice, at redemption prices decreasing each year after August 1, 2016 to par beginning August 1, 2018. We have not made any redemptions to date. If we experience certain changes in control, we must offer to repurchase the 7.50% Notes at 101.0 percent of the aggregate principal amount, plus accrued and unpaid interest and additional interest, if any, to the date of repurchase.
The Indenture limits our ability and the ability of certain subsidiaries to: (i) sell assets, (ii) pay dividends or make other distributions on capital stock or redeem or repurchase capital stock or subordinated indebtedness, (iii) make investments, (iv) incur or guarantee additional indebtedness, (v) create or incur liens, (vi) enter into sale and leaseback transactions, (vii) incur dividend or other payment restrictions affecting subsidiaries, (viii) merge or consolidate with other entities, (ix) enter into transactions with affiliates, and (x) engage in certain business activities. Additionally, the Indenture contains certain restrictive covenants designating certain events as Events of Default. These covenants are subject to a number of important exceptions and qualifications.
2015 Secured Credit Agreement
On January 26, 2015 we entered into the 2015 Secured Credit Agreement, which amended and restated the 2012 Secured Credit Agreement. The 2015 Secured Credit Agreement was originally comprised of a $200 million Revolver set to mature on January 26, 2020. On June 1, 2015, we executed the first amendment to the 2015 Secured Credit Agreement in order to amend certain provisions regarding the definition of “Change of Control.” On September 29, 2015, we executed the second amendment to the 2015 Secured Credit Agreement to, among other things, (a) amend certain covenant ratios; (b) increase the Applicable Rate for certain higher levels of consolidated leverage to a maximum of 4.00 percent per annum for Eurodollar Rate loans and to 3.00 percent per annum for Base Rate loans; (c) permit multi-year letters of credit up to an aggregate amount of $5.0 million; (d) limit payment prior to September 30, 2017 of certain restricted payments and certain prepayments of unsecured senior notes and other specified forms of indebtedness; and (e) remove the option of the Company, subject to the consent of the lenders, to increase the Credit Agreement up to an additional $75 million. On May 27, 2016, we executed the third amendment to the 2015 Secured Credit Agreement (the Third Amendment), which reduced availability under the Revolver from $200 million to $100 million. Additionally, among other things, the Third Amendment: (a) eliminated the Leverage Ratio covenant until the fourth quarter of 2018 when the covenant is reinstated with the ratio established at 4.25:1.00; (b) eliminated the Consolidated Interest Coverage Ratio covenant until the fourth quarter of 2017 when the covenant is reinstated with the ratio established at 1.00:1.00 and increases by 0.25 each subsequent quarter until reaching 2.00:1.00 in the fourth quarter of 2018, and remains at 2.00:1.00 thereafter; (c) immediately increased the maximum permitted Senior Secured Leverage Ratio from 1.50:1.00 to 2.80:1.00 until it decreases to 2.20:1.00 in the second quarter of 2017, to 1.75:1.00 in the third quarter of 2017, and to 1.50:1.00 in the fourth quarter of 2017 and remains at 1.50:1.00 thereafter; (d) immediately decreased the minimum permitted Asset Coverage Ratio from 1.25:1.00 to 1.10:1.00 until it increases to 1.25: 1.00 in the fourth quarter of 2017 and remains at 1.25:1.00 thereafter; (e) requires that, at any time our

38
Consolidated Cash Balance in U.S. bank accounts is over $50 million, we repay borrowings under the 2015 Secured Credit Agreement until our Consolidated Cash balance is no more than $50 million or all borrowings have been repaid, and (f) allows up to $75 million of Junior Lien Debt.
At the time the Third Amendment was executed, the remaining debt issuance costs for the 2015 Secured Credit Agreement totaled approximately $2.2 million. Since the Revolver was reduced by 50 percent, we wrote off approximately $1.1 million of debt issuance costs in May 2016. We incurred debt issuance costs relating to the Third Amendment of approximately $0.3 million, bringing total debt issuance costs of $1.4 million ($1.2 million, net of amortization as of December 31, 2016) which are being amortized through January 2020, or the term of the Third Amendment, on a straight line basis.
Our obligations under the 2015 Secured Credit Agreement are guaranteed by substantially all of our direct and indirect domestic subsidiaries, other than immaterial subsidiaries and subsidiaries generating revenues primarily outside the United States, each of which has executed guaranty agreements, and are secured by first priority liens on our accounts receivable, specified rigs including barge rigs in the GOM and land rigs in Alaska, certain U.S.-based rental equipment of the Company and its subsidiary guarantors and the equity interests of certain of the Company’s subsidiaries. The 2015 Secured Credit Agreement contains customary affirmative and negative covenants, such as limitations on indebtedness, liens, restrictions on entry into certain affiliate transactions and payments (including payment of dividends) and maintenance of certain ratios and coverage tests. We were in compliance with all covenants contained in the 2015 Secured Credit Agreement as of December 31, 2016.
Our Revolver is available for general corporate purposes and to support letters of credit. Interest on Revolver loans accrues at a Base Rate plus an Applicable Rate or LIBOR plus an Applicable Rate. Revolving loans are available subject to a quarterly asset coverage ratio calculation based on the Orderly Liquidation Value of certain specified rigs including barge rigs in the GOM and land rigs in Alaska, and certain U.S.-based rental equipment of the Company and its subsidiary guarantors and a percentage of eligible domestic accounts receivable. The $30.0 million draw outstanding at the closing of the 2015 Secured Credit Agreement was repaid in full during the first quarter of 2015 with cash on hand. Letters of credit outstanding against the Revolver as of December 31, 2016 totaled $9.8 million. There were no amounts drawn on the Revolver as of December 31, 2016.
Summary of Contractual Cash Obligations
The following table summarizes our future contractual cash obligations as of December 31, 2016:
Total 2017 2018 2019 2020 2021Beyond
2021 (Dollars in Thousands)
Contractual cash obligations:Long-term debt — principal $ 585,000 $ — $ — $ — $ 225,000 $ — $ 360,000Long-term debt — interest 213,300 41,175 41,175 41,175 41,175 24,300 24,300Operating leases(1) 37,250 12,559 7,841 6,667 5,168 2,823 2,192Purchase commitments(2) 28,655 28,655 — — — — —
Total contractual obligations $ 864,205 $ 82,389 $ 49,016 $ 47,842 $ 271,343 $ 27,123 $ 386,492Commercial commitments:
Standby letters of credit(3) $ 9,750 $ 9,046 $ 704 $ — $ — $ — $ —Total commercial commitments $ 9,750 $ 9,046 $ 704 $ — $ — $ — $ —
(1) Operating leases consist of lease agreements in excess of one year for office space, equipment, vehicles and personal property.
(2) We had purchase commitments outstanding as of December 31, 2016, related to rental tools and rig related expenditures.
(3) The available capacity of the Revolver is $100 million. As of December 31, 2016, $9.8 million of availability had been used to support outstanding letters of credit.
39
Other Matters
Business Risks
See Item 1A. Risk Factors, for a discussion of risks related to our business.
Critical Accounting Policies
Our discussion and analysis of our financial condition and results of operations are based upon our consolidated financial statements, which have been prepared in accordance with accounting principles generally accepted in the United States. The preparation of these financial statements requires management to make estimates and assumptions that affect the reported amounts of assets and liabilities at the date of the financial statements and the reported amounts of revenues and expenses during the reporting period. On an ongoing basis, we evaluate our estimates, including those related to fair value of assets, bad debt, materials and supplies obsolescence, property and equipment, goodwill, income taxes, workers’ compensation and health insurance and contingent liabilities for which settlement is deemed to be probable. We base our estimates on historical experience and on various other assumptions that we believe to be reasonable under the circumstances, the results of which form the basis for making judgments about the carrying values of assets and liabilities that are not readily apparent from other sources. While we believe that such estimates are reasonable, actual results could differ from these estimates.
We believe the following are our most critical accounting policies as they can be complex and require significant judgments, assumptions and/or estimates in the preparation of our consolidated financial statements. Other significant accounting policies are summarized in Note 1 in the notes to the consolidated financial statements.
Fair Value Measurements. For purposes of recording fair value adjustments for certain financial and non-financial assets and liabilities, and determining fair value disclosures, we estimate fair value at a price that would be received to sell an asset or paid to transfer a liability in an orderly transaction between market participants in the principal market for the asset or liability. Our valuation technique requires inputs that we categorize using a three-level hierarchy, from highest to lowest level of observable inputs, as follows: (1) unadjusted quoted prices for identical assets or liabilities in active markets (Level 1), (2) direct or indirect observable inputs, including quoted prices or other market data, for similar assets or liabilities in active markets or identical assets or liabilities in less active markets (Level 2) and (3) unobservable inputs that require significant judgment for which there is little or no market data (Level 3). When multiple input levels are required for a valuation, we categorize the entire fair value measurement according to the lowest level of input that is significant to the measurement even though we may have also utilized significant inputs that are more readily observable.
Impairment of Property, Plant and Equipment. We review the carrying amounts of long-lived assets for potential impairment when events occur or circumstances change that indicate the carrying values of such assets may not be recoverable. For example, evaluations are performed when we experience sustained significant declines in utilization and dayrates, and we do not contemplate recovery in the near future. In addition, we evaluate our assets when we reclassify property and equipment to assets held for sale or as discontinued operations as prescribed by accounting guidance related to accounting for the impairment or disposal of long-lived assets. We determine recoverability by evaluating the undiscounted estimated future net cash flows. When impairment is indicated, we measure the impairment as the amount by which the assets carrying value exceeds its fair value. Management considers a number of factors such as estimated future cash flows, appraisals and current market value analysis in determining fair value. Assets are written down to fair value if the concluded current fair value is below the net carrying value.
Asset impairment evaluations are, by nature, highly subjective. They involve expectations about future cash flows generated by our assets and reflect management’s assumptions and judgments regarding future industry conditions and their effect on future utilization levels, dayrates and costs. The use of different estimates and assumptions could result in materially different carrying values of our assets.
Goodwill. We account for all business combinations using the acquisition method of accounting. Under this method, assets and liabilities, including any remaining noncontrolling interests, are recognized at fair value at the date of acquisition. The excess of the purchase price over the fair value of assets acquired, net of liabilities assumed, plus the value of any noncontrolling interests, is recognized as goodwill. We perform our annual goodwill impairment review during the fourth quarter, as of October 1, and more frequently if negative conditions or other triggering events arise. The quantitative impairment test we perform for goodwill utilizes certain assumptions, including forecasted revenues and costs assumptions.
Intangible Assets. Our intangible assets are related to trade names, customer relationships, and developed technology, which were acquired through acquisition and are generally amortized over a weighted average period of approximately three to six years. We assess the recoverability of the unamortized balance of our intangible assets when indicators of impairment are present based on expected future profitability and undiscounted expected cash flows and their contribution to our overall operations.
40
Should the review indicate that the carrying value is not fully recoverable, the excess of the carrying value over the fair value of the intangible assets would be recognized as an impairment loss.
Accrual for Self-Insurance. Substantially all of our operations are subject to hazards that are customary for oil and natural gas drilling operations, including blowouts, reservoir damage, loss of production, loss of well control, lost or stuck drill strings, equipment defects, cratering, oil and natural gas well fires and explosions, natural disasters, pollution, mechanical failure and damage or loss during transportation. Some of our fleet is also subject to hazards inherent in marine operations, either while on-site or during mobilization, such as capsizing, sinking, grounding, collision, damage from severe weather and marine life infestations. These hazards could result in damage to or destruction of drilling equipment, personal injury and property damage, suspension of operations or environmental damage, which could lead to claims by third parties or customers, suspension of operations and contract terminations. We have had accidents in the past due to some of these hazards.
Our contracts provide for varying levels of indemnification between ourselves and our customers, including with respect to well control and subsurface risks. We seek to obtain indemnification from our customers by contract for certain of these risks. We also maintain insurance for personal injuries, damage to or loss of equipment and other insurance coverage for various business risks. To the extent that we are unable to transfer such risks to customers by contract or indemnification agreements, we seek protection through insurance. However, these insurance or indemnification agreements may not adequately protect us against liability from all of the consequences of the hazards described above. Moreover, our insurance coverage generally provides that we assume a portion of the risk in the form of an insurance coverage deductible.
Based on the risks discussed above, we estimate our liability in excess of insurance coverage and accrue for these amounts in our consolidated financial statements. Accruals related to insurance are based on the facts and circumstances specific to the insurance claims and our past experience with similar claims. The actual outcome of insured claims could differ significantly from the amounts estimated. We accrue actuarially determined amounts in our consolidated balance sheet to cover self-insurance retentions for workers’ compensation, employers’ liability, general liability, automobile liability and health benefits claims. These accruals use historical data based upon actual claim settlements and reported claims to project future losses. These estimates and accruals have historically been reasonable in light of the actual amount of claims paid.
As the determination of our liability for insurance claims could be material and is subject to significant management judgment and in certain instances is based on actuarially estimated and calculated amounts, management believes that accounting estimates related to insurance accruals are critical.
Accounting for Income Taxes. We are a U.S. company and we operate through our various foreign legal entities and their branches and subsidiaries in numerous countries throughout the world. Consequently, our tax provision is based upon the tax laws and rates in effect in the countries in which our operations are conducted and income is earned. The income tax rates imposed and methods of computing taxable income in these jurisdictions vary. Therefore, as a part of the process of preparing the consolidated financial statements, we are required to estimate the income taxes in each of the jurisdictions in which we operate. This process involves estimating the actual current tax exposure together with assessing temporary differences resulting from differing treatment of items, such as depreciation, amortization and certain accrued liabilities for tax and accounting purposes. Our effective tax rate for financial statement purposes will continue to fluctuate from year to year as our operations are conducted in different taxing jurisdictions. Current income tax expense represents either liabilities expected to be reflected on our income tax returns for the current year, nonresident withholding taxes or changes in prior year tax estimates which may result from tax audit adjustments. Our deferred tax expense or benefit represents the change in the balance of deferred tax assets or liabilities reported on the consolidated balance sheet. Valuation allowances are established to reduce deferred tax assets when it is more likely than not that some portion or all of the deferred tax assets will not be realized. In order to determine the amount of deferred tax assets or liabilities, as well as the valuation allowances, we must make estimates and assumptions regarding amounts and sources of future taxable income, where rigs will be deployed and other matters. Changes in these estimates and assumptions, as well as changes in tax laws, could require us to adjust the deferred tax assets and liabilities or valuation allowances, including as discussed below.
Our ability to realize the benefit of our deferred tax assets requires that we achieve certain future earnings levels prior to expiration. Evaluations of the realizability of deferred tax assets are, by nature, highly subjective. They involve expectations about future operations and reflect management’s assumptions and judgments regarding future industry conditions and their effect on future utilization levels, dayrates and costs. The use of different estimates and assumptions could result in materially different determinations of our ability to realize deferred tax assets. In the event that our earnings performance projections do not indicate that we will be able to benefit from our deferred tax assets, valuation allowances are established following the "more likely than not" criteria. We periodically evaluate our ability to utilize our deferred tax assets and, in accordance with accounting guidance related to accounting for income taxes, will record any resulting adjustments that may be required to deferred income tax expense in the period for which an existing estimate changes.

41
We do not currently provide for U.S. deferred taxes on unremitted earnings of our foreign subsidiaries as such earnings were reinvested to fund our international operations. If the unremitted earnings were to be distributed, we could be subject to U.S. taxes and foreign withholding taxes though it is not practicable to determine the resulting liability, if any, that would result on the distribution of such earnings. We annually review our position and may elect to change our future tax position.
We apply the accounting standards related to uncertainty in income taxes. This accounting guidance requires that management make estimates and assumptions affecting amounts recorded as liabilities and related disclosures due to the uncertainty as to final resolution of certain tax matters. Because the recognition of liabilities under this interpretation may require periodic adjustments and may not necessarily imply any change in management’s assessment of the ultimate outcome of these items, the amount recorded may not accurately reflect actual outcomes.
Revenue Recognition. Contract drilling revenues and expenses, comprised of daywork drilling contracts, call-outs against master service agreements and engineering and related project service contracts, are recognized as services are performed and collection is reasonably assured. For certain contracts, we receive payments contractually designated for the mobilization of rigs and other drilling equipment. Mobilization payments received, and direct costs incurred for the mobilization, are deferred and recognized over the term of the related drilling contract; however, costs incurred to relocate rigs and other drilling equipment to areas in which a contract has not been secured are expensed as incurred. Reimbursements received for out-of-pocket expenses are recorded as both revenues and direct costs. For contracts that are terminated prior to the specified term, early termination payments received by us are recognized as revenues when all contractual requirements are met. Revenues from rental activities are recognized ratably over the rental term which is generally less than six months. Our project related services contracts include engineering, consulting, and project management scopes of work and revenue is typically recognized on a time and materials basis.
Allowance for Doubtful Accounts. The allowance for doubtful accounts is estimated for losses that may occur resulting from disputed amounts and the inability of our customers to pay amounts owed. We estimate the allowance based on historical write-off experience and information about specific customers. We review individually, for collectability, all balances over 90 days past due as well as balances due from any customer with respect to which we have information leading us to believe that a risk exists for potential collection.
Legal and Investigation Matters. As of December 31, 2016, we have accrued an estimate of the probable and estimable costs for the resolution of certain legal and investigation matters. We have not accrued any amounts for other matters for which the liability is not probable and reasonably estimable. Generally, the estimate of probable costs related to these matters is developed in consultation with our legal advisors. The estimates take into consideration factors such as the complexity of the issues, litigation risks and settlement costs. If the actual settlement costs, final judgments, or fines, after appeals, differ from our estimates, our future financial results may be adversely affected.
Recent Accounting Pronouncements
For a discussion of the new accounting pronouncements that have had or are expected to have an effect on our consolidated financial statements, see Note 18 - Recent Accounting Pronouncements in Item 8. Financial Statements and Supplementary Data.
Item 7A. Quantitative and Qualitative Disclosures about Market Risk
Foreign Currency Exchange Rate Risk
Our international operations expose us to foreign currency exchange rate risk. There are a variety of techniques to minimize the exposure to foreign currency exchange rate risk, including customer contract payment terms and the possible use of foreign currency exchange rate risk derivative instruments. Our primary foreign currency exchange rate risk management strategy involves structuring customer contracts to provide for payment in both U.S. dollars and local currency. The payment portion denominated in local currency is based on anticipated local currency requirements over the contract term. Due to various factors, including customer acceptance, local banking laws, other statutory requirements, local currency convertibility and the impact of inflation on local costs, actual foreign currency exchange rate risk needs may vary from those anticipated in the customer contracts, resulting in partial exposure to foreign exchange risk. Fluctuations in foreign currencies typically have not had a material impact on our overall results. In situations where payments of local currency do not equal local currency requirements, foreign currency exchange rate risk derivative instruments, specifically spot purchases, may be used to mitigate foreign exchange rate currency risk. We do not enter into derivative transactions for speculative purposes. At December 31, 2016, we had no open foreign currency exchange rate risk derivative contracts.

42
Interest Rate Risk
We are exposed to changes in interest rates through our fixed rate long-term debt. Typically, the fair market value of fixed rate long-term debt will increase as prevailing interest rates decrease and will decrease as prevailing interest rates increase. The fair value of our long-term debt is estimated based on quoted market prices where applicable, or based on the present value of expected cash flows relating to the debt discounted at rates currently available to us for long-term borrowings with similar terms and maturities. The estimated fair value of our $360.0 million principal amount of 6.75% Notes, based on quoted market prices, was $311.4 million at December 31, 2016. The estimated fair value of our $225.0 million principal amount of 7.50% Notes, based on quoted market prices, was $201.4 million at December 31, 2016. A hypothetical 100 basis point increase in interest rates relative to market interest rates at December 31, 2016 would decrease the fair market value of our 6.75% Notes by approximately $35.4 million and decrease the fair market value of our 7.50% Notes by approximately $21.5 million.
Impact of Fluctuating Commodity Prices
We are exposed to the impact of fluctuations in commodity prices that affect spending by E&P companies on drilling programs. Prolonged price reductions in commodity prices have led to significant reductions in drilling activity for both oil and natural gas. This has resulted in cancellations of some existing contracts for our rigs and rental tools, as well as fewer opportunities to maintain utilization for our equipment when contracted work was completed. As a result, drilling rig and rental tools utilization declined along with associated dayrates and rental rates.
In response to the prolonged reduction in market prices for oil and natural gas, many E&P companies curtailed U.S. drilling activity, cut 2016 worldwide spending, terminated certain drilling contracts, requested pricing concessions and took other measures aimed at reducing the capital and operating expenses within their supply chain. This adversely impacted our rental tools activity and pricing, as well as utilization and pricing of our drilling rigs.
While our U.S.-based businesses have been significantly impacted, we have also experienced lower pricing and utilization of tools, services and rigs in certain international markets. Although the severity and duration of the current industry downturn is contingent upon many factors beyond our control, we have taken several steps in an effort to generate free cash flow during this period, including lowering our cost base through headcount reductions and lower idle rig costs, and reducing our capital expenditures. Oil and natural gas prices stabilized and showed signs of recovery in the later part of 2016, resulting in increased drilling activity in the U.S. According to Baker Hughes monthly U.S. rig count data. The U.S. monthly rig count bottomed in May 2016, at 404 rigs and finished the year with a December monthly rig count of 658 rigs, which was lower than the monthly December 2015 rig count of 698 rigs. Many E&P companies are expected to increase their worldwide spending plans for 2017, particularly in the U.S., and this could lead to increased drilling activity off the lows reported in 2016.

43
Item 8. Financial Statements and Supplementary Data
REPORT OF INDEPENDENT REGISTERED PUBLIC ACCOUNTING FIRM
The Board of Directors and Stockholders Parker Drilling Company:
We have audited Parker Drilling Company’s internal control over financial reporting as of December 31, 2016, based on criteria established in Internal Control - Integrated Framework (2013) issued by the Committee of Sponsoring Organizations of the Treadway Commission (COSO). Parker Drilling Company’s management is responsible for maintaining effective internal control over financial reporting and for its assessment of the effectiveness of internal control over financial reporting, included in the accompanying Management’s Annual Report on Internal Control over Financial Reporting in Item 9A. Our responsibility is to express an opinion on Parker Drilling Company’s internal control over financial reporting based on our audit.
We conducted our audit in accordance with the standards of the Public Company Accounting Oversight Board (United States). Those standards require that we plan and perform the audit to obtain reasonable assurance about whether effective internal control over financial reporting was maintained in all material respects. Our audit included obtaining an understanding of internal control over financial reporting, assessing the risk that a material weakness exists, and testing and evaluating the design and operating effectiveness of internal control based on the assessed risk. Our audit also included performing such other procedures as we considered necessary in the circumstances. We believe that our audit provides a reasonable basis for our opinion.
A company’s internal control over financial reporting is a process designed to provide reasonable assurance regarding the reliability of financial reporting and the preparation of financial statements for external purposes in accordance with generally accepted accounting principles. A company’s internal control over financial reporting includes those policies and procedures that (1) pertain to the maintenance of records that, in reasonable detail, accurately and fairly reflect the transactions and dispositions of the assets of the company; (2) provide reasonable assurance that transactions are recorded as necessary to permit preparation of financial statements in accordance with generally accepted accounting principles, and that receipts and expenditures of the company are being made only in accordance with authorizations of management and directors of the company; and (3) provide reasonable assurance regarding prevention or timely detection of unauthorized acquisition, use, or disposition of the company’s assets that could have a material effect on the financial statements.
Because of its inherent limitations, internal control over financial reporting may not prevent or detect misstatements. Also, projections of any evaluation of effectiveness to future periods are subject to the risk that controls may become inadequate because of changes in conditions, or that the degree of compliance with the policies or procedures may deteriorate.
In our opinion, Parker Drilling Company maintained, in all material respects, effective internal control over financial reporting as of December 31, 2016, based on criteria established in Internal Control - Integrated Framework (2013) issued by the COSO.
We also have audited, in accordance with the standards of the Public Company Accounting Oversight Board (United States), the consolidated balance sheets of Parker Drilling Company and subsidiaries as of December 31, 2016 and 2015, and the related consolidated statements of operations, comprehensive income, stockholders’ equity, and cash flows for each of the years in the three-year period ended December 31, 2016, and our report dated February 21, 2017 expressed an unqualified opinion on those consolidated financial statements. /s/ KPMG LLPHouston, TexasFebruary 21, 2017

44
REPORT OF INDEPENDENT REGISTERED PUBLIC ACCOUNTING FIRM
The Board of Directors and StockholdersParker Drilling Company:
We have audited the accompanying consolidated balance sheets of Parker Drilling Company and subsidiaries as of December 31, 2016 and 2015, and the related consolidated statements of operations, comprehensive income, stockholders’ equity, and cash flows for each of the years in the three-year period ended December 31, 2016. In connection with our audits of the consolidated financial statements, we also have audited financial statement Schedule II - Valuation and Qualifying Accounts for each of the years in the three-year period ended December 31, 2016. These consolidated financial statements and financial statement schedule are the responsibility of the Company’s management. Our responsibility is to express an opinion on these consolidated financial statements and financial statement schedule based on our audits.
We conducted our audits in accordance with the standards of the Public Company Accounting Oversight Board (United States). Those standards require that we plan and perform the audit to obtain reasonable assurance about whether the financial statements are free of material misstatement. An audit includes examining, on a test basis, evidence supporting the amounts and disclosures in the financial statements. An audit also includes assessing the accounting principles used and significant estimates made by management, as well as evaluating the overall financial statement presentation. We believe that our audits provide a reasonable basis for our opinion.
In our opinion, the consolidated financial statements referred to above present fairly, in all material respects, the financial position of Parker Drilling Company and subsidiaries as of December 31, 2016 and 2015, and the results of their operations and their cash flows for each of the years in the three-year period ended December 31, 2016, in conformity with U.S. generally accepted accounting principles. Also in our opinion, the related financial statement schedule, when considered in relation to the basic consolidated financial statements taken as a whole, presents fairly, in all material respects, the information set forth therein.
We also have audited, in accordance with the standards of the Public Company Accounting Oversight Board (United States), Parker Drilling Company’s internal control over financial reporting as of December 31, 2016, based on criteria established in Internal Control - Integrated Framework (2013) issued by the Committee of Sponsoring Organizations of the Treadway Commission (COSO), and our report dated February 21, 2017 expressed an unqualified opinion on the effectiveness of Parker Drilling Company’s internal control over financial reporting.
/s/ KPMG LLP
Houston, TexasFebruary 21, 2017

45
PARKER DRILLING COMPANY AND SUBSIDIARIES
CONSOLIDATED STATEMENT OF OPERATIONS(Dollars in Thousands, Except Per Share Data)
Year Ended December 31, 2016 2015 2014
Revenues $ 427,004 $ 712,183 $ 968,684Expenses:
Operating expenses 362,521 526,290 669,381Depreciation and amortization 139,795 156,194 145,121
502,316 682,484 814,502Total operating gross margin (loss) (75,312) 29,699 154,182General and administration expense (34,332) (36,190) (35,016)Provision for reduction in carrying value of certain assets — (12,490) —Gain (loss) on disposition of assets, net (1,613) 1,643 1,054Total operating income (loss) (111,257) (17,338) 120,220Other income (expense):
Interest expense (45,812) (45,155) (44,265)Interest income 58 269 195Loss on extinguishment of debt — — (30,152)Other 367 (9,747) 2,539
Total other income (expense) (45,387) (54,633) (71,683)Income (loss) before income taxes (156,644) (71,971) 48,537Income tax expense (benefit):
Current tax expense (benefit) 5,108 19,604 22,567Deferred tax expense (benefit) 69,062 2,709 1,509
Total income tax expense (benefit) 74,170 22,313 24,076Net income (loss) (230,814) (94,284) 24,461Less: Net income attributable to noncontrolling interest — 789 1,010Net income (loss) attributable to controlling interest $ (230,814) $ (95,073) $ 23,451Basic earnings (loss) per share: $ (1.86) $ (0.78) $ 0.19Diluted earnings (loss) per share: $ (1.86) $ (0.78) $ 0.19Number of common shares used in computing earnings per share:
Basic 124,130,004 122,562,187 121,186,464Diluted 124,130,004 122,562,187 123,076,648
See accompanying notes to the consolidated financial statements.

46
PARKER DRILLING COMPANY AND SUBSIDIARIESCONSOLIDATED STATEMENTS OF COMPREHENSIVE INCOME (LOSS)
(Dollars in Thousands)
Year Ended December 31,
2016 2015 2014
Comprehensive income (loss):Net income (loss) $ (230,814) $ (94,284) $ 24,461Other comprehensive gain (loss), net of tax:
Currency translation difference on related borrowings (691) (2,012) (4,870)Currency translation difference on foreign currency net investments (4,265) 405 2,147
Total other comprehensive gain (loss), net of tax: (4,956) (1,607) (2,723)Comprehensive income (loss) (235,770) (95,891) 21,738Comprehensive (income) loss attributable to noncontrolling interest — 4,606 (673)Comprehensive income (loss) attributable to controlling interest $ (235,770) $ (91,285) $ 21,065
See accompanying notes to the consolidated financial statements.

47
PARKER DRILLING COMPANY AND SUBSIDIARIES
CONSOLIDATED BALANCE SHEET(Dollars in Thousands)
December 31, 2016 2015
ASSETSCurrent assets:
Cash and cash equivalents $ 119,691 $ 134,294Accounts and Notes Receivable, net of allowance for bad debts of $8,259 in 2016 and $8,694 in 2015 113,231 175,105Rig materials and supplies 32,354 34,937Deferred costs 1,436 1,367Other tax assets 6,475 5,192Other current assets 13,131 15,846
Total current assets 286,318 366,741
Property, plant and equipment, net of accumulated depreciation of $1,320,644 in 2016 and$1,302,380 in 2015 (Note 5) 693,439 805,841Goodwill (Note 3) 6,708 6,708Intangible assets, net (Note 3) 9,928 13,377Rig materials and supplies 22,439 18,104Deferred income taxes 70,309 139,282Other assets 14,410 16,649
Total assets $ 1,103,551 $ 1,366,702LIABILITIES AND STOCKHOLDERS’ EQUITY
Current liabilities:Accounts payable $ 42,655 $ 58,080Accrued liabilities 56,186 71,623Accrued income taxes 4,080 6,418
Total current liabilities 102,921 136,121Long-term debt, net of unamortized debt issuance costs of $8,674 at December 31, 2016 and $10,202 at December 31, 2015 576,326 574,798
Other long-term liabilities 15,836 18,617Long-term deferred tax liability 69,333 68,654Commitments and contingencies (Note 13)Stockholders’ equity:
Preferred Stock, $1 par value, 1,942,000 shares authorized, no shares outstanding — —Common Stock, $0.16 2/3 par value, authorized 280,000,000 shares, issued and outstanding,
125,118,365 shares (123,206,269 shares in 2015) 20,837 20,518Capital in excess of par value 675,194 669,120Accumulated deficit (350,052) (119,238)Accumulated Other Comprehensive Income (6,844) (1,888)
Total controlling interest stockholders’ equity 339,135 568,512Noncontrolling interest — —
Total equity 339,135 568,512Total liabilities and stockholders’ equity $ 1,103,551 $ 1,366,702
See accompanying notes to the consolidated financial statements.

48
PARKER DRILLING COMPANY AND SUBSIDIARIESCONSOLIDATED STATEMENT OF CASH FLOWS
(Dollars in Thousands)
Year Ended December 31, 2016 2015 2014Cash flows from operating activities:
Net income (loss) $ (230,814) $ (94,284) $ 24,461Adjustments to reconcile net income (loss):
Depreciation and amortization 139,795 156,194 145,121Accretion of contingent consideration 419 826 —(Gain) loss on debt modification 1,088 — —(Gain) loss on extinguishment of debt — — 30,152(Gain) loss on disposition of assets 1,613 (1,643) (1,054)Deferred income tax expense 69,062 2,709 1,509Provision for reduction in carrying value of certain assets — 12,490 —Expenses not requiring cash 1,362 5,103 19,331Change in assets and liabilities:
Accounts and notes receivable 60,391 103,995 (12,238)Rig materials and supplies (1,752) 2,722 (2,878)Other current assets 2,140 12,548 26,032Accounts payable and accrued liabilities (19,494) (27,425) 27,231Accrued income taxes (6,422) (7,957) (7,657)Other assets 3,897 (3,156) (47,543)
Net cash provided by (used in) operating activities 21,285 162,122 202,467
Cash flows from investing activities:Capital expenditures (28,954) (88,197) (179,513)Proceeds from the sale of assets 2,441 830 5,938Proceeds from insurance settlements — 2,500 —Acquisitions, net of cash acquired — (13,806) —Divestitures, net of cash paid — (2,570) —Net cash provided by (used in) investing activities (26,513) (101,243) (173,575)
Cash flows from financing activities:Proceeds from issuance of debt — — 400,000Repayments of long-term debt — (30,000) (435,000)Payments of debt issuance costs — (1,996) (7,630)Payment for noncontrolling interest (3,375) — —Payments of debt extinguishment costs — — (26,214)Payment of contingent consideration (6,000) (2,000) —Excess tax benefit (expense) from stock-based compensation — (1,045) (281)Net cash provided by (used in) financing activities (9,375) (35,041) (69,125)
Net increase (decrease) in cash and cash equivalents (14,603) 25,838 (40,233)Cash and cash equivalents at beginning of year 134,294 108,456 148,689Cash and cash equivalents at end of year $ 119,691 $ 134,294 $ 108,456
Supplemental cash flow information:Interest paid 41,175 41,393 41,820Income taxes paid 14,341 26,208 26,694
See accompanying notes to the consolidated financial statements.

49
PARKER DRILLING COMPANY AND SUBSIDIARIES
CONSOLIDATED STATEMENT OF STOCKHOLDERS’ EQUITY(Dollars and Shares in Thousands)
SharesCommon
StockTreasury
Stock
Capital inExcess ofPar Value
AccumulatedDeficit
AccumulatedOther
ComprehensiveIncome (Loss)
TotalControlling
Stockholders’Equity
NoncontrollingInterest
TotalStockholders’
Equity
Balances, December 31, 2013 120,491 $ 20,268 $ (193) $ 657,349 $ (47,616) $ 1,888 $ 631,696 $ 1,446 $ 633,142Activity in employees’ stock plans 1,555 227 23 924 — — 1,174 — 1,174Tax benefit increase from stock-based compensation — — — (281) — — (281) — (281)Amortization of stock-based awards — — — 9,273 — — 9,273 — 9,273Purchase of NCI of joint venture — — — (496) — — (496) (13) (509)Purchase of noncontrolling ownership interest — — — — — — — 1,919 1,919Distributions to noncontrolling interest — — — — — — — (242) (242)Comprehensive Income:
Net income — — — — 23,451 — 23,451 1,010 24,461Other comprehensive income (loss) — — — — — (2,386) (2,386) (337) (2,723)
Balances, December 31, 2014 122,046 $ 20,495 $ (170) $ 666,769 $ (24,165) $ (498) $ 662,431 $ 3,783 $ 666,214Activity in employees’ stock plans 1,160 193 — (1,227) — — (1,034) — (1,034)Tax benefit increase from stock-based compensation — — — (1,045) — — (1,045) — (1,045)Amortization of stock-based awards — — — 8,410 — — 8,410 — 8,410Disposal of noncontrolling interest related to sale of joint venture — — — — — — — (1,392) (1,392)Purchase of noncontrolling ownership interest — — — (3,787) — — (3,787) (2,963) (6,750)Comprehensive Income:
Net income — — — — (95,073) — (95,073) 789 (94,284)Other comprehensive income (loss) — — — — — (1,390) (1,390) (217) (1,607)
Balances, December 31, 2015 123,206 $ 20,688 $ (170) $ 669,120 $ (119,238) $ (1,888) $ 568,512 $ — $ 568,512Activity in employees’ stock plans 1,912 319 — (1,475) — — (1,156) — (1,156)Amortization of stock-based awards — — — 7,549 — — 7,549 — 7,549Comprehensive Income:
Net income (loss) — — — — (230,814) — (230,814) — (230,814)Other comprehensive income (loss) — — — — — (4,956) (4,956) — (4,956)
Balances, December 31, 2016 125,118 $ 21,007 $ (170) $ 675,194 $ (350,052) $ (6,844) $ 339,135 $ — $ 339,135
See accompanying notes to the consolidated financial statements.

50
NOTES TO THE CONSOLIDATED FINANCIAL STATEMENTS
Note 1 — Summary of Significant Accounting Policies
Nature of Operations — Our business is comprised of two business lines: (1) Drilling Services and (2) Rental Tools Services. We report our Drilling Services business as two reportable segments: (1) U.S. (Lower 48) Drilling and (2) International & Alaska Drilling. We report our Rental Tools Services business as two reportable segments: (1) U.S. Rental Tools and (2) International Rental Tools.
In our Drilling Services business, we drill oil and natural gas wells for customers in both the U.S. and international markets. We provide this service with both Company-owned rigs and customer-owned rigs. We refer to the provision of drilling services with customer-owned rigs as our operations and maintenance (O&M) service in which operators own their own drilling rigs but choose Parker Drilling to operate and maintain the rigs for them. The nature and scope of activities involved in drilling an oil and natural gas well is similar whether it is drilled with a Company-owned rig (as part of a traditional drilling contract) or a customer-owned rig (as part of an O&M contract). In addition, we provide project-related services, such as engineering, procurement, project management and commissioning of customer-owned drilling facility projects. We have extensive experience and expertise in drilling geologically difficult wells and in managing the logistical and technological challenges of operating in remote, harsh and ecologically sensitive areas.
Our U.S. (Lower 48) Drilling segment provides drilling services with our Gulf of Mexico (GOM) barge drilling rig fleet, and markets our U.S. (Lower 48) based O&M services. Our GOM barge drilling fleet operates barge rigs that drill for oil and natural gas in shallow waters in and along the inland waterways and coasts of Louisiana, Alabama and Texas. The majority of these wells are drilled in shallow water depths ranging from 6 to 12 feet. Our rigs are suitable for a variety of drilling programs, from inland coastal waters requiring shallow draft barges, to open water drilling on both state and federal water projects requiring more robust capabilities. The barge drilling industry in the GOM is characterized by cyclical activity where utilization and dayrates are typically driven by oil and natural gas prices and our customers’ access to project financing. Contract terms typically consist of well-to-well or multi-well programs, most commonly ranging from 20 to 120 days.
In our Rental Tools Services business, we provide premium rental equipment and services to exploration and production (E&P) companies, drilling contractors and service companies on land and offshore in the U.S. and select international markets. Tools we provide include standard and heavy-weight drill pipe, all of which are available with standard or high-torque connections, tubing, pressure control equipment, including blow-out preventers (BOPs), drill collars and more. We also provide well construction services, which include tubular running services and downhole tools, and well intervention services, which include whipstock, fishing and related services, as well as inspection and machine shop support. Rental tools are used during drilling programs and are requested by the customer when they are needed, requiring us to keep a broad inventory of rental tools in stock. Rental tools are usually rented on a daily or monthly basis.
We have operated in over 50 countries since beginning operations in 1934, making us among the most geographically experienced drilling contractors and rental tools providers in the world. We currently have operations in 20 countries. Parker has set numerous world records for deep and extended-reach drilling land rigs and is an industry leader in quality, health, safety and environmental practices.
Consolidation — The consolidated financial statements include the accounts of the Company and subsidiaries in which we exercise control or have a controlling financial interest, including entities, if any, in which the Company is allocated a majority of the entity’s losses or returns, regardless of ownership percentage. If a subsidiary of Parker Drilling has a 50 percent interest in an entity but Parker Drilling’s interest in the subsidiary or the entity does not meet the consolidation criteria described above, then that interest is accounted for under the equity method.
Noncontrolling Interest — We apply accounting standards related to noncontrolling interests for ownership interests in our subsidiaries held by parties other than Parker Drilling. We report noncontrolling interest as equity on the consolidated balance sheets and report net income (loss) attributable to controlling interest and to noncontrolling interest separately on the consolidated statements of operations. During the fourth quarter of 2015 we incurred a $4.8 million loss on the sale of our controlling interest in a consolidated joint venture in Egypt, which also resulted in the disposal of the related noncontrolling interest of $2.2 million. Also, during the second quarter of 2015 we incurred a $0.9 million loss on the divestiture of our controlling interest in a consolidated joint venture in Russia, which also resulted in the disposal of the related noncontrolling interest of $0.8 million. During the fourth quarter of 2015, we purchased the remaining noncontrolling interest of ITS Arabia Limited for $6.75 million, of which $3.4 millionwas paid in the fourth quarter of 2015 and the final payment was made during the second quarter of 2016. At the time of purchase, the carrying value of the noncontrolling interest was $3.0 million.
Reclassifications — Certain reclassifications have been made to prior period amounts to conform to the current period presentation. These reclassifications did not materially affect our consolidated financial results.
51
Revenue Recognition — Drilling revenues and expenses, comprised of daywork drilling contracts, call-outs against master service agreements and engineering and related project service contracts, are recognized as services are performed and collection is reasonably assured. For certain contracts, we receive payments contractually designated for the mobilization of rigs and other drilling equipment. Mobilization payments received, and direct costs incurred for the mobilization, are deferred and recognized over the primary term of the related drilling contract; however, costs incurred to relocate rigs and other drilling equipment to areas in which a contract has not been secured are expensed as incurred. For contracts that are terminated prior to the specified term, early termination payments received by us are recognized as revenues when all contractual requirements are met. Revenues from rental activities are recognized ratably over the rental term, which is generally less than six months. Our project-related services contracts include engineering, consulting, and project management scopes of work and revenue is typically recognized on a time and materials basis.
Reimbursable Revenues — The Company recognizes reimbursements received for out-of-pocket expenses incurred as revenues and accounts for out-of-pocket expenses as direct operating costs. Such amounts totaled $69.3 million, $87.8 million, and $82.6 million during the years ended December 31, 2016, 2015, and 2014, respectively. Additionally, the Company typically receives a nominal handling fee, which is recognized as earned in revenues in our consolidated statement of operations.
Use of Estimates — The preparation of financial statements in accordance with accounting policies generally accepted in the United States (U.S. GAAP) requires management to make estimates and assumptions that affect our reported amounts of assets and liabilities, our disclosure of contingent assets and liabilities at the date of the financial statements, and our revenues and expenses during the periods reported. Estimates are typically used when accounting for certain significant items such as legal or contractual liability accruals, mobilization and deferred mobilization, self-insured medical/dental plans, income taxes and valuation allowance, and other items requiring the use of estimates. Estimates are based on a number of variables which may include third party valuations, historical experience, where applicable, and assumptions that we believe are reasonable under the circumstances. Due to the inherent uncertainty involved with estimates, actual results may differ from management estimates.
Purchase Price Allocation — We allocate the purchase price of an acquired business to its identifiable assets and liabilities in accordance with the acquisition method based on estimated fair values at the transaction date. Transaction and integration costs associated with an acquisition are expensed as incurred. The excess of the purchase price over the amount allocated to the assets and liabilities, if any, is recorded as goodwill. We use all available information to estimate fair values, including quoted market prices, the carrying value of acquired assets, and widely accepted valuation techniques such as discounted cash flows. We typically engage third-party appraisal firms to assist in fair value determination of inventories, identifiable intangible assets, and any other significant assets or liabilities. Judgments made in determining the estimated fair value assigned to each class of assets acquired and liabilities assumed, as well as asset lives, can materially impact our results of operations. See Note 2 - Acquisitions for further discussion.
Goodwill — We perform our annual goodwill impairment review during the fourth quarter, as of October 1, and more frequently if negative conditions or other triggering events arise. The quantitative impairment test we perform for goodwill utilizes certain assumptions, including forecasted revenues and costs assumptions. See Note 3 - Goodwill and Intangible Assets for further discussion.
Intangible Assets — Our intangible assets are related to trade names, customer relationships, and developed technology, which were acquired through acquisition and are classified as definite lived intangibles, that are generally amortized over a weighted average period of approximately three to six years. We assess the recoverability of the unamortized balance of our intangible assets when indicators of impairment are present based on expected future profitability and undiscounted expected cash flows and their contribution to our overall operations. Should the review indicate that the carrying value is not fully recoverable, the excess of the carrying value over the fair value of the intangible assets would be recognized as an impairment loss. See Note 3 - Goodwill and Intangible Assets for further discussion.
Cash and Cash Equivalents — For purposes of the consolidated balance sheets and the consolidated statements of cash flows, the Company considers cash equivalents to be highly liquid debt instruments that have a remaining maturity of three months or less at the date of purchase.
Accounts Receivable and Allowance for Bad Debt — Trade accounts receivable are recorded at the invoice amount and typically do not bear interest. The allowance for bad debt is estimated for losses that may occur resulting from disputed amounts and the inability of our customers to pay amounts owed. We estimate the allowance based on historical write-off experience and information about specific customers. We review individually, for collectability, all balances over 90 days past due as well as balances due from any customer with respect to which we have information leading us to believe that a risk exists for potential collection.
Account balances are charged off against the allowance when we believe it is probable the receivable will not be recovered. We do not have any off-balance-sheet credit exposure related to customers.

52
The components of our accounts and notes receivable, net of allowance for bad debt balance are as follows:
December 31,Dollars in thousands 2016 2015
Trade $ 121,490 $ 183,299Notes receivable — 500Allowance for bad debt(1) (8,259) (8,694)
Total accounts and notes receivable, net of allowance for bad debt $ 113,231 $ 175,105
(1) Additional information on the allowance for bad debt for the years ended December 31, 2016, 2015 and 2014 is reported on Schedule II — Valuation and Qualifying Accounts.
Property, Plant and Equipment — Property, plant and equipment is carried at cost. Maintenance and most repair costs are expensed as incurred. The cost of upgrades and replacements is capitalized. The Company capitalizes software developed or obtained for internal use. Accordingly, the cost of third-party software, as well as the cost of third-party and internal personnel that are directly involved in application development activities, are capitalized during the application development phase of new software systems projects. Costs during the preliminary project stage and post-implementation stage of new software systems projects, including data conversion and training costs, are expensed as incurred. We account for depreciation of property, plant and equipment on the straight line method over the estimated useful lives of the assets after provision for salvage value. Depreciation, for tax purposes, utilizes several methods of accelerated depreciation. Depreciable lives for different categories of property, plant and equipment are as follows:
Land drilling equipment 3 to 20 yearsBarge drilling equipment 3 to 20 yearsDrill pipe, rental tools and other 4 to 15 yearsBuildings and improvements 5 to 30 years
Leasehold improvements are depreciated over the shorter of their estimated useful lives or the term of the lease.
Impairment — We evaluate the carrying amounts of long-lived assets for potential impairment when events occur or circumstances change that indicate the carrying values of such assets may not be recoverable. We evaluate recoverability by determining the undiscounted estimated future net cash flows for the respective asset groups identified. If the sum of the estimated undiscounted cash flows is less than the carrying value of the asset group, we measure the impairment as the amount by which the assets’ carrying value exceeds the fair value of such assets. Management considers a number of factors such as estimated future cash flows from the assets, appraisals and current market value analysis in determining fair value. Assets are written down to fair value if the final estimate of current fair value is below the net carrying value. The assumptions used in the impairment evaluation are inherently uncertain and require management judgment.
Capitalized Interest — Interest from external borrowings is capitalized on major projects until the assets are ready for their intended use. Capitalized interest is added to the cost of the underlying asset and is amortized over the useful lives of the assets in the same manner as the underlying assets. Capitalized interest costs reduce net interest expense in the consolidated statements of operations. During 2016, 2015 and 2014, capitalized interest costs were $0.2 million, $0.2 million and $1.2 million, respectively.
Assets Held for Sale — We classify an asset as held for sale when the facts and circumstances meet the criteria for such classification, including the following: (a) we have committed to a plan to sell the asset, (b) the asset is available for immediate sale, (c) we have initiated actions to complete the sale, including locating a buyer, (d) the sale is expected to be completed within one year, (e) the asset is being actively marketed at a price that is reasonable relative to its fair value, and (f) the plan to sell is unlikely to be subject to significant changes or termination.
Rig Materials and Supplies — Because our international drilling generally occurs in remote locations, making timely outside delivery of spare parts uncertain, a complement of parts and supplies is maintained either at the drilling site or in warehouses close to the operation. During periods of high rig utilization, these parts are generally consumed and replenished within a one-year period. During a period of lower rig utilization in a particular location, the parts, like the related idle rigs, are generally not transferred to other international locations until new contracts are obtained because of the significant transportation costs that would result from such transfers. We classify those parts which are not expected to be utilized in the following year as long-term assets. Additionally, our international rental tools business holds machine shop consumables and steel stock for manufacture in

53
our machine shops and inspection and repair shops, which are classified as current assets. Rig materials and supplies are valued at the lower of cost or market value.
Deferred Costs — We defer costs related to rig mobilization and amortize such costs over the primary term of the related contract. The costs to be amortized within twelve months are classified as current.
Debt Issuance Costs — We typically defer costs associated with issuance of indebtedness, and amortize those costs over the term of the related debt using the effective interest method.
Income Taxes — Income taxes are accounted for under the asset and liability method and have been provided for based upon tax laws and rates in effect in the countries in which operations are conducted and income or losses are generated. There is little or no expected relationship between the provision for or benefit from income taxes and income or loss before income taxes as the countries in which we operate have taxation regimes that vary not only with respect to nominal rate, but also in terms of the availability of deductions, credits, and other benefits. Deferred tax assets and liabilities are recognized for the future tax consequences attributable to differences between the financial statement carrying amounts of existing assets and liabilities and their respective tax bases and operating loss and tax credit carryforwards. Deferred tax assets and liabilities are measured using enacted tax rates in effect for the year in which the temporary differences are expected to be recovered or settled and the effect of changes in tax rates is recognized in income in the period in which the change is enacted. Valuation allowances are established to reduce deferred tax assets when it is more likely than not that some portion or all of the deferred tax assets will not be realized. In order to determine the amount of deferred tax assets or liabilities, as well as the valuation allowances, we must make estimates and assumptions regarding future taxable income, where rigs will be deployed and other matters. Changes in these estimates and assumptions, including changes in tax laws and other changes impacting our ability to recognize the underlying deferred tax assets, could require us to adjust the valuation allowances.
The Company recognizes the effect of income tax positions only if those positions are more likely than not to be sustained. Recognized income tax positions are measured at the largest amount that is greater than 50 percent likely of being realized and changes in recognition or measurement are reflected in the period in which the change in judgment occurs.
Earnings (Loss) Per Share (EPS) — Basic earnings (loss) per share is computed by dividing net income by the weighted average number of common shares outstanding during the period. The effects of dilutive securities, stock options, unvested restricted stock and convertible debt are included in the diluted EPS calculation, when applicable.
Concentrations of Credit Risk — Financial instruments that potentially subject the Company to concentrations of credit risk consist primarily of trade receivables with a variety of national and international oil and natural gas companies. We generally do not require collateral on our trade receivables. We depend on a limited number of significant customers. In 2016, our largest customer, Exxon Neftegas Limited (ENL), constituted approximately 38.7 percent of our consolidated revenues. Excluding reimbursable revenues of $67.0 million, ENL constituted approximately 27.5 percent of our total consolidated revenues. In 2016, our second largest customer, BP Exploration Alaska, Inc. (BP), constituted approximately 12.0 percent of our consolidated revenues.
At December 31, 2016 and 2015, we had deposits in domestic banks in excess of federally insured limits of approximately $81.4 million and $91.3 million, respectively. In addition, we had uninsured deposits in foreign banks at December 31, 2016 and 2015 of $39.7 million and $44.1 million, respectively.
Fair Value Measurements — For purposes of recording fair value adjustments for certain financial and non-financial assets and liabilities, and determining fair value disclosures, we estimate fair value at a price that would be received to sell an asset or paid to transfer a liability in an orderly transaction between market participants in the principal market for the asset or liability. Our valuation technique requires inputs that we categorize using a three-level hierarchy, from highest to lowest level of observable inputs, as follows: (1) unadjusted quoted prices for identical assets or liabilities in active markets (Level 1), (2) direct or indirect observable inputs, including quoted prices or other market data, for similar assets or liabilities in active markets or identical assets or liabilities in less active markets (Level 2) and (3) unobservable inputs that require significant judgment for which there is little or no market data (Level 3). When multiple input levels are required for a valuation, we categorize the entire fair value measurement according to the lowest level of input that is significant to the measurement even though we may have also utilized significant inputs that are more readily observable.
Foreign Currency — In our international rental tool business, for certain subsidiaries and branches outside the U.S., the local currency is the functional currency. The financial statements of these subsidiaries and branches are translated into U.S. dollars as follows: (i) assets and liabilities at month-end exchange rates; (ii) income, expenses and cash flows at monthly average exchange rates or exchange rates in effect on the date of the transaction; and (iii) stockholders’ equity at historical exchange rates. For those subsidiaries where the local currency is the functional currency, the resulting translation adjustment is recorded as a component of accumulated other elements of comprehensive income (loss) in the accompanying consolidated balance sheets.

54
Stock-Based Compensation — Under our long term incentive plan, we are authorized to issue the following: stock options; stock appreciation rights; restricted stock awards; restricted stock units; performance-based awards; and other types of awards in cash or stock to key employees, consultants, and directors. We typically grant restricted stock units (RSUs), performance stock units (PSUs), performance cash units (PCUs), performance-based phantom stock units and time-based phantom stock units.
Stock-based compensation expense is recognized, net of an estimated forfeiture rate, which is based on historical experience and adjusted, if necessary, in subsequent periods based on actual forfeitures. We recognize stock-based compensation expense in the same financial statement line item as cash compensation paid to the respective employees. Tax deduction benefits for awards in excess of recognized compensation costs are reported as a financing cash flow.
Legal and Investigation Matters — We accrue estimates of the probable and estimable costs for the resolution of certain legal and investigation matters. We do not accrue any amounts for other matters for which the liability is not probable and reasonably estimable. Generally, the estimate of probable costs related to these matters is developed in consultation with our legal advisors. The estimates take into consideration factors such as the complexity of the issues, litigation risks and settlement costs. If the actual settlement costs, final judgments, or fines, after appeals, differ from our estimates, our future financial results may be adversely affected.
Note 2 — Acquisitions
Acquisition of 2M-Tek
On April 17, 2015 we acquired 2M-Tek, a Louisiana-based manufacturer of equipment for tubular running and related well services (the 2M-Tek Acquisition) for an initial purchase price of $10.4 million paid at the closing of the acquisition, plus $8.0 million of contingent consideration payable to the seller upon the achievement of certain milestones over the 24-month period following the closing of the 2M-Tek Acquisition. The fair value of the consideration transferred was $17.2 million, which includes the $10.4 million paid at closing plus the estimated fair value of the contingent consideration of $6.8 million. We paid $2.0 millionof the contingent consideration upon the achievement of certain milestones during the fourth quarter of 2015 and $2.0 million during the first quarter of 2016. The remaining $4.0 million of the contingent consideration was paid in April 2016.
Note 3 - Goodwill and Intangible Assets
We account for business combinations using the acquisition method of accounting. Under this method, assets and liabilities, including any remaining noncontrolling interests, are recognized at fair value at the date of acquisition. The excess of the purchase price over the fair value of assets acquired, net of liabilities assumed, plus the value of any noncontrolling interests, is recognized as goodwill. We perform our annual goodwill impairment review during the fourth quarter, as of October 1, and more frequently if negative conditions or other triggering events arise. As a result of our 2016 analysis, we determined that the fair value of the reporting unit exceeded its carrying value and therefore, no goodwill impairment was identified. Should current market conditions worsen or persist for an extended period of time, an impairment of the carrying value of our goodwill could occur.
As part of the 2M-Tek Acquisition we recognized $6.7 million of goodwill and acquired definite-lived intangible assets with an acquisition date fair value of $13.5 million. All of the Company's goodwill and intangible assets are allocated to the International Rental Tools segment.
Goodwill
The change in the carrying amount of goodwill for the year ended December 31, 2016 is as follows:
Dollars in thousands Goodwill
Balance at December 31, 2015 $ 6,708Additions —
Balance at December 31, 2016 $ 6,708
Of the total amount of goodwill recognized, zero is expected to be deductible for income tax purposes.
Intangible Assets

55
Intangible Assets consist of the following:
Balance at December 31, 2016
Dollars in thousands
EstimatedUseful Life
(Years)
GrossCarryingAmount
Write-off Due to Sale (1)
AccumulatedAmortization
Net CarryingAmount
Amortized intangible assets:Developed Technology 6 $ 11,630 $ — $ (3,393) $ 8,237Customer Relationships 3 5,400 (264) (5,136) —Trade Names 5 4,940 (332) (2,917) 1,691
Total Amortized intangible assets $ 21,970 $ (596) $ (11,446) $ 9,928
(1) During the 2015 fourth quarter, we sold our controlling interest in a joint venture in Egypt resulting in the write-off of $0.6 million of intangible assets related to customer relationships and trade name.
Amortization expense was $3.5 million, $4.3 million, and $2.6 million for the year ended December 31, 2016, 2015, and 2014 respectively.
Our remaining intangibles amortization expense for the next five years is presented below:
Dollars in thousandsExpected future intangible
amortization expense
2017 $ 2,8012018 $ 2,3062019 $ 2,3062020 $ 2,0302021 $ 485Beyond 2021 $ —
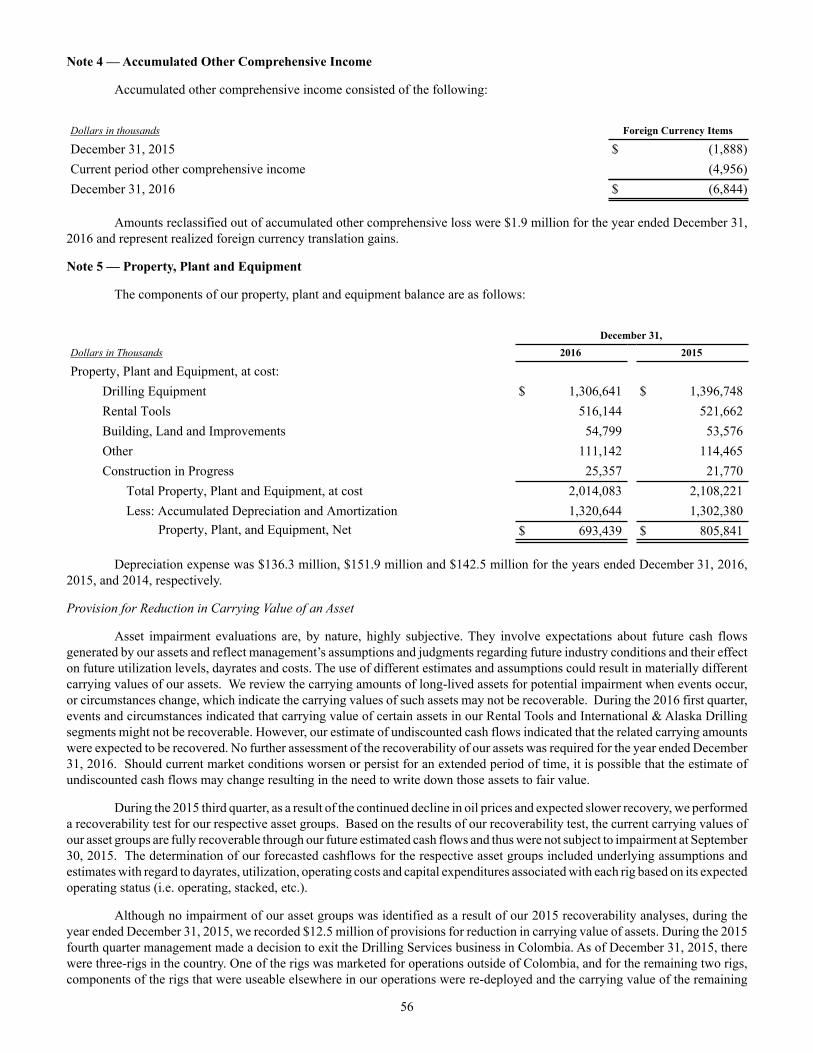
56
Note 4 — Accumulated Other Comprehensive Income
Accumulated other comprehensive income consisted of the following:
Dollars in thousands Foreign Currency Items
December 31, 2015 $ (1,888)Current period other comprehensive income (4,956)December 31, 2016 $ (6,844)
Amounts reclassified out of accumulated other comprehensive loss were $1.9 million for the year ended December 31, 2016 and represent realized foreign currency translation gains.
Note 5 — Property, Plant and Equipment
The components of our property, plant and equipment balance are as follows:
December 31,Dollars in Thousands 2016 2015
Property, Plant and Equipment, at cost:Drilling Equipment $ 1,306,641 $ 1,396,748Rental Tools 516,144 521,662Building, Land and Improvements 54,799 53,576Other 111,142 114,465Construction in Progress 25,357 21,770
Total Property, Plant and Equipment, at cost 2,014,083 2,108,221Less: Accumulated Depreciation and Amortization 1,320,644 1,302,380
Property, Plant, and Equipment, Net $ 693,439 $ 805,841
Depreciation expense was $136.3 million, $151.9 million and $142.5 million for the years ended December 31, 2016, 2015, and 2014, respectively.
Provision for Reduction in Carrying Value of an Asset
Asset impairment evaluations are, by nature, highly subjective. They involve expectations about future cash flows generated by our assets and reflect management’s assumptions and judgments regarding future industry conditions and their effect on future utilization levels, dayrates and costs. The use of different estimates and assumptions could result in materially different carrying values of our assets. We review the carrying amounts of long-lived assets for potential impairment when events occur, or circumstances change, which indicate the carrying values of such assets may not be recoverable. During the 2016 first quarter, events and circumstances indicated that carrying value of certain assets in our Rental Tools and International & Alaska Drilling segments might not be recoverable. However, our estimate of undiscounted cash flows indicated that the related carrying amounts were expected to be recovered. No further assessment of the recoverability of our assets was required for the year ended December 31, 2016. Should current market conditions worsen or persist for an extended period of time, it is possible that the estimate of undiscounted cash flows may change resulting in the need to write down those assets to fair value.
During the 2015 third quarter, as a result of the continued decline in oil prices and expected slower recovery, we performed a recoverability test for our respective asset groups. Based on the results of our recoverability test, the current carrying values of our asset groups are fully recoverable through our future estimated cash flows and thus were not subject to impairment at September 30, 2015. The determination of our forecasted cashflows for the respective asset groups included underlying assumptions and estimates with regard to dayrates, utilization, operating costs and capital expenditures associated with each rig based on its expected operating status (i.e. operating, stacked, etc.).
Although no impairment of our asset groups was identified as a result of our 2015 recoverability analyses, during the year ended December 31, 2015, we recorded $12.5 million of provisions for reduction in carrying value of assets. During the 2015 fourth quarter management made a decision to exit the Drilling Services business in Colombia. As of December 31, 2015, there were three-rigs in the country. One of the rigs was marketed for operations outside of Colombia, and for the remaining two rigs, components of the rigs that were useable elsewhere in our operations were re-deployed and the carrying value of the remaining

57
components was written-off, resulting in a provision for reduction in carrying value of $4.8 million. In addition, during the 2015 fourth quarter, to adjust to the lower level of current and expected drilling activity, we performed a review of certain individual assets within our asset groups and recorded a $4.3 million provision for reduction in carrying value of assets primarily related to drilling equipment in our International & Alaska Drilling segment. During the 2015 second and third quarters, the Company wrote-off a combined $3.2 million related to certain international rental tools and drilling rigs that management concluded were no longer marketable and the carrying value of the rigs and equipment was no longer recoverable.
Disposition of Assets
During the normal course of operations, we periodically sell equipment deemed to be excess, obsolete, or not currently required for operations. Net losses recorded on asset disposition for the year ended December 31, 2016 were $1.6 million. Net gains recorded on assets dispositions for the year ended December 31, 2015 were $1.6 million. Activity in both periods included the results of asset sales; however, the net gains for 2015 were primarily the result of a gain from an insurance settlement received during the first quarter of 2015 related to previously realized asset losses. This gain was partially offset by losses incurred during the 2015 fourth quarter related to equipment retirements.
Note 6 — Income Taxes
Income (loss) before income taxes is summarized below:
Year Ended December 31,Dollars in thousands 2016 2015 2014
United States $ (131,106) $ (77,368) $ 37,547Foreign (25,538) 5,397 10,990
$ (156,644) $ (71,971) $ 48,537
Income tax expense (benefit) is summarized as follows:
Year Ended December 31,Dollars in thousands 2016 2015 2014
Current:United States:
Federal $ (1,921) $ 2,485 $ (3,079)State (9) 365 5,335
Foreign 7,038 16,754 20,311
Deferred:United States:
Federal 64,066 (141) 4,703State (47) (4,769) (379)
Foreign 5,043 7,619 (2,815)$ 74,170 $ 22,313 $ 24,076

58
Total income tax expense differs from the amount computed by multiplying income before income taxes by the U.S. federal income tax statutory rate. The reasons for this difference are as follows:
Year Ended December 31,2016 2015 2014
Dollars in thousands Amount% of Pre-Tax
Income Amount% of Pre-Tax
Income Amount% of Pre-Tax
Income
Computed Expected Tax Expense(Benefit) $ (54,825) 35.0 % $ (25,190) 35.0 % $ 16,988 35.0 %Foreign Taxes 12,688 (8.1)% 16,043 (22.3)% 11,221 23.1 %Tax Effect Different From StatutoryRates (3,629) 2.3 % (2,729) 3.8 % (3,389) (7.0)%State Taxes, net of federal benefit (849) 0.5 % (4,544) 6.3 % 3,117 6.4 %Foreign Tax Credits 20 — % (5,566) 7.7 % (3,043) (6.3)%Change in Valuation Allowance 117,707 (75.1)% 40,676 (56.5)% 2,800 5.8 %Uncertain Tax Positions (726) 0.5 % (81) 0.1 % (1,125) (2.3)%Permanent Differences 1,442 (0.9)% 1,696 (2.4)% 676 1.4 %Prior Year Return to ProvisionAdjustments 2,078 (1.3)% 1,555 (2.1)% (2,618) (5.4)%Other 264 (0.2)% 453 (0.6)% (551) (1.1)%Actual Tax Expense $ 74,170 (47.3)% $ 22,313 (31.0)% $ 24,076 49.6 %
The components of the Company’s deferred tax assets and liabilities as of December 31, 2016 and 2015 are shown below:
December 31,Dollars in thousands 2016 2015
Deferred tax assetsDeferred tax assets:
Federal net operating loss carryforwards 120,986 63,607State net operating loss carryforwards 7,168 5,839Other state deferred tax asset, net 2,646 3,170Foreign Tax Credits 46,859 45,751FIN 48 883 1,789Foreign tax 29,791 27,861Asset Impairment 27,165 33,723Accruals not currently deductible for tax purposes 1,657 4,315Deferred compensation 3,424 3,487Other 863 845
Gross long-term deferred tax assets 241,442 190,387Valuation Allowance (171,133) (51,105)Net deferred tax assets, net of valuation allowance 70,309 139,282
Deferred tax liabilities:Deferred tax liabilities:
Property, Plant and equipment (64,256) (59,879)Foreign tax local 490 (3,169)Other state deferred tax liability, net (5,567) (5,606)
Gross deferred tax liabilities (69,333) (68,654)Net deferred tax asset $ 976 $ 70,628
As part of the process of preparing the consolidated financial statements, the Company is required to determine its provision for income taxes. This process involves estimating the annual effective tax rate and the nature and measurements of temporary and permanent differences resulting from differing treatment of items for tax and accounting purposes. These differences

59
and the operating loss and tax credit carryforwards result in deferred tax assets and liabilities. In assessing the realizability of deferred tax assets, management considers whether it is more likely than not that all or a portion of the deferred tax assets will not be realized. The ultimate realization of deferred tax assets is dependent upon the generation of future taxable income of appropriate character in each taxing jurisdiction during the periods in which those temporary differences become deductible. Management considers the weight of available evidence, both positive and negative, including the scheduled reversal of deferred tax liabilities (including the impact of available carryback and carryforward periods), projected future taxable income, and tax planning strategies in making this assessment. To the extent the Company believes that it does not meet the test that recovery is more likely than not, it establishes a valuation allowance. To the extent that the Company establishes a valuation allowance or changes this allowance in a period, it adjusts the tax provision or tax benefit in the consolidated statement of operations. We use our judgment in determining provisions or benefits for income taxes, and any valuation allowance recorded against previously established deferred tax assets. We have measured the value of our deferred tax assets for the year ended December 31, 2016 based on the cumulative weight of positive and negative evidence that exists as of the date of the financial statements. Should the cumulative weight of all available positive and negative evidence change in the forecast period, the expectation of realization of deferred tax assets existing as of December 31, 2016 and prospectively may change.
The 2016 results include an increase in our valuation allowance of $117.7 million primarily related to U.S. and certain foreign net operating losses and other deferred tax assets. We established the valuation allowance based on the weight of available evidence, both positive and negative, including results of recent and current operations and our estimates of future taxable income or loss by jurisdiction in which we operate. In order to determine the amount of deferred tax assets or liabilities, as well as the valuation allowances, we must make estimates and assumptions regarding future taxable income, where rigs will be deployed and other business considerations. Changes in these estimates and assumptions, including changes in tax laws and other changes impacting our ability to recognize the underlying deferred tax assets, could require us to adjust the valuation allowances.
The 2015 results include income tax benefits of $24.7 million for depreciation and amortization relating to our two arctic-class drilling rigs in Alaska. In addition, we increased our valuation allowance by $40.6 million primarily due to U.S. foreign tax credits and certain foreign net operating losses.
A reconciliation of the beginning and ending amount of unrecognized tax benefits is as follows:
Dollars in thousands
Balance at January 1, 2016 $ (7,837)Additions based on tax positions taken during a prior period (992)Reductions related to settlement of tax matters 2,740Reductions based on tax positions taken during a prior period 1,461
Balance at December 31, 2016 $ (4,628)
In many cases, our uncertain tax positions are related to tax years that remain subject to examination by tax authorities. The following describes the open tax years, by major tax jurisdiction, as of December 31, 2016:
Kazakhstan 2007-presentMexico 2011-presentRussia 2013-presentUnited States — Federal 2009-presentUnited Kingdom 2013-present
At December 31, 2016, we had a liability for unrecognized tax benefits of $4.6 million (all of which, if recognized, would favorably impact our effective tax rate), on which no payments were made during 2016.
The Company recognized interest and penalties related to uncertain tax positions in income tax expense. As of December 31, 2016 and December 31, 2015 we had approximately $1.9 million and $3.4 million of accrued interest and penalties related to uncertain tax positions, respectively. We recognized a decrease of $0.8 million of interest and $0.7 million penalties on unrecognized tax benefits for the year ended December 31, 2016.
As of December 31, 2016, the Company has permanently reinvested accumulated undistributed earnings of foreign subsidiaries and, therefore, has not recorded a deferred tax liability related to subject earnings. Upon distribution of additional earnings in the form of dividends or otherwise, we could be subject to U.S. income taxes and foreign withholding taxes. It is not practicable to determine precisely the amount of taxes that may be payable on the eventual remittance of these earnings due to

60
many factors, including application of foreign tax credits, levels of accumulated earnings and profits at the time of remittance, and the sources of earnings remitted.
Note 7 — Long-Term Debt
The following table illustrates the Company’s current debt portfolio as of December 31, 2016 and December 31, 2015:
December 31,Dollars in thousands 2016 2015
6.75% Senior Notes, due July 2022 $ 360,000 $ 360,0007.50% Senior Notes, due August 2020 225,000 225,000Total principal 585,000 585,000Less: unamortized debt issuance costs (8,674) (10,202)Total long-term debt $ 576,326 $ 574,798
6.75% Senior Notes, due July 2022
On January 22, 2014, we issued $360.0 million aggregate principal amount of 6.75% Senior Notes, due July 2022 (6.75% Notes) pursuant to an Indenture between the Company and The Bank of New York Mellon Trust Company, N.A., as trustee. Net proceeds from the 6.75% Notes offering plus a $40.0 million term loan draw under the Amended and Restated Senior Secured Credit Agreement (2012 Secured Credit Agreement) and cash on hand were utilized to purchase $416.2 million aggregate principal amount of our outstanding 9.125% Senior Notes due 2018 pursuant to a tender and consent solicitation offer commenced on January 7, 2014.
The 6.75% Notes are general unsecured obligations of the Company and rank equal in right of payment with all of our existing and future senior unsecured indebtedness. The 6.75% Notes are jointly and severally guaranteed by all of our subsidiaries that guarantee indebtedness under the Second Amended and Restated Senior Secured Credit Agreement, as amended from time-to-time (2015 Secured Credit Agreement) and our 7.50% Senior Notes due 2020 (7.50% Notes, and collectively with the 6.75% Notes, the Senior Notes). Interest on the 6.75% Notes is payable on January 15 and July 15 of each year, beginning July 15, 2014. Debt issuance costs related to the 6.75% Notes of approximately $7.6 million ($5.5 million net of amortization as of December 31, 2016) are being amortized over the term of the notes using the effective interest rate method.
At any time prior to January 15, 2017, we were able to redeem up to 35 percent of the aggregate principal amount of the 6.75% Notes at a redemption price of 106.75 percent of the principal amount, plus accrued and unpaid interest to the redemption date, with the net cash proceeds of certain equity offerings by us. We have not made any redemptions to date. On and after January 15, 2018, we may redeem all or a part of the 6.75% Notes upon appropriate notice, at a redemption price of 103.375 percent of the principal amount, and at redemption prices decreasing each year thereafter to par beginning January 15, 2020. If we experience certain changes in control, we must offer to repurchase the 6.75% Notes at 101.0 percent of the aggregate principal amount, plus accrued and unpaid interest and additional interest, if any, to the date of repurchase.
The Indenture limits our ability and the ability of certain subsidiaries to: (i) sell assets, (ii) pay dividends or make other distributions on capital stock or redeem or repurchase capital stock or subordinated indebtedness, (iii) make investments, (iv) incur or guarantee additional indebtedness, (v) create or incur liens, (vi) enter into sale and leaseback transactions, (vii) incur dividend or other payment restrictions affecting subsidiaries, (viii) merge or consolidate with other entities, (ix) enter into transactions with affiliates, and (x) engage in certain business activities. Additionally, the Indenture contains certain restrictive covenants designating certain events as Events of Default. These covenants are subject to a number of important exceptions and qualifications.
7.50% Senior Notes, due August 2020
On July 30, 2013, we issued $225.0 million aggregate principal amount of the 7.50% Notes pursuant to an Indenture between the Company and The Bank of New York Mellon Trust Company, N.A., as trustee. Net proceeds from the 7.50% Notes offering were primarily used to repay the $125.0 million aggregate principal amount of a term loan used to initially finance the ITS Acquisition, to repay $45.0 million of term loan borrowings under the 2012 Secured Credit Agreement, and for general corporate purposes.
The 7.50% Notes are general unsecured obligations of the Company and rank equal in right of payment with all of our existing and future senior unsecured indebtedness. The 7.50% Notes are jointly and severally guaranteed by all of our subsidiaries that guarantee indebtedness under the 2015 Secured Credit Agreement and the 6.75% Notes. Interest on the 7.50% Notes is payable on February 1 and August 1 of each year, beginning February 1, 2014. Debt issuance costs related to the 7.50% Notes of

61
approximately $5.6 million ($3.2 million, net of amortization as of December 31, 2016) are being amortized over the term of the notes using the effective interest rate method.
We may redeem all or a part of the 7.50% Notes upon appropriate notice, at redemption prices decreasing each year after August 1, 2016 to par beginning August 1, 2018. We have not made any redemptions to date. If we experience certain changes in control, we must offer to repurchase the 7.50% Notes at 101.0 percent of the aggregate principal amount, plus accrued and unpaid interest and additional interest, if any, to the date of repurchase.
The Indenture limits our ability and the ability of certain subsidiaries to: (i) sell assets, (ii) pay dividends or make other distributions on capital stock or redeem or repurchase capital stock or subordinated indebtedness, (iii) make investments, (iv) incur or guarantee additional indebtedness, (v) create or incur liens, (vi) enter into sale and leaseback transactions, (vii) incur dividend or other payment restrictions affecting subsidiaries, (viii) merge or consolidate with other entities, (ix) enter into transactions with affiliates, and (x) engage in certain business activities. Additionally, the Indenture contains certain restrictive covenants designating certain events as Events of Default. These covenants are subject to a number of important exceptions and qualifications.
2015 Secured Credit Agreement
On January 26, 2015 we entered into the 2015 Secured Credit Agreement, which amended and restated the 2012 Secured Credit Agreement. The 2015 Secured Credit Agreement was originally comprised of a $200 million revolving credit facility (Revolver) set to mature on January 26, 2020. On June 1, 2015, we executed the first amendment to the 2015 Secured Credit Agreement in order to amend certain provisions regarding the definition of “Change of Control.” On September 29, 2015, we executed the second amendment to the 2015 Secured Credit Agreement to, among other things, (a) amend certain covenant ratios; (b) increase the Applicable Rate for certain higher levels of consolidated leverage to a maximum of 4.00 percent per annum for Eurodollar Rate loans and to 3.00 percent per annum for Base Rate loans; (c) permit multi-year letters of credit up to an aggregate amount of $5.0 million; (d) limit payment prior to September 30, 2017 of certain restricted payments and certain prepayments of unsecured senior notes and other specified forms of indebtedness; and (e) remove the option of the Company, subject to the consent of the lenders, to increase the Credit Agreement up to an additional $75 million. On May 27, 2016, we executed the third amendment to the 2015 Secured Credit Agreement (the Third Amendment), which reduced availability under the Revolver from $200 millionto $100 million. Additionally, among other things, the Third Amendment: (a) eliminated the Leverage Ratio covenant until the fourth quarter of 2018 when the covenant is reinstated with the ratio established at 4.25:1.00; (b) eliminated the Consolidated Interest Coverage Ratio covenant until the fourth quarter of 2017 when the covenant is reinstated with the ratio established at 1.00:1.00 and increases by 0.25 each subsequent quarter until reaching 2.00:1.00 in the fourth quarter of 2018, and remains at 2.00:1.00 thereafter; (c) immediately increased the maximum permitted Senior Secured Leverage Ratio from 1.50:1.00 to 2.80:1.00 until it decreases to 2.20:1.00 in the second quarter of 2017, to 1.75:1.00 in the third quarter of 2017, and to 1.50:1.00 in the fourth quarter of 2017 and remains at 1.50:1.00 thereafter; (d) immediately decreased the minimum permitted Asset Coverage Ratio from 1.25:1.00 to 1.10:1.00 until it increases to 1.25: 1.00 in the fourth quarter of 2017 and remains at 1.25:1.00 thereafter; (e) requires that, at any time our Consolidated Cash Balance in U.S. bank accounts is over $50 million, we repay borrowings under the 2015 Secured Credit Agreement until our Consolidated Cash balance is no more than $50 million or all borrowings have been repaid, and (f) allows up to $75 million of Junior Lien Debt.
At the time the Third Amendment was executed, the remaining debt issuance costs for the 2015 Secured Credit Agreement totaled approximately $2.2 million. Since the Revolver was reduced by 50 percent, we wrote off approximately $1.1 million of debt issuance costs in May 2016. We incurred debt issuance costs relating to the Third Amendment of approximately $0.3 million, bringing total debt issuance costs of $1.4 million ($1.2 million, net of amortization as of December 31, 2016) which are being amortized through January 2020, or the term of the Third Amendment, on a straight line basis.
Our obligations under the 2015 Secured Credit Agreement are guaranteed by substantially all of our direct and indirect domestic subsidiaries, other than immaterial subsidiaries and subsidiaries generating revenues primarily outside the United States, each of which has executed guaranty agreements, and are secured by first priority liens on our accounts receivable, specified rigs including barge rigs in the GOM and land rigs in Alaska, certain U.S.-based rental equipment of the Company and its subsidiary guarantors and the equity interests of certain of the Company’s subsidiaries. The 2015 Secured Credit Agreement contains customary affirmative and negative covenants, such as limitations on indebtedness, liens, restrictions on entry into certain affiliate transactions and payments (including payment of dividends) and maintenance of certain ratios and coverage tests. We were in compliance with all covenants contained in the 2015 Secured Credit Agreement as of December 31, 2016.
Our Revolver is available for general corporate purposes and to support letters of credit. Interest on Revolver loans accrues at a Base Rate plus an Applicable Rate or LIBOR plus an Applicable Rate. Revolving loans are available subject to a quarterly asset coverage ratio calculation based on the Orderly Liquidation Value of certain specified rigs including barge rigs in the GOM and land rigs in Alaska, and certain U.S.-based rental equipment of the Company and its subsidiary guarantors and a percentage of eligible domestic accounts receivable. The $30.0 million draw outstanding at the closing of the 2015 Secured Credit Agreement

62
was repaid in full during the first quarter of 2015 with cash on hand. Letters of credit outstanding against the Revolver as of December 31, 2016 totaled $9.8 million. There were no amounts drawn on the Revolver as of December 31, 2016.
Note 8 — Fair Value of Financial Instruments
Certain of our assets and liabilities are required to be measured at fair value on a recurring basis. For purposes of recording fair value adjustments for certain financial and non-financial assets and liabilities, and determining fair value disclosures, we estimate fair value at a price that would be received to sell an asset or paid to transfer a liability in an orderly transaction between market participants in the principal market for the asset or liability.
The fair value measurement and disclosure requirements of Financial Accounting Standards Board (FASB) Accounting Standards Codification (ASC) Topic No. 820, Fair Value Measurement and Disclosures requires inputs that we categorize using a three-level hierarchy, from highest to lowest level of observable inputs, as follows:
• Level 1 — Unadjusted quoted prices for identical assets or liabilities in active markets;
• Level 2 — Direct or indirect observable inputs, including quoted prices or other market data, for similar assets or liabilities in active markets or identical assets or liabilities in less active markets; and
• Level 3 — Unobservable inputs that require significant judgment for which there is little or no market data.
When multiple input levels are required for a valuation, we categorize the entire fair value measurement according to the lowest level of input that is significant to the entire measurement even though we may also have utilized significant inputs that are more readily observable. The amounts reported in our consolidated balance sheets for cash and cash equivalents, accounts receivable, and accounts payable approximate fair value.
Fair value of our debt instruments is determined using Level 2 inputs. Fair values and related carrying values of our debt instruments were as follows for the periods indicated:
December 31, 2016 December 31, 2015Dollars in thousands Carrying Amount Fair Value Carrying Amount Fair Value
Long-term Debt6.75% Notes $ 360,000 $ 311,400 $ 360,000 $ 246,6007.50% Notes 225,000 201,375 225,000 171,000
Total $ 585,000 $ 512,775 $ 585,000 $ 417,600
The assets acquired and liabilities assumed in the 2M-Tek Acquisition were recorded at fair value in accordance with U.S. GAAP. Acquisition date fair values represent either Level 2 fair value measurements (current assets and liabilities, property, plant and equipment) or Level 3 fair value measurements (intangible assets).
Market conditions could cause an instrument to be reclassified from Level 1 to Level 2, or Level 2 to Level 3. There were no transfers between levels of the fair value hierarchy or any changes in the valuation techniques used during the year ended December 31, 2016.
Note 9 — Stock-Based Compensation
Stock Plan
Stock-based compensation awards were granted to employees under the Company's 2010 Long-Term Incentive Plan, as Amended and Restated as of May 10, 2016 (the Stock Plan). The Stock Plan was approved by the stockholders at the Annual Meeting of Stockholders on May 10, 2016. The Stock Plan authorizes the compensation committee or the board of directors to issue stock options, stock appreciation rights, restricted stock awards, restricted stock units, performance-based awards, time-based awards, and other types of awards in cash or stock to key employees, consultants, and directors. The maximum number of shares that may be delivered pursuant to the awards granted under the Stock Plan is 16,800,000 shares of common stock. As of December 31, 2016 there were 5,151,073 shares remaining available under the Stock Plan.
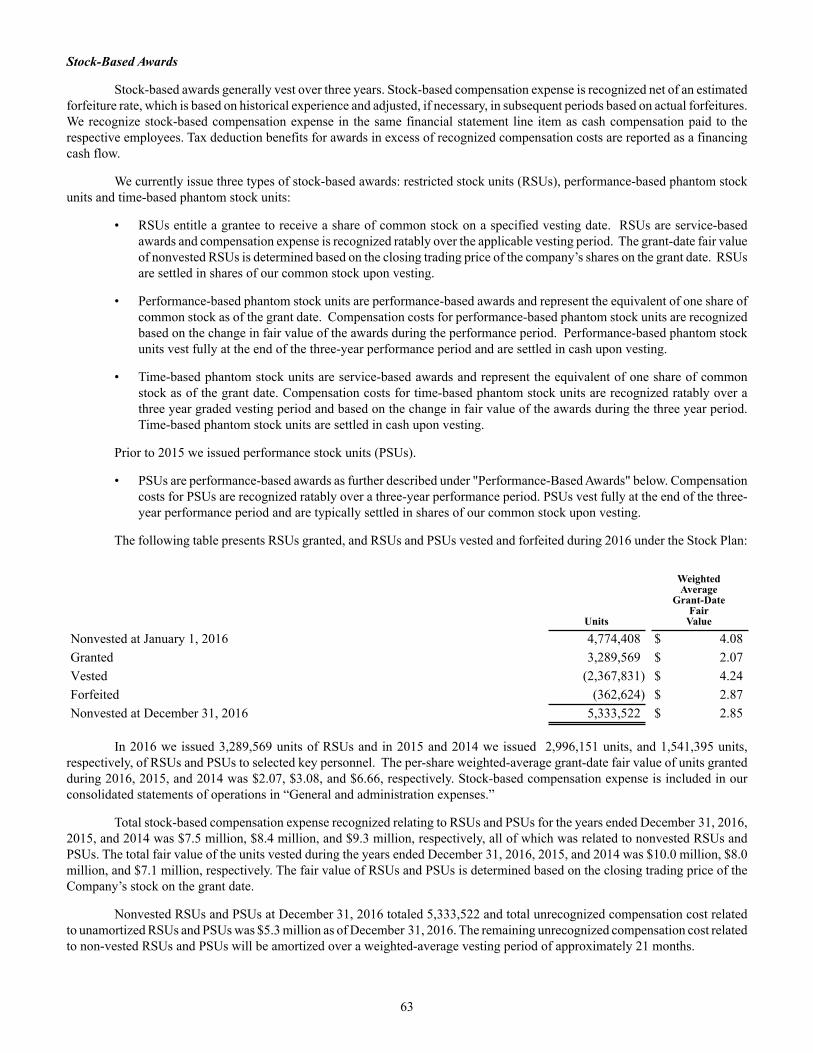
63
Stock-Based Awards
Stock-based awards generally vest over three years. Stock-based compensation expense is recognized net of an estimated forfeiture rate, which is based on historical experience and adjusted, if necessary, in subsequent periods based on actual forfeitures. We recognize stock-based compensation expense in the same financial statement line item as cash compensation paid to the respective employees. Tax deduction benefits for awards in excess of recognized compensation costs are reported as a financing cash flow.
We currently issue three types of stock-based awards: restricted stock units (RSUs), performance-based phantom stock units and time-based phantom stock units:
• RSUs entitle a grantee to receive a share of common stock on a specified vesting date. RSUs are service-based awards and compensation expense is recognized ratably over the applicable vesting period. The grant-date fair value of nonvested RSUs is determined based on the closing trading price of the company’s shares on the grant date. RSUs are settled in shares of our common stock upon vesting.
• Performance-based phantom stock units are performance-based awards and represent the equivalent of one share of common stock as of the grant date. Compensation costs for performance-based phantom stock units are recognized based on the change in fair value of the awards during the performance period. Performance-based phantom stock units vest fully at the end of the three-year performance period and are settled in cash upon vesting.
• Time-based phantom stock units are service-based awards and represent the equivalent of one share of common stock as of the grant date. Compensation costs for time-based phantom stock units are recognized ratably over a three year graded vesting period and based on the change in fair value of the awards during the three year period. Time-based phantom stock units are settled in cash upon vesting.
Prior to 2015 we issued performance stock units (PSUs).
• PSUs are performance-based awards as further described under "Performance-Based Awards" below. Compensation costs for PSUs are recognized ratably over a three-year performance period. PSUs vest fully at the end of the three-year performance period and are typically settled in shares of our common stock upon vesting.
The following table presents RSUs granted, and RSUs and PSUs vested and forfeited during 2016 under the Stock Plan:
Units
WeightedAverage
Grant-DateFair
Value
Nonvested at January 1, 2016 4,774,408 $ 4.08Granted 3,289,569 $ 2.07Vested (2,367,831) $ 4.24Forfeited (362,624) $ 2.87Nonvested at December 31, 2016 5,333,522 $ 2.85
In 2016 we issued 3,289,569 units of RSUs and in 2015 and 2014 we issued 2,996,151 units, and 1,541,395 units, respectively, of RSUs and PSUs to selected key personnel. The per-share weighted-average grant-date fair value of units granted during 2016, 2015, and 2014 was $2.07, $3.08, and $6.66, respectively. Stock-based compensation expense is included in our consolidated statements of operations in “General and administration expenses.”
Total stock-based compensation expense recognized relating to RSUs and PSUs for the years ended December 31, 2016, 2015, and 2014 was $7.5 million, $8.4 million, and $9.3 million, respectively, all of which was related to nonvested RSUs and PSUs. The total fair value of the units vested during the years ended December 31, 2016, 2015, and 2014 was $10.0 million, $8.0 million, and $7.1 million, respectively. The fair value of RSUs and PSUs is determined based on the closing trading price of the Company’s stock on the grant date.
Nonvested RSUs and PSUs at December 31, 2016 totaled 5,333,522 and total unrecognized compensation cost related to unamortized RSUs and PSUs was $5.3 million as of December 31, 2016. The remaining unrecognized compensation cost related to non-vested RSUs and PSUs will be amortized over a weighted-average vesting period of approximately 21 months.

64
The following table presents time-based phantom stock units granted, vested, and forfeited during 2016 under the Stock Plan:
Time-Based PhantomStock Units
Nonvested at January 1, 2016 —Granted 1,188,854Vested —Forfeited (202,916)Nonvested at December 31, 2016 985,938
In 2016 we issued 1,188,854 units of time-based phantom stock units to selected key personnel. We did not issue any time-based phantom stock units in 2015 or 2014.
Compensation expense recognized related to time-based phantom stock units for the year ended December 31, 2016 was $1.4 million.
Performance-Based Awards
We currently issue two types of performance-based awards: Performance Cash Units (PCUs) and performance-based phantom stock units. In prior years, we issued PSUs and PCUs.
PCUs are performance-based awards that contain payout conditions which are based on our performance against our peers with regard to relative return on capital employed (ROCE) over a three-year performance period. Each PCU has a nominal value of $100.00. A maximum of 200 percent of the number of PCUs granted may be earned if performance at the maximum level is achieved. PCUs vest to the extent earned at the end of a three-year performance period and are settled in cash.
Performance-based phantom stock units are performance-based awards denominated in a number of shares which contain payout conditions based on our performance against our peers with regard to relative total shareholder return (TSR) over a three-year performance period. They represent a grant of hypothetical stock to the equivalent number of shares of common stock but, with the employee receiving cash upon vesting. We used a simulation-based option pricing approach to determine the fair value of these awards. A maximum of 250 percent of the number of performance-based phantom stock units granted may be earned if performance at the maximum level is achieved. Performance-based phantom stock units vest to the extent earned at the end of the three-year performance period and are settled in cash.
As noted above, in years prior to 2016, we also issued PSUs, performance-based awards that contain payout conditions which are based on our performance against our peers with regard to relative TSR over a three-year performance period. The effects of these conditions are reflected in the grant-date fair value of the award using a simulation-based option pricing approach for valuation. A maximum of 250 percent of the number of PSUs granted may be earned if performance at the maximum level is achieved. PSUs vest to the extent earned at the end of a three-year performance period and are settled in shares of our common stock.
We evaluate the terms of each award to determine if the award should be accounted for as equity or a liability under the stock compensation rules of U.S. GAAP. PCUs and performance-based phantom stock units are classified as liability awards and PSUs are classified as equity awards.
For performance-based awards with graded vesting conditions, we recognize compensation expense on a straight-line basis over the service period for each separately vesting portion of the award as if the award was, in substance, multiple awards. For market-based awards that vest at the end of the service period, we recognize compensation expense on a straight-line basis through the end of the service period.

65
The following table presents PCUs granted, vested, and forfeited during 2016 under the Stock Plan:
PCUs
Nonvested at January 1, 2016 33,555Granted 17,091Vested (16,464)Forfeited (7,830)Nonvested at December 31, 2016 26,352
In 2016, 2015, and 2014 we issued 17,091 units, 17,091 units, and 16,574 units, respectively, of PCUs to selected key personnel.
Compensation expense recognized related to PCUs for the years ended December 31, 2016, 2015, and 2014 was $2.3 million, $2.3 million, and $1.9 million, respectively.
The following table presents performance-based phantom stock units granted, vested, and forfeited during 2016 under the Stock Plan:
Performance-BasedPhantom Stock Units
Nonvested at January 1, 2016 541,127Granted 1,164,880Vested —Forfeited (390,779)Nonvested at December 31, 2016 1,315,228
In 2016, 2015, and 2014 we issued 1,164,880 units, 541,127 units, and zero units, respectively, of performance-based phantom stock units to selected key personnel.
Compensation expense recognized related to performance-based phantom stock units for the year ended December 31, 2016, 2015, and 2014 was $1.3 million, $0.4 million, and $0, respectively.

66
Note 10 — Reconciliation of Income and Number of Shares Used to Calculate Basic and Diluted Earnings per Share (EPS)
For the Year Ended December 31, 2016
Income
(Numerator)Shares
(Denominator)Per-ShareAmount
Basic EPS $(230,814,000) 124,130,004 $ (1.86)Effect of dilutive securities:
Stock options and restricted stock — $ —Diluted EPS $(230,814,000) 124,130,004 $ (1.86)
For the Year Ended December 31, 2015
Income
(Numerator)Shares
(Denominator)Per-ShareAmount
Basic EPS $ (95,073,000) 122,562,187 $ (0.78)Effect of dilutive securities:
Stock options and restricted stock — $ —Diluted EPS: $ (95,073,000) 122,562,187 $ (0.78)
For the Year Ended December 31, 2014
Income
(Numerator)Shares
(Denominator)Per-ShareAmount
Basic EPS $ 23,451,000 121,186,464 $ 0.19Effect of dilutive securities:
Stock options and restricted stock 1,890,184 $ —Diluted EPS: $ 23,451,000 123,076,648 $ 0.19
For the years ended December 31, 2016 and 2015, all common shares potentially issuable in connection with outstanding RSUs and PSUs have been excluded from the calculation of diluted EPS as the company incurred losses; therefore, inclusion of such potential common shares in the calculation would be anti-dilutive.
For the year ended December 31, 2014, the computation of diluted EPS includes the dilutive effect of common shares potentially issuable in connection with outstanding RSUs and PSUs.
Note 11 — Employee Benefit Plan
The Company sponsors a defined contribution 401(k) plan (the Plan) in which substantially all U.S. employees are eligible to participate. Through April 30, 2016, the Company matched 100 percent of each participant’s pre-tax contributions in an amount not exceeding 4 percent of the participant's compensation and 50 percent of each participant’s pre-tax contributions in an amount not exceeding 2 percent of the participant's compensation, up to the maximum amount of contributions allowed by law. The Company match was suspended on May 1, 2016. The costs of matching contributions to the Plan were $1.1 million, $4.0 millionand $4.7 million in 2016, 2015 and 2014, respectively. Employees become 100 percent vested in the employer match contributions immediately upon participation in the Plan.
Note 12 — Reportable Segments
Our business is comprised of two business lines: (1) Drilling Services and (2) Rental Tools Services. We report our Drilling Services business as two reportable segments: (1) U.S. (Lower 48) Drilling and (2) International & Alaska Drilling. We report our Rental Tools Services business as two reportable segments: (1) U.S. Rental Tools and (2) International Rental Tools.
Within the four reportable segments, we have aggregated our Arctic, Eastern Hemisphere and Latin America business units under International & Alaska Drilling, one business unit under U.S. (Lower 48) Drilling, one business unit under U.S. Rental Tools and one business unit under International Rental Tools, for a total of six business units. The Company has aggregated each of its business units in one of the four reporting segments based on the guidelines of the FASB ASC Topic No. 280, Segment Reporting. We eliminate inter-segment revenues and expenses. We disclose revenues under the four reportable segments based on the similarity of the use and markets for the groups of products and services within each segment.

67
Drilling Services Business
In our Drilling Services business, we drill oil and natural gas wells for customers in both the U.S. and international markets. We provide this service with both Company-owned rigs and customer-owned rigs. We refer to the provision of drilling services with customer-owned rigs as our O&M service in which operators own their own drilling rigs but choose Parker Drilling to operate and maintain the rigs for them. The nature and scope of activities involved in drilling an oil and natural gas well is similar whether it is drilled with a Company-owned rig (as part of a traditional drilling contract) or a customer-owned rig (as part of an O&M contract). In addition, we provide project-related services, such as engineering, procurement, project management and commissioning of customer-owned drilling facility projects. We have extensive experience and expertise in drilling geologically difficult wells and in managing the logistical and technological challenges of operating in remote, harsh and ecologically sensitive areas.
U.S. (Lower 48) Drilling
Our U.S. (Lower 48) Drilling segment provides drilling services with our GOM barge drilling rig fleet, and markets our U.S. (Lower 48) based O&M services. Our GOM barge drilling fleet operates barge rigs that drill for oil and natural gas in shallow waters in and along the inland waterways and coasts of Louisiana, Alabama and Texas. The majority of these wells are drilled in shallow water depths ranging from 6 to 12 feet. Our rigs are suitable for a variety of drilling programs, from inland coastal waters requiring shallow draft barges, to open water drilling on both state and federal water projects requiring more robust capabilities. The barge drilling industry in the GOM is characterized by cyclical activity where utilization and dayrates are typically driven by oil and natural gas prices and our customers’ access to project financing. Contract terms typically consist of well-to-well or multi-well programs, most commonly ranging from 20 to 120 days.
International & Alaska Drilling
Our International & Alaska Drilling segment provides drilling services, using both Company-owned rigs and O&M contracts, and project-related services. The drilling markets in which this segment operates have one or more of the following characteristics:
• customers that typically are major, independent or national oil and natural gas companies or integrated service providers;
• drilling programs in remote locations with little infrastructure, requiring a large inventory of spare parts and other ancillary equipment and self-supported service capabilities;
• complex wells and/or harsh environments (such as high pressures, deep depths, hazardous or geologically challenging conditions and sensitive environments) requiring specialized equipment and considerable experience to drill; and
• drilling and O&M contracts that generally cover periods of one year or more.
Rental Tools Services Business
In our Rental Tools Services business, we provide premium rental equipment and services to E&P companies, drilling contractors and service companies on land and offshore in the U.S. and select international markets. Tools we provide include standard and heavy-weight drill pipe, all of which are available with standard or high-torque connections, tubing, pressure control equipment, including BOPs, drill collars and more. We also provide well construction services, which include tubular running services and downhole tools, and well intervention services, which include whipstock, fishing and related services, as well as inspection and machine shop support. Rental tools are used during drilling programs and are requested by the customer when they are needed, requiring us to keep a broad inventory of rental tools in stock. Rental tools are usually rented on a daily or monthly basis.
U.S. Rental Tools
Our U.S. rental tools segment is headquartered in New Iberia, Louisiana. We maintain an inventory of rental tools for deepwater, drilling, completion, workover, and production applications at facilities in Louisiana, Texas, Oklahoma, Wyoming, North Dakota and West Virginia.
Our largest single market for rental tools is U.S. land drilling, a cyclical market driven primarily by oil and natural gas prices and our customers' access to project financing. A portion of our U.S. rental tools business is supplying tubular goods and other equipment to offshore GOM customers.

68
International Rental Tools
Our international rental tools segment is headquartered in Dubai, United Arab Emirates. We maintain an inventory of rental tools and provide well construction, well intervention, and surface and tubular services to our customers in the Middle East, Latin America, United Kingdom, Europe, and Asia-Pacific regions.
The following table represents the results of operations by reportable segment:
Year Ended December 31,
Dollars in thousands 2016 2015 2014
Revenues: (1)
Drilling Services:U.S. (Lower 48) Drilling $ 5,429 $ 30,358 $ 158,405International & Alaska Drilling 287,332 435,096 462,513
Total Drilling Services 292,761 465,454 620,918Rental Tools Services:
U.S. Rental Tools 71,613 141,889 223,545International Rental Tools 62,630 104,840 124,221
Total Rental Tools Services 134,243 246,729 347,766Total revenues 427,004 712,183 968,684Operating gross margin: (2)
Drilling Services:U.S. (Lower 48) Drilling (34,353) (28,309) 46,831International & Alaska Drilling 9,272 45,211 34,405
Total Drilling Services (25,081) 16,902 81,236Rental Tools Services:
U.S. Rental Tools (22,372) 17,380 71,790International Rental Tools (27,859) (4,583) 1,156
Total Rental Tools Services (50,231) 12,797 72,946Total operating gross margin (75,312) 29,699 154,182General and administrative expense (34,332) (36,190) (35,016)Provision for reduction in carrying value of certain assets — (12,490) —Gain (loss) on disposition of assets, net (1,613) 1,643 1,054Total operating income (loss) (111,257) (17,338) 120,220Interest expense (45,812) (45,155) (44,265)Interest income 58 269 195Loss on extinguishment of debt — — (30,152)Other income (loss) 367 (9,747) 2,539Income (loss) from continuing operations before income taxes $ (156,644) $ (71,971) $ 48,537
(1) For the years ended December 31, 2016, 2015, and 2014, our largest customer, ENL, constituted approximately 38.7 percent, 27.9 percent, and 18.7 percent, respectively, of our total consolidated revenues and approximately 57.5 percent, 45.6 percent, and 39.2 percent, respectively, of our International & Alaska Drilling segment revenues for the years ended December 31, 2016, 2015, and 2014.
Excluding reimbursable revenues of $67.0 million, $75.8 million, and $60.4 million, ENL constituted approximately 27.5 percent, 19.7 percent, and 15.3 percent, respectively, of our total consolidated revenues and approximately 45.0 percent, 35.3 percent, and 34.9 percent, respectively of our International & Alaska Drilling segment revenues.
For the year ended December 31, 2016, our second largest customer, BP, constituted 12.0 percent, of our total consolidated revenues and approximately 17.6 percent of our International & Alaska Drilling segment revenues.
(2) Operating gross margin is calculated as revenues less direct operating expenses, including depreciation and amortization expense.

69
The following table represents capital expenditures and depreciation and amortization by reportable segment:
Year Ended December 31,
Dollars in thousands 2016 2015 2014
Capital expenditures:U.S. (Lower 48) Drilling $ 264 $ 2,731 $ 43,120International & Alaska Drilling 5,258 13,458 26,761U.S. Rental Tools 10,848 47,673 65,101International Rental Tools 9,725 19,516 30,239Corporate 2,859 4,819 14,292
Total capital expenditures $ 28,954 $ 88,197 $ 179,513Depreciation and amortization: (1)
U.S. (Lower 48) Drilling $ 20,049 $ 22,420 $ 21,260International & Alaska Drilling 55,236 64,539 59,684U.S. Rental Tools 43,769 47,453 46,402International Rental Tools 20,741 21,782 17,775
Total depreciation and amortization $ 139,795 $ 156,194 $ 145,121
(1) For presentation purposes, depreciation for corporate assets of $8.3 million, $7.5 million, and $5.0 million for the years then ended December 31, 2016, 2015 and 2014, respectively, has been allocated to the corresponding reportable segments.
The following table represents identifiable assets by reportable segment:
Year Ended December 31,
Dollars in Thousands 2016 2015
Identifiable assets:U.S. (Lower 48) Drilling $ 77,628 $ 102,121International & Alaska Drilling 591,120 629,784U.S. Rental Tools 126,289 233,085International Rental Tools 170,431 196,196
Total identifiable assets 965,468 1,161,186Corporate 138,083 205,516
Total assets $ 1,103,551 $ 1,366,702

70
The following table represents selected geographic information:
Year Ended December 31,
Dollars in Thousands
Revenues by geographic area: 2016 2015 2014
Russia $ 142,538 $ 165,193 $ 154,817Other CIS 33,659 61,145 59,881EMEA & Asia 79,870 148,015 183,460Latin America 12,952 69,989 86,651United States 127,596 231,779 440,642Other(1) 30,389 36,062 43,233
Total revenues $ 427,004 $ 712,183 $ 968,684
Long-lived assets by geographic area:(2)
Russia $ 21,395 $ 22,607Other CIS 35,914 44,675EMEA & Asia 116,857 130,434Latin America 48,528 63,919United States 470,745 544,206Other(1) — —
Total long-lived assets $ 693,439 $ 805,841
(1) This category includes our Canada O&M operations and our project services activities. Revenue generated by our project service activities benefit our various geographic locations.
(2) Long-lived assets consist of property, plant and equipment, net.
Note 13 — Commitments and Contingencies
The Company has various lease agreements for office space, equipment, vehicles and personal property. These obligations extend through 2025 and are typically non-cancelable. Most leases contain renewal options and certain of the leases contain escalation clauses. Future minimum lease payments at December 31, 2016, under operating leases with non-cancelable terms are as follows:
Dollars in ThousandsYear Ended
December 31,
2017 $ 12,5592018 7,8412019 6,6672020 5,1682021 2,823
Thereafter 2,192Total $ 37,250
Total rent expense for all operating leases amounted to $21.8 million, $19.2 million and $21.8 million for 2016, 2015, and 2014, respectively.

71
Self Insurance
We are self-insured for certain losses relating to workers’ compensation, employers’ liability, general liability (for onshore liability), protection and indemnity (for offshore liability) and property damage. Our exposure (that is, the retention or deductible) per occurrence is $250,000 for worker’s compensation and employer’s liability, and $500,000 for general liability, protection and indemnity and maritime employers’ liability (Jones Act). In addition, we assume a $400,000 annual aggregate deductible for protection and indemnity and maritime employers’ liability claims. The annual aggregate deductible is reduced by every dollar that exceeds the $500,000 per occurrence retention. We also assume a retention for foreign casualty exposures of $100,000 for workers’ compensation, employers’ liability, and $1,000,000 for general liability losses and a $100,000 deductible for auto liability claims. For all primary insurances mentioned above, the Company has excess coverage for those claims that exceed the retention and annual aggregate deductible. We maintain actuarially-determined accruals in our consolidated balance sheets to cover the self-insurance retentions.
We have self-insured retentions for certain other losses relating to rig, equipment, property, business interruption and political, war, and terrorism risks which vary according to the type of rig and line of coverage. Political risk insurance is procured for international operations. However, this coverage may not adequately protect us against liability from all potential consequences.
As of December 31, 2016 and 2015, our gross self-insurance accruals for workers’ compensation, employers’ liability, general liability, protection and indemnity and maritime employers’ liability totaled $3.9 million and $5.5 million, respectively and the related insurance recoveries/receivables were $1.5 million and $2.0 million, respectively.
Other Commitments
We have entered into employment agreements with certain members of management with automatic one year renewal periods at expiration dates. The agreements provide for, among other things, compensation, benefits and severance payments. The employment agreements also provide for lump sum compensation and benefits in the event of termination within two years following a change in control of the Company.
Contingencies
We are a party to various lawsuits and claims arising out of the ordinary course of business. We estimate the range of our liability related to pending litigation when we believe the amount or range of loss can be estimated. We record our best estimate of a loss when the loss is considered probable. When a liability is probable and there is a range of estimated loss with no best estimate in the range, we record the minimum estimated liability related to the lawsuits or claims. As additional information becomes available, we assess the potential liability related to our pending litigation and claims and revise our estimates. Due to uncertainties related to the resolution of lawsuits and claims, the ultimate outcome may differ significantly from our estimates. In the opinion of management and based on liability accruals provided, our ultimate exposure with respect to these pending lawsuits and claims is not expected to have a material adverse effect on our consolidated financial position or cash flows, although they could have a material adverse effect on our results of operations for a particular reporting period.
Customs Agent and Foreign Corrupt Practices Act (FCPA) Settlement
On April 16, 2013, the Company and the Department of Justice (DOJ) entered into a deferred prosecution agreement (DPA), under which the DOJ deferred for three years prosecuting the Company for criminal violations of the anti-bribery provisions of the FCPA relating to the Company’s retention and use of an individual agent in Nigeria with respect to certain customs-related issues, in return for: (i) the Company’s acceptance of responsibility for, and agreement not to contest or contradict the truthfulness of, the statement of facts and allegations that have been filed in the United States District Court for the Eastern District of Virginia concurrently with the DPA; (ii) the Company’s payment of an approximately $11.76 million fine; (iii) the Company’s reaffirming its commitment to compliance with the FCPA and other applicable anti-corruption laws in connection with the Company’s operations, and continuing cooperation with domestic and foreign authorities in connection with the matters that are the subject of the DPA; (iv) the Company’s commitment to continue to address any identified areas for improvement in the Company’s internal controls, policies and procedures relating to compliance with the FCPA and other applicable anti-corruption laws if, and to the extent, not already addressed; and (v) the Company’s agreement to report to the DOJ in writing annually during the term of the DPA regarding remediation of the matters that are the subject of the DPA, implementation of any enhanced internal controls, and any evidence of improper payments the Company may have discovered during the term of the agreement. The DPA provided that as long as the Company remained in compliance with the terms of the DPA throughout its effective period, the charge against the Company would be dismissed with prejudice. The Company also settled a related civil complaint filed by the Securities and Exchange Commission. The third written annual report was filed with the DOJ on April 15, 2016, and the term of the DPA expired on April 23, 2016. On May 20, 2016, the DOJ filed a Motion to Dismiss the case based on its determination that the Company had complied with all of its obligations under the DPA. On the same date, the Court entered an Order dismissing with prejudice the United States’ case against the Company. With the dismissal of the case, the DPA was also terminated.

72
Note 14 — Related Party Transactions
Consulting Agreement
On December 31, 2013, Robert L. Parker, Jr., our former Executive Chairman, retired as an employee of the Company. Mr. Parker continued to serve as Chairman of the Company’s board of directors until the annual meeting of stockholders held in 2014, at which time Mr. Parker was elected to the board for a three-year term.
In connection with Mr. Parker’s retirement, the Company and Mr. Parker entered into a Retirement and Separation Agreement dated as of November 1, 2013 (the “Retirement Agreement”). Under the terms of the Retirement Agreement, in 2014 Mr. Parker received a cash bonus of $411,188, a cash payment of $1,096,687 pursuant to the 2010 Long-Term Incentive Program of the Company’s Stock Plan, and a severance payment of $2,488,024. The value of benefits provided by the Company to Mr. Parker in 2014 was $12,876. In 2015, Mr. Parker received a cash payment of $706,082 pursuant to the 2010 Long-Term Incentive Program of the Company’s Stock Plan. The value of benefits provided by the Company to Mr. Parker in 2015 was $14,441.
In addition, Mr. Parker was paid $250,000 during each of 2015 and 2016 and will be paid $250,000 during 2017 in exchange for his agreement to provide additional support to the Company when needed in matters where his historical and industry knowledge, client relationships and related expertise could be of particular benefit to the Company’s interests.
Other Related Party Agreements
During 2015 we purchased the legal rights to certain rental tool software from two employees and a relative of the employees. As part of the purchase, we paid $180,000 to the relative of the employees in 2015 and $90,000 to each employee in both January 2016 and 2017.
One of the Company’s directors held executive positions at Apache Corporation (Apache), including the positions of President and Chief Corporate Officer, Executive Vice President and Chief Financial Officer and Chief Corporate Officer, prior to retiring from Apache on March 31, 2014. During 2015 and 2014, affiliates of Apache paid affiliates of the Company a total of $34.0 million and $40.8 million, respectively, for performance of drilling services and provision of rental tools. There were no amounts paid during 2016.
In 2015, one of our directors acquired $215,000 aggregate principal amount of our 7.50% Notes and a family limited partnership in which he is the general partner acquired $25,000 aggregate principal amount of our 6.75% Notes. In addition, another one of our directors acquired $550,000 aggregate principal amount of our 7.50% Notes and $650,000 aggregate principal amount of our 6.75% Notes.
Note 15 — Supplementary Information
The significant components of "Accrued liabilities" on our consolidated balance sheets as of December 31, 2016 and 2015 are presented below:
Year Ended December 31,
Dollars in Thousands 2016 2015
Accrued liabilities:Accrued Payroll & Related Benefits $ 20,714 $ 27,678Accrued Interest Expense 18,169 18,169Accrued Professional Fees & Other 13,039 20,326Deferred Mobilization Fees 2,681 2,649Workers' Compensation Liabilities, net 1,583 2,801
Total accrued liabilities $ 56,186 $ 71,623
73
Note 16 — Parent, Guarantor, Non-Guarantor Unaudited Consolidating Condensed Financial Statements
Set forth on the following pages are the consolidating condensed financial statements of Parker Drilling. The Company’s 2015 Secured Credit Agreement and Senior Notes are fully and unconditionally guaranteed by substantially all of our direct and indirect domestic subsidiaries other than immaterial subsidiaries and subsidiaries generating revenues primarily outside the United States, subject to the following customary release provisions:
• in connection with any sale or other disposition of all or substantially all of the assets of that guarantor (including by way of merger or consolidation) to a person that is not (either before or after giving effect to such transaction) a subsidiary of the Company;
• in connection with any sale of such amount of capital stock as would result in such guarantor no longer being a subsidiary to a person that is not (either before or after giving effect to such transaction) a subsidiary of the Company;
• if the Company designates any restricted subsidiary that is a guarantor as an unrestricted subsidiary;
• if the guarantee by a guarantor of all other indebtedness of the Company or any other guarantor is released, terminated or discharged, except by, or as a result of, payment under such guarantee; or
• upon legal defeasance or covenant defeasance (satisfaction and discharge of the indenture).
There are currently no restrictions on the ability of the restricted subsidiaries to transfer funds to Parker Drilling in the form of cash dividends, loans or advances. Parker Drilling is a holding company with no operations, other than through its subsidiaries. Separate financial statements for each guarantor company are not provided as the company complies with the exception to Rule 3-10(a)(1) of Regulation S-X, set forth in sub-paragraph (f) of such rule. All guarantor subsidiaries are owned 100 percent by the parent company.
We are providing consolidating condensed financial information of the parent, Parker Drilling, the guarantor subsidiaries, and the non-guarantor subsidiaries as of December 31, 2016 and December 31, 2015 and for the years ended December 31, 2016, 2015, and 2014. The consolidating condensed financial statements present investments in both the consolidated and unconsolidated subsidiaries using the equity method of accounting.
Upon the closing of our 2015 Secured Credit Agreement, one of our subsidiaries was released as a guarantor subsidiary and is now classified as a non-guarantor subsidiary. In accordance with the guidance Topic No. 810, Consolidation, we have retrospectively updated the unaudited consolidating condensed financial information as of December 31, 2016 and December 31, 2015 and for the years ended December 31, 2016, 2015, and 2014.

74
PARKER DRILLING COMPANY AND SUBSIDIARIES
CONSOLIDATING CONDENSED STATEMENT OF OPERATIONS(Dollars in Thousands)
(Unaudited)
Year ended December 31, 2016 Parent Guarantor Non-Guarantor Eliminations Consolidated
Total revenues $ — $ 152,263 $ 380,931 $ (106,190) $ 427,004Operating expenses — 103,013 365,698 (106,190) 362,521Depreciation and amortization — 90,218 49,577 — 139,795Total operating gross margin (loss) — (40,968) (34,344) — (75,312)General and administration expense (1) (410) (29,355) (4,567) — (34,332)Gain (loss) on disposition of assets, net — (565) (1,048) — (1,613)Total operating income (loss) (410) (70,888) (39,959) — (111,257)Other income (expense):
Interest expense (48,160) (642) (6,434) 9,424 (45,812)Interest income 758 695 8,029 (9,424) 58Other — 484 (117) — 367Equity in net earnings of subsidiaries (94,469) — — 94,469 —
Total other income (expense) (141,871) 537 1,478 94,469 (45,387)Income (loss) before income taxes (142,281) (70,351) (38,481) 94,469 (156,644)Income tax expense (benefit):
Current tax expense (benefit) 40,562 (35,572) 118 — 5,108Deferred tax expense (benefit) 47,971 14,846 6,245 — 69,062
Total income tax expense (benefit) 88,533 (20,726) 6,363 — 74,170Net income (loss) attributable tocontrolling interest $ (230,814) $ (49,625) $ (44,844) $ 94,469 $ (230,814)
(1) General and administration expenses for field operations are included in operating expenses.

75
PARKER DRILLING COMPANY AND SUBSIDIARIES
CONSOLIDATING CONDENSED STATEMENT OF OPERATIONS(Dollars in Thousands)
(Unaudited)
Year ended December 31, 2015 Parent Guarantor Non-Guarantor Eliminations Consolidated
Total revenues $ — $ 254,182 $ 584,204 $ (126,203) $ 712,183Operating expenses — 143,563 508,930 (126,203) 526,290Depreciation and amortization — 95,071 61,123 — 156,194Total operating gross margin (loss) — 15,548 14,151 — 29,699General and administration expense (1) (1,279) (38,643) 3,732 — (36,190)Provision for reduction in carrying valueof certain assets — (2,088) (10,402) — (12,490)Gain (loss) on disposition of assets, net — 439 1,204 — 1,643Total operating income (loss) (1,279) (24,744) 8,685 — (17,338)Other income (expense):
Interest expense (47,659) (1,035) (11,579) 15,118 (45,155)Interest income 1,424 852 13,111 (15,118) 269Other — (200) (9,547) — (9,747)Equity in net earnings of subsidiaries (36,631) — — 36,631 —
Total other income (expense) (82,866) (383) (8,015) 36,631 (54,633)Income (loss) before income taxes (84,145) (25,127) 670 36,631 (71,971)Income tax expense (benefit):
Current tax expense (benefit) 29,643 (22,970) 12,931 — 19,604Deferred tax expense (benefit) (18,715) 11,718 9,706 — 2,709
Total income tax expense (benefit) 10,928 (11,252) 22,637 — 22,313Net income (loss) (95,073) (13,875) (21,967) 36,631 (94,284)Less: Net income attributable tononcontrolling interest — — 789 — 789Net income (loss) attributable tocontrolling interest $ (95,073) $ (13,875) $ (22,756) $ 36,631 $ (95,073)
(1) General and administration expenses for field operations are included in operating expenses.

76
PARKER DRILLING COMPANY AND SUBSIDIARIES
CONSOLIDATING CONDENSED STATEMENT OF OPERATIONS(Dollars in Thousands)
(Unaudited)
Year ended December 31, 2014 Parent Guarantor Non-Guarantor Eliminations Consolidated
Total revenues $ — $ 506,205 $ 640,147 $ (177,668) $ 968,684Operating expenses — 279,396 567,653 (177,668) 669,381Depreciation and amortization — 87,248 57,873 — 145,121Total operating gross margin (loss) — 139,561 14,621 — 154,182General and administration expense (1) (302) (33,035) (1,679) — (35,016)Provision for reduction in carrying valueof certain assets — — — — —Gain (loss) on disposition of assets, net (79) 1,156 (23) — 1,054Total operating income (loss) (381) 107,682 12,919 — 120,220Other income and (expense):
Interest expense (46,527) (148) (7,692) 10,102 (44,265)Interest income 1,478 623 8,196 (10,102) 195Loss on extinguishment of debt (30,152) — — — (30,152)Other — 2,810 (271) — 2,539Equity in net earnings of subsidiaries 67,399 — — (67,399) —
Total other income and (expense) (7,802) 3,285 233 (67,399) (71,683)Income (loss) before income taxes (8,183) 110,967 13,152 (67,399) 48,537Income tax expense (benefit):
Current tax expense (benefit) (17,702) 24,106 16,163 — 22,567Deferred tax expense (benefit) (13,932) 16,949 (1,508) — 1,509
Total income tax expense (benefit) (31,634) 41,055 14,655 — 24,076Net income (loss) 23,451 69,912 (1,503) (67,399) 24,461Less: Net income attributable tononcontrolling interest — — 1,010 — 1,010Net income (loss) attributable tocontrolling interest $ 23,451 $ 69,912 $ (2,513) $ (67,399) $ 23,451
(1) General and administration expenses for field operations are included in operating expenses.

77
PARKER DRILLING COMPANY AND SUBSIDIARIESCONSOLIDATING CONDENSED STATEMENT OF COMPREHENSIVE INCOME (LOSS)
(Dollars in Thousands)(Unaudited)
Year Ended December 31, 2016
Parent GuarantorNon-
Guarantor Eliminations ConsolidatedComprehensive income (loss):Net income (loss) $ (230,814) $ (49,625) $ (44,844) $ 94,469 $ (230,814)Other comprehensive gain (loss), net of tax:
Currency translation difference on relatedborrowings — — (691) — $ (691)Currency translation difference on foreigncurrency net investments — — (4,265) — $ (4,265)
Total other comprehensive gain (loss), net of tax: — — (4,956) — (4,956)Comprehensive income (loss) attributable tocontrolling interest $ (230,814) $ (49,625) $ (49,800) $ 94,469 $ (235,770)
PARKER DRILLING COMPANY AND SUBSIDIARIESCONSOLIDATING CONDENSED STATEMENT OF COMPREHENSIVE INCOME (LOSS)
(Dollars in Thousands)(Unaudited)
Year Ended December 31, 2015
Parent GuarantorNon-
Guarantor Eliminations ConsolidatedComprehensive income (loss):Net income (loss) $ (95,073) $ (13,875) $ (21,967) $ 36,631 $ (94,284)Other comprehensive gain (loss), net of tax:
Currency translation difference on relatedborrowings — — (2,012) — (2,012)Currency translation difference on foreign currencynet investments — — 405 — 405
Total other comprehensive gain (loss), net of tax: — — (1,607) — (1,607)Comprehensive income (loss) (95,073) (13,875) (23,574) 36,631 (95,891)Comprehensive (income) loss attributable tononcontrolling interest — — 4,606 — 4,606Comprehensive income (loss) attributable tocontrolling interest $ (95,073) $ (13,875) $ (18,968) $ 36,631 $ (91,285)

78
PARKER DRILLING COMPANY AND SUBSIDIARIESCONSOLIDATING CONDENSED STATEMENT OF COMPREHENSIVE INCOME (LOSS)
(Dollars in Thousands)(Unaudited)
Year ended December 31, 2014
Parent GuarantorNon-
Guarantor Eliminations ConsolidatedComprehensive income:Net income (loss) $ 23,451 $ 69,912 $ (1,503) $ (67,399) $ 24,461Other comprehensive gain (loss), net of tax:
Currency translation difference on relatedborrowings — — (4,870) — (4,870)Currency translation difference on foreign currencynet investments — — 2,147 — 2,147
Total other comprehensive gain (loss), net of tax: — — (2,723) — (2,723)Comprehensive income (loss) 23,451 69,912 (4,226) (67,399) 21,738Comprehensive (income) loss attributable tononcontrolling interest — — (673) — (673)Comprehensive income (loss) attributable tocontrolling interest $ 23,451 $ 69,912 $ (4,899) $ (67,399) $ 21,065

79
PARKER DRILLING COMPANY AND SUBSIDIARIES
CONSOLIDATING CONDENSED BALANCE SHEET(Dollars in Thousands)
(Unaudited)
December 31, 2016 Parent Guarantor Non-Guarantor Eliminations Consolidated
ASSETSCurrent assets:
Cash and cash equivalents $ 65,000 $ 14,365 $ 40,326 $ — $ 119,691Accounts and notes receivable, net — 15,749 97,482 — 113,231Rig materials and supplies — (5,369) 37,723 — 32,354Deferred costs — 16 1,420 — 1,436Other tax assets (50,296) 35,733 21,038 — 6,475Other current assets — 5,555 7,576 — 13,131
Total current assets 14,704 66,049 205,565 — 286,318Property, plant and equipment, net (19) 469,927 223,531 — 693,439Goodwill — 6,708 — — 6,708Intangible assets, net — 9,434 494 — 9,928Investment in subsidiaries andintercompany advances 2,979,413 2,932,375 3,676,402 (9,588,190) —Other noncurrent assets (253,679) 301,771 539,877 (480,811) 107,158
Total assets $ 2,740,419 $ 3,786,264 $ 4,645,869 $ (10,069,001) $ 1,103,551
LIABILITIES AND STOCKHOLDERS’ EQUITYCurrent liabilities:
Accounts payable and accruedliabilities (10,080) 149,210 577,188 (617,477) 98,841Accrued income taxes — 1,576 2,504 — 4,080
Total current liabilities (10,080) 150,786 579,692 (617,477) 102,921Long-term debt, net 576,326 — — — 576,326Other long-term liabilities 2,867 9,338 3,631 — 15,836Deferred tax liability (28) 73,039 (3,678) — 69,333Intercompany payables 1,828,317 1,437,417 2,161,864 (5,427,598) —
Total liabilities 2,397,402 1,670,580 2,741,509 (6,045,075) 764,416Total equity 343,017 2,115,684 1,904,360 (4,023,926) 339,135
Total liabilities and stockholders’equity $ 2,740,419 $ 3,786,264 $ 4,645,869 $ (10,069,001) $ 1,103,551

80
PARKER DRILLING COMPANY AND SUBSIDIARIES
CONSOLIDATING CONDENSED BALANCE SHEET(Dollars in Thousands)
(Unaudited)
December 31, 2015 Parent Guarantor Non-Guarantor Eliminations Consolidated
ASSETSCurrent assets:
Cash and cash equivalents $ 73,985 $ 13,854 $ 46,455 $ — $ 134,294Accounts and notes receivable, net — 42,261 132,844 — 175,105Rig materials and supplies — (4,744) 39,681 — 34,937Deferred costs — — 1,367 — 1,367Other tax assets — 457 4,735 — 5,192Other current assets — 5,525 10,321 — 15,846
Total current assets 73,985 57,353 235,403 — 366,741Property, plant and equipment, net (19) 543,346 262,514 — 805,841Goodwill — 6,708 — — 6,708Intangible assets, net — 11,740 1,637 — 13,377Investment in subsidiaries and intercompanyadvances 3,057,220 2,770,501 3,319,702 (9,147,423) —Other noncurrent assets (234,786) 312,790 265,995 (169,964) 174,035
Total assets $ 2,896,400 $ 3,702,438 $ 4,085,251 $ (9,317,387) $ 1,366,702
LIABILITIES AND STOCKHOLDERS’ EQUITYCurrent liabilities:
Accounts payable and accrued liabilities 84,456 56,382 295,439 (306,574) 129,703Accrued income taxes 9,900 2,111 (5,593) — 6,418
Total current liabilities 94,356 58,493 289,846 (306,574) 136,121Long-term debt, net 574,798 — — — 574,798Other long-term liabilities 2,868 7,446 8,303 — 18,617Deferred tax liability (29) 69,679 (996) — 68,654Intercompany payables 1,656,968 1,401,510 1,864,671 (4,923,149) —
Total liabilities 2,328,961 1,537,128 2,161,824 (5,229,723) 798,190Total equity 567,439 2,165,310 1,923,427 (4,087,664) 568,512
Total liabilities and stockholders’equity $ 2,896,400 $ 3,702,438 $ 4,085,251 $ (9,317,387) $ 1,366,702
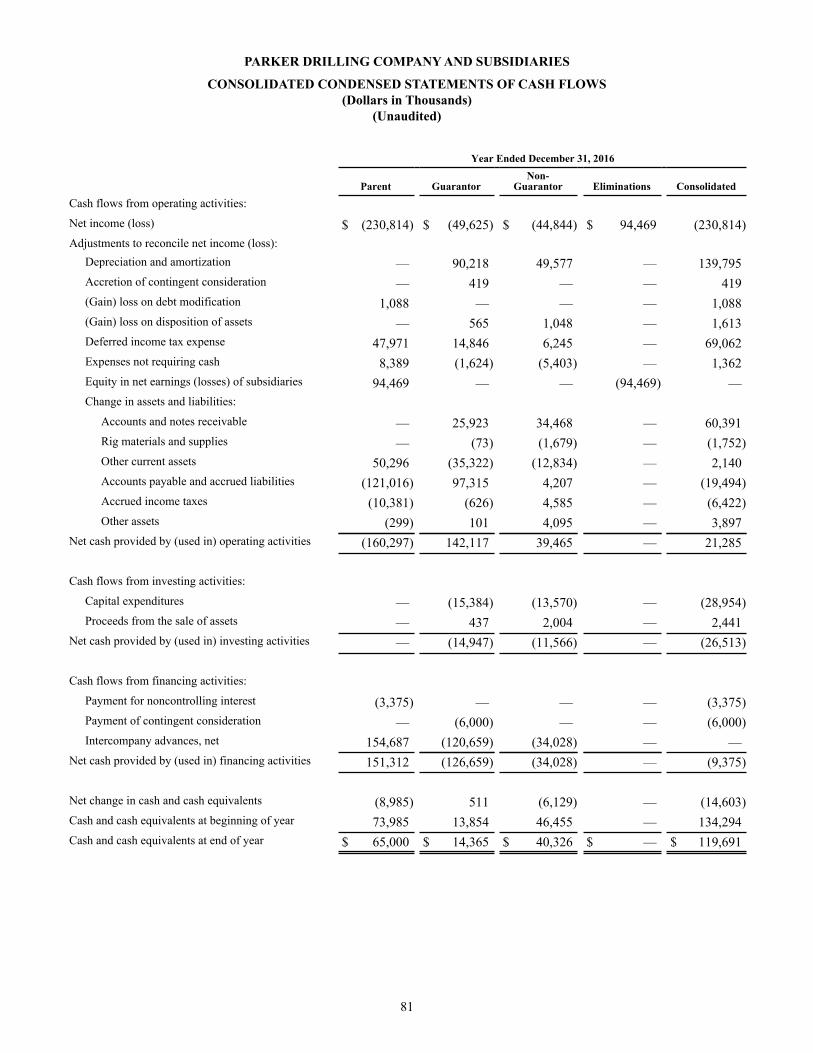
81
PARKER DRILLING COMPANY AND SUBSIDIARIES
CONSOLIDATED CONDENSED STATEMENTS OF CASH FLOWS(Dollars in Thousands)
(Unaudited)
Year Ended December 31, 2016
Parent GuarantorNon-
Guarantor Eliminations ConsolidatedCash flows from operating activities:
Net income (loss) $ (230,814) $ (49,625) $ (44,844) $ 94,469 (230,814)Adjustments to reconcile net income (loss):
Depreciation and amortization — 90,218 49,577 — 139,795Accretion of contingent consideration — 419 — — 419(Gain) loss on debt modification 1,088 — — — 1,088(Gain) loss on disposition of assets — 565 1,048 — 1,613Deferred income tax expense 47,971 14,846 6,245 — 69,062Expenses not requiring cash 8,389 (1,624) (5,403) — 1,362Equity in net earnings (losses) of subsidiaries 94,469 — — (94,469) —Change in assets and liabilities:
Accounts and notes receivable — 25,923 34,468 — 60,391Rig materials and supplies — (73) (1,679) — (1,752)Other current assets 50,296 (35,322) (12,834) — 2,140Accounts payable and accrued liabilities (121,016) 97,315 4,207 — (19,494)Accrued income taxes (10,381) (626) 4,585 — (6,422)Other assets (299) 101 4,095 — 3,897
Net cash provided by (used in) operating activities (160,297) 142,117 39,465 — 21,285
Cash flows from investing activities:
Capital expenditures — (15,384) (13,570) — (28,954)Proceeds from the sale of assets — 437 2,004 — 2,441
Net cash provided by (used in) investing activities — (14,947) (11,566) — (26,513)
Cash flows from financing activities:
Payment for noncontrolling interest (3,375) — — — (3,375)Payment of contingent consideration — (6,000) — — (6,000)Intercompany advances, net 154,687 (120,659) (34,028) — —
Net cash provided by (used in) financing activities 151,312 (126,659) (34,028) — (9,375)
Net change in cash and cash equivalents (8,985) 511 (6,129) — (14,603)Cash and cash equivalents at beginning of year 73,985 13,854 46,455 — 134,294Cash and cash equivalents at end of year $ 65,000 $ 14,365 $ 40,326 $ — $ 119,691

82
PARKER DRILLING COMPANY AND SUBSIDIARIES
CONSOLIDATED CONDENSED STATEMENTS OF CASH FLOWS(Dollars in Thousands)
(Unaudited)
Year Ended December 31, 2015
Parent GuarantorNon-
Guarantor Eliminations ConsolidatedCash flows from operating activities:
Net income (loss) $ (95,073) $ (13,875) $ (21,967) $ 36,631 (94,284)Adjustments to reconcile net income (loss):
Depreciation and amortization — 95,071 61,123 — 156,194Accretion of contingent consideration — 826 — — 826(Gain) loss on disposition of assets — (439) (1,204) — (1,643)Deferred income tax expense (benefit) (18,715) 11,718 9,706 — 2,709Provision for reduction in carrying value of certainassets — 2,088 10,402 — 12,490Expenses not requiring cash 6,311 854 (2,062) — 5,103Equity in net earnings (losses) of subsidiaries 36,631 — — (36,631) —Change in assets and liabilities:
Accounts and notes receivable (33) 61,818 42,210 — 103,995Rig materials and supplies — 51 2,671 — 2,722Other current assets 19,885 (16,257) 8,920 — 12,548Accounts payable and accrued liabilities 10,228 (21,396) (16,257) — (27,425)Accrued income taxes 15,368 (9,405) (13,920) — (7,957)Other assets (198,955) 186,591 9,208 — (3,156)
Net cash provided by (used in) operating activities (224,353) 297,645 88,830 — 162,122
Cash flows from investing activities:
Capital expenditures — (58,817) (29,380) — (88,197)Proceeds from the sale of assets — 500 330 — 830Proceeds from insurance settlements — — 2,500 — 2,500Acquisitions, net of cash acquired (3,375) (10,431) — — (13,806)Divestitures, net of cash acquired — — (2,570) — (2,570)
Net cash provided by (used in) investing activities (3,375) (68,748) (29,120) — (101,243)
Cash flows from financing activities:
Repayment of long term debt (30,000) — — — (30,000)Payment of debt issuance costs (1,996) — — — (1,996)Payment of contingent consideration — (2,000) — — (2,000)Excess tax benefit from stock-based compensation (1,045) — — — (1,045)Intercompany advances, net 298,026 (226,589) (71,437) — —
Net cash provided by (used in) financing activities 264,985 (228,589) (71,437) — (35,041)
Net change in cash and cash equivalents 37,257 308 (11,727) — 25,838Cash and cash equivalents at beginning of year 36,728 13,546 58,182 — 108,456Cash and cash equivalents at end of year $ 73,985 $ 13,854 $ 46,455 $ — $ 134,294
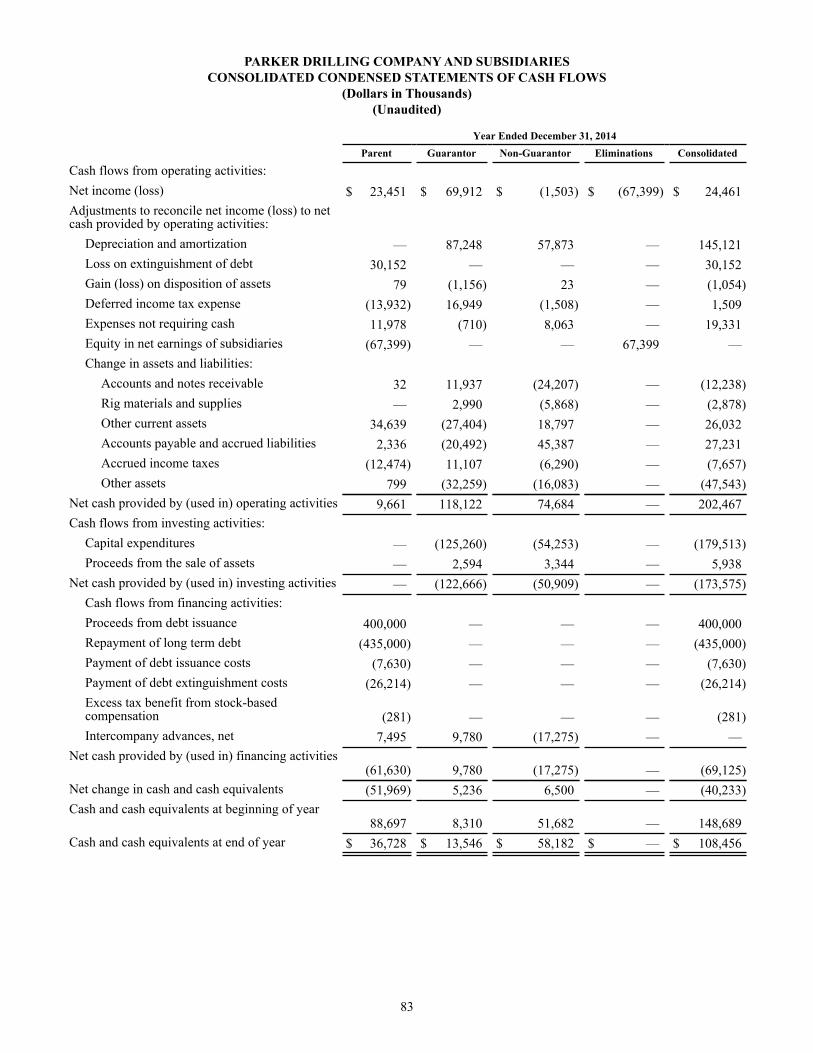
83
PARKER DRILLING COMPANY AND SUBSIDIARIESCONSOLIDATED CONDENSED STATEMENTS OF CASH FLOWS
(Dollars in Thousands)(Unaudited)
Year Ended December 31, 2014 Parent Guarantor Non-Guarantor Eliminations Consolidated
Cash flows from operating activities:Net income (loss) $ 23,451 $ 69,912 $ (1,503) $ (67,399) $ 24,461Adjustments to reconcile net income (loss) to netcash provided by operating activities:
Depreciation and amortization — 87,248 57,873 — 145,121Loss on extinguishment of debt 30,152 — — — 30,152Gain (loss) on disposition of assets 79 (1,156) 23 — (1,054)Deferred income tax expense (13,932) 16,949 (1,508) — 1,509Expenses not requiring cash 11,978 (710) 8,063 — 19,331Equity in net earnings of subsidiaries (67,399) — — 67,399 —Change in assets and liabilities:
Accounts and notes receivable 32 11,937 (24,207) — (12,238)Rig materials and supplies — 2,990 (5,868) — (2,878)Other current assets 34,639 (27,404) 18,797 — 26,032Accounts payable and accrued liabilities 2,336 (20,492) 45,387 — 27,231Accrued income taxes (12,474) 11,107 (6,290) — (7,657)Other assets 799 (32,259) (16,083) — (47,543)
Net cash provided by (used in) operating activities 9,661 118,122 74,684 — 202,467Cash flows from investing activities:
Capital expenditures — (125,260) (54,253) — (179,513)Proceeds from the sale of assets — 2,594 3,344 — 5,938
Net cash provided by (used in) investing activities — (122,666) (50,909) — (173,575)Cash flows from financing activities:Proceeds from debt issuance 400,000 — — — 400,000Repayment of long term debt (435,000) — — — (435,000)Payment of debt issuance costs (7,630) — — — (7,630)Payment of debt extinguishment costs (26,214) — — — (26,214)Excess tax benefit from stock-basedcompensation (281) — — — (281)Intercompany advances, net 7,495 9,780 (17,275) — —
Net cash provided by (used in) financing activities(61,630) 9,780 (17,275) — (69,125)
Net change in cash and cash equivalents (51,969) 5,236 6,500 — (40,233)Cash and cash equivalents at beginning of year
88,697 8,310 51,682 — 148,689Cash and cash equivalents at end of year $ 36,728 $ 13,546 $ 58,182 $ — $ 108,456

84
Note 17 — Selected Quarterly Financial Data
QuarterYear 2016 First Second Third Fourth Total (Dollars in Thousands Except Per Share Amounts) (Unaudited)
Revenues $ 130,503 $ 105,287 $ 97,189 $ 94,025 $ 427,004Operating gross margin (loss) $ (13,428) $ (20,225) $ (21,965) $ (19,694) $ (75,312)Operating income (loss) $ (23,269) $ (28,222) $ (29,576) $ (30,190) $ (111,257)Net income (loss) attributable to controlling interest $ (95,835) $ (39,822) $ (46,228) $ (48,929) $ (230,814)Basic earnings per share — net income (loss) $ (0.78) $ (0.32) $ (0.37) $ (0.39) $ (1.86)Diluted earnings per share — net income (loss) $ (0.78) $ (0.32) $ (0.37) $ (0.39) $ (1.86) QuarterYear 2015 First Second Third Fourth Total (Dollars in Thousands Except Per Share Amounts) (Unaudited)
Revenues $ 204,076 $ 185,941 $ 173,418 $ 148,748 $ 712,183Operating gross margin (loss) $ 24,267 $ 4,021 $ 4,871 $ (3,460) $ 29,699Operating income (loss) $ 15,871 $ (7,944) $ (4,547) $ (20,718) $ (17,338)Net income (loss) attributable to controlling interest $ 3,222 $ (14,029) $ (48,620) $ (35,646) $ (95,073)Basic earnings per share — net income (loss) (1) $ 0.03 $ (0.11) $ (0.40) $ (0.29) $ (0.78)Diluted earnings per share — net income (loss) (1) $ 0.03 $ (0.11) $ (0.40) $ (0.29) $ (0.78)
(1) As a result of shares issued during the year, earnings (loss) per share for each of the year's four quarters, which are based on weighted average shares outstanding during each quarter, may not equal the annual earnings (loss) per share, which is based on the weighted average shares outstanding during the year. Additionally, as a result of rounding to the thousands, revenues, operating gross margin (loss), operating income (loss), and net income (loss) attributable to controlling interest may not equal the 2015 year to date results.

85
Note 18 — Recent Accounting Pronouncements
In October 2016, the FASB issued Accounting Standards Update (ASU) No. 2016-16, Income Taxes (Topic 740): Intra-Entity Transfers of Assets Other than Inventory. The ASU requires entities to recognize at the transaction date the income tax consequences of intercompany asset transfers other than inventory. The standard becomes effective for public companies for fiscal years beginning after December 15, 2017, including interim periods within those fiscal years. Early adoption is permitted, but only at the beginning of the annual period for which no financial statements have been issued or been made available for issuance. We have assessed the impact of the adoption of ASU 2016-16 on our consolidated statements of financial position, results of operations and cash flows, and we do not believe it will have a material impact.
In August 2016, the FASB issued ASU No. 2016-15, Statement of Cash Flows (Topic 230): Classification of Certain Cash Receipts and Cash Payments. The ASU is intended to reduce diversity in current practice regarding the manner in which certain cash receipts and cash payments are presented and classified in the cash flow statement. The standard becomes effective for public companies for fiscal years beginning after December 15, 2017, including interim periods within those fiscal years. Early adoption is permitted. We have assessed the impact of the adoption of ASU 2016-15 on our statement of cash flows, and we do not believe it will have a material impact.
In March 2016, the FASB issued ASU No. 2016-09, Compensation - Stock Compensation (Topic 718). The objective of this update is to simplify several aspects of the accounting for share-based payment transactions, including the income tax consequences, classification of awards as either equity or liabilities, and classification on the statement of cash flows. The standard becomes effective for public companies for fiscal years beginning after December 15, 2016, including interim periods within those fiscal years. Early adoption is permitted. We have assessed the impact of the adoption of ASU 2016-09 on our consolidated statements of financial position, results of operations and cash flows, and we do not believe it will have a material impact.
In May 2014, the FASB issued ASU 2014-09, Revenue from Contracts with Customers (Topic 606). This ASU supersedes the revenue recognition requirements in ASC 605 - Revenue Recognition and most industry-specific guidance throughout the Codification. The standard requires that an entity recognize revenue to depict the transfer of promised goods or services to customers in an amount that reflects the consideration to which the company expects to be entitled in exchange for those goods or services and should be applied retrospectively to each prior reporting period presented or retrospectively with the cumulative effect of initially applying the ASU recognized at the date of initial application. ASU 2014-09 is effective for fiscal years beginning after December 15, 2017, including interim periods within those fiscal years. At this time we expect to apply the modified retrospective approach; however, we are evaluating the requirements to determine the effect such requirements may have on our consolidated statements of financial position, results of operations, cash flows and on the disclosures contained in our notes to the consolidated financial statements upon the adoption of ASU 2014-09. Depending on the results of the evaluation our ultimate conclusions may vary.
In March 2016, the FASB issued ASU No. 2016-02, Leases (Topic 842). Effective no later than January 1, 2019, we will adopt this accounting standards update that (a) requires lessees to recognize a right to use asset and a lease liability for virtually all leases, and (b) updates previous accounting standards for lessors to align certain requirements with the updates to lessee accounting standards and the revenue recognition accounting standards. The standard is effective for fiscal years beginning after December 15, 2018, including interim periods within those fiscal years, although early adoption is permitted. This update establishes a new lease accounting model for lessees. Upon adoption, a modified retrospective approach is required for leases that exist, or are entered into, after the beginning of the earliest comparative period presented. Under the updated accounting standard, we have determined that our drilling contracts may contain a lease component; therefore, our adoption of the standard could require that we separately recognize revenues associated with the lease and service components. Given the interaction between this update and the accounting standards update to revenue contracts with customers, we expect to adopt the updates concurrently, effective January 1, 2018, and we expect to apply the modified retrospective approach. Our adoption, and the ultimate effect on our consolidated financial statements, will be based on an evaluation of the contract-specific facts and circumstances, and such effect could introduce variability to the timing of our revenue recognition relative to current accounting standards. We are evaluating the requirements to determine the effect such requirements may have on our consolidated statements of financial position, results of operations, cash flows and on the disclosures contained in our notes to the consolidated financial statements upon the adoption of ASU 2016-02. Depending on the results of the evaluation our ultimate conclusions may vary.
In August 2014, the FASB issued ASU No. 2014-15, Presentation of Financial Statements - Going Concern (Subtopic 205-40). The objective of this update is to provide guidance about management's responsibility to evaluate whether there is substantial doubt about an entity's ability to continue as a going concern and provide footnote disclosures. The amendments in this update become effective for public companies for the annual period after December 15, 2016, and for annual periods and interim periods thereafter. Early application is permitted. We have assessed the impact of the adoption of ASU 2014-15 on our consolidated statements of financial position, results of operations, cash flows, and on the disclosures contained in our notes to the consolidated financial statements, and we do not believe it will have a material impact.

86
Note 19 — Subsequent Events
On January 4, 2017, the Company announced that David R. Farmer, senior vice president - Europe, Middle East and Asia and Philip L. Agnew, senior vice president and chief technical officer, both left the Company effective January 1, 2017. Additionally, Philip A. Schlom, vice president, global compliance and internal audit, resigned effective December 31, 2016.
Item 9. Changes in and Disagreements with Accountants on Accounting and Financial Disclosure
None.
Item 9A. Controls and Procedures
Management's Evaluation of Disclosure Controls and Procedures
In accordance with Rules 13a-15 and 15d-15 under the Securities Exchange Act of 1934, as amended (the Exchange Act), we carried out an evaluation, under the supervision and with the participation of management, including our Chief Executive Officer and Chief Financial Officer, of the effectiveness of our disclosure controls and procedures as of the end of the period covered by this report. Based on that evaluation, our Chief Executive Officer and Chief Financial Officer concluded that our disclosure controls and procedures were effective as of December 31, 2016 to provide reasonable assurance that information required to be disclosed in our reports filed or submitted under the Exchange Act is (1) accumulated and communicated to our management, including our Chief Executive Officer and our Chief Financial Officer, to allow timely decisions regarding required disclosure and is (2) recorded, processed, summarized and reported within the time periods specified in the Securities and Exchange Commission’s rules and forms.
Management’s Annual Report on Internal Control over Financial Reporting
The Company’s management is responsible for establishing and maintaining adequate internal control over financial reporting, as defined in Rules 13a-15(f) and 15d-15(f) of the Exchange Act. Our internal control over financial reporting is designed to provide reasonable assurance regarding the reliability of financial reporting and the preparation of financial statements for external purposes in accordance with accounting principles generally accepted in the United States. Our internal control over financial reporting includes those policies and procedures that:
• pertain to the maintenance of records that, in reasonable detail, accurately and fairly reflect the transactions and dispositions of the assets of the Company;
• provide reasonable assurance transactions are recorded as necessary to permit preparation of financial statements in accordance with accounting principles generally accepted in the United States,
• provide reasonable assurance that receipts and expenditures of the Company are being made only in accordance with authorization of management and directors of the Company; and
• provide reasonable assurance regarding prevention or timely detection of unauthorized acquisition, use or disposition of the Company’s assets that could have a material effect on the financial statements.
Because of its inherent limitations, internal control over financial reporting may not prevent or detect misstatements. Also, projections of any evaluation of effectiveness to future periods are subject to risk that controls may become inadequate because of changes in conditions, or the degree of compliance with the policies or procedures may deteriorate.
The Company’s management with the participation of the chief executive officer and chief financial officer assessed the effectiveness of our internal control over financial reporting as of December 31, 2016 based on criteria established in Internal Control — Integrated Framework (2013) issued by the Committee of Sponsoring Organizations of the Treadway Commission (COSO). Management’s assessment included evaluation of the design and testing of the operational effectiveness of our internal control over financial reporting. Management reviewed the results of its assessment with the audit committee of the board of directors.
Based on that assessment and those criteria, management has concluded that our internal control over financial reporting was effective as of December 31, 2016.
KPMG LLP, our independent registered public accounting firm that audited the consolidated financial statements included in this Annual Report on Form 10-K, has issued a report with respect to our internal control over financial reporting as of December 31, 2016.

87
Changes in Internal Control Over Financial Reporting
There have been no changes in our internal control over financial reporting (as defined in Rules 13a-15(f) and 15d-15(f) under the Exchange Act) during our most recent fiscal quarter that have materially affected, or are reasonably likely to materially affect, our internal control over financial reporting.
Item 9B. Other Information
None.
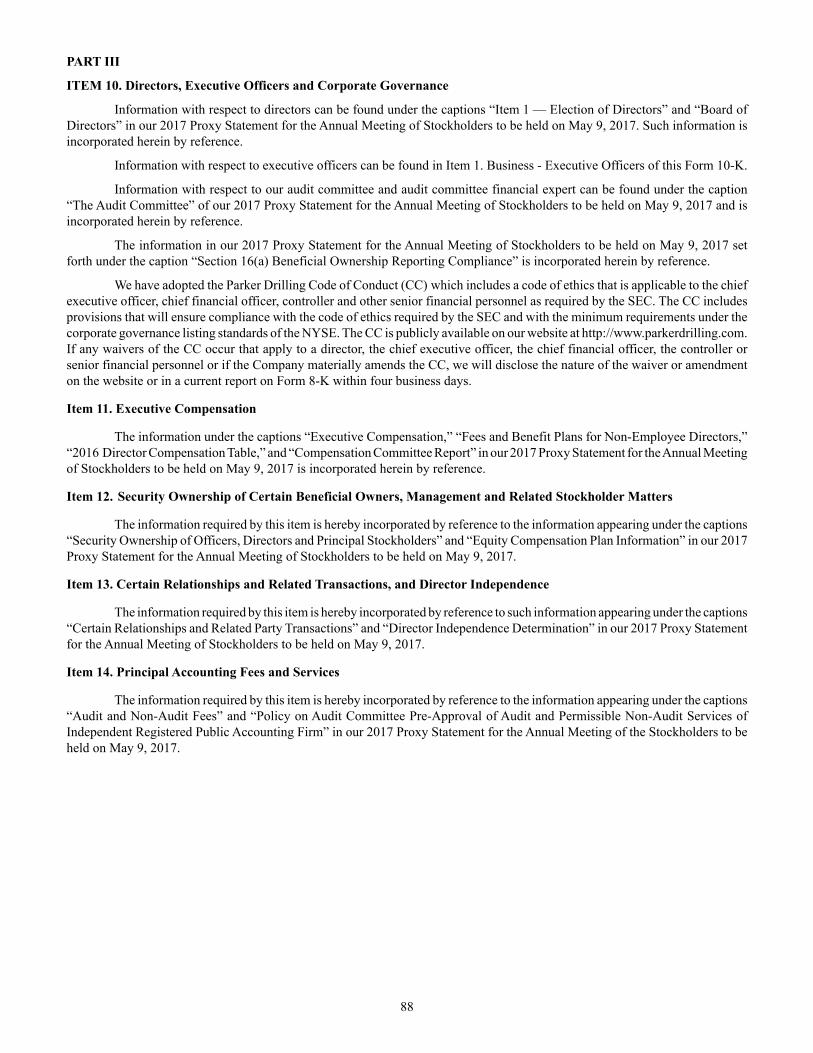
88
PART III
ITEM 10. Directors, Executive Officers and Corporate Governance
Information with respect to directors can be found under the captions “Item 1 — Election of Directors” and “Board of Directors” in our 2017 Proxy Statement for the Annual Meeting of Stockholders to be held on May 9, 2017. Such information is incorporated herein by reference.
Information with respect to executive officers can be found in Item 1. Business - Executive Officers of this Form 10-K.
Information with respect to our audit committee and audit committee financial expert can be found under the caption “The Audit Committee” of our 2017 Proxy Statement for the Annual Meeting of Stockholders to be held on May 9, 2017 and is incorporated herein by reference.
The information in our 2017 Proxy Statement for the Annual Meeting of Stockholders to be held on May 9, 2017 set forth under the caption “Section 16(a) Beneficial Ownership Reporting Compliance” is incorporated herein by reference.
We have adopted the Parker Drilling Code of Conduct (CC) which includes a code of ethics that is applicable to the chief executive officer, chief financial officer, controller and other senior financial personnel as required by the SEC. The CC includes provisions that will ensure compliance with the code of ethics required by the SEC and with the minimum requirements under the corporate governance listing standards of the NYSE. The CC is publicly available on our website at http://www.parkerdrilling.com. If any waivers of the CC occur that apply to a director, the chief executive officer, the chief financial officer, the controller or senior financial personnel or if the Company materially amends the CC, we will disclose the nature of the waiver or amendment on the website or in a current report on Form 8-K within four business days.
Item 11. Executive Compensation
The information under the captions “Executive Compensation,” “Fees and Benefit Plans for Non-Employee Directors,” “2016 Director Compensation Table,” and “Compensation Committee Report” in our 2017 Proxy Statement for the Annual Meeting of Stockholders to be held on May 9, 2017 is incorporated herein by reference.
Item 12. Security Ownership of Certain Beneficial Owners, Management and Related Stockholder Matters
The information required by this item is hereby incorporated by reference to the information appearing under the captions “Security Ownership of Officers, Directors and Principal Stockholders” and “Equity Compensation Plan Information” in our 2017Proxy Statement for the Annual Meeting of Stockholders to be held on May 9, 2017.
Item 13. Certain Relationships and Related Transactions, and Director Independence
The information required by this item is hereby incorporated by reference to such information appearing under the captions “Certain Relationships and Related Party Transactions” and “Director Independence Determination” in our 2017 Proxy Statement for the Annual Meeting of Stockholders to be held on May 9, 2017.
Item 14. Principal Accounting Fees and Services
The information required by this item is hereby incorporated by reference to the information appearing under the captions “Audit and Non-Audit Fees” and “Policy on Audit Committee Pre-Approval of Audit and Permissible Non-Audit Services of Independent Registered Public Accounting Firm” in our 2017 Proxy Statement for the Annual Meeting of the Stockholders to be held on May 9, 2017.

89
PART IV
Item 15. Exhibits and Financial Statement Schedules
(a) The following documents are filed as part of this report:
(1) Financial Statements of Parker Drilling Company and subsidiaries which are included in Part II, Item 8:
Page
Report of Independent Registered Public Accounting FirmConsolidated Statement of Operations for the years ended December 31, 2016, 2015 and 2014Consolidated Statement of Comprehensive Income for the years ended December 31, 2016, 2015 and 2014Consolidated Balance Sheet as of December 31, 2016 and 2015Consolidated Statement of Cash Flows for the years ended December 31, 2016, 2015 and 2014Consolidated Statement of Stockholders’ Equity for the years ended December 31, 2016, 2015 and 2014Notes to the Consolidated Financial Statements
(2) Financial Statement Schedule: Schedule II — Valuation and qualifying accounts
(3) Exhibits:
ExhibitNumber Description
2.1 — Sale and Purchase Agreement, dated April 22, 2013, among ITS Tubular Services (Holdings) Limited, asSeller, Ian David Green, John Bruce Cartwright and Graham Douglas Frost, as joint administrators of theSeller, ITS Holdings, Inc. and PD International Holdings C.V., Parker Drilling Offshore Corporation andParker Drilling Company (Incorporated by reference to Exhibit 10.1 to Parker Drilling Company's CurrentReport on Form 8-K filed on April 23, 2013).
3.1 — Restated Certificate of Incorporation of the Company, as amended on May 16, 2007 (incorporated byreference to Exhibit 3.1 to the Company’s Quarterly Report on Form 10-Q filed on November 9, 2007).
3.2 — By-laws of Parker Drilling Company, as amended and restated as of July 31, 2014 (Incorporated byreference to Exhibit 3.1 to Parker Drilling Company's Current Report on Form 8-K filed on August 1,2014).
4.1 — Indenture, dated July 30, 2013, between Parker Drilling Company, the subsidiary guarantors from time totime parties hereto, as, collectively, Guarantors, and The Bank of New York Mellon Trust Company, N.A.as Trustee (Incorporated by reference to Exhibit 10.3 to Parker Drilling Company's Current Report on Form8-K filed on July 25, 2013).
4.2 — Form of 7.500% Senior Note due 2020 (incorporated by reference to Exhibit 4.2 to the Company's CurrentReport on Form 8-K filed on July 31, 2013).
4.3 — Indenture, dated January 22, 2014, among Parker Drilling Company, the Guarantors and The Bank of NewYork Mellon Trust Company, N.A., as trustee (incorporated by reference to Exhibit 4.2 to the Company'sCurrent Report on Form 8-K filed on January 28, 2014).
4.4 — Form of 6.750% Senior Note due 2018 (incorporated by reference to Exhibit 4.3 to the Company's CurrentReport on Form 8-K filed on January 28, 2014).
10.1 — Parker Drilling Company Incentive Compensation Plan (as amended and restated effective January 1, 2009)(incorporated by reference to Exhibit 10.4 to the Company’s Annual Report on Form 10-K filed onMarch 1, 2011).*
10.2 — Parker Drilling Company 2010 Long-Term Incentive Plan (as amended and restated effective May 8, 2013)(incorporated by reference to Annex A to the Company’s Definitive Proxy Statement filed on March 28,2013).*
44454647484950
93

90
10.3 — Form of Parker Drilling Company Restricted Stock Unit Incentive Agreement under the 2010 LTIP (asamended and restated effective May 8, 2013) (incorporated by reference to Exhibit 10.6 to the Company'sAnnual Report on Form 10-K filed on February 25, 2015).*
10.4 — Form of Parker Drilling Company Performance Stock Unit Award Incentive Agreement under the 2010LTIP (as amended and restated effective May 8, 2013) (incorporated by reference to Exhibit 10.7 to theCompany's Annual Report on Form 10-K filed on February 25, 2015).*
10.5 — Form of Parker Drilling Company Performance Cash Unit Award Incentive Agreement under the 2010LTIP (as amended and restated effective May 8, 2013) (incorporated by reference to Exhibit 10.8 to theCompany's Annual Report on Form 10-K filed on February 25, 2015).*
10.6 — Form of Parker Drilling Company Performance-Based Phantom Stock Unit Award Incentive Agreementunder the 2010 LTIP (as amended and restated effective May 8, 2013) (incorporated by reference to Exhibit10.1 to the Company's Annual Report on Form 10-K filed on February 24, 2016).*
10.7 — Form of Parker Drilling Company Time-Based Phantom Stock Unit Award Incentive Agreement under the2010 LTIP (as amended and restated effective May 8, 2013).*
10.8 — Parker Drilling Company 2010 Long-Term Incentive Plan (as amended and restated as of May 10, 2016)(incorporated by reference to Appendix A of the Company's Notice of Annual Meeting of Stockholders andProxy Statement filed on March 31, 2016).*
10.9 — Form of Parker Drilling Company Restricted Stock Unit Incentive Agreement under the 2010 LTIP (asamended as of May 10, 2016).*
10.10 — Form of Indemnification Agreement entered into between Parker Drilling Company and each director andexecutive officer of Parker Drilling Company (incorporated by reference to Exhibit 10(g) to the Company’sAnnual Report on Form 10-K filed on March 20, 2003).*
10.11 — Employment Agreement dated December 6, 2010 between Parker Drilling Company and Philip Agnew(incorporated by reference to Exhibit 10.10 to the Company's Annual Report on Form 10-K filed onFebruary 25, 2015).*
10.12 — Employment Agreement between Mr. Jon-Al Duplantier and Parker Drilling Company, effective March 21,2011 (incorporated by reference to Exhibit 10.2 to the Company’s Current Report on Form 8-K filed onMarch 25, 2011).*
10.13 — Employment Agreement dated August 15, 2011 between Parker Drilling Company and David Farmer(incorporated by reference to Exhibit 10.12 to the Company's Annual Report on Form 10-K filed onFebruary 25, 2015).*
10.14 — First Amendment dated August 29, 2011 to Employment Agreement between Parker Drilling Company andPhilip Agnew (incorporated by reference to Exhibit 10.13 to the Company's Annual Report on Form 10-Kfiled on February 25, 2015).*
10.15 — First Amendment dated August 29, 2011 to Employment Agreement between Mr. Jon-Al Duplantier andParker Drilling Company, effective March 21, 2011 (incorporated by reference to Exhibit 10.4 to theCompany’s Current Report on Form 8-K filed on August 30, 2011).*
10.16 — Employment Agreement, dated as of September 17, 2012, by and between Parker Drilling Company andGary Rich (incorporated by reference to Exhibit 10.23 to the Company’s Current Report on Form 8-K filedon September 24, 2012).*
10.17 — Employment Agreement dated May 3, 2013 between Parker Drilling Company and Christopher Weber(incorporated by reference to Exhibit 10.1 to Parker Drilling Company's Current Report on Form 8-K filedon May 14, 2013).*
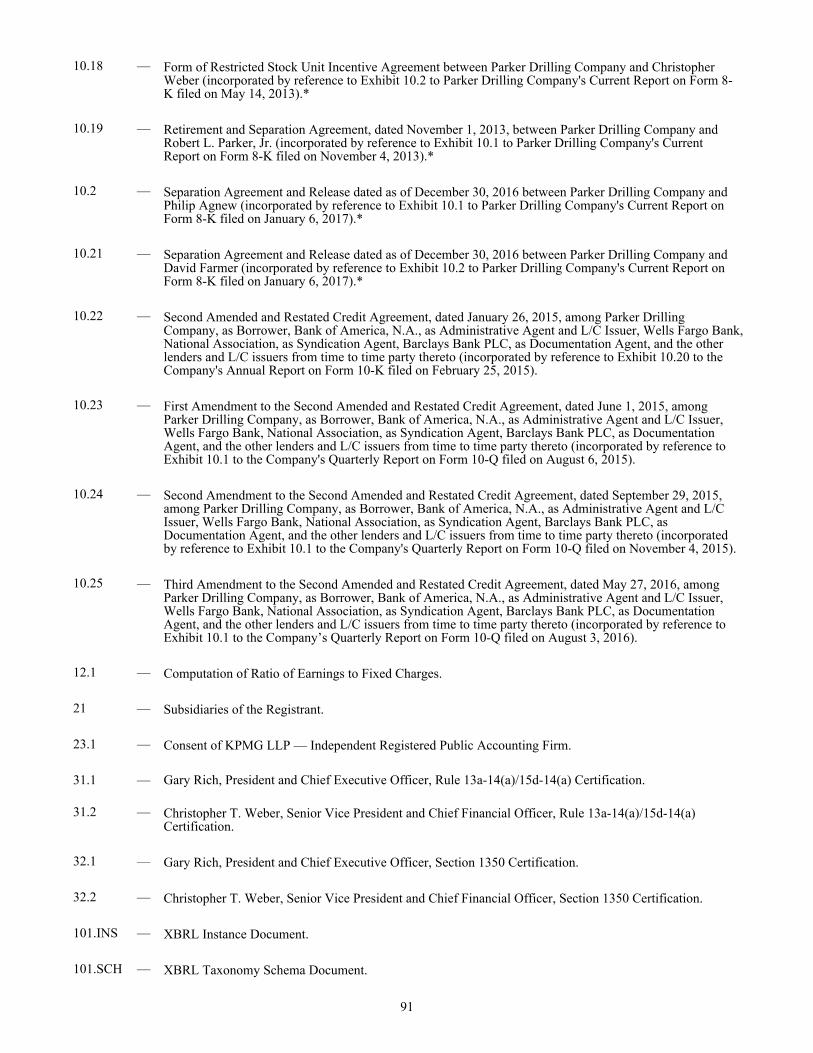
91
10.18 — Form of Restricted Stock Unit Incentive Agreement between Parker Drilling Company and ChristopherWeber (incorporated by reference to Exhibit 10.2 to Parker Drilling Company's Current Report on Form 8-K filed on May 14, 2013).*
10.19 — Retirement and Separation Agreement, dated November 1, 2013, between Parker Drilling Company andRobert L. Parker, Jr. (incorporated by reference to Exhibit 10.1 to Parker Drilling Company's CurrentReport on Form 8-K filed on November 4, 2013).*
10.2 — Separation Agreement and Release dated as of December 30, 2016 between Parker Drilling Company andPhilip Agnew (incorporated by reference to Exhibit 10.1 to Parker Drilling Company's Current Report onForm 8-K filed on January 6, 2017).*
10.21 — Separation Agreement and Release dated as of December 30, 2016 between Parker Drilling Company andDavid Farmer (incorporated by reference to Exhibit 10.2 to Parker Drilling Company's Current Report onForm 8-K filed on January 6, 2017).*
10.22 — Second Amended and Restated Credit Agreement, dated January 26, 2015, among Parker DrillingCompany, as Borrower, Bank of America, N.A., as Administrative Agent and L/C Issuer, Wells Fargo Bank,National Association, as Syndication Agent, Barclays Bank PLC, as Documentation Agent, and the otherlenders and L/C issuers from time to time party thereto (incorporated by reference to Exhibit 10.20 to theCompany's Annual Report on Form 10-K filed on February 25, 2015).
10.23 — First Amendment to the Second Amended and Restated Credit Agreement, dated June 1, 2015, amongParker Drilling Company, as Borrower, Bank of America, N.A., as Administrative Agent and L/C Issuer,Wells Fargo Bank, National Association, as Syndication Agent, Barclays Bank PLC, as DocumentationAgent, and the other lenders and L/C issuers from time to time party thereto (incorporated by reference toExhibit 10.1 to the Company's Quarterly Report on Form 10-Q filed on August 6, 2015).
10.24 — Second Amendment to the Second Amended and Restated Credit Agreement, dated September 29, 2015,among Parker Drilling Company, as Borrower, Bank of America, N.A., as Administrative Agent and L/CIssuer, Wells Fargo Bank, National Association, as Syndication Agent, Barclays Bank PLC, asDocumentation Agent, and the other lenders and L/C issuers from time to time party thereto (incorporatedby reference to Exhibit 10.1 to the Company's Quarterly Report on Form 10-Q filed on November 4, 2015).
10.25 — Third Amendment to the Second Amended and Restated Credit Agreement, dated May 27, 2016, amongParker Drilling Company, as Borrower, Bank of America, N.A., as Administrative Agent and L/C Issuer,Wells Fargo Bank, National Association, as Syndication Agent, Barclays Bank PLC, as DocumentationAgent, and the other lenders and L/C issuers from time to time party thereto (incorporated by reference toExhibit 10.1 to the Company’s Quarterly Report on Form 10-Q filed on August 3, 2016).
12.1 — Computation of Ratio of Earnings to Fixed Charges.
21 — Subsidiaries of the Registrant.
23.1 — Consent of KPMG LLP — Independent Registered Public Accounting Firm.
31.1 — Gary Rich, President and Chief Executive Officer, Rule 13a-14(a)/15d-14(a) Certification.
31.2 — Christopher T. Weber, Senior Vice President and Chief Financial Officer, Rule 13a-14(a)/15d-14(a)Certification.
32.1 — Gary Rich, President and Chief Executive Officer, Section 1350 Certification.
32.2 — Christopher T. Weber, Senior Vice President and Chief Financial Officer, Section 1350 Certification.
101.INS — XBRL Instance Document.
101.SCH — XBRL Taxonomy Schema Document.

92
101.CAL — XBRL Calculation Linkbase Document.
101.LAB — XBRL Label Linkbase Document.
101.PRE — XBRL Presentation Linkbase Document.
101.DEF — XBRL Definition Linkbase Document.____________________________
* — Management contract, compensatory plan or agreement.

93
PARKER DRILLING COMPANY AND SUBSIDIARIES
Schedule II—Valuation and Qualifying Accounts
Classifications
Balance atbeginning
of year
Charged tocost andexpenses
Chargedto otheraccounts Deductions
Balance at end ofyear
Dollars in Thousands
Year Ended December 31, 2016Allowance for bad debt $ 8,694 $ 1,483 $ 4 $ (1,922) $ 8,259Allowance for obsolete rig materials and supplies $ 626 978 $ (3) $ (435) $ 1,166Deferred tax valuation allowance $ 51,105 $ 117,707 $ 2,321 $ — $ 171,133
Year Ended December 31, 2015Allowance for bad debt $ 11,188 $ 341 $ (825) $ (2,010) $ 8,694Allowance for obsolete rig materials and supplies $ 530 — $ 236 $ (140) $ 626Deferred tax valuation allowance $ 9,922 $ 40,676 $ 507 $ — $ 51,105
Year Ended December 31, 2014Allowance for bad debt $ 12,853 $ 5,248 $ — $ (6,913) $ 11,188Allowance for obsolete rig materials and supplies $ 3,445 $ — $ 1 $ (2,916) $ 530Deferred tax valuation allowance $ 6,827 $ 2,800 $ 295 $ — $ 9,922

94
SIGNATURES
Pursuant to the requirements of the Securities Exchange Act of 1934, the Registrant has duly caused this report to be signed on its behalf by the undersigned hereunto duly authorized.
PARKER DRILLING COMPANY
By: /s/ Christopher T. WeberChristopher T. WeberSenior Vice President and Chief Financial Officer
Date: February 21, 2017
Pursuant to the requirements of the Securities Exchange Act of 1934, this report has been signed below by the following persons on behalf of the Registrant and in the capacities and on the dates indicated.
Signature Title Date
By: /s/ Gary G. Rich Chairman, President, and Chief Executive Officer(Principal Executive Officer)
February 21, 2017Gary G. Rich
By: /s/ Christopher T. Weber Senior Vice President and Chief Financial Officer (Principal Financial Officer)
February 21, 2017Christopher T. Weber
By: /s/ Leslie K. Nagy Controller and Principal Accounting Officer (Principal Accounting Officer)
February 21, 2017Leslie K. Nagy
By: /s/ Jonathan M. Clarkson Director February 21, 2017Jonathan M. Clarkson
By: /s/ Peter T. Fontana Director February 21, 2017Peter T. Fontana
By: /s/ Gary R. King Director February 21, 2017Gary R. King
By: /s/ Robert L. Parker Jr. Director February 21, 2017Robert L. Parker Jr.
By: /s/ Richard D. Paterson Director February 21, 2017Richard D. Paterson
By: /s/ Roger B. Plank Director February 21, 2017Roger B. Plank
By: /s/ R. Rudolph Reinfrank Director February 21, 2017R. Rudolph Reinfrank
By: /s/ Zaki Selim Director February 21, 2017Zaki Selim

95
INDEX TO EXHIBITS
Exhibit Number Description
12.1 — Computation of Ratio of Earnings to Fixed Charges21 — Subsidiaries of the Registrant.23.1 — Consent of KPMG LLP — Independent Registered Public Accounting Firm.31.1 — Gary G. Rich, President and Chief Executive Officer, Rule 13a-14(a)/15d-14(a) Certification.31.2 — Christopher T. Weber, Senior Vice President and Chief Financial Officer, Rule 13a-14(a)/15d-14(a)
Certification.32.1 — Gary G. Rich, President and Chief Executive Officer, Section 1350 Certification.32.2 — Christopher T. Weber, Senior Vice President and Chief Financial Officer, Section 1350 Certification.101.INS — XBRL Instance Document.101.SCH — XBRL Taxonomy Schema Document.101.CAL — XBRL Calculation Linkbase Document.101.LAB — XBRL Label Linkbase Document.101.PRE — XBRL Presentation Linkbase Document.101.DEF — XBRL Definition Linkbase Document.

BOARD OF DIRECTORS
Gary G. Rich Chairman of the Board of Directors, President and Chief Executive Officer Parker Drilling Company
Jonathan M. Clarkson Retired Chief Financial Officer Matrix Oil Corporation
Peter T. Fontana Retired Chief Operating Officer Weatherford International
Gary R. King Managing Partner Matrix Partnership
Robert L. Parker, Jr. Retired Chairman Parker Drilling Company
Richard D. Paterson Retired Managing Partner PriceWaterhouseCoopers, LLP
Roger B. Plank Chief Executive Officer Apex International Energy, LLC
R. Rudolph Reinfrank Managing General Partner Riverford Partners, LLC
Zaki Selim Retired President of Oilfield Services Middle East and Asia Schlumberger Limited
CEO AND CFO CERTIFICATIONS
Parker Drilling Company submitted the annual CEO certification to the NYSE as required under the corporate governance rules of the NYSE. Parker Drilling Company also filed as an exhibit to its 2016 Annual Report on Form 10-K the CEO and CFO certifications required under Section 302 of the Sarbanes-Oxley Act of 2002.
EXECUTIVE OFFICERS
Gary G. Rich Chairman of the Board of Directors, President and Chief Executive Officer
Christopher T. Weber Senior Vice President and Chief Financial Officer
Jon-Al Duplantier Senior Vice President, Chief Administrative Officer and General Counsel
Bryan R. Collins President, Drilling Operations
OTHER OFFICERS
Leslie K. Nagy Principal Accounting Officer and Controller
David W. Tucker Treasurer
PERFORMANCE GRAPH
The following performance graph compares cumulative total shareholder returns on Parker Drilling Company’s common stock to the Philadelphia Oil Service Index (Philadelphia OSX) and the Russell 2000 stock index, calculated as of the end of each year during the period beginning December 31, 2011 and ending on December 31, 2016. The graph assumes $100 was invested on December 31, 2011 in the Company’s common stock and in each of the referenced indices.
CORPORATE INFORMATION
Corporate Headquarters Parker Drilling Company 5 Greenway Plaza, Suite 100 Houston, Texas 77046 Telephone: 281.406.2000 www.parkerdrilling.com
Notice of Annual Meeting The Annual Meeting of Stockholders will be held at 9 A.M. CDT May 9, 2017 DoubleTree by Hilton Hotel–Greenway Plaza 6 East Greenway Plaza Houston, Texas 77046
Investor Relations and Information Requests Copies of Parker Drilling Company’s Annual Report, its Annual Report on Form 10-K and Quarterly Reports on Form 10-Q to the Securities and Exchange Commission, and quarterly earnings releases are available on www.parkerdrilling.com or by contacting Investor Relations:
Jason Geach Vice President, Investor Relations and Corporate Development
Parker Drilling Company 5 Greenway Plaza, Suite 100 Houston, Texas 77046 Telephone: 281.406.2310 Email: [email protected]
Transfer Agent and Registrar Stockholders should refer specific questions concerning stock certificates directly to the stock transfer agent and registrar, Wells Fargo Bank N.A., at the address and phone number shown below:
Wells Fargo Bank, N.A. Shareowner Services P.O. Box 64854 St. Paul, Minnesota 55164-0854 Toll-Free 800.468.9716
Independent Auditors KPMG LLP 811 Main Street, Suite 4400 Houston, Texas 77002
Stock Exchange Listing Shares of Parker Drilling Company common stock are listed and traded on the New York Stock Exchange. The trading symbol is PKD.
