parker drilling company...wholly-owned subsidiaries, and “parker drilling” refers solely to the...
TRANSCRIPT

UNITED STATESSECURITIES AND EXCHANGE COMMISSION
Washington, D.C. 20549
FORM 10-Q(Mark One)
☑ QUARTERLY REPORT PURSUANT TO SECTION 13 OR 15 (d) OF THE SECURITIES EXCHANGE ACT OF 1934For The Quarterly Period Ended September 30, 2019
Or
☐ TRANSITION REPORT PURSUANT TO SECTION 13 OR 15 (d) OF THE SECURITIES EXCHANGE ACT OF 1934For the transition period from to
Commission File Number 1-7573
PARKER DRILLING COMPANY(Exact name of registrant as specified in its charter)
Delaware 73-0618660(State or other jurisdiction of incorporation or organization) (I.R.S. Employer Identification No.)
5 Greenway Plaza, Suite 100, Houston, Texas 77046(Address of principal executive offices) (Zip Code)
(281) 406-2000(Registrant’s telephone number, including area code)
Securities registered pursuant to Section 12(b) of the Act:
Title of each class Trading symbol Name of each exchange on which registeredCommon Stock, par value $0.01 per share PKD New York Stock Exchange
Indicate by check mark whether the registrant (1) has filed all reports required to be filed by Section 13 or 15(d) of the Securities Exchange Act of 1934 during the preceding12 months (or for such shorter period that the registrant was required to file such reports), and (2) has been subject to such filing requirements for the past90 days. Yes x No ¨
Indicate by check mark whether the registrant has submitted electronically every Interactive Data File required to be submitted pursuant to Rule 405 of Regulation S-T(§232.405 of this chapter) during the preceding 12 months (or for such shorter period that the registrant was required to submit such files). Yes x No ¨
Indicate by check mark whether the registrant is a large accelerated filer, an accelerated filer, a non-accelerated filer, a smaller reporting company, or emerging growthcompany. See the definitions of “large accelerated filer,” “accelerated filer”, “smaller reporting company” and “emerging growth company” in Rule 12b-2 of the ExchangeAct.:
Large accelerated filer ☐ Accelerated filer ☑ Non-accelerated filer ☐ Smaller reporting company ☑ Emerging growth company ☐
If an emerging growth company, indicate by check mark if the registrant has elected not to use the extended transition period for complying with any new or revised financialaccounting standards provided pursuant to Section 13(a) of the Exchange Act. ☐
Indicate by check mark whether the registrant is a shell company (as defined in Rule 12b-2 of the Exchange Act). Yes ☐ No ☒
Indicate by check mark whether the registrant has filed all documents and reports required to be filed by Sections 12, 13 or 15(d) of the Securities Exchange Act of 1934subsequent to the distribution of securities under a plan confirmed by a court. Yes ☒ No ☐
As of November 1, 2019 there were 15,044,739 common shares outstanding.

Table of Contents
TABLE OF CONTENTS
Page
Part I. Financial Information Item 1. Financial Statements 3
Consolidated Condensed Balance Sheets 3Consolidated Condensed Statements of Operations 5Consolidated Condensed Statements of Comprehensive Income (Loss) 7Consolidated Condensed Statements of Cash Flows 8Consolidated Condensed Statement of Stockholders’ Equity 9Notes to the Unaudited Consolidated Condensed Financial Statements 11
Item 2. Management’s Discussion and Analysis of Financial Condition and Results of Operations 45Item 3. Quantitative and Qualitative Disclosures about Market Risk 63Item 4. Controls and Procedures 63
Part II. Other Information Item 1. Legal Proceedings 64Item 1A. Risk Factors 64Item 2. Unregistered Sales of Equity Securities and Use of Proceeds 64Item 3. Defaults Upon Senior Securities 64Item 4. Mine Safety Disclosures 64Item 5. Other Information 65Item 6. Exhibits 66Signatures 67
2

Table of Contents
PART I. FINANCIAL INFORMATION
Item 1. Financial Statements
PARKER DRILLING COMPANY AND SUBSIDIARIESCONSOLIDATED CONDENSED BALANCE SHEETS
(Dollars in Thousands, Except Per Share Data)
Successor Predecessor
September 30,
2019 December 31,
2018
(Unaudited)
ASSETS Current assets:
Cash and cash equivalents $ 101,106 $ 48,602Restricted cash — 10,389Accounts and notes receivable, net of allowance for bad debts of $80 at September 30, 2019 and $7,767 at December31, 2018 167,236 136,437Rig materials and supplies 22,367 36,245Other current assets 28,380 35,231
Total current assets 319,089 266,904Property, plant and equipment, net of accumulated depreciation of $37,341 at September 30, 2019 and $951,798 atDecember 31, 2018 297,213 534,371Intangible assets, net (Note 4) 15,117 4,821Deferred income taxes 4,608 2,143Other non-current assets 31,630 20,175
Total assets $ 667,657 $ 828,414LIABILITIES AND STOCKHOLDERS’ EQUITY
Current liabilities: Debtor in possession financing (Note 2) $ — $ 10,000Accounts payable and accrued liabilities 107,638 75,063Accrued income taxes 6,352 3,385
Total current liabilities 113,990 88,448Long-term debt (Note 6) 177,032 —
Other long-term liabilities 15,328 11,544
Long-term deferred tax liability 6,491 510Commitments and contingencies (Note 9)
Total liabilities not subject to compromise 312,841 100,502Liabilities subject to compromise (Note 2) — 600,996
Total liabilities 312,841 701,498
3

Table of Contents
PARKER DRILLING COMPANY AND SUBSIDIARIESCONSOLIDATED CONDENSED BALANCE SHEETS
(Dollars in Thousands, Except Per Share Data)
Successor Predecessor
September 30,
2019 December 31,
2018
(Unaudited)
Stockholders' equity: Predecessor preferred stock, $1.00 par value, 1,942,000 shares authorized, 500,000 shares issued and outstanding — 500Predecessor common stock, $0.16 2/3 par value, 18,666,667 shares authorized, 9,385,060 shares issued and outstanding(9,384,669 shares issued and outstanding in 2018) — 1,398Predecessor capital in excess of par value — 766,347Predecessor accumulated other comprehensive income (loss) — (6,879 )Successor common stock, $0.01 par value, 500,000,000 shares authorized, 15,044,739 shares issued and outstanding 150 —Successor capital in excess of par value 345,831 —Successor accumulated other comprehensive income (loss) 205 —Retained earnings (accumulated deficit) 8,630 (634,450 )
Total stockholders’ equity 354,816 126,916Total liabilities and stockholders’ equity $ 667,657 $ 828,414
See accompanying notes to the unaudited consolidated condensed financial statements.
4

Table of Contents
PARKER DRILLING COMPANY AND SUBSIDIARIESCONSOLIDATED CONDENSED STATEMENTS OF OPERATIONS
(Dollars in Thousands, Except Per Share Data)(Unaudited)
Successor Predecessor
Three Months Ended
September 30, Three Months Ended
September 30,
2019 2018
Revenues $ 160,083 $ 123,395Expenses:
Operating expenses 117,486 93,943Depreciation and amortization 20,329 27,520
137,815 121,463Total operating gross margin 22,268 1,932General and administrative expense (5,983 ) (14,495 )Loss on impairment — (43,990 )Gain (loss) on disposition of assets, net (92 ) 9Reorganization items (211 ) —Total operating income (loss) 15,982 (56,544 )Other income (expense):
Interest expense (7,118 ) (11,350 )Interest income 362 23Other (258 ) (709 )
Total other income (expense) (7,014 ) (12,036 )Income (loss) before income taxes 8,968 (68,580 )Income tax expense 4,979 2,371Net income (loss) 3,989 (70,951 )Less: Predecessor preferred stock dividend — 906Net income (loss) available to common stockholders $ 3,989 $ (71,857 )Basic earnings (loss) per common share: $ 0.27 $ (7.70 )Diluted earnings (loss) per common share: $ 0.27 $ (7.70 )Number of common shares used in computing earnings per share:
Basic 15,044,739 9,334,390Diluted 15,044,739 9,334,390
See accompanying notes to the unaudited consolidated condensed financial statements.
5
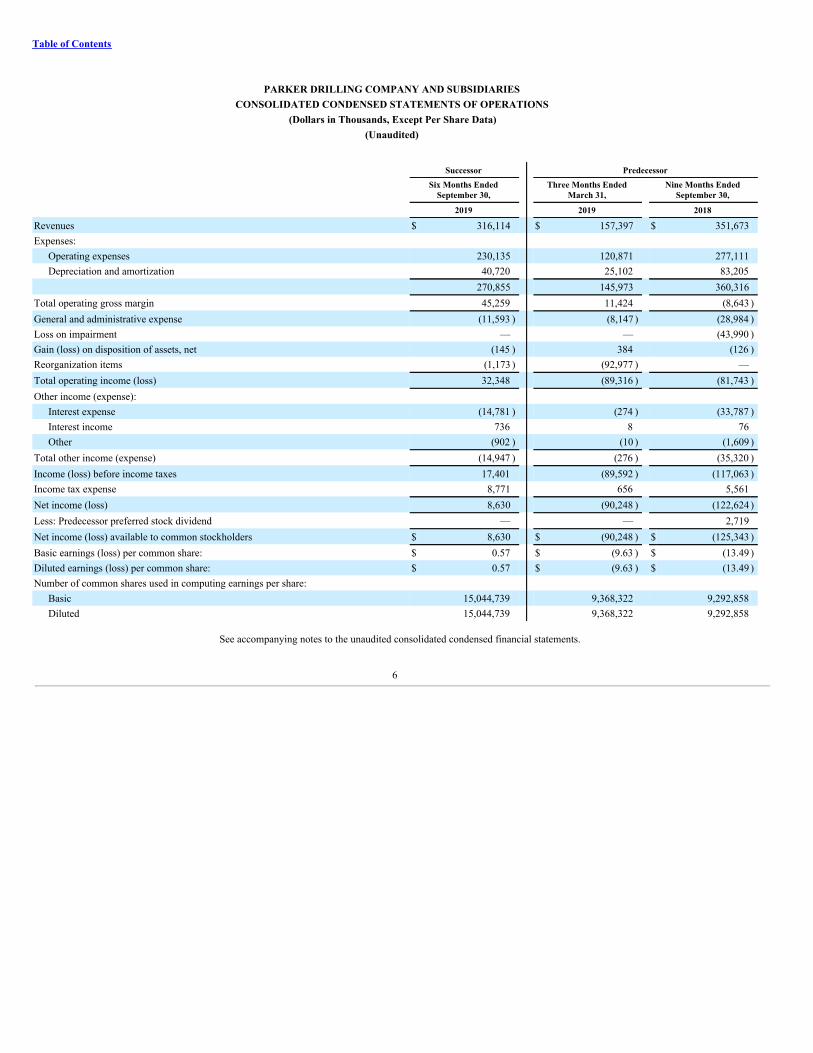
Table of Contents
PARKER DRILLING COMPANY AND SUBSIDIARIESCONSOLIDATED CONDENSED STATEMENTS OF OPERATIONS
(Dollars in Thousands, Except Per Share Data)(Unaudited)
Successor Predecessor
Six Months Ended
September 30, Three Months Ended
March 31, Nine Months Ended
September 30,
2019 2019 2018
Revenues $ 316,114 $ 157,397 $ 351,673Expenses:
Operating expenses 230,135 120,871 277,111Depreciation and amortization 40,720 25,102 83,205
270,855 145,973 360,316Total operating gross margin 45,259 11,424 (8,643 )General and administrative expense (11,593 ) (8,147 ) (28,984 )Loss on impairment — — (43,990 )Gain (loss) on disposition of assets, net (145 ) 384 (126 )Reorganization items (1,173 ) (92,977 ) —Total operating income (loss) 32,348 (89,316 ) (81,743 )Other income (expense):
Interest expense (14,781 ) (274 ) (33,787 )Interest income 736 8 76Other (902 ) (10 ) (1,609 )
Total other income (expense) (14,947 ) (276 ) (35,320 )Income (loss) before income taxes 17,401 (89,592 ) (117,063 )Income tax expense 8,771 656 5,561Net income (loss) 8,630 (90,248 ) (122,624 )Less: Predecessor preferred stock dividend — — 2,719Net income (loss) available to common stockholders $ 8,630 $ (90,248 ) $ (125,343 )Basic earnings (loss) per common share: $ 0.57 $ (9.63 ) $ (13.49 )Diluted earnings (loss) per common share: $ 0.57 $ (9.63 ) $ (13.49 )Number of common shares used in computing earnings per share:
Basic 15,044,739 9,368,322 9,292,858Diluted 15,044,739 9,368,322 9,292,858
See accompanying notes to the unaudited consolidated condensed financial statements.
6

Table of Contents
PARKER DRILLING COMPANY AND SUBSIDIARIESCONSOLIDATED CONDENSED STATEMENTS OF COMPREHENSIVE INCOME (LOSS)
(Dollars in Thousands)(Unaudited)
Successor Predecessor
Three Months Ended
September 30, Three Months Ended
September 30,
2019 2018
Net income (loss) $ 3,989 $ (70,951 )Other comprehensive income (loss), net of tax:
Currency translation difference on related borrowings (145 ) (315 )Currency translation difference on foreign currency net investments 502 162
Total other comprehensive income (loss), net of tax: 357 (153 )Comprehensive income (loss) $ 4,346 $ (71,104 )
See accompanying notes to the unaudited consolidated condensed financial statements.
PARKER DRILLING COMPANY AND SUBSIDIARIESCONSOLIDATED CONDENSED STATEMENTS OF COMPREHENSIVE INCOME (LOSS)
(Dollars in Thousands)(Unaudited)
Successor Predecessor
Six Months Ended
September 30, Three Months Ended
March 31, Nine Months Ended
September 30,
2019 2019 2018
Net income (loss) $ 8,630 $ (90,248 ) $ (122,624 )Other comprehensive income (loss), net of tax:
Currency translation difference on related borrowings (225 ) 141 (484 )Currency translation difference on foreign currency net investments 430 (518 ) (2,216 )
Total other comprehensive income (loss), net of tax: 205 (377 ) (2,700 )Comprehensive income (loss) $ 8,835 $ (90,625 ) $ (125,324 )
See accompanying notes to the unaudited consolidated condensed financial statements.
7
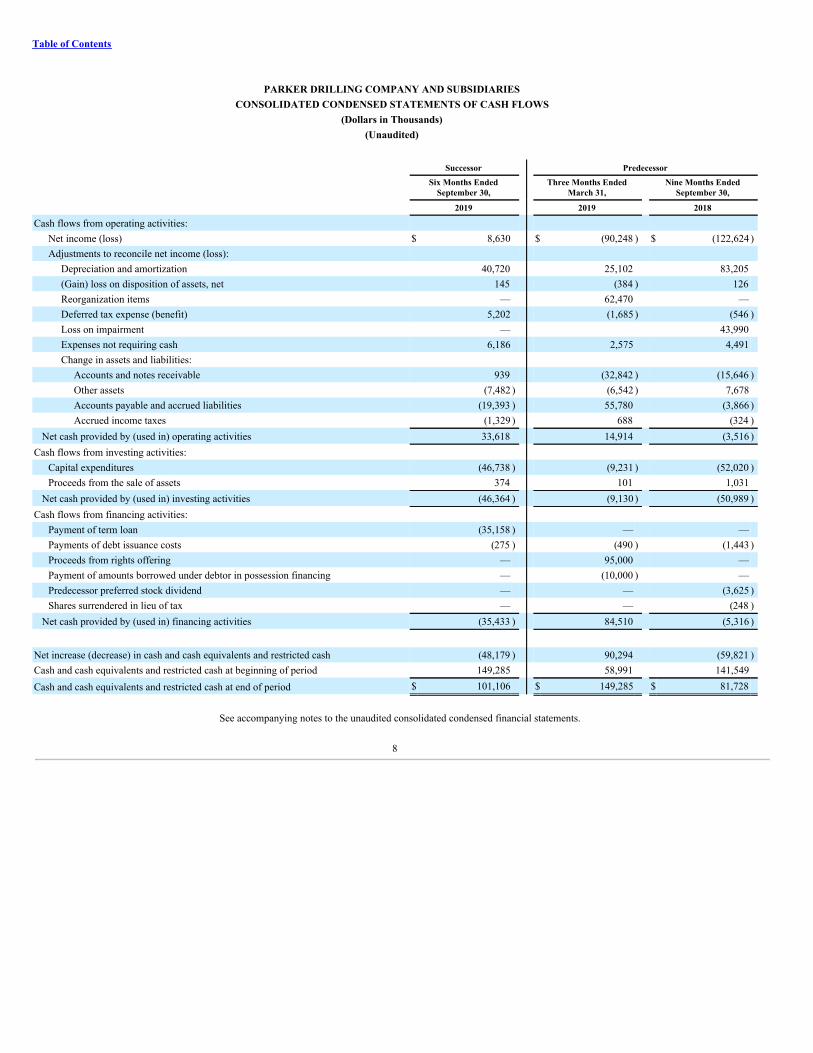
Table of Contents
PARKER DRILLING COMPANY AND SUBSIDIARIESCONSOLIDATED CONDENSED STATEMENTS OF CASH FLOWS
(Dollars in Thousands)(Unaudited)
Successor Predecessor
Six Months Ended
September 30, Three Months Ended
March 31, Nine Months Ended
September 30,
2019 2019 2018
Cash flows from operating activities: Net income (loss) $ 8,630 $ (90,248 ) $ (122,624 )Adjustments to reconcile net income (loss):
Depreciation and amortization 40,720 25,102 83,205(Gain) loss on disposition of assets, net 145 (384 ) 126Reorganization items — 62,470 —Deferred tax expense (benefit) 5,202 (1,685 ) (546 )Loss on impairment — 43,990Expenses not requiring cash 6,186 2,575 4,491Change in assets and liabilities:
Accounts and notes receivable 939 (32,842 ) (15,646 )Other assets (7,482 ) (6,542 ) 7,678Accounts payable and accrued liabilities (19,393 ) 55,780 (3,866 )Accrued income taxes (1,329 ) 688 (324 )
Net cash provided by (used in) operating activities 33,618 14,914 (3,516 )Cash flows from investing activities:
Capital expenditures (46,738 ) (9,231 ) (52,020 )Proceeds from the sale of assets 374 101 1,031
Net cash provided by (used in) investing activities (46,364 ) (9,130 ) (50,989 )Cash flows from financing activities:
Payment of term loan (35,158 ) — —Payments of debt issuance costs (275 ) (490 ) (1,443 )Proceeds from rights offering — 95,000 —Payment of amounts borrowed under debtor in possession financing — (10,000 ) —Predecessor preferred stock dividend — — (3,625 )Shares surrendered in lieu of tax — — (248 )
Net cash provided by (used in) financing activities (35,433 ) 84,510 (5,316 )
Net increase (decrease) in cash and cash equivalents and restricted cash (48,179 ) 90,294 (59,821 )Cash and cash equivalents and restricted cash at beginning of period 149,285 58,991 141,549Cash and cash equivalents and restricted cash at end of period $ 101,106 $ 149,285 $ 81,728
See accompanying notes to the unaudited consolidated condensed financial statements.
8
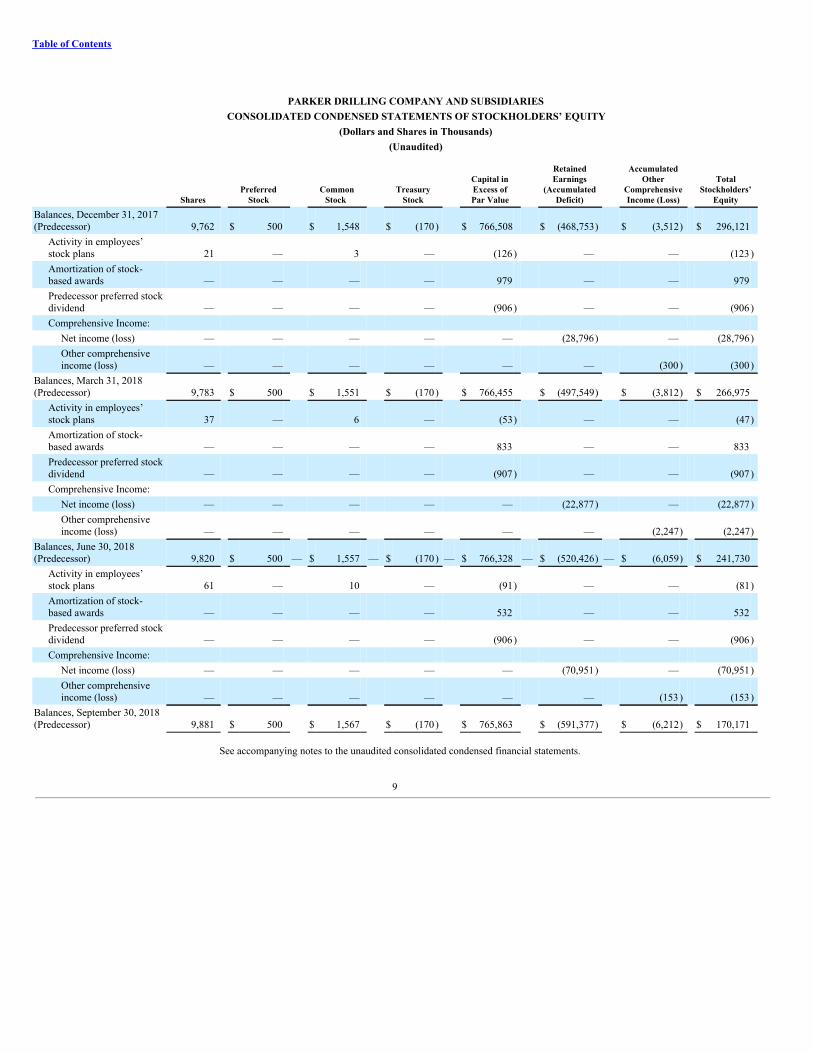
Table of Contents
PARKER DRILLING COMPANY AND SUBSIDIARIESCONSOLIDATED CONDENSED STATEMENTS OF STOCKHOLDERS’ EQUITY
(Dollars and Shares in Thousands)(Unaudited)
Shares Preferred
Stock Common
Stock Treasury
Stock
Capital inExcess ofPar Value
RetainedEarnings
(AccumulatedDeficit)
AccumulatedOther
ComprehensiveIncome (Loss)
TotalStockholders’
Equity
Balances, December 31, 2017(Predecessor) 9,762 $ 500 $ 1,548 $ (170) $ 766,508 $ (468,753) $ (3,512) $ 296,121
Activity in employees’stock plans 21 — 3 — (126) — — (123)Amortization of stock-based awards — — — — 979 — — 979Predecessor preferred stockdividend — — — — (906) — — (906)Comprehensive Income:
Net income (loss) — — — — — (28,796) — (28,796)Other comprehensiveincome (loss) — — — — — — (300) (300)
Balances, March 31, 2018(Predecessor) 9,783 $ 500 $ 1,551 $ (170) $ 766,455 $ (497,549) $ (3,812) $ 266,975
Activity in employees’stock plans 37 — 6 — (53) — — (47)Amortization of stock-based awards — — — — 833 — — 833Predecessor preferred stockdividend — — — — (907) — — (907)Comprehensive Income:
Net income (loss) — — — — — (22,877) — (22,877)Other comprehensiveincome (loss) — — — — — — (2,247) (2,247)
Balances, June 30, 2018(Predecessor) 9,820 $ 500 — $ 1,557 — $ (170) — $ 766,328 — $ (520,426) — $ (6,059) $ 241,730
Activity in employees’stock plans 61 — 10 — (91) — — (81)Amortization of stock-based awards — — — — 532 — — 532Predecessor preferred stockdividend — — — — (906) — — (906)Comprehensive Income:
Net income (loss) — — — — — (70,951) — (70,951)Other comprehensiveincome (loss) — — — — — — (153) (153)
Balances, September 30, 2018(Predecessor) 9,881 $ 500 $ 1,567 $ (170) $ 765,863 $ (591,377) $ (6,212) $ 170,171
See accompanying notes to the unaudited consolidated condensed financial statements.
9

Table of Contents
PARKER DRILLING COMPANY AND SUBSIDIARIESCONSOLIDATED CONDENSED STATEMENTS OF STOCKHOLDERS’ EQUITY
(Dollars and Shares in Thousands)(Unaudited)
Shares Preferred Stock Common Stock Treasury Stock
Capital inExcess ofPar Value
RetainedEarnings
(AccumulatedDeficit)
AccumulatedOther
ComprehensiveIncome (Loss)
TotalStockholders’
Equity
Balances, December 31, 2018(Predecessor) 9,885 $ 500 $ 1,568 $ (170) $ 766,347 $ (634,450) $ (6,879) $ 126,916
Activity in employees’ stockplans — — — — — — — —Amortization of stock-basedawards — — — — 1,446 — — 1,446Predecessor preferred stockdividend — — — — — — — —Comprehensive Income:
Net income (loss) — — — — — (90,248) — (90,248)Other comprehensiveincome (loss) — — — — — — (377) (377)
Balances, March 31, 2019(Predecessor) 9,885 500 1,568 (170) 767,793 (724,698) (7,256) 37,737
Cancellation of predecessorequity (9,885) (500) (1,568) 170 (767,793) 724,698 7,256 (37,737)
Balances, March 31, 2019(Predecessor) — — — — — — — —
Issuances of successorcommon stock 15,044 — 150 — 328,800 — — 328,950Issuances of successorwarrants — — — — 14,687 — — 14,687Equity issuance costs — — — — (837) — — (837)
Balances, March 31, 2019(Successor) 15,044 $ — $ 150 $ — $ 342,650 $ — $ — $ 342,800
Amortization of stock-basedawards — — — — 1,869 — — 1,869Comprehensive Income:
Net income (loss) — — — — — 4,641 — 4,641Other comprehensiveincome (loss) — — — — — — (152) (152)
Balances, June 30, 2019(Successor) 15,044 $ — $ 150 $ — $ 344,519 $ 4,641 $ (152) $ 349,158
Amortization of stock-basedawards — — — — 1,312 — — 1,312Comprehensive Income:
Net income (loss) — — — — — 3,989 — 3,989Other comprehensiveincome (loss) — — — — — — 357 357
Balances, September 30, 2019(Successor) 15,044 $ — $ 150 $ — $ 345,831 $ 8,630 $ 205 $ 354,816
See accompanying notes to the unaudited consolidated condensed financial statements.
10

Table of Contents
PARKER DRILLING COMPANY AND SUBSIDIARIESNOTES TO THE UNAUDITED CONSOLIDATED CONDENSED FINANCIAL STATEMENTS
Note 1 - Summary of Significant Accounting Policies
Organization and Nature of Operations
Unless otherwise indicated, the terms “Company,” “Parker,” “we,” “us” and “our” refer to Parker Drilling Company, incorporated in Delaware, together with itswholly-owned subsidiaries, and “Parker Drilling” refers solely to the parent, Parker Drilling Company. Parker is an international provider of contract drilling and drilling-relatedservices, as well as, rental tools and services. We have operated in over 60 countries since beginning operations in 1934, making us among the most geographically experienceddrilling contractors and rental tools providers in the world.
Basis of Presentation
The consolidated condensed financial statements have been prepared in accordance with U.S. generally accepted accounting principles (“U.S. GAAP”) and areunaudited. In the opinion of the Company, these consolidated condensed financial statements include all adjustments which, unless otherwise disclosed, are of a normalrecurring nature, necessary for their fair presentation for the periods presented. The results for interim periods are not necessarily indicative of results for the entire year. Theconsolidated condensed financial statements presented herein should be read in connection with the consolidated financial statements included in our Annual Report on Form10-K for the year ended December 31, 2018.
Consolidation
The consolidated condensed financial statements include the accounts of the Company and subsidiaries in which we exercise control or have a controlling financialinterest, including entities, if any, in which the Company is allocated a majority of the entity’s losses or returns, regardless of ownership percentage. If a subsidiary of ParkerDrilling has a 50.0 percent or greater interest in an entity but Parker Drilling’s interest in the subsidiary or the entity does not meet the consolidation criteria described above,then that interest is accounted for under the equity method.
Reclassifications
Certain reclassifications have been made to prior period amounts to conform to the current period presentation. These reclassifications did not materially affect ourconsolidated financial results.
Use of Estimates
The preparation of our consolidated condensed financial statements in accordance with U.S. GAAP requires management to make estimates and assumptions thataffect our reported amounts of assets and liabilities, our disclosure of contingent assets and liabilities at the date of the consolidated condensed financial statements, and ourrevenues and expenses during the periods reported. Estimates are typically used when accounting for certain significant items such as legal or contractual liability accruals, self-insured medical/dental plans, impairment, income taxes and valuation allowance, operating lease right-of-use assets, operating lease liabilities and other items requiring the useof estimates. Estimates are based on a number of variables, which may include third party valuations, historical experience, where applicable, and assumptions that we believeare reasonable under the circumstances. Due to the inherent uncertainty involved with estimates, actual results may differ from management estimates.
Cash, Cash equivalents and Restricted Cash
For purposes of the consolidated condensed balance sheets and the consolidated condensed statements of cash flows, the Company considers cash equivalents to behighly liquid debt instruments that have a remaining maturity of three months or less at the date of purchase.
Successor Predecessor
Dollars in thousandsSeptember 30,
2019 December 31,
2018
Cash and cash equivalents $ 101,106 $ 48,602Restricted cash — 10,389Cash, cash equivalents and restricted cash at end of period $ 101,106 $ 58,991
11

Table of Contents
The restricted cash balance as of December 31, 2018 includes $9.8 million in a cash collateral account to support the letters of credit outstanding and $0.6 million heldas compensating balances in the ordinary course of business for purchases and utilities.
Impairment
We evaluate the carrying amounts of long-lived assets for potential impairment when events occur or circumstances change that indicate the carrying values of suchassets may not be recoverable. We evaluate recoverability by determining the undiscounted estimated future net cash flows for the respective asset groups identified. If the sumof the estimated undiscounted cash flows is less than the carrying value of the asset group, we measure the impairment as the amount by which the assets’ carrying valueexceeds the fair value of such assets. Management considers a number of factors, such as estimated future cash flows from the assets, appraisals, and current market valueanalysis in determining fair value. Assets are written down to fair value if the final estimate of current fair value is below the net carrying value. The assumptions used in theimpairment evaluation are inherently uncertain and require management judgment.
Intangible Assets
Our intangible assets are related to customer relationships, developed technology and trade name, which are classified as definite lived intangibles, that are generallyamortized over a weighted average period of approximately three to six years. We assess the recoverability of the unamortized balance of our intangible assets when indicatorsof impairment are present based on expected future profitability and undiscounted expected cash flows and their contribution to our overall operations. Should the reviewindicate that the carrying value is not fully recoverable, the excess of the carrying value over the fair value of the intangible assets would be recognized as an impairment loss.See Note 4 - Intangible Assets for further discussion.
Income Taxes
Income taxes are accounted for under the asset and liability method and have been provided for based upon tax laws and rates in effect in the countries in whichoperations are conducted and income or losses are generated. There is little or no expected relationship between the provision for or benefit from income taxes and income orloss before income taxes as the countries in which we operate have taxation regimes that vary not only with respect to nominal rate, but also in terms of the availability ofdeductions, credits, and other benefits. Deferred tax assets and liabilities are recognized for the future tax consequences attributable to differences between the carrying amountsof existing assets and liabilities and their respective tax bases and operating loss and tax credit carryforwards. Deferred tax assets and liabilities are measured using enacted taxrates in effect for the year in which the temporary differences are expected to be recovered or settled and the effect of changes in tax rates is recognized in income in the periodin which the change is enacted. Valuation allowances are established to reduce deferred tax assets when it is more likely than not that some portion or all of the deferred taxassets will not be realized. In order to determine the amount of deferred tax assets or liabilities, as well as the valuation allowances, we must make estimates and assumptionsregarding future taxable income, where rigs will be deployed, and other matters. Changes in these estimates and assumptions, including changes in tax laws and other changesaffecting our ability to recognize the underlying deferred tax assets, could require us to adjust the valuation allowances.
The Company recognizes the effect of income tax positions only if those positions are more likely than not to be sustained. Recognized income tax positions aremeasured at the largest amount that is greater than 50.0 percent likely of being realized and changes in recognition or measurement are reflected in the period in which thechange in judgment occurs. See Note 8 - Income Taxes for further details.
Leases
As lessee, our leases are primarily operating leases. See Note 5 - Operating Leases for further details.
As lessor, our leases are primarily operating leases which are included in revenue in our consolidated condensed statement of operations. See Note 11 - Revenue forfurther details.
Legal and Investigative Matters
We accrue estimates of the probable and estimable costs for the resolution of certain legal and investigative matters. We do not accrue any amounts for other mattersfor which the liability is not probable and reasonably estimable. Generally, the estimate of probable costs related to these matters is developed in consultation with our legaladvisors. The estimates take into consideration factors such as the complexity of the issues, litigation risks and settlement costs. If the actual settlement costs, final judgments,or fines, after appeals, differ from our estimates, our future financial results may be adversely affected.
12
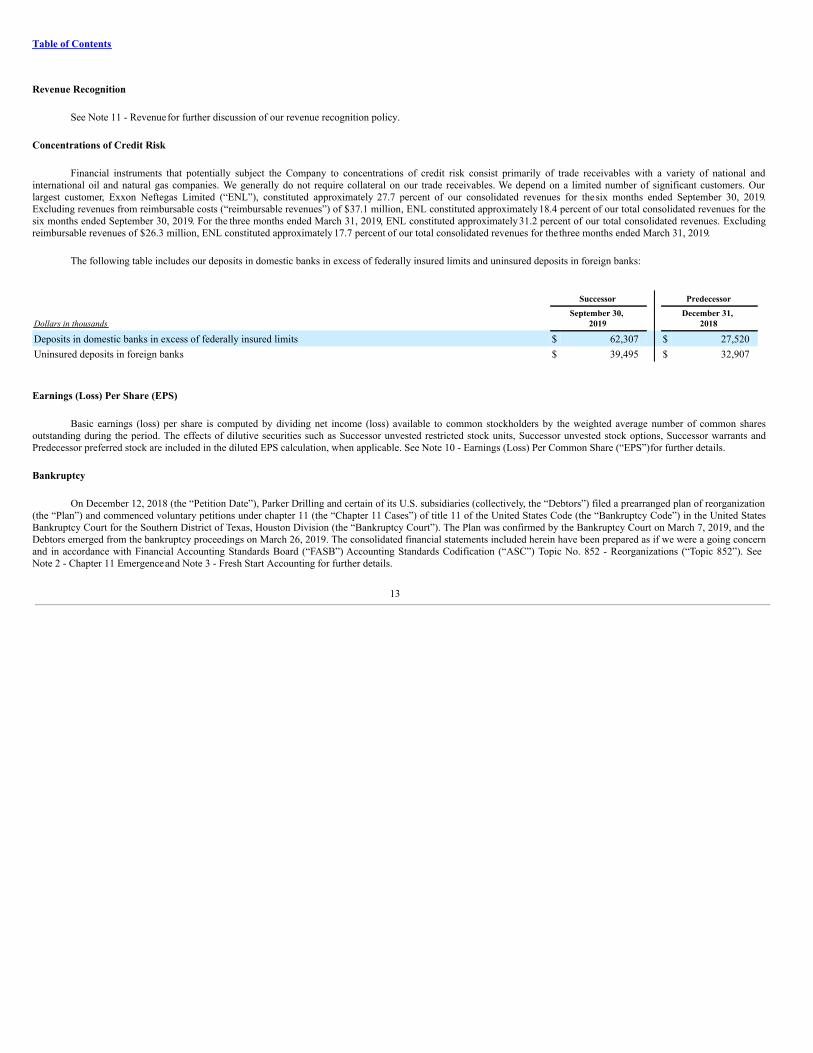
Table of Contents
Revenue Recognition
See Note 11 - Revenue for further discussion of our revenue recognition policy.
Concentrations of Credit Risk
Financial instruments that potentially subject the Company to concentrations of credit risk consist primarily of trade receivables with a variety of national andinternational oil and natural gas companies. We generally do not require collateral on our trade receivables. We depend on a limited number of significant customers. Ourlargest customer, Exxon Neftegas Limited (“ENL”), constituted approximately 27.7 percent of our consolidated revenues for the six months ended September 30, 2019.Excluding revenues from reimbursable costs (“reimbursable revenues”) of $37.1 million, ENL constituted approximately 18.4 percent of our total consolidated revenues for thesix months ended September 30, 2019. For the three months ended March 31, 2019, ENL constituted approximately 31.2 percent of our total consolidated revenues. Excludingreimbursable revenues of $26.3 million, ENL constituted approximately 17.7 percent of our total consolidated revenues for the three months ended March 31, 2019.
The following table includes our deposits in domestic banks in excess of federally insured limits and uninsured deposits in foreign banks:
Successor Predecessor
Dollars in thousandsSeptember 30,
2019 December 31,
2018
Deposits in domestic banks in excess of federally insured limits $ 62,307 $ 27,520Uninsured deposits in foreign banks $ 39,495 $ 32,907
Earnings (Loss) Per Share (EPS)
Basic earnings (loss) per share is computed by dividing net income (loss) available to common stockholders by the weighted average number of common sharesoutstanding during the period. The effects of dilutive securities such as Successor unvested restricted stock units, Successor unvested stock options, Successor warrants andPredecessor preferred stock are included in the diluted EPS calculation, when applicable. See Note 10 - Earnings (Loss) Per Common Share (“EPS”) for further details.
Bankruptcy
On December 12, 2018 (the “Petition Date”), Parker Drilling and certain of its U.S. subsidiaries (collectively, the “Debtors”) filed a prearranged plan of reorganization(the “Plan”) and commenced voluntary petitions under chapter 11 (the “Chapter 11 Cases”) of title 11 of the United States Code (the “Bankruptcy Code”) in the United StatesBankruptcy Court for the Southern District of Texas, Houston Division (the “Bankruptcy Court”). The Plan was confirmed by the Bankruptcy Court on March 7, 2019, and theDebtors emerged from the bankruptcy proceedings on March 26, 2019. The consolidated financial statements included herein have been prepared as if we were a going concernand in accordance with Financial Accounting Standards Board (“FASB”) Accounting Standards Codification (“ASC”) Topic No. 852 - Reorganizations (“Topic 852”). SeeNote 2 - Chapter 11 Emergence and Note 3 - Fresh Start Accounting for further details.
13

Table of Contents
Note 2 - Chapter 11 Emergence
On December 12, 2018, prior to the commencement of the Chapter 11 Cases, the Debtors entered into a restructuring support agreement (as amended on January 28,2019, the “RSA”) with certain significant holders of (1) 7.50% Senior Notes, due 2020 (the “7.50% Note Holders”) issued pursuant to the indenture (the “7.50% NotesIndenture”) dated July 30, 2013 (the “7.50% Notes”), by and among Parker Drilling, the subsidiary guarantors party thereto and Bank of New York Mellon Trust Company,N.A., as trustee (the “Trustee”), (2) 6.75% Senior Notes, due 2022 (the “6.75% Note Holders”) issued pursuant to the indenture (the “6.75% Notes Indenture”) dated January22, 2014 (the “6.75% Notes” and together with the 7.50% Notes, the “Senior Notes”), by and among Parker Drilling, the subsidiary guarantors party thereto and the Trustee, (3)Parker Drilling’s existing common stock (the “Predecessor Common Stock”) and (4) Parker Drilling’s 7.25% Series A Mandatory Convertible Preferred Stock (the“Predecessor Preferred Stock” and such holders to support a restructuring (the “Restructuring”) on the terms set forth in the Plan.
On the Petition Date, the Debtors filed voluntary petitions for reorganization under chapter 11 of the United States Bankruptcy Code in the United States BankruptcyCourt for the Southern District of Texas pursuant to a prearranged plan of reorganization. The Plan was confirmed by the Bankruptcy Court on March 7, 2019, and the Debtorsemerged from the bankruptcy proceedings on March 26, 2019.
References to “Successor” relate to the consolidated condensed statement of operations or consolidated condensed balance sheet of the reorganized Company as of andsubsequent to March 31, 2019. References to “Predecessor” relate to the consolidated condensed balance sheet of the Company prior to, and consolidated condensed statementof operations through and including, March 31, 2019.
On March 26, 2019:
(1) the Company amended and restated its certificate of incorporation andbylaws;
(2) the Company appointed new members to the Successor’s board of directors to replace directors of thePredecessor;
(3) the Companyissued:
• 2,827,323 shares of Successor Common Stock pro rata to 7.50% Note Holders;
• 5,178,860 shares of Successor Common Stock pro rata to 6.75% Note Holders;
• 90,558 shares of Successor Common Stock and 1,032,073 Successor warrants to purchase 1,032,073 shares of Successor Common Stock pro rata to holdersof the Predecessor Preferred Stock;
• 135,838 shares of Successor Common Stock and 1,548,109 Successor warrants to purchase 1,548,109 shares of Successor Common Stock pro rata to holdersof the Predecessor Common Stock;
• 504,577 shares of Successor Common Stock to commitment parties under that certain Backstop Commitment Agreement, dated December 12, 2018 andamended and restated on January 28, 2019, (as amended and restated, the “Backstop Commitment Agreement”) in respect of the commitment premium duethereunder;
• 1,403,910 shares of Successor Common Stock to the commitment parties under the Backstop Commitment Agreement in connection with their backstopobligation thereunder to purchase unsubscribed shares of Successor Common Stock; and
• 4,903,308 shares of Successor Common Stock to participants in the rights offering extended by Parker to the applicable classes under the Plan (including tothe commitment parties party to the Backstop Commitment Agreement).
14

Table of Contents
Reorganization Items
Any expenses, gains and losses that are realized or incurred subsequent to and as a direct result of the Chapter 11 Cases are recorded under reorganization items on ourconsolidated condensed statement of operations.
Reorganization items consisted of:
Successor Predecessor
Three Months Ended
September 30, Three Months Ended
September 30,
Dollars in thousands 2019 2018
Gain on settlement of liabilities subject to compromise $ — $ —Fresh start valuation adjustments — —Professional fees 211 —Backstop premium on the rights offering paid in stock — —Other — —Reorganization items $ 211 $ —
Successor Predecessor
Six Months EndedSeptember 30,
Three Months EndedMarch 31,
Nine Months EndedSeptember 30,
Dollars in thousands 2019 2019 2018
Gain on settlement of liabilities subject to compromise $ — $ (191,129 ) $ —Fresh start valuation adjustments — 242,567 —Professional fees 1,173 30,107 —Backstop premium on the rights offering paid in stock — 11,033 —Other — 399 —Reorganization items $ 1,173 $ 92,977 $ —
Supplemental cash flow information related to reorganization items paid is as follows:
Successor Predecessor
Six Months Ended
September 30, Three Months Ended
March 31, Nine Months Ended
September 30,
Dollars in thousands 2019 2019 2018
Reorganization items paid $ 22,081 $ 8,617 $ —
Debtor in Possession Financing
Amounts outstanding against the debtor in possession financing facility were $10.0 million as of December 31, 2018. The debtor in possession financing facility wasterminated as of March 26, 2019.
Liabilities Subject To Compromise
Pre-petition unsecured and under-secured obligations that could have been impacted by the Chapter 11 Cases have been classified as liabilities subject to compromiseon our Predecessor consolidated condensed balance sheet. These liabilities were reported at the amounts allowed as claims by the Bankruptcy Court.
15

Table of Contents
Liabilities subject to compromise consisted of:
Successor Predecessor
Dollars in thousandsSeptember 30,
2019 December 31,
2018
Predecessor 6.75% senior notes, due July 2022 $ — $ 360,000Predecessor 7.50% senior notes, due August 2020 — 225,000Accrued interest on predecessor senior notes — 15,996Liabilities subject to compromise $ — $ 600,996
Contractual interest expense for the three months ended March 31, 2019, on our senior notes was $10.3 million; however, no interest expense was accrued on thesenior notes, as they were impaired and extinguished upon emergence. See also Note 6 - Debt for further details.
16
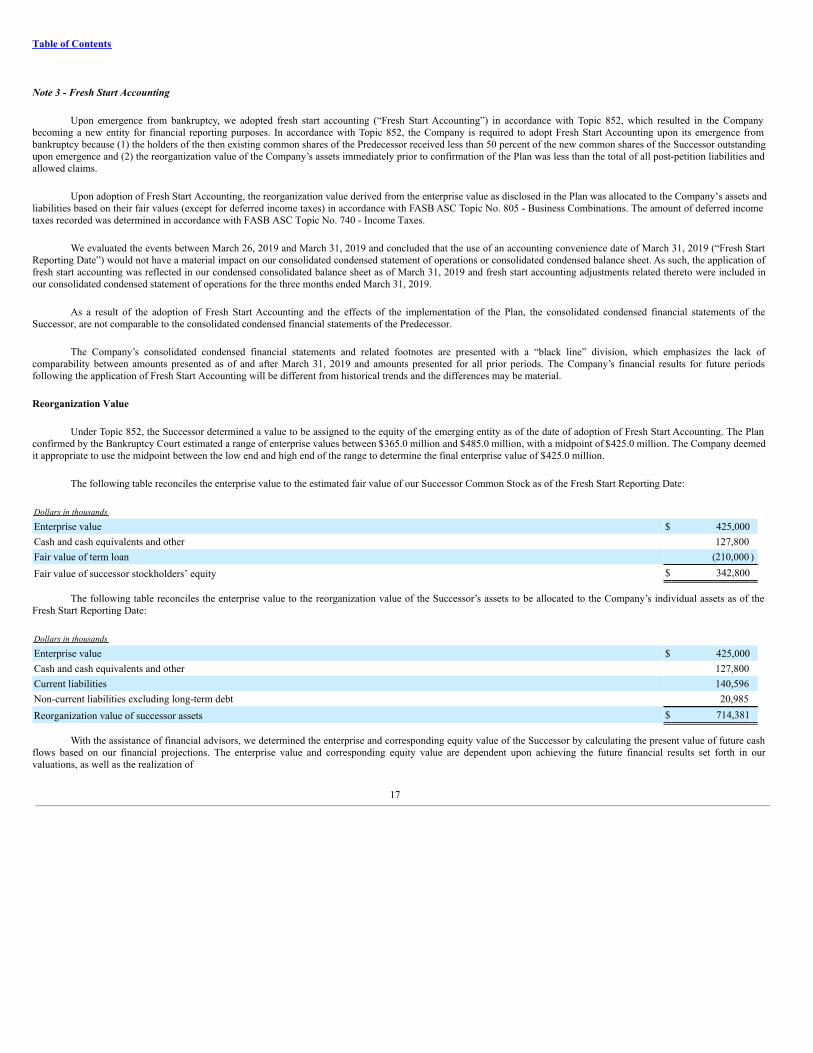
Table of Contents
Note 3 - Fresh Start Accounting
Upon emergence from bankruptcy, we adopted fresh start accounting (“Fresh Start Accounting”) in accordance with Topic 852, which resulted in the Companybecoming a new entity for financial reporting purposes. In accordance with Topic 852, the Company is required to adopt Fresh Start Accounting upon its emergence frombankruptcy because (1) the holders of the then existing common shares of the Predecessor received less than 50 percent of the new common shares of the Successor outstandingupon emergence and (2) the reorganization value of the Company’s assets immediately prior to confirmation of the Plan was less than the total of all post-petition liabilities andallowed claims.
Upon adoption of Fresh Start Accounting, the reorganization value derived from the enterprise value as disclosed in the Plan was allocated to the Company’s assets andliabilities based on their fair values (except for deferred income taxes) in accordance with FASB ASC Topic No. 805 - Business Combinations. The amount of deferred incometaxes recorded was determined in accordance with FASB ASC Topic No. 740 - Income Taxes.
We evaluated the events between March 26, 2019 and March 31, 2019 and concluded that the use of an accounting convenience date of March 31, 2019 (“Fresh StartReporting Date”) would not have a material impact on our consolidated condensed statement of operations or consolidated condensed balance sheet. As such, the application offresh start accounting was reflected in our condensed consolidated balance sheet as of March 31, 2019 and fresh start accounting adjustments related thereto were included inour consolidated condensed statement of operations for the three months ended March 31, 2019.
As a result of the adoption of Fresh Start Accounting and the effects of the implementation of the Plan, the consolidated condensed financial statements of theSuccessor, are not comparable to the consolidated condensed financial statements of the Predecessor.
The Company’s consolidated condensed financial statements and related footnotes are presented with a “black line” division, which emphasizes the lack ofcomparability between amounts presented as of and after March 31, 2019 and amounts presented for all prior periods. The Company’s financial results for future periodsfollowing the application of Fresh Start Accounting will be different from historical trends and the differences may be material.
Reorganization Value
Under Topic 852, the Successor determined a value to be assigned to the equity of the emerging entity as of the date of adoption of Fresh Start Accounting. The Planconfirmed by the Bankruptcy Court estimated a range of enterprise values between $365.0 million and $485.0 million, with a midpoint of $425.0 million. The Company deemedit appropriate to use the midpoint between the low end and high end of the range to determine the final enterprise value of $425.0 million.
The following table reconciles the enterprise value to the estimated fair value of our Successor Common Stock as of the Fresh Start Reporting Date:
Dollars in thousands Enterprise value $ 425,000Cash and cash equivalents and other 127,800Fair value of term loan (210,000 )Fair value of successor stockholders’ equity $ 342,800
The following table reconciles the enterprise value to the reorganization value of the Successor’s assets to be allocated to the Company’s individual assets as of theFresh Start Reporting Date:
Dollars in thousands Enterprise value $ 425,000Cash and cash equivalents and other 127,800Current liabilities 140,596Non-current liabilities excluding long-term debt 20,985Reorganization value of successor assets $ 714,381
With the assistance of financial advisors, we determined the enterprise and corresponding equity value of the Successor by calculating the present value of future cashflows based on our financial projections. The enterprise value and corresponding equity value are dependent upon achieving the future financial results set forth in ourvaluations, as well as the realization of
17
Table of Contents
certain other assumptions. All estimates, assumptions, valuations and financial projections, including the fair value adjustments, the enterprise value and equity valueprojections, are inherently subject to significant uncertainties and the resolution of contingencies beyond our control. Accordingly, we cannot assure you that the estimates,assumptions, valuations or financial projections will be realized, and actual results could vary materially.
Valuation Process
The fair values of the Company’s principal assets, including drilling equipment, rental tools, real property, and intangible assets were estimated with the assistance ofthird party valuation advisors. The income approach, market approach, and the cost approach were considered for estimating the value of each individual asset. Although theincome approach was not applied to value the machinery and equipment and real property assets individually, the Company did consider the earnings of the reporting unit withinwhich each of these assets reside. Economic obsolescence related to machinery and equipment and real property was also considered and was applied to stacked andunderutilized assets based upon the status of the asset. Economic obsolescence was also considered in situations in which the earnings of the applicable reporting unit in whichthe assets are employed suggest economic obsolescence. When penalizing assets for economic obsolescence, an additional economic obsolescence penalty was levied, whileconsidering scrap value to be the floor value for an asset. Because more than one approach was used to develop a valuation, the various approaches were reconciled todetermine a final value conclusion. The reorganization value was allocated to the Company’s individual assets and liabilities based on their fair values as follows:
Rig Materials and Supplies
The fair value of the rig materials and supplies was determined using the direct and indirect cost approaches. The rig materials and supplies were analyzed on a line-by-line basis and each asset was adjusted for age, physical depreciation, and obsolescence.
Property, Plant and Equipment
Building, Land and Improvements
The fair value of the land assets was estimated using the sales comparison (market) approach, which involved gathering data on comparable sales and current listings ofland in each subject market, then adjusting the unit price (per acre or per square foot) of each comparable for differences in market conditions, location, size, and other factors.A per unit value conclusion was then determined based on the adjusted prices of the comparable sales and listings. Fair value of buildings and improvements was estimatedusing the direct cost approach, in which the estimated replacement cost new of the improvements was adjusted for accrued physical depreciation and any functional or externalobsolescence. As a supporting approach, the total fair value of all real property assets for each location was estimated using the sales comparison (or market approach). Held forsale assets were included at their respective pending or listed prices. The fair value of the leasehold improvements was determined using the cost approach, adjusted as neededfor asset type, age, physical deterioration and obsolescence.
Rental Tools
The fair value of the rental tools was determined using a combination of the cost approach and sales comparison (market) approach depending upon the asset type. Thefair value utilizing the cost approach was adjusted as needed for asset type, age, physical deterioration, and obsolescence. For assets where an active secondary market exists,we utilized the sales comparison (market) approach to estimate the fair value of the assets, which involved gathering market data and analyzing comparable sales of similarassets.
Drilling Equipment
The fair value of the drilling equipment was determined using a combination of the discounted cash flow method (income approach), the cost approach, and the salescomparison (market) approach. The income approach was utilized to estimate the fair value of drilling equipment that generated positive returns on projected cash flows overthe remaining economic useful life of the drilling equipment and compared to the fair value utilizing the cost approach, adjusted as needed for asset type, age, physicaldeterioration and obsolescence. For assets where an active secondary market exists we utilized the sales comparison (market) approach to estimate the fair value of the assets,which involved gathering market data and analyzing comparable sales of similar assets.
Intangible Assets
We applied the income approach methodology to estimate the value of the customer relationships, trade name, and developed technology. We determined the value ofthe customer relationships based on the present value of the incremental after-tax cash flows attributable only to the intangible asset. The value of the trade name was estimatedthrough the relief from royalty
18

Table of Contents
method based on the present value of the cost savings realized by the owner of the asset as a result of not having to pay a stream of royalty payments to another party. The costsavings were based on hypothetical royalty payments of 0.2 percent of revenue reflecting a rate in which an arm’s length buyer would typically pay for the use of suchintangible assets. Similar to the methodology used to value the trade name, we determined the value of the developed technology using a hypothetical royalty payment of 1.0percent of revenue to reflect the attributable cost savings. The present value of the after-tax cash flows for all the Intangible Assets were estimated based on a discount rate of20.0 percent.
Successor Warrants
The fair value of the Successor warrants was estimated by applying a Black-Scholes-Merton (“BSM”) model. The BSM model is a pricing model used to estimate thetheoretical price or fair value for a European-style call or put option/warrant based on current stock price, strike price, time to maturity, risk-free rate, volatility, and dividendyield.
19

Table of Contents
Consolidated Balance Sheet
The adjustments included in the following fresh start consolidated condensed balance sheet as of March 31, 2019 reflect the effects of the transactions contemplated bythe Plan and executed by the Company on the Fresh Start Reporting Date (reflected in the column “Reorganization Adjustments”), and fair value and other required accountingadjustments resulting from the adoption of Fresh Start Accounting (reflected in the column “Fresh Start Adjustments”). The explanatory notes provide additional informationwith regard to the adjustments recorded, the methods used to determine the fair values and significant assumptions.
Dollars in thousands Predecessor Reorganization
Adjustments Fresh Start
Adjustments Successor
ASSETSCurrent assets:
Cash and cash equivalents $ 51,777 $ 76,072 (1) $ — $ 127,849Restricted cash 11,070 10,366 (2) — 21,436Accounts and notes receivable, net 168,444 — — 168,444Rig materials and supplies 39,024 — (21,185) (15) 17,839Other current assets 31,944 (8,764) (3) (3,603) (16) 19,577
Total current assets 302,259 77,674 (24,788) 355,145Property, plant and equipment, net 533,938 — (229,968) (17) 303,970Intangible assets, net 4,245 — 13,755 (18) 18,000Deferred income taxes 2,518 — 1,751 (19) 4,269Other non-current assets 38,045 1,253 (4) (6,301) (20) 32,997
Total assets $ 881,005 $ 78,927 $ (245,551) $ 714,381LIABILITIES AND STOCKHOLDERS’ EQUITY
Current liabilities: Debtor in possession financing $ 10,000 $ (10,000) (5) $ — $ —Accounts payable and accrued liabilities 134,461 4,990 (6) (3,868) (21) 135,583Accrued income taxes 5,013 — — 5,013
Total current liabilities 149,474 (5,010) (3,868) 140,596Long-term debt — 210,000 (7) — 210,000Other long-term liabilities 20,901 — (866) (22) 20,035Long-term deferred tax liability 28,445 — (27,495) (19) 950Commitments and contingencies
Total liabilities not subject to compromise 198,820 204,990 (32,229) 371,581Liabilities subject to compromise 600,996 (600,996) (8) — —
Total liabilities 799,816 (396,006) (32,229) 371,581Stockholders’ equity:
Predecessor preferred stock 500 (500) (9) — —Predecessor common stock 1,398 (1,398) (10) — —Predecessor capital in excess of par value 767,793 (35,839) (11) (731,954) (23) —Predecessor accumulated other comprehensive income (loss) (7,256) — 7,256 (23) —Successor common stock — 150 (12) — 150Successor capital in excess of par value — 342,650 (13) — 342,650Accumulated deficit (681,246) 169,870 (14) 511,376 (23) —
Total stockholders’ equity 81,189 474,933 (213,322) 342,800Total liabilities and stockholders’ equity $ 881,005 $ 78,927 $ (245,551) $ 714,381
20

Table of Contents
Reorganization Adjustments
(1) Changes in cash and cash equivalents included thefollowing:
Dollars in thousands Proceeds from the rights offering $ 95,000Transfers from restricted cash for the return of cash collateral (for letters of credit) 10,433Proceeds from refund of backstop commitment fee 7,600Transfers from restricted cash for deposit releases 250Transfers to restricted cash for funding of professional fees (21,049 )Payment of debtor in possession financing principal and interest (10,035 )Payment of professional fees (5,154 )Payment of debt issuance costs for the successor credit facility (490 )Payment of fees on letters of credit (58 )Payment of term loan agent fees (50 )Payment of other reorganization expenses (375 )Net change in cash and cash equivalents $ 76,072
(2) Changes in restricted cash reflects the net transfer of cash between restricted cash and cash and cashequivalents.
(3) Changes in other current assets include thefollowing:
Dollars in thousands Refund of backstop commitment fee $ (7,600)Elimination of predecessor directors and officers insurance policies (702 )Reclass of prepaid costs related to the successor credit facility (488 )Payment of other costs related to the successor credit facility 26Net change in other current assets $ (8,764)
(4) Changes in other non-current assets include thefollowing:
Dollars in thousands Capitalization of debt issuance costs on the successor credit facility $ 765Reclass of prepaid costs related to the successor credit facility 488Net change in other non-current assets $ 1,253
(5) Reflects the payment of debtor in possession financingprincipal.
(6) Changes in accounts payable and accrued liabilities include thefollowing:
Dollars in thousands Accrual of professional fees $ 7,100Payment of professional fees (2,017 )Payment of debtor in possession financing interest (35 )Payment of letters of credit fees (58 )Net change in accounts payable and accrued liabilities $ 4,990
(7) Changes in long-term debt include the issuance of the $210.0 million TermLoan.
21

Table of Contents
(8) Liabilities subject to compromise to be settled in accordance with the Plan and the resulting gain was determined asfollows:
Dollars in thousands Liabilities subject to compromise $ (600,996)Issuance of term loan 210,000Issuance of successor common stock to the 7.50% note holders and 6.75% note holders 175,058Excess fair value ascribed to lenders participating in equity rights offering 24,809Gain on settlement of liabilities subject to compromise $ (191,129)
(9) Changes in Predecessor Preferred Stock reflects the cancellation of Predecessor PreferredStock.
(10) Changes in Predecessor Common Stock reflects the cancellation of Predecessor CommonStock.
(11) Changes in Predecessor capital in excess of par include thefollowing:
Dollars in thousands Cancellation of predecessor preferred stock $ 500Cancellation of predecessor common stock 1,398Issuance of successor warrants to predecessor common stock and predecessor preferred stock holders (14,687 )Issuance of successor common stock to predecessor common stock and predecessor preferred stock holders (4,950 )Excess fair value ascribed to parties participating in rights offering, excluding lenders (18,100 )Net change in predecessor capital in excess of par value $ (35,839)
(12) Changes in Successor Common Stock include thefollowing:
Dollars in thousands Issuance of successor common stock to the 7.50% note holders and 6.75% note holders $ 80Issuance of successor common stock pursuant to rights offering 68Issuance of successor common stock to predecessor common stock and predecessor preferred stock holders 2Net change in successor common stock $ 150
(13) Change in Successor capital in excess of par value include thefollowing:
Dollars in thousands Issuance of successor common stock to the 7.50% note holders and 6.75% note holders $ 174,978Issuance of successor common stock pursuant to rights offering 148,874Issuance of successor warrants to predecessor common stock and predecessor preferred stock holders 14,687Issuance of successor common stock to predecessor common stock and predecessor preferred stock holders 4,948Equity issuance costs (837 )Net change in successor capital in excess of par value $ 342,650
22

Table of Contents
(14) Changes in accumulated deficit include thefollowing:
Dollars in thousands Gain on settlement of liabilities subject to compromise $ 191,129Backstop premium on rights offering (11,032 )Accrual of professional fees (5,988 )Payment of professional fees (3,137 )Elimination of predecessor directors and officers insurance policies (702 )Payment of other reorganization items (400 )Net change in accumulated deficit $ 169,870
Fresh Start Accounting Adjustments
(15) Changes in rig materials and supplies reflect the fair value adjustment due to the adoption of fresh startaccounting.
(16) Changes in other current assets reflect the elimination of capitalized mobilization costs due to the adoption of fresh startaccounting.
(17) Changes in property, plant and equipment, net reflects the fair value adjustment due to the adoption of fresh startaccounting.
(18) Changes in intangible assets, net reflects the fair value adjustment due to the adoption of fresh startaccounting.
Dollars in thousands Successor Fair Value Predecessor Historical
Book Value
Customer relationships $ 16,300 $ —Trade names 1,500 368Developed technology 200 3,877Intangible assets, net $ 18,000 $ 4,245
(19) Changes in deferred income taxes reflects the adjustment due to the adoption of fresh startaccounting.
(20) Changes in other non-current assets reflect thefollowing:
Dollars in thousands Fair value adjustment to rig material and supplies $ (6,845)Fair value adjustment to investment in non-consolidated subsidiaries 2,290Fair value adjustment to long-term notes receivable (272 )Elimination of capitalized mobilization costs (857 )Elimination of long-term other deferred charges (617 )Net change in other non-current assets $ (6,301)
(21) Changes in accounts payable and accrued liabilities due to the adoption of fresh start accounting include thefollowing:
Dollars in thousands Elimination of deferred rent $ (1,100)Elimination of deferred revenue (2,768 )Net change in accounts payable and accrued liabilities $ (3,868)
(22) Changes in other long-term liabilities reflects the elimination of deferred revenue due to the adoption of fresh startaccounting.
(23) Changes reflect the cumulative impact of fresh start accounting adjustments discussed above and the elimination of Predecessor accumulated other comprehensive lossand Predecessor accumulated deficit.
23
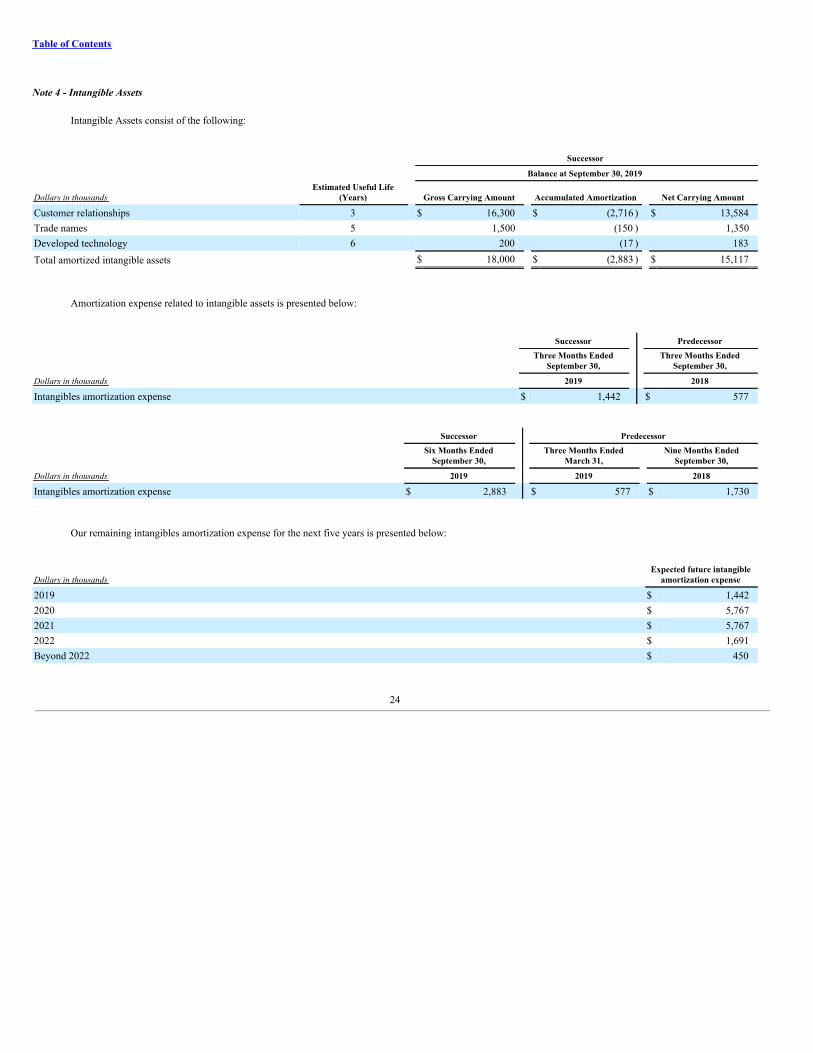
Table of Contents
Note 4 - Intangible Assets
Intangible Assets consist of the following:
Successor
Balance at September 30, 2019
Dollars in thousandsEstimated Useful Life
(Years) Gross Carrying Amount Accumulated Amortization Net Carrying Amount
Customer relationships 3 $ 16,300 $ (2,716 ) $ 13,584Trade names 5 1,500 (150 ) 1,350Developed technology 6 200 (17 ) 183Total amortized intangible assets $ 18,000 $ (2,883 ) $ 15,117
Amortization expense related to intangible assets is presented below:
Successor Predecessor
Three Months Ended
September 30, Three Months Ended
September 30,
Dollars in thousands 2019 2018
Intangibles amortization expense $ 1,442 $ 577
Successor Predecessor
Six Months Ended
September 30, Three Months Ended
March 31, Nine Months Ended
September 30,
Dollars in thousands 2019 2019 2018
Intangibles amortization expense $ 2,883 $ 577 $ 1,730
Our remaining intangibles amortization expense for the next five years is presented below:
Dollars in thousandsExpected future intangible
amortization expense
2019 $ 1,4422020 $ 5,7672021 $ 5,7672022 $ 1,691Beyond 2022 $ 450
24

Table of Contents
Note 5 - Operating Leases
We adopted the Accounting Standards Update (“ASU”) 2016-02, Leases (“Topic 842”) effective January 1, 2019. As lessee, our leasing activities primarily consist ofoperating leases for administrative offices, warehouses, oilfield services equipment, office equipment, computers and other items. Our leases have remaining lease terms of 1year to 6 years, some of which include options to extend the leases for up to 5 years, and some of which include options to terminate the leases within 1 year.
We elected the following package of practical expedients permitted under the transition guidance:
• an election to adopt the modified retrospective transition method applied at the beginning of the period of adoption, which does not require a restatement of the priorperiod. Accordingly, no cumulative-effect adjustment to retained earnings was made.
• an election not to apply the recognition requirements in Topic 842 to short-term leases (initial lease term of 12 months or less) and recognize lease payments in theconsolidated condensed statement of operations. Short-term leases have not been recorded on the balance sheet.
• a practical expedient to not reassess whether a contract is or contains a lease and carry forward its historical leaseclassification.
• a practical expedient to account for the lease and non-lease components separately (except as discussedbelow).
• a practical expedient to account for the lease and non-lease components as a single lease component for certain assets, by class of underlyingasset.
We determine whether a contract is or contains a lease at its inception. Topic 842 requires lessees to recognize operating lease right-of-use assets and operating leaseliabilities on the balance sheet. An operating lease right-of-use asset represents our right to use an underlying asset for the lease term and operating lease liability represents ourobligation to make lease payments arising from the lease. An operating lease right-of-use asset and operating lease liability are recognized at the commencement date based onthe present value of lease payments over the lease term. As most of our leases do not provide an implicit rate, we use our incremental borrowing rate based on the informationavailable at the commencement date in determining the present value of lease payments. The operating lease right-of-use assets also include any lease payments made andexclude lease incentives. Our lease terms may include options to extend or terminate the lease when it is reasonably certain that we will exercise those options. The adoption ofthis standard resulted in the recording of operating lease right-of-use assets and operating lease liabilities of approximately $21.0 million as of January 1, 2019.
Supplemental lease information related to our operating leases as of September 30, 2019 is shown below:
Successor
Dollars in thousandsSeptember 30,
2019
Operating lease right-of-use assets (1) $ 17,173
Operating lease liabilities - current (2) 7,466Operating lease liabilities - noncurrent (3) 8,647Total operating lease liabilities $ 16,113
Weighted average remaining lease term (in years) 3Weighted average discount rate 7.4 %
(1) This amount is included in other non-current assets in our consolidated condensed balancesheet.
(2) This amount is included in accounts payable and accrued liabilities in our consolidated condensed balancesheet.
(3) This amount is included in other long-term liabilities in our consolidated condensed balancesheet.
25

Table of Contents
Supplemental cash flow information related to leases are as follow:
Successor Predecessor
Six Months Ended
September 30, Three Months Ended March
31,
Dollars in thousands 2019 2019
Cash paid for amounts included in the measurement of operating lease liabilities $ 4,519 $ 2,498Operating lease right-of-use assets obtained in exchange for lease obligations $ 976 $ 60
Maturities of operating lease liabilities as of September 30, 2019 were as follows:
Successor
Dollars in thousandsOperating
Leases
2019 $ 1,9302020 7,3142021 4,5302022 2,0522023 1,593Beyond 2023 588Total undiscounted lease liability 18,007Imputed interest (1,894 )Total operating lease liabilities $ 16,113
Future minimum operating lease payments as of December 31, 2018 were as follows:
Successor
Dollars in thousandsOperating
Leases
2019 $ 10,7222020 7,8872021 4,1932022 1,9682023 1,540Beyond 2023 636Total lease payments $ 26,946
Lease expense for lease payments is recognized on a straight-line basis over the lease term. Expenses for operating leases are shown below:
Successor
Three Months Ended
September 30,Dollars in thousands 2019
Operating lease expense $ 2,071Short-term lease expense 1,146Variable lease expense 1,827Total lease expense $ 5,044
26

Table of Contents
Successor PredecessorSix Months Ended
September 30, Three Months Ended March
31,
Dollars in thousands 2019 2019
Operating lease expense $ 4,756 $ 2,709Short-term lease expense 1,978 787Variable lease expense 3,676 1,840Total lease expense $ 10,410 $ 5,336
27
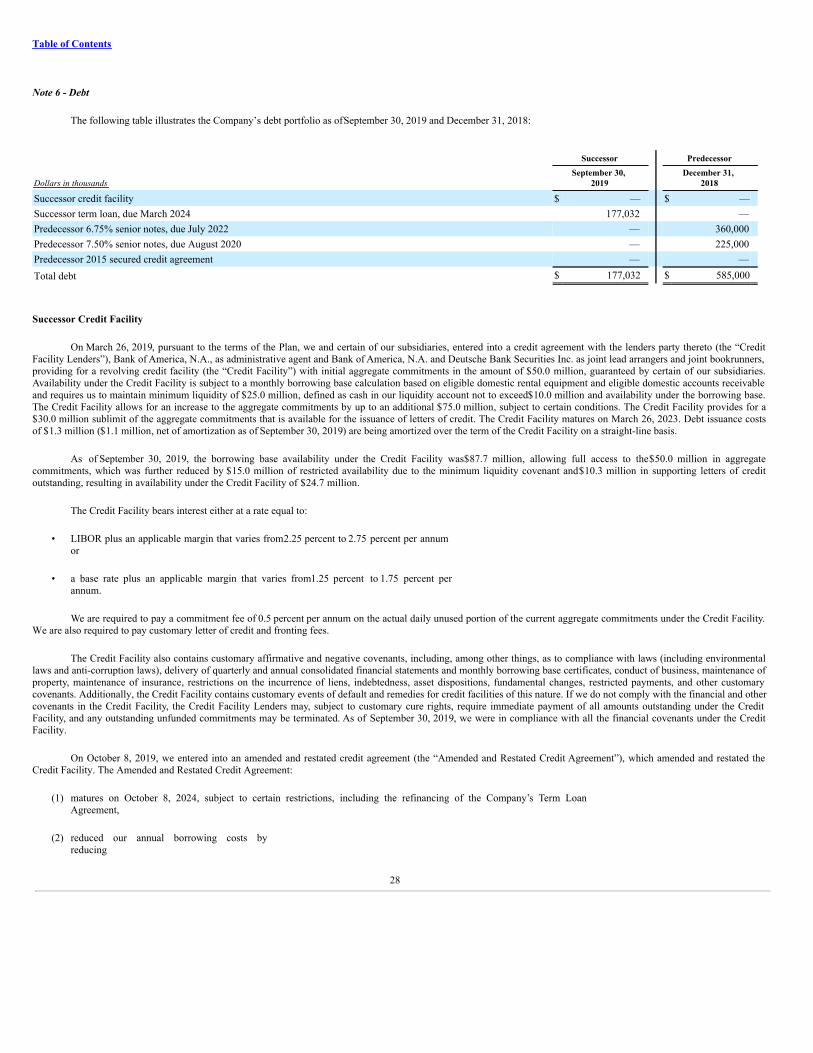
Table of Contents
Note 6 - Debt
The following table illustrates the Company’s debt portfolio as of September 30, 2019 and December 31, 2018:
Successor Predecessor
Dollars in thousandsSeptember 30,
2019 December 31,
2018
Successor credit facility $ — $ —Successor term loan, due March 2024 177,032 —Predecessor 6.75% senior notes, due July 2022 — 360,000Predecessor 7.50% senior notes, due August 2020 — 225,000Predecessor 2015 secured credit agreement — —Total debt $ 177,032 $ 585,000
Successor Credit Facility
On March 26, 2019, pursuant to the terms of the Plan, we and certain of our subsidiaries, entered into a credit agreement with the lenders party thereto (the “CreditFacility Lenders”), Bank of America, N.A., as administrative agent and Bank of America, N.A. and Deutsche Bank Securities Inc. as joint lead arrangers and joint bookrunners,providing for a revolving credit facility (the “Credit Facility”) with initial aggregate commitments in the amount of $50.0 million, guaranteed by certain of our subsidiaries.Availability under the Credit Facility is subject to a monthly borrowing base calculation based on eligible domestic rental equipment and eligible domestic accounts receivableand requires us to maintain minimum liquidity of $25.0 million, defined as cash in our liquidity account not to exceed $10.0 million and availability under the borrowing base.The Credit Facility allows for an increase to the aggregate commitments by up to an additional $75.0 million, subject to certain conditions. The Credit Facility provides for a$30.0 million sublimit of the aggregate commitments that is available for the issuance of letters of credit. The Credit Facility matures on March 26, 2023. Debt issuance costsof $1.3 million ($1.1 million, net of amortization as of September 30, 2019) are being amortized over the term of the Credit Facility on a straight-line basis.
As of September 30, 2019, the borrowing base availability under the Credit Facility was $87.7 million, allowing full access to the $50.0 million in aggregatecommitments, which was further reduced by $15.0 million of restricted availability due to the minimum liquidity covenant and $10.3 million in supporting letters of creditoutstanding, resulting in availability under the Credit Facility of $24.7 million.
The Credit Facility bears interest either at a rate equal to:
• LIBOR plus an applicable margin that varies from 2.25 percent to 2.75 percent per annumor
• a base rate plus an applicable margin that varies from 1.25 percent to 1.75 percent perannum.
We are required to pay a commitment fee of 0.5 percent per annum on the actual daily unused portion of the current aggregate commitments under the Credit Facility.We are also required to pay customary letter of credit and fronting fees.
The Credit Facility also contains customary affirmative and negative covenants, including, among other things, as to compliance with laws (including environmentallaws and anti-corruption laws), delivery of quarterly and annual consolidated financial statements and monthly borrowing base certificates, conduct of business, maintenance ofproperty, maintenance of insurance, restrictions on the incurrence of liens, indebtedness, asset dispositions, fundamental changes, restricted payments, and other customarycovenants. Additionally, the Credit Facility contains customary events of default and remedies for credit facilities of this nature. If we do not comply with the financial and othercovenants in the Credit Facility, the Credit Facility Lenders may, subject to customary cure rights, require immediate payment of all amounts outstanding under the CreditFacility, and any outstanding unfunded commitments may be terminated. As of September 30, 2019, we were in compliance with all the financial covenants under the CreditFacility.
On October 8, 2019, we entered into an amended and restated credit agreement (the “Amended and Restated Credit Agreement”), which amended and restated theCredit Facility. The Amended and Restated Credit Agreement:
(1) matures on October 8, 2024, subject to certain restrictions, including the refinancing of the Company’s Term LoanAgreement,
(2) reduced our annual borrowing costs byreducing
28
Table of Contents
• the interest rate to LIBOR plus a range of 1.75 percent to 2.25 percent (based on availability)and
• the unused commitment fee to a range of 0.25 percent to 0.375 percent (based onutilization),
(3) replaced a $25 million liquidity covenant with a minimum fixed charge coverage ratio requirement of 1.0x when excess availability is less than the greaterof
• 20.0 percent of the lesser of commitments and the borrowing baseand
• $10.0million,
(4) allowed an additional borrower to be included in the borrowing base upon completion of a fieldexamination,
(5) revised the calculation of the borrowing base by, among other things, excluding eligible domestic rental equipment and including 90 percent of investment gradeeligible domestic accounts receivable, and
(6) allowed the Company to grant a second priority lien on non-working capital assets in the event of a refinancing of the Term Loan Agreement (as definedbelow).
As described below, the Amended and Restated Credit Agreement also permitted us to make a voluntary prepayment of $35.0 million on our Term Loan (as definedbelow) without such prepayment being included in the calculation of our fixed coverage ratio.
If the Amended and Restated Credit Agreement were executed on or before September 30, 2019, the borrowing base availability would have been $41.7 million and,after deducting $10.3 million in letters of credit, would have resulted in net availability of $31.3 million, an increase of $6.7 million under the Credit Facility.
Successor Term Loan, Due March 2024
On March 26, 2019, pursuant to the terms of the Plan, we and certain of our subsidiaries entered into a second lien term loan credit agreement (the “Term LoanAgreement”) with the lenders party thereto (the “Term Loan Lenders”) and UMB Bank, N.A., as administrative agent, providing for term loans (the “Term Loan”) in theamount of $210.0 million, guaranteed by certain of our subsidiaries. The Term Loan matures on March 26, 2024.
The Term Loan bears interest at a rate of 13.0 percent per annum, payable quarterly on the first day of each January, April, July, and October, beginning July 1, 2019,with 11.0 percent paid in cash and 2.0 percent paid in kind and capitalized by adding such amount to the outstanding principal.
We may voluntarily prepay all or a part of the Term Loan and, under certain conditions we are required to prepay all or a part of the Term Loan, in each case, at apremium (1) on or prior to 6 months after the closing date of 0 percent; (2) from 6 months and on or prior to two years after the closing date of 6.50 percent; (3) from two yearsand on or prior to three years after the closing date of 3.25 percent; and (4) from three years after the closing date and thereafter of 0 percent.
On September 20, 2019, we made a voluntary prepayment on the Term Loan of $35.0 million in principal, plus $1.0 million in interest associated with the principalpayment. Since the prepayment occurred within the first six months from the closing date, no premium was applicable on the prepayment. As of September 30, 2019, the TermLoan balance was $177.0 million.
The Term Loan is subject to mandatory prepayments and customary reinvestment rights. The mandatory prepayments include prepayment requirements with respect toa change of control, asset sales and debt issuances, in each case subject to certain exceptions or conditions. The Term Loan Agreement also contains customary affirmative andnegative covenants, including as to compliance with laws (including environmental laws and anti-corruption laws), delivery of quarterly and annual financial statements,conduct of business, maintenance of property, maintenance of insurance, restrictions on the incurrence of liens, indebtedness, asset dispositions, fundamental changes, restrictedpayments and other customary covenants. Additionally, the Term Loan Agreement contains customary events of default and remedies for facilities of this nature. If we do notcomply with the covenants in the Term Loan Agreement, the Term Loan Lenders may, subject to customary cure rights, require immediate payment of all amounts outstandingunder the Term Loan Agreement. As of September 30, 2019, we were in compliance with all the financial covenants under the Term Loan Agreement.
Predecessor 6.75% Senior Notes, Due July 2022
On January 22, 2014, we issued $360.0 million aggregate principal amount of the 6.75% Notes pursuant to the 6.75% Notes Indenture. The 6.75% Notes were generalunsecured obligations of the Company and ranked equal in right of payment with all of our existing and future senior unsecured indebtedness. The 6.75% Notes were jointly andseverally guaranteed by all of our
29

Table of Contents
subsidiaries that guaranteed indebtedness under the Second Amended and Restated Senior Secured Credit Agreement, as amended from time-to-time (“2015 Secured CreditAgreement”) and our 7.50% Notes. Interest on the 6.75% Notes was payable on January 15 and July 15 of each year, beginning July 15, 2014. Debt issuance costs related to the6.75% Notes were approximately $7.6 million. After the commencement of the Chapter 11 Cases, the carrying amount of debt was adjusted to the claim amount and allunamortized debt issuance costs prior to the commencement of the Chapter 11 Cases were fully expensed.
Predecessor 7.50% Senior Notes, Due August 2020
On July 30, 2013, we issued $225.0 million aggregate principal amount of the 7.50% Notes pursuant to the 7.50% Notes Indenture. The 7.50% Notes were generalunsecured obligations of the Company and ranked equal in right of payment with all of our existing and future senior unsecured indebtedness. The 7.50% Notes were jointly andseverally guaranteed by all of our subsidiaries that guaranteed indebtedness under the 2015 Secured Credit Agreement and the 6.75% Notes. Interest on the 7.50% Notes waspayable on February 1 and August 1 of each year, beginning February 1, 2014. Debt issuance costs related to the 7.50% Notes were approximately $5.6 million. After thecommencement of the Chapter 11 Cases, the carrying amount of debt was adjusted to the claim amount and all unamortized debt issuance costs prior to the commencement ofthe Chapter 11 Cases were fully expensed.
The commencement of the Chapter 11 Cases constituted an event of default that accelerated the Company’s obligations under the indentures governing the 6.75%Notes and the 7.50% Notes. However, any efforts to enforce such payment obligations were automatically stayed under the provisions of the Bankruptcy Code. The principalbalance on the 6.75% Notes and 7.50% Notes of $360.0 million and $225.0 million, respectively, had been reclassed from long-term debt to liabilities subject to compromise asof December 31, 2018. See also Note 2 - Chapter 11 Emergence for further details.
As previously disclosed in our Current Report on Form 8-K filed with the SEC on March 26, 2019, our obligations with respect to the Senior Notes as well as oursubsidiaries’ obligations under their respective guarantees under the 6.75% Notes Indenture and the 7.50% Notes Indenture (and the Senior Notes) were cancelled andextinguished as provided in the Plan. From and after March 26, 2019, neither the Company nor its subsidiaries have any continuing obligations under the 6.75% NotesIndenture and 7.50% Notes Indenture or with respect to the Senior Notes or the guarantees related thereto except to the extent specifically provided in the Plan.
Predecessor 2015 Secured Credit Agreement
On January 26, 2015, we entered into the 2015 Secured Credit Agreement. The 2015 Secured Credit Agreement was originally comprised of a $200.0 millionrevolving credit facility (the “Revolver”). The 2015 Secured Credit Agreement formerly included financial maintenance covenants, including a leverage ratio, consolidatedinterest coverage ratio, senior secured leverage ratio, and asset coverage ratio, many of which were suspended beginning in September 2015.
We executed various amendments which, among other things: (1) modified the credit facility to an asset-based lending structure, (2) reduced the size of the Revolver to$80.0 million, (3) eliminated the financial maintenance covenants previously in effect and replaced them with a minimum liquidity covenant of $30.0 million and a monthlyborrowing base calculation, (4) allowed for the refinancing of our existing Senior Notes with either secured or unsecured debt, (5) added the ability for the Company to designatecertain of its subsidiaries as “Designated Borrowers”, and (6) permitted the Company to make restricted payments in the form of certain equity interests.
On October 25, 2018, we entered into a Consent Agreement and a Cash Collateral Agreement, whereby we could open bank accounts not subject to the 2015 SecuredCredit Agreement for the purpose of depositing cash to secure certain letters of credit. On October 30, 2018, we deposited $10.0 million into a cash collateral account to supportthe letters of credit outstanding, which is included in the restricted cash balance on the consolidated balance sheet as of December 31, 2018.
Our obligations under the 2015 Secured Credit Agreement were guaranteed by substantially all of our direct and indirect domestic subsidiaries, other than immaterialsubsidiaries and subsidiaries generating revenues primarily outside the United States, each of which has executed guaranty agreements, and were secured by first priority lienson our accounts receivable, specified rigs including barge rigs in the Gulf of Mexico (“GOM”) and land rigs in Alaska, certain U.S.-based rental equipment of the Companyand its subsidiary guarantors and the equity interests of certain of the Company’s subsidiaries. In addition to the liquidity covenant and borrowing base requirements, the 2015Secured Credit Agreement contains customary affirmative and negative covenants, such as limitations on indebtedness and liens, and restrictions on entry into certain affiliatetransactions and payments (including certain payments of dividends).
All of the Company’s obligations under the 2015 Secured Credit Agreement were paid prior to the commencement of the Chapter 11 Cases, and the 2015 SecuredCredit Agreement, including the Revolver thereunder, was terminated concurrently with
30

Table of Contents
the commencement of the Chapter 11 Cases. See also Note 2 - Chapter 11 Emergence for further details. Unamortized debt issuance costs were fully expensed upon terminationof the 2015 Secured Credit Agreement.
Supplemental cash flow information related to interest paid is as follow:
Successor Predecessor
Six Months Ended
September 30, Three Months Ended
March 31, Nine Months Ended
September 30,
Dollars in thousands 2019 2019 2018
Interest paid $ 7,248 $ 184 $ 41,175
Note 7 - Fair Value of Measurements
Certain of our assets and liabilities are required to be measured at fair value on a recurring basis. For purposes of recording fair value adjustments for certain financialand non-financial assets and liabilities, and determining fair value disclosures, we estimate fair value at a price that would be received to sell an asset or paid to transfer aliability in an orderly transaction between market participants in the principal market for the asset or liability.
The fair value measurement and disclosure requirements of FASB ASC Topic No. 820, Fair Value Measurement and Disclosures requires inputs that we categorizeusing a three-level hierarchy, from highest to lowest level of observable inputs, as follows:
• Level 1 — Unadjusted quoted prices for identical assets or liabilities in activemarkets;
• Level 2 — Direct or indirect observable inputs, including quoted prices or other market data, for similar assets or liabilities in active markets or identical assets orliabilities in less active markets; and
• Level 3 — Unobservable inputs that require significant judgment for which there is little or no marketdata.
When multiple input levels are required for a valuation, we categorize the entire fair value measurement according to the lowest level of input that is significant to theentire measurement even though we may also have utilized significant inputs that are more readily observable. The amounts reported in our consolidated condensed balancesheets for cash and cash equivalents, accounts receivable, and accounts payable approximate fair value.
Fair value of our Term Loan is determined using Level 2 inputs. The Level 2 fair value was determined using a market approach by comparing secured debt of othercompanies in our industry that have a similar credit rating and debt amount. Fair value of our 6.75% Notes and 7.50% Notes was determined using Level 2 inputs.
Fair values and related carrying values of our debt instruments were as follows:
Successor Predecessor
September 30, 2019 December 31, 2018
Dollars in thousands Carrying Amount Fair Value Carrying Amount Fair Value
Successor term loan, due March 2024 $ 177,032 $ 205,601 $ — $ —Predecessor 6.75% senior notes, due July 2022 — — 360,000 180,000Predecessor 7.50% senior notes, due August 2020 — — 225,000 117,000Total $ 177,032 $ 205,601 $ 585,000 $ 297,000
Market conditions could cause an instrument to be reclassified from Level 1 to Level 2, or Level 2 to Level 3. There were no transfers between levels of the fair valuehierarchy or any changes in the valuation techniques used during the nine months ended September 30, 2019.
31

Table of Contents
Note 8 - Income Taxes
Income tax expense and the effective tax rate is shown below:
Successor Predecessor
Three Months Ended
September 30, Three Months Ended
September 30,
Dollars in thousands 2019 2018
Income tax (benefit) expense $ 4,979 $ 2,371Effective tax rate 55.5 % (3.5 )%
Successor PredecessorSix Months Ended
September 30,Three Months Ended March
31,Nine Months Ended
September 30,
Dollars in thousands 2019 2019 2018
Income tax (benefit) expense $ 8,771 $ 656 $ 5,561Effective tax rate 50.4 % (0.7 )% (4.8 )%
The Company’s effective tax rate was 50.4 percent for the six months ended September 30, 2019, which varied from the U.S. statutory rate of 21.0 percent primarilydue to the jurisdictional mix of income and loss during the quarter, our continued inability to recognize the benefits associated with certain losses as a result of valuationallowances, and changes in uncertain tax positions. The Company’s effective tax rate was negative 0.7 percent for the three months ended March 31, 2019, respectively, whichvaried from the U.S. statutory rate of 21.0 percent primarily due to the jurisdictional mix of income and loss during the quarter, our continued inability to recognize the benefitsassociated with certain losses as a result of valuation allowances, and the income tax impacts of adjustments made as part of Fresh Start Accounting. See Note 3 - Fresh StartAccounting for further details. The Company’s effective tax rate was negative 4.8 percent for the nine months ended September 30, 2018, which varied from the U.S. statutoryrate of 21.0 percent primarily due to the jurisdictional mix of income and loss and our continued inability to recognize the benefits associated with certain losses as a result ofvaluation allowances.
Supplemental cash flow information related to income taxes paid (net of refunds) are as follow:
Successor Predecessor
Six Months Ended
September 30, Three Months Ended
March 31, Nine Months Ended
September 30,
Dollars in thousands 2019 2019 2018
Income taxes paid (net of refunds) $ 5,440 $ 1,421 $ 5,871
We apply the accounting guidance related to accounting for uncertainty in income taxes. This guidance prescribes a recognition threshold and a measurement attributefor the financial statement recognition and measurement of tax positions taken or expected to be taken in a tax return. For those benefits to be recognized, a tax position must bemore likely than not to be sustained upon examination by taxing authorities. Our liability for unrecognized tax benefits is primarily related to foreign operations, (all of which, ifrecognized, would favorably impact our effective tax rate). Unrecognized tax benefits and accrued interest and penalties related to uncertain tax positions was as follows:
Successor Predecessor
Dollars in thousandsSeptember 30,
2019 December 31,
2018
Liability for unrecognized tax benefits $ 3,403 $ 5,728Accrued interest and penalties related to uncertain tax positions $ 1,323 $ 2,107
As described in Note 2 - Chapter 11 Emergence, in accordance with the Plan, our 7.50% Notes and 6.75% Notes were canceled and exchanged for Successor CommonStock, the Term Loan, and right to participate in the rights offering. The Internal Revenue Service Code (“IRC”) of 1986, as amended, provides that a debtor in a Chapter 11bankruptcy case may exclude cancellation of debt income (“CODI”) from taxable income but must reduce certain of its tax attributes by the amount of any CODI realized as aresult of the consummation of a plan of reorganization. The amount of CODI realized by a taxpayer is determined
32
Table of Contents
based on the fair market value of the consideration received by the creditors in settlement of outstanding indebtedness. Upon emergence from Chapter 11 bankruptcyproceedings, the CODI may reduce some or all of the amount of prior U.S. tax attributes, which can include net operating losses, capital losses, and tax basis in assets. Theactual reduction in tax attributes does not occur until January 1, 2020. The amount of the remaining U.S. deferred tax assets, against which a full valuation exists, will be limitedunder IRC Section 382 due to the change in control resulting from the Plan.
The Company has evaluated the impact of the reorganization, including the change in control, resulting from its emergence from bankruptcy. The Company believesthat the Successor Company will be able to fully absorb the CODI realized by the Predecessor in connection with the reorganization with its net operating losses, capital losses,and tax basis in assets. It is more likely than not that the Successor will not realize future income tax benefits related to its remaining U.S. net deferred tax asset based on theIRC Section 382 limitation, historical results, and expected market conditions known on the date of measurement, and the Company has therefore maintained a full valuationallowance against the remaining U.S. net deferred tax asset. This is periodically reassessed and could change in the future.
Note 9 - Commitments and Contingencies
We are a party to various lawsuits and claims arising out of the ordinary course of business. We estimate the range of our liability related to pending litigation when webelieve the amount or range of loss can be estimated. We record our best estimate of a loss when the loss is considered probable. When a liability is probable and there is a rangeof estimated loss with no best estimate in the range, we record the minimum estimated liability related to the lawsuits or claims. As additional information becomes available,we assess the potential liability related to our pending litigation and claims and revise our estimates. Due to uncertainties related to the resolution of lawsuits and claims, theultimate outcome may differ significantly from our estimates. In the opinion of management and based on liability accruals provided, our ultimate exposure with respect tothese pending lawsuits and claims is not expected to have a material adverse effect on our consolidated condensed balance sheets or statements of cash flows, although theycould have a material adverse effect on our consolidated condensed statements of operations for a particular reporting period.
33

Table of Contents
Note 10 - Earnings (Loss) Per Common Share (“EPS”)
Basic earnings (loss) per share is computed by dividing net income (loss) available to common stockholders by the weighted average number of common sharesoutstanding during the period. The effects of dilutive securities such as Successor unvested restricted stock units, Successor unvested stock options, Successor warrants andPredecessor preferred stock are included in the diluted EPS calculation, when applicable. The number of outstanding dilutive securities can change with turnover of employeesholding these securities.
The Successor unvested restricted stock units represent shares of Successor Common Stock that were issued upon emergence from bankruptcy under the 2019 LongTerm Incentive Plan to certain employees. The Successor unvested stock options were issued upon emergence from bankruptcy under the 2019 Long Term Incentive Plan tocertain employees and are convertible into one share each of Successor Common Stock at an exercise price of $23. The Successor warrants were issued upon emergence frombankruptcy and are initially convertible into one share each of Successor Common Stock at an initial exercise price of $48.85. See Note 2 - Chapter 11 Emergence for moredetails. The 500,000 units of Predecessor preferred stock were convertible into 47.6190 shares of Predecessor common stock for each Predecessor preferred stock for a total of1,587,300 shares of Predecessor common stock.
The following table represents the computation of earnings per share:
Successor Predecessor
Three Months Ended
September 30, Three Months Ended
September 30,
Dollars in thousands, except share and per share amounts 2019 2018
Basic EPS Numerator
Net income (loss) available to common stockholders (numerator)$ 3,989 $ (71,857 )
Denominator Weighted average shares outstanding 15,044,739 9,334,390Number of shares used for basic EPS computation 15,044,739 9,334,390
Basic earnings (loss) per common share $ 0.27 $ (7.70 )
Successor Predecessor
Three Months Ended
September 30, Three Months Ended
September 30,
Dollars in thousands, except share and per share amounts 2019 2018
Diluted EPS Numerator
Net income (loss) available to common stockholders (numerator)$ 3,989 $ (71,857 )
Denominator Number of shares used for basic EPS computation 15,044,739 9,334,390Successor unvested restricted stock units — —Successor unvested stock options — —Successor warrants — —Predecessor preferred stock — —Number of shares used for diluted EPS computation 15,044,739 9,334,390
Diluted earnings (loss) per common share $ 0.27 $ (7.70 )
34

Table of Contents
Successor Predecessor
Six Months Ended
September 30, Three Months Ended
March 31, Nine Months Ended
September 30,
Dollars in thousands, except share and per share amounts 2019 2019 2018
Basic EPS Numerator
Net income (loss) available to common stockholders (numerator) $ 8,630 $ (90,248 ) $ (125,343 )Denominator
Weighted average shares outstanding 15,044,739 9,368,322 9,292,858Number of shares used for basic EPS computation 15,044,739 9,368,322 9,292,858
Basic earnings (loss) per common share $ 0.57 $ (9.63 ) $ (13.49 )
Successor Predecessor
Six Months Ended
September 30, Three Months Ended
March 31, Nine Months Ended
September 30,
Dollars in thousands, except share and per share amounts 2019 2019 2018
Diluted EPS Numerator
Net income (loss) available to common stockholders (numerator) $ 8,630 $ (90,248 ) $ (125,343 )Denominator
Number of shares used for basic EPS computation 15,044,739 9,368,322 9,292,858Successor unvested restricted stock units — — —Successor unvested stock options — — —Successor warrants — — —Predecessor preferred stock — — —Number of shares used for diluted EPS computation 15,044,739 9,368,322 9,292,858
Diluted earnings (loss) per common share$ 0.57 $ (9.63 ) $ (13.49 )
The following shares were excluded from the computation of diluted EPS as such shares would be anti-dilutive:
Successor Predecessor
Three Months Ended
September 30, Three Months Ended
September 30,
2019 2018
Successor unvested restricted stock units 198,765 —Successor unvested stock options 298,150 —Successor warrants 2,580,182 —Predecessor preferred stock — 1,587,300
Successor Predecessor
Six Months Ended
September 30, Three Months Ended
March 31, Nine Months Ended
September 30,
2019 2019 2018
Successor unvested restricted stock units 198,765 — —Successor unvested stock options 298,150 — —Successor warrants 2,580,182 — —Predecessor preferred stock — 1,587,300 1,587,300
35

Table of Contents
Note 11 - Revenue
The following table shows the Company’s revenues by type:
Successor
Dollars in thousandsThree Months Ended
September 30,
2019
Lease revenue $ 40,691Service revenue 119,392
Total revenues $ 160,083
Successor Predecessor
Dollars in thousandsSix Months Ended
September 30, Three Months Ended
March 31,
2019 2019
Lease revenue $ 83,122 $ 42,041Service revenue 232,992 115,356
Total revenues $ 316,114 $ 157,397
Our business is comprised of two business lines: (1) rental tools services and (2) drilling services. See Note 12 - Reportable Segments for further details on thesebusiness lines and revenue disaggregation amounts.
Lease Revenue
We adopted Topic 842 effective January 1, 2019. For a lessor, lease revenue recognition begins at the commencement of the lease date, which is defined as the date onwhich a lessor makes an underlying asset available for use by the lessee. Any pre-commencement payments (e.g. mobilization) are deferred. Subsequently, any lease payments(i.e. related to any fixed consideration received) are recorded as receivables when due and payable by the lessee. All of our lease revenue is from variable lease payments.Variable lease payments are recognized as income in profit or loss as the variability is resolved (i.e. as performance or use of the asset occurs).
We elected the following package of practical expedients permitted under the transition guidance:
• an election to adopt the modified retrospective transition method applied at the beginning of the period of adoption which does not require a restatement of the priorperiod. Accordingly, no cumulative-effect adjustment to retained earnings was made.
• a practical expedient to not reassess whether a contract is or contains a lease and carry forward its historical leaseclassification.
• a practical expedient to account as a single performance obligation entirely depending on predominant component(s) i.e. lease or non-lease component. Revenue isrecognized under Topic 842, if the lease component is predominant. Similarly, revenue is recognized under ASU 2014-09, Revenue from Contracts with Customers(“Topic 606”) if the non-lease component is predominant.
Our lease revenue comes from rental tools services business and drilling services business as described below.
Rental Tools Services Business
Dayrate Revenues
Our rental tools services contracts generally provide for payment on a dayrate basis depending on the rate for the tool defined in the contract.
Such dayrate consideration is allocated to the distinct daily increment it relates to within the contract term, and therefore, recognized in line with the contractual ratebilled for the services provided for any given day.
36

Table of Contents
Drilling Services Business
Dayrate Revenues
Our drilling services contracts generally provide for payment on a dayrate basis, with higher rates for periods when the drilling unit is operating and lower rates or zerorates for periods when drilling operations are interrupted or restricted. The dayrate invoices billed to the customer are typically determined based on the varying rates applicableto the specific activities performed on an hourly basis.
Such dayrate consideration is allocated to the distinct hourly increment to which it relates within the contract term, and therefore, recognized in line with the contractualrate billed for the services provided for any given hour.
Mobilization Revenues
We may receive fees (on either a fixed lump-sum or variable dayrate basis) for the mobilization of our rigs.
These activities are not considered to be distinct within the context of the contract and therefore, the associated revenues are allocated to the overall performanceobligation and typically recognized ratably over the initial term of the related drilling contract. We record a contract liability for mobilization fees received, which is typicallyamortized ratably to revenue as services are rendered over the initial term of the related drilling contract. The amortized amount is adjusted accordingly if the term of the initialcontract is extended.
Service Revenue
We adopted Topic 606 effective January 1, 2018, using the modified retrospective implementation method. Accordingly, we have applied the five-step methodoutlined in Topic 606 for determining when and how revenue is recognized to all contracts that were not completed as of the date of adoption. Revenues for reporting periodsbeginning as of January 1, 2018 are presented under Topic 606, while prior period amounts have not been adjusted and continue to be reported under the previous revenuerecognition guidance. For contracts that were modified before the effective date, we have considered the modification guidance within the new standard and determined that therevenue recognized and contract balances recorded prior to adoption for such contracts were not impacted. While Topic 606 requires additional disclosure of the nature, amount,timing, and uncertainty of revenue and cash flows arising from contracts with customers, its adoption has not had a material impact on the measurement or recognition of ourrevenues. As part of the adoption, no adjustments were needed to the consolidated balance sheets, statements of operations and statements of cash flows.
Our rental tools and drilling services provided under each contract is a single performance obligation satisfied over time and comprised of a series of distinct timeincrements, or service periods. Total revenue is determined for each individual contract by estimating both fixed and variable consideration expected to be earned over thecontract term. Fixed consideration generally relates to activities that are not distinct within the context of our contracts and is recognized on a straight-line basis over thecontract term. Variable consideration generally relates to distinct service periods during the contract term and are recognized in the period when the services are performed. Ourcontract terms generally range from 2 to 60 months.
The amount estimated for variable consideration may be constrained (reduced) and is only recognized as revenue to the extent that it is probable that a significantreversal of previously recognized revenue will not occur during the contract term. When determining if variable consideration should be constrained, management considerswhether there are factors outside the Company’s control that could result in a significant reversal of revenue as well as the likelihood and magnitude of a potential reversal ofrevenue. These estimates are re-assessed each reporting period as required. Accounts receivable are recognized when the right to consideration becomes unconditional basedupon contractual billing schedules. Payment terms on invoiced amounts are typically 30 days.
Rental Tools Services Business
Dayrate Revenues
Our rental tools services contracts generally provide for payment on a dayrate basis depending on the rate for the tool defined in the contract.
Such dayrate consideration is allocated to the distinct daily increment it relates to within the contract term, and therefore, recognized in line with the contractual ratebilled for the services provided for any given day.
37

Table of Contents
Drilling Services Business
Dayrate Revenues
Our drilling services contracts generally provide for payment on a dayrate basis, with higher rates for periods when the drilling unit is operating and lower rates or zerorates for periods when drilling operations are interrupted or restricted. The dayrate invoices billed to the customer are typically determined based on the varying rates applicableto the specific activities performed on an hourly basis.
Such dayrate consideration is allocated to the distinct hourly increment to which it relates within the contract term, and therefore, recognized in line with the contractualrate billed for the services provided for any given hour.
Mobilization Revenues
We may receive fees (on either a fixed lump-sum or variable dayrate basis) for the mobilization of our rigs.
These activities are not considered to be distinct within the context of the contract and therefore, the associated revenues are allocated to the overall performanceobligation and typically recognized ratably over the initial term of the related drilling contract. We record a contract liability for mobilization fees received, which is typicallyamortized ratably to revenue as services are rendered over the initial term of the related drilling contract. The amortized amount is adjusted accordingly if the term of the initialcontract is extended.
Capital Modification Revenues
We may, from time to time, receive fees from our customers for capital improvements to our rigs to meet contractual requirements (on either a fixed lump-sum orvariable dayrate basis).
Such revenues are allocated to the overall performance obligation and typically recognized ratably over the initial term of the related drilling contract as these activitiesare not considered to be distinct within the context of our contracts. A contract liability is recorded for such fees when received.
Demobilization Revenues
We may receive fees (on either a fixed lump-sum or variable dayrate basis) for the demobilization of our rigs.
Due to the inherent uncertainty regarding the realization, we have elected to not recognize demobilization revenues until the uncertainty is resolved. Therefore,demobilization revenues are recognized once the related performance obligations have been completed.
Reimbursable Revenues
We generally receive reimbursements from our customers for the purchase of supplies, equipment, personnel services and other services provided at their request inaccordance with a drilling contract or other agreement.
Such reimbursable revenues are variable and subject to uncertainty, as the amounts received and timing thereof is highly dependent on factors outside of our control.Accordingly, reimbursable revenues are not included in the total transaction price until the uncertainty is resolved, which typically occurs when the related costs are incurred onbehalf of a customer. We are generally considered a principal in such transactions and record the associated revenues at the gross amount billed to the customer in ourconsolidated condensed statements of operations. Such amounts are recognized once the services have been performed.
Reimbursable revenues during the period were as follows:
Successor Predecessor
Three Months Ended
September 30, Three Months Ended
September 30,
Dollars in thousands 2019 2018
Reimbursable revenue $ 23,152 $ 13,404
38

Table of Contents
Successor Predecessor
Six Months Ended
September 30, Three Months Ended
March 31, Nine Months Ended
September 30,
Dollars in thousands 2019 2019 2018
Reimbursable revenue $ 41,617 $ 28,541 $ 40,440
Contract Costs
The following is a description of the different costs that we may incur for our contracts:
Mobilization Costs
These costs include certain direct and incremental costs incurred for mobilization of contracted rigs. These costs relate directly to a contract, enhance resources of theCompany that will be used in satisfying its performance obligations in the future and are expected to be recovered. These costs are capitalized when incurred as a current ornoncurrent asset (depending on the length of the initial contract term), and are typically amortized over the initial term of the related drilling contract. Current and non-currentcapitalized mobilization costs are included in other current assets and other non-current assets, respectively, on our consolidated balance sheet.
Capitalized mobilization costs were as follows:
Successor Predecessor
Dollars in thousandsSeptember 30,
2019 December 31,
2018
Capitalized mobilization costs $ 6,151 $ 5,343
There was no impairment loss in relation to capitalized costs. Amortization of these capitalized mobilization costs were as follows:
Successor Predecessor
Three Months Ended
September 30, Three Months Ended
September 30,
Dollars in thousands 2019 2018
Amortization of capitalized mobilization costs $ 352 $ 1,774
Successor PredecessorSix Months Ended
September 30, Three Months Ended
March 31, Nine Months Ended
September 30,
Dollars in thousands 2019 2019 2018
Amortization of capitalized mobilization costs $ 480 $ 3,066 $ 3,901
Demobilization Costs
These costs are incurred for the demobilization of rigs at contract completion and are recognized as incurred during the demobilization process.
Capital Modification Costs
These costs are incurred for rig modifications or upgrades required for a contract, which are considered to be capital improvements, are capitalized as property, plantand equipment and depreciated over the estimated useful life of the improvement.
Contract Liabilities
The following table provides information about contract liabilities from contracts with customers:
39

Table of Contents
Successor Predecessor
Dollars in thousandsSeptember 30,
2019 December 31,
2018
Contract liabilities - current (Deferred revenue) (1) $ 1,942 $ 4,081Contract liabilities - noncurrent (Deferred revenue) (1) 895 2,441Total contract liabilities $ 2,837 $ 6,522
(1) Contract liabilities - current and contract liabilities - noncurrent are included in accounts payable and accrued liabilities and other long-term liabilities respectively, inour consolidated condensed balance sheet as of September 30, 2019 and December 31, 2018.
Contract liabilities relate to mobilization revenues and capital modification revenues, where, we have unconditional right to cash or cash has been received butperformance obligations have not been fulfilled. These liabilities are reduced and revenue is recognized as performance obligations are fulfilled.
Significant changes to contract liabilities balances during the nine months ended September 30, 2019 are shown below:
Dollars in thousands Contract Liabilities
Balance at December 31, 2018 (Predecessor) $ 6,522Decrease due to recognition of revenue (1,451 )Increase to deferred revenue during current period 1,635Elimination of deferred revenue due to the adoption of fresh start accounting (3,634 )Balance at March 31, 2019 (Predecessor) 3,072 Decrease due to recognition of revenue (1,250 )Increase to deferred revenue during current period 1,015Balance at September 30, 2019 (Successor) $ 2,837
Transaction Price Allocated to the Remaining Performance Obligations
The following table includes revenues expected to be recognized in the future related to performance obligations that are unsatisfied (or partially unsatisfied) at the endof the reporting period.
Successor
Balance at September 30, 2019
Dollars in thousands Remaining 2019 2020 2021 Beyond 2021 Total
Deferred lease revenue $ — — — — $ —Deferred service revenue $ 464 1,842 531 — $ 2,837
The revenues included above consist of mobilization and capital modification revenues for both wholly and partially unsatisfied performance obligations, which havebeen estimated for purposes of allocating across the entire corresponding performance obligations. The amounts are derived from the specific terms within contracts that containsuch provisions, and the expected timing for recognition of such revenue is based on the estimated start date and duration of each respective contract based on informationknown at September 30, 2019. The actual timing of recognition of such amounts may vary due to factors outside of our control. We have applied the disclosure practicalexpedient in FASB ASC Topic No. 606-10-50-14A(b) and have not included estimated variable consideration related to wholly unsatisfied performance obligations or todistinct future time increments within our contracts.
40

Table of Contents
Note 12 - Reportable Segments
Our business is comprised of two business lines: (1) rental tools services and (2) drilling services. We report our rental tools services business as two reportablesegments: (1) U.S. rental tools and (2) International rental tools. We report our drilling services business as two reportable segments: (1) U.S. (lower 48) drilling and (2)International & Alaska drilling.
Within the four reportable segments, we have one business unit under U.S. rental tools, one business unit under international rental tools, one business unit under U.S.(lower 48) drilling, and we aggregate our Arctic, Eastern Hemisphere, and Latin America business units under International & Alaska drilling, for a total of six business units.The Company has aggregated each of its business units in one of the four reporting segments based on the guidelines of the FASB ASC Topic No. 280, Segment Reporting. Weeliminate inter-segment revenues and expenses. We disclose revenues under the four reportable segments based on the similarity of the use and markets for the groups ofproducts and services within each segment.
Rental Tools Services Business
In our rental tools services business, we provide premium rental equipment and services to exploration & production companies, drilling contractors, and servicecompanies on land and offshore in the U.S. and select international markets. Tools we provide include standard and heavy-weight drill pipe, all of which are available withstandard or high-torque connections, tubing, drill collars, pressure control equipment, including blowout preventers, and more. We also provide well construction services,which includes tubular running services and downhole tool rentals, well intervention services, which includes whipstocks, fishing, and related services, as well as inspectionand machine shop support. Rental tools are used during drilling and/or workover programs and are requested by the customer as needed, requiring us to keep a broad inventoryof rental tools in stock. Rental tools are usually rented on a daily or monthly basis.
U.S. Rental Tools
Our U.S. rental tools segment maintains an inventory of rental tools for deepwater, drilling, completion, workover, and production applications at facilities inLouisiana, Texas, Wyoming, North Dakota and West Virginia. We also provide well construction and well intervention services. Our largest single market for rental tools isU.S. land drilling, a cyclical market driven primarily by oil and natural gas prices and our customers’ access to project financing. A portion of our U.S. rental tools businesssupplies tubular goods and other equipment to offshore GOM customers.
International Rental Tools
Our international rental tools segment maintains an inventory of rental tools and provides well construction, well intervention, and surface and tubular services to ourcustomers in the Middle East, Latin America, Europe, and Asia-Pacific regions.
Drilling Services Business
In our drilling services business, we drill oil, natural gas, and geothermal wells for customers globally. We provide this service with both Company-owned rigs andcustomer-owned rigs. We refer to the provision of drilling services with customer-owned rigs as our operations and management (“O&M”) service in which our customers owntheir own drilling rigs, but choose Parker Drilling to operate and manage the rigs for them. The nature and scope of activities involved in drilling a well is similar whether it isdrilled with a Company-owned rig (as part of a traditional drilling contract) or a customer-owned rig (as part of an O&M contract). In addition, we provide project-relatedservices, such as engineering, procurement, project management, commissioning of customer-owned drilling rig projects, operations execution, and quality and safetymanagement. We have extensive experience and expertise in drilling geologically challenging wells and in managing the logistical and technological challenges of operating inremote, harsh, and ecologically sensitive areas.
U.S. (Lower 48) Drilling
Our U.S. (lower 48) drilling segment provides drilling services with our GOM barge drilling rig fleet and markets our U.S. (lower 48) based O&M services. We alsoprovide O&M services for a customer-owned rig offshore California. Our GOM barge rigs drill for oil and natural gas in shallow waters in and along the inland waterways andcoasts of Louisiana, Alabama, and Texas. The majority of these wells are drilled in shallow water depths ranging from 6 to 12 feet. Our rigs are suitable for a variety of drillingprograms, from inland coastal waters requiring shallow draft barges, to open water drilling on both state and federal waters. Contract terms typically consist of well-to-well ormulti-well programs, most commonly ranging from 20 to 180 days.
41

Table of Contents
International & Alaska Drilling
Our International & Alaska drilling segment provides drilling services, using both Company-owned rigs and O&M contracts, and project-related services. The drillingmarkets in which this segment operates have one or more of the following characteristics:
• customers typically are major, independent, or national oil and natural gas companies or integrated serviceproviders;
• drilling programs in remote locations with little infrastructure, requiring a large inventory of spare parts and other ancillary equipment and self-supported servicecapabilities;
• complex wells and/or harsh environments (such as high pressures, deep depths, hazardous or geologically challenging conditions and sensitive environments) requiringspecialized equipment and considerable experience to drill; and
• O&M contracts that generally cover periods of one year ormore.
We have rigs under contract in Alaska, Kazakhstan, the Kurdistan region of Iraq, Guatemala, Mexico, and on Sakhalin Island, Russia. In addition, we have O&M andongoing project-related services for customer-owned rigs in Alaska, California, Kuwait, Canada, Indonesia, and on Sakhalin Island, Russia.
The following table represents the results of operations by reportable segment:
Successor Predecessor
Three Months Ended
September 30, Three Months Ended
September 30,
Dollars in thousands 2019 2018
Revenues: (1) U.S. rental tools $ 49,256 $ 50,944International rental tools 24,067 20,151
Total rental tools services 73,323 71,095U.S. (lower 48) drilling 14,487 4,530International & Alaska drilling 72,273 47,770
Total drilling services 86,760 52,300Total revenues 160,083 123,395
Operating gross margin: (2) U.S. rental tools 13,446 16,588International rental tools 1,925 (2,713 )
Total rental tools services 15,371 13,875U.S. (lower 48) drilling 2,505 (3,402 )International & Alaska drilling 4,392 (8,541 )
Total drilling services 6,897 (11,943 )Total operating gross margin 22,268 1,932General and administrative expense (5,983 ) (14,495 )Loss on impairment — (43,990 )Gain (loss) on disposition of assets, net (92 ) 9Reorganization items (211 ) —Total operating income (loss) 15,982 (56,544 )Interest expense (7,118 ) (11,350 )Interest income 362 23Other (258 ) (709 )Income (loss) before income taxes $ 8,968 $ (68,580 )
42

Table of Contents
Successor Predecessor
Six Months Ended
September 30, Three Months Ended
March 31, Nine Months Ended
September 30,
Dollars in thousands 2019 2019 2018
Revenues: (1) U.S. rental tools $ 102,192 $ 52,595 $ 127,775International rental tools 46,222 21,109 57,563
Total rental tools services 148,414 73,704 185,338U.S. (lower 48) drilling 26,966 6,627 9,167International & Alaska drilling 140,734 77,066 157,168
Total drilling services 167,700 83,693 166,335Total revenues 316,114 157,397 351,673
Operating gross margin: (2) U.S. rental tools 31,317 17,289 30,903International rental tools 2,626 (3,581 ) (9,402 )
Total rental tools services 33,943 13,708 21,501U.S. (lower 48) drilling 3,485 (1,508 ) (12,443 )International & Alaska drilling 7,831 (776 ) (17,701 )
Total drilling services 11,316 (2,284 ) (30,144 )Total operating gross margin 45,259 11,424 (8,643 )General and administrative expense (11,593 ) (8,147 ) (28,984 )Loss on impairment — — (43,990 )Gain (loss) on disposition of assets, net (145 ) 384 (126 )Reorganization items (1,173 ) (92,977 ) —Total operating income (loss) 32,348 (89,316 ) (81,743 )Interest expense (14,781 ) (274 ) (33,787 )Interest income 736 8 76Other (902 ) (10 ) (1,609 )Income (loss) before income taxes $ 17,401 $ (89,592 ) $ (117,063 )
(1) For the six months ended September 30, 2019, our largest customer, ENL, constituted approximately 27.7 percent of our total consolidated revenues and approximately62.2 percent of our International & Alaska Drilling segment revenues. Excluding reimbursable revenues of $37.1 million, ENL constituted approximately 18.4 percentof our total consolidated revenues and approximately 49.8 percent of our International & Alaska Drilling segment revenues.
For the three months ended March 31, 2019, our largest customer, ENL, constituted approximately 31.2 percent of our total consolidated revenues and approximately63.8 percent of our International & Alaska Drilling segment revenues. Excluding reimbursable revenues of $26.3 million, ENL constituted approximately 17.7 percent ofour total consolidated revenues and approximately 46.6 percent of our International & Alaska Drilling segment revenues.
For the nine months ended September 30, 2018, our largest customer, ENL, constituted approximately 25.7 percent of our total consolidated revenues and approximately57.5 percent of our International & Alaska Drilling segment revenues. Excluding reimbursable revenues of $34.6 million, ENL constituted approximately 17.9 percent ofour total consolidated revenues and approximately 47.6 percent of our International & Alaska Drilling segment revenues.
(2) Operating gross margin is calculated as revenues less direct operating expenses, including depreciation and amortizationexpense.
43

Table of Contents
The following table shows the Company’s revenues by geographic region:
Successor Predecessor
Three Months Ended
September 30, Three Months Ended
September 30,
Dollars in Thousands 2019 2018
United States $ 70,887 $ 57,016Russia 45,769 30,315EMEA & Asia 22,807 23,902Latin America 10,480 2,596Other CIS 3,721 2,743Other 6,419 6,823
Total revenues $ 160,083 $ 123,395
Successor Predecessor
Six Months Ended
September 30, Three Months Ended
March 31, Nine Months Ended
September 30,
Dollars in Thousands 2019 2019 2018
United States $ 143,047 $ 66,253 $ 153,665Russia 88,047 49,387 90,378EMEA & Asia 47,794 25,133 66,206Latin America 17,275 5,482 10,214Other CIS 7,313 3,621 9,799Other 12,638 7,521 21,411
Total revenues $ 316,114 $ 157,397 $ 351,673
Note 13 - Recent Accounting Pronouncements
Standards recently adopted
In February 2016, the FASB issued ASU No. 2016-02, Leases (Topic 842). This ASU requires (a) an entity to separate the lease components from the non-leasecomponents in a contract where the lease component will be accounted for under ASU 2016-02 and the non-lease component will be accounted for under ASU 2014-09, (b)recognition of lease assets and lease liabilities by lessees and derecognition of the leased asset and recognition of a net investment in the lease by the lessor and (c) additionaldisclosure requirements for both lessees and lessors. We adopted the ASU 2016-02, Leases (Topic 842) effective January 1, 2019, using the modified retrospective transitionmethod applied at the beginning of the period of adoption. See Note 5 - Operating Leases for further details.
Standards not yet adopted
In June 2016, the FASB issued ASU No. 2016-13, Financial Instruments - Credit Losses (Topic 326). This requires changes to the recognition of credit losses onfinancial instruments not accounted for at fair value through net income, including loans, debt securities, trade receivables, net investments in leases and available-for-sale debtsecurities. This ASU broadens the information that an entity must consider in developing its estimate of expected credit losses, requiring an entity to estimate credit losses overthe life of an exposure based on historical information, current information and reasonable and supportable forecasts. The guidance is effective for interim and annual periodsbeginning after December 15, 2019. In October 2019, FASB tentatively decided to defer the effective dates for eligible SEC filers that are eligible to be smaller reportingcompanies to interim and annual periods beginning after December 15, 2022. We are currently evaluating the effect the guidance will have on our consolidated financialstatements.
44

Table of Contents
Item 2. Management’s Discussion and Analysis of Financial Condition and Results of Operations
Management’s discussion and analysis should be read in conjunction with Item 1. Financial Statements of this quarterly report on Form 10-Q and with our AnnualReport on Form 10-K for the year ended December 31, 2018. We use rounded numbers in the Management Discussion and Analysis section which may result in slightdifferences with results reported under Item 1. Financial Statements.
Executive Summary
The oil and natural gas industry is highly cyclical. Activity levels are driven by traditional energy industry activity indicators, which include current and expectedcommodity prices, drilling rig counts, footage drilled, well counts, and our customers’ spending levels allocated to exploratory and developmental drilling.
Some of these historical market indicators are listed below:
Nine Months Ended September 30, 2019 2018 % Change
Worldwide rig count (1) U.S. (land and offshore) 985 1,018 (3 )%International (2) 1,094 980 12 %
Commodity Prices (3) Crude oil (Brent) per bbl $ 64.8 $ 72.7 (11 )%Crude oil (West Texas Intermediate) per bbl $ 57.1 $ 66.8 (15 )%Natural gas (Henry Hub) per mcf $ 2.6 $ 2.9 (10 )%
(1) Estimate of drilling activity measured by the average active rig count for the periods indicated - Source: Baker Hughes Rig Count.
(2) Excludes Canadian Rig Count.
(3) Average daily commodity prices for the periods indicated based on NYMEX front-month composite energy prices.
Recent Developments
Chapter 11 Emergence
On December 12, 2018, prior to the commencement of the Chapter 11 Cases, the Debtors entered into a restructuring support agreement (as amended on January 28,2019, the “RSA”) with certain significant holders of (1) 7.50% Senior Notes, due 2020 (the “7.50% Note Holders”) issued pursuant to the indenture (the “7.50% NotesIndenture”) dated July 30, 2013 (the “7.50% Notes”), by and among Parker Drilling, the subsidiary guarantors party thereto and Bank of New York Mellon Trust Company,N.A., as trustee (the “Trustee”), (2) 6.75% Senior Notes, due 2022 (the “6.75% Note Holders”) issued pursuant to the indenture (the “6.75% Notes Indenture”) dated January22, 2014 (the “6.75% Notes” and together with the 7.50% Notes, the “Senior Notes”), by and among Parker Drilling, the subsidiary guarantors party thereto and the Trustee, (3)Parker Drilling’s existing common stock (the “Predecessor Common Stock”) and (4) Parker Drilling’s 7.25% Series A Mandatory Convertible Preferred Stock (the“Predecessor Preferred Stock” and such holders to support a restructuring (the “Restructuring”) on the terms set forth in the Plan.
On December 12, 2018 (the “Petition Date”), Parker Drilling and certain of its U.S. subsidiaries (collectively, the “Debtors”) filed a prearranged plan of reorganization(the “Plan”) and commenced voluntary petitions under chapter 11 (the “Chapter 11 Cases”) of title 11 of the United States Code (the “Bankruptcy Code”) in the United StatesBankruptcy Court for the Southern District of Texas, Houston Division (the “Bankruptcy Court”). The Plan was confirmed by the Bankruptcy Court on March 7, 2019, and theDebtors emerged from the bankruptcy proceedings on March 26, 2019.
Fresh Start Accounting
Upon emergence from bankruptcy, we adopted fresh start accounting (“Fresh Start Accounting”) in accordance with FASB ASC Topic No. 852 - Reorganizations(“Topic 852”), which resulted in the Company becoming a new entity for financial reporting purposes. In accordance with Topic 852, the Company is required to adopt FreshStart Accounting upon its emergence from bankruptcy because (1) the holders of the then existing common shares of the Predecessor received less than 50% of the new
45

Table of Contents
common shares of the Successor outstanding upon emergence and (2) the reorganization value of the Company’s assets immediately prior to confirmation of the Plan was lessthan the total of all post-petition liabilities and allowed claims.
Upon adoption of Fresh Start Accounting, the reorganization value derived from the enterprise value as disclosed in the Plan, was allocated to the Company’s assetsand liabilities based on their fair values (except for deferred income taxes) in accordance with FASB ASC Topic No. 805 - Business Combinations. The amount of deferredincome taxes recorded was determined in accordance with FASB ASC Topic No. 740 - Income Taxes.
We evaluated the events between March 26, 2019 and March 31, 2019 and concluded that the use of an accounting convenience date of March 31, 2019, (the “FreshStart Reporting Date”) would not have a material impact on our results of operations or balance sheet. As such, the application of fresh start accounting was reflected in ourcondensed consolidated balance sheet as of March 31, 2019, and fresh start accounting adjustments related thereto were included in our condensed consolidated statement ofoperations for the three months ended March 31, 2019.
References to “Successor” relate to the financial position and results of operations of the reorganized Company as of and subsequent to March 31, 2019. References to“Predecessor” relate to the financial position of the Company prior to, and results of operations through and including, March 31, 2019. As a result of the adoption of FreshStart Accounting and the effects of the implementation of the Plan, the Company’s consolidated condensed financial statements of the Successor (as of and subsequent to March31, 2019), are not comparable to its consolidated condensed financial statements of the Predecessor.
Plan to delist from the New York Stock Exchange
As more fully described in proxy materials filed with the SEC, the Company’s Finance and Strategic Planning Committee, which consists solely of independentdirectors, has recommended, and its Board of Directors (the “Board”) has approved, a plan to cease the registration of the Company’s common stock under the SecuritiesExchange Act of 1934, as amended, and to delist its shares of common stock from trading on the New York Stock Exchange. In order to deregister its shares of common stock,the Company must reduce its number of stockholders of record to below 300. To accomplish this, the Board is proposing to amend the Company’s amended and restatedcertificate of incorporation to effect a reverse stock split, to be followed immediately by a forward stock split, at a ratio of (i) not less than 1-for-5 and not greater than 1-for-100, in the case of the reverse stock split, and (ii) not less than 5-for-1 and not greater than 100-for-1, in the case of the forward stock split, which collectively are the “stocksplits”. If approved by our stockholders, the exact stock split ratios will be set within the foregoing ranges at the discretion of the Board (and, in all cases, with the forward stocksplit ratio being the inverse of the reverse stock split ratio), without further approval or authorization of our stockholders. In addition, our Board, in its sole discretion, mayeffectuate the stock splits immediately following the public announcement of the stock split ratios chosen by the Board or elect to abandon the proposed stock splits and theoverall transaction (whether or not authorized by the stockholders), at any time. A stockholder owning immediately prior to the effective time fewer than a minimum number ofshares, which, depending on the stock split ratios chosen by the Board, would be between 5 and 100, would be paid $30.00, without interest, for each share of common stockheld by such holder immediately prior to the effective time. Cashed out stockholders would no longer be stockholders of the Company. Based upon information provided as ofSeptember 24, 2019 and for illustrative purposes only, we estimate that the cash payment to cashed out stockholders, professional fees and other expenses would beapproximately $1.6 million, if the reverse stock split ratio were 50, which is the approximate midpoint within the proposed range of stock split ratios. However, this amountcould be higher or lower depending on the reverse stock split ratio the Board chooses and the number of persons owning fewer than the minimum number immediately prior tothe effective time. The consideration to be paid to the cashed out stockholders and the costs of the stock splits will be paid from cash on hand.
Financial Results
Revenues were $160.1 million for the three months ended September 30, 2019 and $123.4 million for the three months ended September 30, 2018. Operating grossmargin was $22.3 million for the three months ended September 30, 2019 and $1.9 million for the three months ended September 30, 2018.
Outlook
We expect U.S. rental tools fourth quarter revenues to be slightly lower as compared with the third quarter, as U.S. land activity continues to decline. For theInternational rental tools segment, we expect fourth quarter revenues will increase as compared with the third quarter, as recently awarded contracts are recognized and activityincreases.
We expect U.S. (lower 48) drilling fourth quarter revenues to decrease as compared with the third quarter due to lower utilization in the Gulf of Mexico market andchanges in O&M activity. For the International & Alaska drilling segment, we anticipate fourth quarter revenues will decline as compared with the third quarter, largely due toanticipated lower utilization in Sakhalin Island, Russia and the Kurdistan Region of Iraq, partially offset by improvements in Alaska and Mexico.
46

Table of Contents
Results of Operations
Our business is comprised of two business lines: (1) rental tools services and (2) drilling services. We report our rental tools services business as two reportablesegments: (1) U.S. rental tools and (2) International rental tools. We report our drilling services business as two reportable segments: (1) U.S. (lower 48) drilling and (2)International & Alaska drilling. We eliminate inter-segment revenues and expenses.
We analyze financial results for each of our reportable segments. The reportable segments presented are consistent with our reportable segments discussed in ourconsolidated condensed financial statements. See Note 12 - Reportable Segments in Item 1. Financial Statements for further discussion. We monitor our reporting segmentsbased on several criteria, including operating gross margin and operating gross margin excluding depreciation and amortization. Operating gross margin excluding depreciationand amortization is computed as revenues less direct operating expenses, and excludes depreciation and amortization expense, where applicable. Operating gross marginpercentages are computed as operating gross margin as a percent of revenues. The operating gross margin excluding depreciation and amortization amounts and percentagesshould not be used as a substitute for those amounts reported under accounting principles generally accepted in the United States (“U.S. GAAP”), but should be viewed inaddition to the Company’s reported results prepared in accordance with U.S. GAAP. Management believes this information provides valuable insight into the informationmanagement considers important in managing the business.
47

Table of Contents
Three months ended September 30, 2019 and the Three months ended September 30, 2018
Revenues were $160.1 million for the three months ended September 30, 2019 and $123.4 million for the three months ended September 30, 2018. Operating grossmargin was $22.3 million for the three months ended September 30, 2019 and $1.9 million for the three months ended September 30, 2018.
The following table presents our operating results for the following periods by reportable segment:
Successor Predecessor
Three Months Ended September 30, Three Months Ended September 30,
Dollars in Thousands 2019 2018
Revenues: U.S. rental tools $ 49,256 31% $ 50,944 42 %International rental tools 24,067 15% 20,151 16 %
Total rental tools services 73,323 46% 71,095 58 %U.S. (lower 48) drilling 14,487 9% 4,530 4 %International & Alaska drilling 72,273 45% 47,770 38 %
Total drilling services 86,760 54% 52,300 42 %Total revenues 160,083 100% 123,395 100 %
Operating gross margin excluding depreciation and amortization: (1) U.S. rental tools 23,743 48% 28,995 57 %International rental tools 3,824 16% 1,378 7 %
Total rental tools services 27,567 38% 30,373 43 %U.S. (lower 48) drilling 3,938 27% (1,171) (26)%International & Alaska drilling 11,092 15% 250 1 %
Total drilling services 15,030 17% (921) (2)%Total operating gross margin excluding depreciation and amortization 42,597 27% 29,452 24 %Depreciation and amortization (20,329) (27,520) Total operating gross margin 22,268 1,932 General and administrative expense (5,983) (14,495) Loss on impairment — (43,990) Gain (loss) on disposition of assets, net (92) 9 Reorganization items (211) — Total operating income (loss) $ 15,982 $ (56,544)
(1) Percentage amounts are calculated by dividing the operating gross margin excluding depreciation and amortization by revenue for the respective segment and businesslines.
48

Table of Contents
Operating gross margin amounts are reconciled to Operating gross margin excluding depreciation and amortization as follows:
Dollars in Thousands U.S. Rental Tools International Rental
Tools
U.S.(Lower 48)
Drilling International &Alaska Drilling Total
Three months ended September 30, 2019 (Successor) Operating gross margin (1) (Successor) $ 13,446 $ 1,925 $ 2,505 $ 4,392 $ 22,268Depreciation and amortization (Successor) 10,297 1,899 1,433 6,700 20,329Operating gross margin excluding depreciation and amortization(Successor) $ 23,743 $ 3,824 $ 3,938 $ 11,092 $ 42,597
Dollars in Thousands U.S. Rental Tools International Rental
Tools
U.S.(Lower 48)
Drilling International &Alaska Drilling Total
Three months ended September 30, 2018 (Predecessor) Operating gross margin (1) (Predecessor) $ 16,588 $ (2,713) $ (3,402) $ (8,541) $ 1,932Depreciation and amortization (Predecessor) 12,407 4,091 2,231 8,791 27,520Operating gross margin excluding depreciation and amortization(Predecessor) $ 28,995 $ 1,378 $ (1,171) $ 250 $ 29,452
(1) Operating gross margin is calculated as revenues less direct operating expenses, including depreciation and amortizationexpense.
The following table presents our average utilization rates and rigs available for service for the three months ended September 30, 2019 and 2018, respectively:
Successor Predecessor
Three Months Ended
September 30, Three Months Ended
September 30,
2019 2018
U.S. (lower 48) drilling
Rigs available for service (1) 10 13Utilization rate of rigs available for service (2) 21 % 14 %
International & Alaska drilling
Eastern hemisphere Rigs available for service (1) 10 10Utilization rate of rigs available for service (2) 41 % 50 %
Latin America region Rigs available for service (1) 7 7Utilization rate of rigs available for service (2) 48 % 25 %
Alaska Rigs available for service (1) 2 2Utilization rate of rigs available for service (2) 50 % 50 %
Total International & Alaska drilling Rigs available for service (1) 19 19Utilization rate of rigs available for service (2) 45 % 41 %
(1) The number of rigs available for service is determined by calculating the number of days each rig was in our fleet and was under contract or available for contract. Forexample, a rig under contract or available for contract for six months of a year is 0.5 rigs available for service for such year. Our method of computation of rigsavailable for service may or may not be comparable to other similarly titled measures of other companies.
49

Table of Contents
(2) Rig utilization rates are based on a weighted average basis assuming total days availability for all rigs available for service. Rigs acquired or disposed of are treated asadded to or removed from the rig fleet as of the date of acquisition or disposal. Rigs that are in operation or fully or partially staffed and on a revenue-producingstandby status are considered to be utilized. Rigs under contract that generate revenues during moves between locations or during mobilization or demobilization arealso considered to be utilized. Our method of computation of rig utilization may or may not be comparable to other similarly titled measures of other companies.
Rental Tools Services Business
U.S. Rental Tools
U.S. rental tools segment revenues were $49.3 million for the third quarter of 2019 and $50.9 million for the third quarter of 2018. The results for the three monthsended September 30, 2019, were primarily driven by customer activity in U.S. land and offshore rentals.
U.S. rental tools segment operating gross margin excluding depreciation and amortization was $23.7 million for the third quarter of 2019 and $29.0 million for thethird quarter of 2018. The results for the three months ended September 30, 2019, were primarily driven by revenues discussed above.
International Rental Tools
International rental tools segment revenues were $24.1 million for the third quarter of 2019 and $20.2 million for the third quarter of 2018. The results for the threemonths ended September 30, 2019, were primarily driven by well construction, well intervention services, and surface and tubular services.
International rental tools segment operating gross margin excluding depreciation and amortization was $3.8 million for the third quarter of 2019 and $1.4 million forthe third quarter of 2018. The results for the three months ended September 30, 2019, were primarily driven by revenues discussed above.
Drilling Services Business
U.S. (Lower 48) Drilling
U.S. (lower 48) drilling segment revenues were $14.5 million for the third quarter of 2019 and $4.5 million for the third quarter of 2018. The results for the threemonths ended September 30, 2019, were primarily driven by our inland barge rig fleet and operations and management (“O&M”) revenue.
U.S. (lower 48) drilling segment operating gross margin excluding depreciation and amortization was $3.9 million for the third quarter of 2019 and a loss of $1.2million for the third quarter of 2018. The results for the three months ended September 30, 2019, were primarily driven by revenues discussed above.
International & Alaska Drilling
International & Alaska drilling segment revenues were $72.3 million for the third quarter of 2019 and $47.8 million for the third quarter of 2018. The results for thethree months ended September 30, 2019, were primarily driven by O&M revenue and revenue from Company-owned rigs in Canada, Kuwait, Indonesia, Sakhalin Island,Russia, Mexico, Kazakhstan, Alaska and the Kurdistan region of Iraq.
International & Alaska drilling segment operating gross margin excluding depreciation and amortization was $11.1 million for the third quarter of 2019 and $0.3million for the third quarter of 2018. The results for the three months ended September 30, 2019, were primarily driven by revenues discussed above.
50

Table of Contents
Other Financial Data
General and Administrative Expense
General and administrative expense was $6.0 million for the third quarter of 2019 and $14.5 million for the third quarter of 2018. The results for the three monthsended September 30, 2019, were primarily driven by compensation expense and professional fees.
Loss on impairment
There was no loss on impairment for the third quarter of 2019. Loss on impairment was $44.0 million for the third quarter of 2018, which consisted of $34.2 million forGulf of Mexico inland barge asset group and $9.8 million for International barge asset group.
Gain (Loss) on Disposition of Assets, Net
Gain (loss) on disposition of assets, net was a loss of $0.1 million and nominal for the third quarter of 2019 and 2018, respectively. We periodically sell equipmentdeemed to be excess, obsolete, or not currently required for operations.
Reorganization Items
Reorganization items were $0.2 million for the third quarter of 2019. The reorganization items primarily consisted of professional fees related to the Chapter 11 Cases.There were no reorganization items for the third quarter of 2018.
Interest Expense and Income
Interest expense was $7.1 million for the third quarter of 2019 and $11.4 million for the third quarter of 2018. The company emerged from bankruptcy at the end of thefirst quarter of 2019, which resulted in a decrease in overall debt balance. Interest income was $0.4 million in the third quarter of 2019 and nominal for 2018. We earn interestincome on our cash balances.
Other
Other income and expense was $0.3 million of expense for the third quarter of 2019 and $0.7 million of expense for the third quarter of 2018. Activity in all periodsprimarily included the impact of foreign currency fluctuations.
Income Tax Expense
Income tax expense was $5.0 million for the third quarter of 2019 and $2.4 million during the third quarter of 2018. We recognized income tax expense due to thejurisdictional mix of income and loss during the period, along with our continued inability to recognize the benefits associated with certain losses as a result of valuationallowances.
51

Table of Contents
Six Months Ended September 30, 2019, Three Months Ended March 31, 2019 and the Nine Months Ended September 30, 2018
Revenues were $316.1 million and $157.4 million for the six months ended September 30, 2019, and the three months ended March 31, 2019, respectively, and $351.7million for the nine months ended September 30, 2018. Operating gross margin was $45.3 million and $11.4 million for the six months ended September 30, 2019, and the threemonths ended March 31, 2019, respectively, and a loss of $8.6 million for the nine months ended September 30, 2018.
The following table presents our operating results for the following periods by reportable segment:
Successor Predecessor
Six Months Ended September 30, 2019
Three Months Ended March 31,
Nine Months Ended September 30,
Dollars in Thousands 2019 2019 2018
Revenues: U.S. rental tools $ 102,192 32% $ 52,595 34 % $ 127,775 36 %International rental tools 46,222 15% 21,109 13 % 57,563 16 %
Total rental tools services 148,414 47% 73,704 47 % 185,338 52 %U.S. (lower 48) drilling 26,966 9% 6,627 4 % 9,167 3 %International & Alaska drilling 140,734 44% 77,066 49 % 157,168 45 %
Total drilling services 167,700 53% 83,693 53 % 166,335 48 %Total revenues 316,114 100% 157,397 100 % 351,673 100 %Operating gross margin excluding depreciation and amortization:(1)
U.S. rental tools 51,412 50% 29,004 55 % 67,562 53 %International rental tools 6,755 15% 534 3 % 2,329 4 %
Total rental tools services 58,167 39% 29,538 40 % 69,891 38 %U.S. (lower 48) drilling 6,494 24% (700) (11)% (5,274) (58)%International & Alaska drilling 21,318 15% 7,688 10 % 9,945 6 %
Total drilling services 27,812 17% 6,988 8 % 4,671 3 %Total operating gross margin excluding depreciation andamortization 85,979 27% 36,526 23 % 74,562 21 %Depreciation and amortization (40,720) (25,102) (83,205) Total operating gross margin 45,259 11,424 (8,643) General and administrative expense (11,593) (8,147) (28,984) Loss on impairment — — (43,990) Gain (loss) on disposition of assets, net (145) 384 (126) Reorganization items (1,173) (92,977) — Total operating income (loss) $ 32,348 $ (89,316) $ (81,743)
(1) Percentage amounts are calculated by dividing the operating gross margin excluding depreciation and amortization by revenue for the respective segment and businesslines.
52

Table of Contents
Operating gross margin amounts are reconciled to Operating gross margin excluding depreciation and amortization as follows:
Dollars in ThousandsU.S. Rental
Tools International Rental
Tools
U.S. (Lower 48)
Drilling International &Alaska Drilling Total
Six months ended September 30, 2019 (Successor) Operating gross margin (1) (Successor) $ 31,317 $ 2,626 $ 3,485 $ 7,831 $ 45,259Depreciation and amortization (Successor) 20,095 4,129 3,009 13,487 40,720Operating gross margin excluding depreciation and amortization(Successor) $ 51,412 $ 6,755 $ 6,494 $ 21,318 $ 85,979
Dollars in ThousandsU.S. Rental
Tools International Rental
Tools
U.S. (Lower 48)
Drilling International &Alaska Drilling Total
Three months ended March 31, 2019 (Predecessor) Operating gross margin (1) (Predecessor) $ 17,289 $ (3,581) $ (1,508) $ (776) $ 11,424Depreciation and amortization (Predecessor) 11,715 4,115 808 8,464 25,102Operating gross margin excluding depreciation and amortization(Predecessor) $ 29,004 $ 534 $ (700) $ 7,688 $ 36,526
Dollars in ThousandsU.S. Rental
Tools International Rental
Tools
U.S. (Lower 48)
Drilling International &Alaska Drilling Total
Nine months ended September 30, 2018 (Predecessor) Operating gross margin (1) (Predecessor) $ 30,903 $ (9,402) $ (12,443) $ (17,701) $ (8,643)Depreciation and amortization (Predecessor) 36,659 11,731 7,169 27,646 83,205Operating gross margin excluding depreciation and amortization(Predecessor) $ 67,562 $ 2,329 $ (5,274) $ 9,945 $ 74,562
(1) Operating gross margin is calculated as revenues less direct operating expenses, including depreciation and amortizationexpense.
53

Table of Contents
The following table presents our average utilization rates and rigs available for service for the six months ended September 30, 2019, the three months ended March31, 2019, and nine months ended September 30, 2018, respectively:
Successor Predecessor
Six Months Ended September
30, Three Months Ended March
31, Nine Months Ended
September 30,
2019 2019 2018
U.S. (lower 48) drilling
Rigs available for service (1) 10 13 13Utilization rate of rigs available for service (2) 18 % 4 % 11 %
International & Alaska drilling
Eastern hemisphere Rigs available for service (1) 10 10 10Utilization rate of rigs available for service (2) 46 % 50 % 45 %
Latin America region Rigs available for service (1) 7 7 7Utilization rate of rigs available for service (2) 44 % 29 % 18 %
Alaska Rigs available for service (1) 2 2 2Utilization rate of rigs available for service (2) 50 % 50 % 50 %
Total International & Alaska drilling Rigs available for service (1) 19 19 19Utilization rate of rigs available for service (2) 46 % 42 % 36 %
(1) The number of rigs available for service is determined by calculating the number of days each rig was in our fleet and was under contract or available for contract. Forexample, a rig under contract or available for contract for six months of a year is 0.5 rigs available for service during such year. Our method of computation of rigsavailable for service may not be comparable to other similarly titled measures of other companies.
(2) Rig utilization rates are based on a weighted average basis assuming total days availability for all rigs available for service. Rigs acquired or disposed of are treated asadded to or removed from the rig fleet as of the date of acquisition or disposal. Rigs that are in operation or fully or partially staffed and on a revenue-producingstandby status are considered to be utilized. Rigs under contract that generate revenues during moves between locations or during mobilization or demobilization arealso considered to be utilized. Our method of computation of rig utilization may not be comparable to other similarly titled measures of other companies.
Rental Tools Services Business
U.S. Rental Tools
U.S. rental tools segment revenues were $102.2 million and $52.6 million for the six months ended September 30, 2019, and the three months ended March 31, 2019,respectively, and were $127.8 million for the nine months ended September 30, 2018. The results for the six months ended September 30, 2019, and the three months endedMarch 31, 2019, were primarily driven by customer activity in U.S. land and offshore rentals.
U.S. rental tools segment operating gross margin excluding depreciation and amortization was $51.4 million and $29.0 million for the six months ended September 30,2019, and the three months ended March 31, 2019, respectively, and was $67.6 million for the nine months ended September 30, 2018. The results for the six months endedSeptember 30, 2019, and the three months ended March 31, 2019, were primarily driven by revenues discussed above.
International Rental Tools
International rental tools segment revenues were $46.2 million and $21.1 million for the six months ended September 30, 2019, and the three months ended March 31,2019, respectively, and were $57.6 million for the nine months ended September
54
Table of Contents
30, 2018. The results for the six months ended September 30, 2019, and the three months ended March 31, 2019, were primarily driven by well construction, well interventionservices, and surface and tubular services.
International rental tools segment operating gross margin excluding depreciation and amortization was $6.8 million and $0.5 million for the six months endedSeptember 30, 2019, and the three months ended March 31, 2019, respectively, and $2.3 million for the nine months ended September 30, 2018. The results for the six monthsended September 30, 2019, and the three months ended March 31, 2019, were primarily driven by revenues discussed above.
Drilling Services Business
U.S. (Lower 48) Drilling
U.S. (lower 48) drilling segment revenues were $27.0 million and $6.6 million for the six months ended September 30, 2019, and the three months ended March 31,2019, respectively, and $9.2 million for the nine months ended September 30, 2018. The results for the six months ended September 30, 2019, and the three months endedMarch 31, 2019, were primarily driven by our inland barge rig fleet and O&M revenue.
U.S. (lower 48) drilling segment operating gross margin excluding depreciation and amortization was a gain of $6.5 million and a loss of $0.7 million for the sixmonths ended September 30, 2019, and the three months ended March 31, 2019, respectively, and a loss of $5.3 million for the nine months ended September 30, 2018. Theresults for the six months ended September 30, 2019, and the three months ended March 31, 2019, were primarily driven by revenues discussed above.
International & Alaska Drilling
International & Alaska drilling segment revenues were $140.7 million and $77.1 million for the six months ended September 30, 2019, and the three months endedMarch 31, 2019, respectively, and $157.2 million for the nine months ended September 30, 2018. The results for the six months ended September 30, 2019, and the threemonths ended March 31, 2019, were primarily driven by O&M revenue and revenue from Company-owned rigs in Canada, Kuwait, Indonesia, Sakhalin Island, Russia, Mexico,Kazakhstan, Alaska and the Kurdistan region of Iraq.
International & Alaska drilling segment operating gross margin excluding depreciation and amortization was $21.3 million and $7.7 million for the six months endedSeptember 30, 2019, and the three months ended March 31, 2019, respectively, and $9.9 million for the nine months ended September 30, 2018. The results for the six monthsended September 30, 2019, and the three months ended March 31, 2019, were primarily driven by revenues discussed above.
55

Table of Contents
Other Financial Data
General and Administrative Expense
General and administrative expense was $11.6 million and $8.1 million for the six months ended September 30, 2019, and the three months ended March 31, 2019,respectively, and $29.0 million for the nine months ended September 30, 2018. The results for the six months ended September 30, 2019, and the three months ended March 31,2019, were primarily driven by compensation expense and professional fees.
Loss on impairment
There was no loss on impairment for the six months ended September 30, 2019 or, the three months ended March 31, 2019. Loss on impairment was $44.0 million forthe nine months ended September 30, 2018, which consisted of $34.2 million for Gulf of Mexico inland barge asset group and $9.8 million for International barge asset group.
Gain (Loss) on Disposition of Assets, Net
Gain (loss) on disposition of assets, net was a loss of $0.1 million and a gain of $0.4 million for the six months ended September 30, 2019, and the three months endedMarch 31, 2019, respectively, and a loss of $0.1 million for the nine months ended September 30, 2018. We periodically sell equipment deemed to be excess, obsolete, or notcurrently required for operations.
Reorganization Items
Reorganization items were $1.2 million and $93.0 million for the six months ended September 30, 2019, and the three months ended March 31, 2019, respectively. Thereorganization items for the three months ended March 31, 2019, primarily consisted of gain on settlement of liabilities subject to compromise, loss from fresh start valuationadjustments, professional fees and backstop premium on rights offering in the amount of $191.1 million, $242.6 million, $30.1 million and $11.0 million, respectively, related tothe Chapter 11 Cases. The reorganization items for the six months ended September 30, 2019, primarily consisted of professional fees in the amount of $1.2 million, related tothe Chapter 11 Cases. There were no reorganization items for the nine months ended September 30, 2018.
Interest Expense and Income
Interest expense was $14.8 million and $0.3 million for the six months ended September 30, 2019, and the three months ended March 31, 2019, respectively, and $33.8million for the nine months ended September 30, 2018. The company emerged from bankruptcy at the end of the first quarter of 2019, which resulted in a decrease in overalldebt balance. Interest income was $0.7 million and nominal for the six months ended September 30, 2019, and the three months ended March 31, 2019, respectively. Interestincome was $0.1 million for the nine months ended September 30, 2018. We earn interest income on our cash balances.
Other
Other income and expense was an expense of $0.9 million and nominal for the six months ended September 30, 2019, and the three months ended March 31, 2019,respectively, and an expense of $1.6 million for the nine months ended September 30, 2018. Activity in all periods primarily included the impact of foreign currencyfluctuations.
Income Tax Expense
Income tax expense was $8.8 million and $0.7 million for the six months ended September 30, 2019, and the three months ended March 31, 2019, respectively, and$5.6 million during the nine months ended September 30, 2018. We recognized income tax expense due to the jurisdictional mix of income and loss during the period, alongwith our continued inability to recognize the benefits associated with certain losses as a result of valuation allowances, changes in uncertain tax positions, and the income taximpacts of adjustments made as part of Fresh Start Accounting.
56

Table of Contents
Backlog
Backlog is our estimate of the dollar amount of revenues we expect to realize in the future as a result of executed drilling contracts. The Company’s backlog of firmorders was approximately $327.1 million at September 30, 2019 and $238.9 million at September 30, 2018. The backlog is primarily attributable to the International & Alaskadrilling segment of our drilling services business. We estimate that, as of September 30, 2019, 10.8 percent of our backlog will be recognized as revenues within the fiscal year.
The amount of actual revenues earned and the actual periods during which revenues are earned could be different from amounts disclosed in our backlog calculationsdue to a lack of predictability of various factors, including unscheduled repairs, maintenance requirements, weather delays, contract terminations or renegotiations, newcontracts and other factors. See “Our backlog of contracted revenue may not be fully realized and may reduce significantly in the future, which may have a material adverseeffect on our balance sheets, statement of operations or cash flows” in Item 1A. Risk Factors of our 2018 Form 10-K.
Liquidity and Capital Resources
We periodically evaluate our liquidity requirements, capital needs and availability of resources in view of expansion plans, operational and other cash needs. To meetour short-term liquidity requirements we primarily rely on our cash on hand and cash from operations. We also have access to cash through the Credit Facility. We expect thatthese sources of liquidity will be sufficient to provide us the ability to fund our current operations and required capital expenditures. We may need to fund expansion capitalexpenditures, acquisitions, debt principal payments, or pursuits of business opportunities that support our strategy, through additional borrowings or the issuance of additionalSuccessor Common Stock or other forms of equity. Our credit agreements limit the payment of dividends. In the past we have not paid dividends on our Predecessor CommonStock and we have no present intention to pay dividends on our Successor Common Stock in the foreseeable future.
Liquidity
The following table provides a summary of our total liquidity:
SuccessorDollars in thousands September 30, 2019
Cash and cash equivalents on hand (1) $ 101,106Availability under Credit Facility (2) 24,665Total liquidity $ 125,771
(1) As of September 30, 2019, approximately $39.5 million of the $101.1 million of cash and cash equivalents was held by our foreignsubsidiaries.
(2) As of September 30, 2019, the borrowing base availability under the Credit Facility was $87.7 million, allowing full access to the $50.0 million in aggregatecommitments, which was further reduced by $15.0 million of restricted availability due to the minimum liquidity covenant and $10.3 million in supporting letters ofcredit outstanding, resulting in availability under the Credit Facility of $24.7 million.
If the Amended and Restated Credit Agreement were executed on or before September 30, 2019, the borrowing base availability would have been $41.7 million and,after deducting $10.3 million in letters of credit, would have resulted in net availability of $31.3 million, an increase of $6.7 million under the Credit Facility.
The earnings of foreign subsidiaries as of September 30, 2019 were reinvested to fund our international operations. If in the future we decide to repatriate earnings, theCompany may be required to pay taxes on those amounts, which could reduce the liquidity of the Company at that time.
We do not have any unconsolidated special-purpose entities, off-balance sheet financing arrangements or guarantees of third-party financial obligations. As ofSeptember 30, 2019, we have no energy, commodity, or foreign currency derivative contracts.
57

Table of Contents
Cash Flow Activity
We had cash, cash equivalents, and restricted cash of $101.1 million and $59.0 million at September 30, 2019 and December 31, 2018, respectively. The followingtable provides a summary of our cash flow activity:
Successor Predecessor
Six Months Ended
September 30, Three Months Ended
March 31, Nine Months Ended
September 30,
Dollars in thousands 2019 2019 2018
Operating activities $ 33,618 $ 14,914 $ (3,516 )Investing activities (46,364 ) (9,130 ) (50,989 )Financing activities (35,433 ) 84,510 (5,316 )Net change in cash and cash equivalents $ (48,179 ) $ 90,294 $ (59,821 )
Operating Activities
Cash flows from operating activities were a source of cash of $33.6 million and $14.9 million for the six months ended September 30, 2019, and the three monthsended March 31, 2019, respectively, and a use of cash of $3.5 million for the nine months ended September 30, 2018. Cash flows from operating activities in each period werelargely impacted by our operating results and changes in working capital. Changes in working capital were a use of cash of $27.3 million and a source of cash of $17.1million for the six months ended September 30, 2019, and the three months ended March 31, 2019, respectively, and a use of cash of $12.2 million for the nine months endedSeptember 30, 2018.
It is our intention to utilize our operating cash flows to fund maintenance and growth of our rental tool assets and drilling rigs. Given the oil and natural gas servicesmarket over the past few years, our short-term focus is to preserve liquidity by managing our costs and capital expenditures. While the overall market for oilfield servicesremains challenging, we are beginning to see a market recovery that is expected to increase our earnings, working capital and capital spending as we pursue attractiveinvestment opportunities.
Investing Activities
Cash flows from investing activities were a use of cash of $46.4 million and $9.1 million for the six months ended September 30, 2019, and the three months endedMarch 31, 2019, respectively, and $51.0 million for the nine months ended September 30, 2018. Cash flows used in investing activities during the six months ended September30, 2019, and the three months ended March 31, 2019, included capital expenditures of $46.7 million and $9.2 million, respectively, and $52.0 million for the nine monthsended September 30, 2018, which were primarily used for tubular and other products for our rental tools services business and rig-related maintenance.
Financing Activities
Cash flows from financing activities were a use of cash of $35.4 million for the six months ended September 30, 2019, primarily related to the prepayment of the TermLoan (as defined below). Cash flows from financing activities were a source of cash of $84.5 million for the three months ended March 31, 2019, primarily related to proceedsfrom the rights offering of $95.0 million offset by the payment of amounts borrowed under debtor in possession financing of $10.0 million. Cash flows from financing activitieswere a use of cash of $5.3 million for the nine months ended September 30, 2018, primarily related to dividends of $3.6 million on our Predecessor Preferred Stock and debtissuance costs of $1.4 million.
Debt Summary
As of September 30, 2019 our principal amount of debt was related to the $177.0 million Term Loan, due 2024.
Successor Credit Facility
On March 26, 2019, pursuant to the terms of the Plan, we and certain of our subsidiaries, entered into a credit agreement with the lenders party thereto (the “CreditFacility Lenders”), Bank of America, N.A., as administrative agent and Bank of America, N.A. and Deutsche Bank Securities Inc. as joint lead arrangers and joint bookrunners,providing for a revolving credit facility (the “Credit Facility”) with initial aggregate commitments in the amount of $50.0 million, guaranteed by certain of our subsidiaries.Availability under the Credit Facility is subject to a monthly borrowing base calculation based on eligible domestic rental equipment and eligible domestic accounts receivableand requires us to maintain minimum liquidity of $25.0 million, defined as cash in our liquidity account not to exceed $10.0 million and availability under the borrowing base.The Credit Facility allows for an increase
58

Table of Contents
to the aggregate commitments by up to an additional $75.0 million, subject to certain conditions. The Credit Facility provides for a $30.0 million sublimit of the aggregatecommitments that is available for the issuance of letters of credit. The Credit Facility matures on March 26, 2023. Debt issuance costs of $1.3 million ($1.1 million, net ofamortization as of September 30, 2019) are being amortized over the term of the Credit Facility on a straight-line basis.
As of September 30, 2019, the borrowing base availability under the Credit Facility was $87.7 million, allowing full access to the $50.0 million in aggregatecommitments, which was further reduced by $15.0 million of restricted availability due to the minimum liquidity covenant and $10.3 million in supporting letters of creditoutstanding, resulting in availability under the Credit Facility of $24.7 million.
The Credit Facility bears interest either at a rate equal to:
• LIBOR plus an applicable margin that varies from 2.25 percent to 2.75 percent per annumor
• a base rate plus an applicable margin that varies from 1.25 percent to 1.75 percent perannum.
We are required to pay a commitment fee of 0.5 percent per annum on the actual daily unused portion of the current aggregate commitments under the Credit Facility.We are also required to pay customary letter of credit and fronting fees.
The Credit Facility also contains customary affirmative and negative covenants, including, among other things, as to compliance with laws (including environmentallaws and anti-corruption laws), delivery of quarterly and annual consolidated financial statements and monthly borrowing base certificates, conduct of business, maintenance ofproperty, maintenance of insurance, restrictions on the incurrence of liens, indebtedness, asset dispositions, fundamental changes, restricted payments, and other customarycovenants. Additionally, the Credit Facility contains customary events of default and remedies for credit facilities of this nature. If we do not comply with the financial and othercovenants in the Credit Facility, the Credit Facility Lenders may, subject to customary cure rights, require immediate payment of all amounts outstanding under the CreditFacility, and any outstanding unfunded commitments may be terminated. As of September 30, 2019, we were in compliance with all the financial covenants under the CreditFacility.
On October 8, 2019, we entered into an amended and restated credit agreement (the “Amended and Restated Credit Agreement”), which amended and restated theCredit Facility. The Amended and Restated Credit Agreement:
(1) matures on October 8, 2024, subject to certain restrictions, including the refinancing of the Company’s Term LoanAgreement,
(2) reduced our annual borrowing costs byreducing
• the interest rate to LIBOR plus a range of 1.75 percent to 2.25 percent (based on availability)and
• the unused commitment fee to a range of 0.25 percent to 0.375 percent (based onutilization),
(3) replaced a $25 million liquidity covenant with a minimum fixed charge coverage ratio requirement of 1.0x when excess availability is less than the greaterof
• 20.0 percent of the lesser of commitments and the borrowing baseand
• $10.0million,
(4) allowed an additional borrower to be included in the borrowing base upon completion of a fieldexamination,
(5) revised the calculation of the borrowing base by, among other things, excluding eligible domestic rental equipment and including 90 percent of investment gradeeligible domestic accounts receivable, and
(6) allowed the Company to grant a second priority lien on non-working capital assets in the event of a refinancing of the Term Loan Agreement (as definedbelow).
As described below, the Amended and Restated Credit Agreement also permitted us to make a voluntary prepayment of $35.0 million on our Term Loan (as definedbelow) without such prepayment being included in the calculation of our fixed coverage ratio.
If the Amended and Restated Credit Agreement were executed on or before September 30, 2019, the borrowing base availability would have been $41.7 million and,after deducting $10.3 million in letters of credit, would have resulted in net availability of $31.3 million, an increase of $6.7 million under the Credit Facility.
59

Table of Contents
Successor Term Loan, Due March 2024
On March 26, 2019, pursuant to the terms of the Plan, we and certain of our subsidiaries entered into a second lien term loan credit agreement (the “Term LoanAgreement”) with the lenders party thereto (the “Term Loan Lenders”) and UMB Bank, N.A., as administrative agent, providing for term loans (the “Term Loan”) in theamount of $210.0 million, guaranteed by certain of our subsidiaries. The Term Loan matures on March 26, 2024.
The Term Loan bears interest at a rate of 13.0 percent per annum, payable quarterly on the first day of each January, April, July, and October, beginning July 1, 2019,with 11.0 percent paid in cash and 2.0 percent paid in kind and capitalized by adding such amount to the outstanding principal.
We may voluntarily prepay all or a part of the Term Loan and, under certain conditions we are required to prepay all or a part of the Term Loan, in each case, at apremium (1) on or prior to 6 months after the closing date of 0 percent; (2) from 6 months and on or prior to two years after the closing date of 6.50 percent; (3) from two yearsand on or prior to three years after the closing date of 3.25 percent; and (4) from three years after the closing date and thereafter of 0 percent.
On September 20, 2019, we made a voluntary prepayment on the Term Loan of $35.0 million in principal, plus $1.0 million in interest associated with the principalpayment. Since the prepayment occurred within the first six months from the closing date, no premium was applicable on the prepayment. As of September 30, 2019, the TermLoan balance was $177.0 million.
The Term Loan is subject to mandatory prepayments and customary reinvestment rights. The mandatory prepayments include prepayment requirements with respect toa change of control, asset sales and debt issuances, in each case subject to certain exceptions or conditions. The Term Loan Agreement also contains customary affirmative andnegative covenants, including as to compliance with laws (including environmental laws and anti-corruption laws), delivery of quarterly and annual financial statements,conduct of business, maintenance of property, maintenance of insurance, restrictions on the incurrence of liens, indebtedness, asset dispositions, fundamental changes, restrictedpayments and other customary covenants. Additionally, the Term Loan Agreement contains customary events of default and remedies for facilities of this nature. If we do notcomply with the covenants in the Term Loan Agreement, the Term Loan Lenders may, subject to customary cure rights, require immediate payment of all amounts outstandingunder the Term Loan Agreement. As of September 30, 2019, we were in compliance with all the financial covenants under the Term Loan Agreement.
Predecessor 6.75% Senior Notes, Due July 2022
On January 22, 2014, we issued $360.0 million aggregate principal amount of the 6.75% Notes pursuant to the 6.75% Notes Indenture. The 6.75% Notes were generalunsecured obligations of the Company and ranked equal in right of payment with all of our existing and future senior unsecured indebtedness. The 6.75% Notes were jointly andseverally guaranteed by all of our subsidiaries that guaranteed indebtedness under the Second Amended and Restated Senior Secured Credit Agreement, as amended from time-to-time (“2015 Secured Credit Agreement”) and our 7.50% Notes. Interest on the 6.75% Notes was payable on January 15 and July 15 of each year, beginning July 15, 2014.Debt issuance costs related to the 6.75% Notes were approximately $7.6 million. After the commencement of the Chapter 11 Cases, the carrying amount of debt was adjusted tothe claim amount and all unamortized debt issuance costs prior to the commencement of the Chapter 11 Cases were fully expensed.
Predecessor 7.50% Senior Notes, Due August 2020
On July 30, 2013, we issued $225.0 million aggregate principal amount of the 7.50% Notes pursuant to the 7.50% Notes Indenture. The 7.50% Notes were generalunsecured obligations of the Company and ranked equal in right of payment with all of our existing and future senior unsecured indebtedness. The 7.50% Notes were jointly andseverally guaranteed by all of our subsidiaries that guaranteed indebtedness under the 2015 Secured Credit Agreement and the 6.75% Notes. Interest on the 7.50% Notes waspayable on February 1 and August 1 of each year, beginning February 1, 2014. Debt issuance costs related to the 7.50% Notes were approximately $5.6 million. After thecommencement of the Chapter 11 Cases, the carrying amount of debt was adjusted to the claim amount and all unamortized debt issuance costs prior to the commencement ofthe Chapter 11 Cases were fully expensed.
The commencement of the Chapter 11 Cases constituted an event of default that accelerated the Company’s obligations under the indentures governing the 6.75%Notes and the 7.50% Notes. However, any efforts to enforce such payment obligations were automatically stayed under the provisions of the Bankruptcy Code. The principalbalance on the 6.75% Notes and 7.50% Notes of $360.0 million and $225.0 million, respectively, had been reclassed from long-term debt to liabilities subject to compromise asof December 31, 2018. See also Note 2 - Chapter 11 Emergence for further details.
As previously disclosed in our Current Report on Form 8-K filed with the SEC on March 26, 2019, our obligations with respect to the Senior Notes as well as oursubsidiaries’ obligations under their respective guarantees under the 6.75% Notes
60

Table of Contents
Indenture and the 7.50% Notes Indenture (and the Senior Notes) were cancelled and extinguished as provided in the Plan. From and after March 26, 2019, neither the Companynor its subsidiaries have any continuing obligations under the 6.75% Notes Indenture and 7.50% Notes Indenture or with respect to the Senior Notes or the guarantees relatedthereto except to the extent specifically provided in the Plan.
Predecessor 2015 Secured Credit Agreement
On January 26, 2015, we entered into the 2015 Secured Credit Agreement. The 2015 Secured Credit Agreement was originally comprised of a $200.0 millionrevolving credit facility (the “Revolver”). The 2015 Secured Credit Agreement formerly included financial maintenance covenants, including a leverage ratio, consolidatedinterest coverage ratio, senior secured leverage ratio, and asset coverage ratio, many of which were suspended beginning in September 2015.
We executed various amendments which, among other things: (1) modified the credit facility to an asset-based lending structure, (2) reduced the size of the Revolver to$80.0 million, (3) eliminated the financial maintenance covenants previously in effect and replaced them with a minimum liquidity covenant of $30.0 million and a monthlyborrowing base calculation, (4) allowed for the refinancing of our existing Senior Notes with either secured or unsecured debt, (5) added the ability for the Company to designatecertain of its subsidiaries as “Designated Borrowers”, and (6) permitted the Company to make restricted payments in the form of certain equity interests.
On October 25, 2018, we entered into a Consent Agreement and a Cash Collateral Agreement, whereby we could open bank accounts not subject to the 2015 SecuredCredit Agreement for the purpose of depositing cash to secure certain letters of credit. On October 30, 2018, we deposited $10.0 million into a cash collateral account to supportthe letters of credit outstanding, which is included in the restricted cash balance on the consolidated balance sheet as of December 31, 2018.
Our obligations under the 2015 Secured Credit Agreement were guaranteed by substantially all of our direct and indirect domestic subsidiaries, other than immaterialsubsidiaries and subsidiaries generating revenues primarily outside the United States, each of which has executed guaranty agreements, and were secured by first priority lienson our accounts receivable, specified rigs including barge rigs in the Gulf of Mexico (“GOM”) and land rigs in Alaska, certain U.S.-based rental equipment of the Companyand its subsidiary guarantors and the equity interests of certain of the Company’s subsidiaries. In addition to the liquidity covenant and borrowing base requirements, the 2015Secured Credit Agreement contains customary affirmative and negative covenants, such as limitations on indebtedness and liens, and restrictions on entry into certain affiliatetransactions and payments (including certain payments of dividends).
All of the Company’s obligations under the 2015 Secured Credit Agreement were paid prior to the commencement of the Chapter 11 Cases, and the 2015 SecuredCredit Agreement, including the Revolver thereunder, was terminated concurrently with the commencement of the Chapter 11 Cases. See also Note 2 - Chapter 11 Emergencefor further details. Unamortized debt issuance costs were fully expensed upon termination of the 2015 Secured Credit Agreement.
61

Table of Contents
FORWARD-LOOKING STATEMENTS
This Form 10-Q contains statements that are “forward-looking statements” within the meaning of Section 27A of the Securities Act of 1933, as amended (the“Securities Act”), and Section 21E of the Securities Exchange Act of 1934, as amended, (the “Exchange Act”). All statements contained in this Form 10-Q, other thanstatements of historical facts, are forward-looking statements for purposes of these provisions. In some cases, you can identify these statements by forward-looking words suchas “anticipate,” “believe,” “could,” “estimate,” “expect,” “intend,” “outlook,” “may,” “should,” “plan,” “seek,” “forecast,” “target,” “will,” and “would” or similar words.Forward-looking statements are based on certain assumptions and analyses we make in light of our experience and perception of historical trends, current conditions, expectedfuture developments, and other factors we believe are relevant. Although we believe our assumptions are reasonable based on information currently available, those assumptionsare subject to significant risks and uncertainties, many of which are outside our control. Each forward-looking statement speaks only as of the date of this Form 10-Q, and weundertake no obligation to publicly update or revise any forward-looking statements, whether as a result of new information, future events, or otherwise. You should be awarethat certain events could have a material adverse effect on our business, results of operations, financial condition, and cash flows. For more information about such events, see“Risk Factors” described in Item 1A. of the Company’s Annual Report filed on Form 10-K, and this Form 10-Q, along with additional risk factors described from time to timein our SEC filings.
62

Table of Contents
Item 3. Quantitative and Qualitative Disclosures about Market Risk
There has been no material change in the market risk faced by us from that reported in our 2018 Form 10-K. For more information on market risk, see Part II, Item 7Ain our 2018 Form 10-K.
Item 4. Controls and Procedures
Management’s Evaluation of Disclosure Controls and Procedures
In accordance with Rules 13a-15 and 15d-15 under the Securities Exchange Act of 1934, as amended (the Exchange Act), we carried out an evaluation, under thesupervision and with the participation of management, including our Chief Executive Officer and Chief Financial Officer, of the effectiveness of our disclosure controls andprocedures as of the end of the period covered by this report. Based on that evaluation, our Chief Executive Officer and Chief Financial Officer concluded that our disclosurecontrols and procedures were effective, as of September 30, 2019, to provide reasonable assurance that information required to be disclosed in our reports filed or submittedunder the Exchange Act is (1) accumulated and communicated to our management, including our Chief Executive Officer and our Chief Financial Officer, to allow timelydecisions regarding required disclosure and is (2) recorded, processed, summarized and reported within the time periods specified in the Securities and Exchange Commission’s(“SEC”) rules and forms.
Changes in Internal Control Over Financial Reporting
There have been no changes in our internal control over financial reporting (as defined in Rules 13a-15(f) and 15d-15(f) under the Exchange Act) during our mostrecent fiscal quarter that have materially affected, or are reasonably likely to materially affect, our internal control over financial reporting.
63

Table of Contents
PART II. OTHER INFORMATION
Item 1. Legal Proceedings
For information regarding legal proceedings, see Note 9 - Commitments and Contingencies in Item 1 of Part I of this quarterly report on Form 10-Q, whichinformation is incorporated into this item by reference.
Item 1A. Risk Factors
We recently emerged from bankruptcy, which may adversely affect our business and relationships.
It is possible that our having filed for bankruptcy and our recent emergence from bankruptcy may adversely affect our business and relationships with customers,vendors, contractors, employees or suppliers. Due to uncertainties, many risks exist, including the following:
• key suppliers, vendors or other contract counterparties may terminate their relationships with us or require additional financial assurances or enhanced performancefrom us;
• our ability to renew existing contracts and compete for new business may be adverselyaffected;
• our ability to attract, motivate and/or retain key executives may be adversely affected;and
• competitors may take business away from us, and our ability to attract and retain customers may be negativelyimpacted.
The occurrence of one or more of these events could have a material and adverse effect on our operations, financial condition and reputation. We cannot assure youthat having been subject to bankruptcy protection will not adversely affect our operations in the future.
Our actual financial results after emergence from bankruptcy may not be comparable to our historical financial information as a result of the implementation of thePlan and the transactions contemplated thereby.
In connection with the disclosure statement we filed with the Bankruptcy Court, and the hearing to consider confirmation of the Plan, we prepared projected financialinformation to demonstrate to the Bankruptcy Court the feasibility of the Plan and our ability to continue operations upon our emergence from bankruptcy. Those projectionswere prepared solely for the purpose of bankruptcy proceedings and have not been, and will not be, updated on an ongoing basis and should not be relied upon by investors. Atthe time they were prepared, the projections reflected numerous assumptions concerning our anticipated future performance with respect to prevailing and anticipated marketand economic conditions that were and remain beyond our control and that may not materialize. Projections are inherently subject to substantial and numerous uncertainties andto a wide variety of significant business, economic and competitive risks and the assumptions underlying the projections and/or valuation estimates may prove to be wrong inmaterial respects. Actual results may vary significantly from those contemplated by the projections. As a result, investors should not rely on these projections.
Upon our emergence from bankruptcy, the composition of our board of directors changed significantly.
Pursuant to the Plan, the composition of our board of directors (the “Board”) changed significantly. Upon emergence, our Board consists of seven directors, only twoof whom, including our Chief Executive Officer, served on the Board prior to our emergence from bankruptcy. The new directors have different backgrounds, experiences andperspectives from those individuals who previously served on our Board and, thus, may have different views on the issues that will determine our future. There is no guaranteethat our new Board will pursue, or will pursue in the same manner, our current strategic plans. As a result, the future strategy and our plans may differ materially from those ofthe past.
Item 2. Unregistered Sales of Equity Securities and Use of Proceeds
There were no unregistered sales of the Company’s equity securities during the three months ended September 30, 2019 that were not otherwise disclosed in a CurrentReport on Form 8-K. The Company currently has no active share repurchase programs.
Item 3. Defaults Upon Senior Securities
None.
Item 4. Mine Safety Disclosures
None.
64

Table of Contents
Item 5. Other Information
None.
65

Table of Contents
Item 6. Exhibits
The following exhibits are filed or furnished as a part of this report:
ExhibitNumber Description
3.1
—
Amended and Restated Certificate of Incorporation of the Company, as amended and restated on March 26, 2019 (incorporated by reference toExhibit 3.1 to the Company’s Current Report on Form 8-K filed on March 26, 2019).
3.2
—
Amended and Restated By-laws of the Company, as amended and restated as of March 26, 2019 (incorporated by reference to Exhibit 3.2 to theCompany’s Current Report on Form 8-K filed on March 26. 2019).
10.1
—
Transition and Separation Agreement by and between Parker Drilling Company, Parker Drilling Management Services Ltd., and Gary Rich, datedJuly 11, 2019 (incorporated by reference to Exhibit 10.1 to the Company’s Current Report on Form 8-K filed on July 15, 2019).
10.2
—
Amended and Restated Credit Agreement, dated as of October 8, 2019, among Parker Drilling Company, as borrower, and Bank of America, N.A.,as administrative agent, and the lenders and other parties party thereto (incorporated by reference to Exhibit 10.1 to the Company’s Current Reporton Form 8-K filed on October 15, 2019).
31.1 — Gary G. Rich, President and Chief Executive Officer, Rule 13a-14(a)/15d-14(a) Certification. 31.2 — Michael W. Sumruld, Senior Vice President and Chief Financial Officer, Rule 13a-14(a)/15d-14(a) Certification. 32.1 — Gary G. Rich, President and Chief Executive Officer, 18 U.S.C. Section 1350 Certification. 32.2 — Michael W. Sumruld, Senior Vice President and Chief Financial Officer, 18 U.S.C. Section 1350 Certification. 101.INS
—
XBRL Instance Document - the instance document does not appear in the Interactive Data File because its XBRL tags are embedded within theInline XBRL document.
101.SCH — XBRL Taxonomy Schema Document. 101.CAL — XBRL Calculation Linkbase Document. 101.LAB — XBRL Label Linkbase Document. 101.PRE — XBRL Presentation Linkbase Document. 101.DEF — XBRL Definition Linkbase Document.
66

Table of Contents
SIGNATURES
Pursuant to the requirements of the Securities Exchange Act of 1934, the registrant has duly caused this report to be signed on its behalf by the undersigned, thereuntoduly authorized.
PARKER DRILLING COMPANY
Date: November 6, 2019 By: /s/ Gary G. Rich
Gary G. RichPresident and Chief Executive Officer
By: /s/ Michael W. Sumruld
Michael W. SumruldSenior Vice President and Chief Financial Officer
67

EXHIBIT 31.1
PARKER DRILLING COMPANYRULE 13a-14(a)/15d-14(a) CERTIFICATION
I, Gary G. Rich, certify that:
1. I have reviewed this quarterly report on Form 10-Q for the quarterly period ended September 30, 2019, of Parker Drilling Company (theregistrant);
2. Based on my knowledge, this report does not contain any untrue statement of a material fact or omit to state a material fact necessary to make the statementsmade, in light of the circumstances under which such statements were made, not misleading with respect to the period covered by this report;
3. Based on my knowledge, the financial statements, and other financial information included in this report, fairly present in all material respects the financialcondition, results of operations and cash flows of the registrant as of, and for, the periods presented in this report;
4. The registrant’s other certifying officer(s) and I are responsible for establishing and maintaining disclosure controls and procedures (as defined in Exchange ActRules 13a — 15(e) and 15d — 15(e)) and internal control over financial reporting (as defined in Exchange Act Rules 13a-15(f) and 15d-15(f)) for the registrantand have:
(a) Designed such disclosure controls and procedures, or caused such disclosure controls and procedures to be designed under our supervision, toensure that material information relating to the registrant, including its consolidated subsidiaries, is made known to us by others within thoseentities, particularly during the period in which this report is being prepared;
(b) Designed such internal control over financial reporting, or caused such internal control over financial reporting to be designed under oursupervision, to provide reasonable assurance regarding the reliability of financial reporting and the preparation of financial statements for externalpurposes in accordance with generally accepted accounting principles;
(c) Evaluated the effectiveness of the registrant’s disclosure controls and procedures and presented in this report our conclusions about theeffectiveness of the disclosure controls and procedures, as of the end of the period covered by this report based on such evaluation; and
(d) Disclosed in this report any change in the registrant’s internal control over financial reporting that occurred during the registrant’s most recent fiscalquarter (the registrant’s fourth fiscal quarter in the case of an annual report) that has materially affected, or is reasonably likely to materially affect,the registrant’s internal control over financial reporting; and
5. The registrant’s other certifying officer(s) and I have disclosed, based on our most recent evaluation of internal control over financial reporting, to the registrant’sauditors and the audit committee of the registrant’s board of directors (or persons performing the equivalent functions):
(a) All significant deficiencies and material weaknesses in the design or operation of internal control over financial reporting which are reasonably
likely to adversely affect the registrant’s ability to record, process, summarize and report financial information; and(b) Any fraud, whether or not material, that involves management or other employees who have a significant role in the registrant’s internal control
over financial reporting.
Date: November 6, 2019
/s/ Gary G. RichGary G. RichPresident and Chief Executive Officer

EXHIBIT 31.2
PARKER DRILLING COMPANYRULE 13a-14(a)/15d-14(a) CERTIFICATION
I, Michael W. Sumruld, certify that:
1. I have reviewed this quarterly report on Form 10-Q for the quarterly period ended September 30, 2019, of Parker Drilling Company (theregistrant);
2. Based on my knowledge, this report does not contain any untrue statement of a material fact or omit to state a material fact necessary to make the statementsmade, in light of the circumstances under which such statements were made, not misleading with respect to the period covered by this report;
3. Based on my knowledge, the financial statements, and other financial information included in this report, fairly present in all material respects the financialcondition, results of operations and cash flows of the registrant as of, and for, the periods presented in this report;
4. The registrant’s other certifying officer(s) and I are responsible for establishing and maintaining disclosure controls and procedures (as defined in Exchange ActRules 13a — 15(e) and 15d — 15(e)) and internal control over financial reporting (as defined in Exchange Act Rules 13a-15(f) and 15d-15(f)) for the registrantand have:
(a) Designed such disclosure controls and procedures, or caused such disclosure controls and procedures to be designed under our supervision, toensure that material information relating to the registrant, including its consolidated subsidiaries, is made known to us by others within thoseentities, particularly during the period in which this report is being prepared;
(b) Designed such internal control over financial reporting, or caused such internal control over financial reporting to be designed under oursupervision, to provide reasonable assurance regarding the reliability of financial reporting and the preparation of financial statements for externalpurposes in accordance with generally accepted accounting principles;
(c) Evaluated the effectiveness of the registrant’s disclosure controls and procedures and presented in this report our conclusions about theeffectiveness of the disclosure controls and procedures, as of the end of the period covered by this report based on such evaluation; and
(d) Disclosed in this report any change in the registrant’s internal control over financial reporting that occurred during the registrant’s most recent fiscalquarter (the registrant’s fourth fiscal quarter in the case of an annual report) that has materially affected, or is reasonably likely to materially affect,the registrant’s internal control over financial reporting; and
5. The registrant’s other certifying officer(s) and I have disclosed, based on our most recent evaluation of internal control over financial reporting, to the registrant’sauditors and the audit committee of the registrant’s board of directors (or persons performing the equivalent functions):
(a) All significant deficiencies and material weaknesses in the design or operation of internal control over financial reporting which are reasonably
likely to adversely affect the registrant’s ability to record, process, summarize and report financial information; and(b) Any fraud, whether or not material, that involves management or other employees who have a significant role in the registrant’s internal control
over financial reporting.
Date: November 6, 2019
/s/ Michael W. SumruldMichael W. SumruldSenior Vice President and Chief Financial Officer

EXHIBIT 32.1
CERTIFICATION PURSUANT TO18 U.S.C. SECTION 1350
Pursuant to 18 U.S.C. Section 1350, the undersigned officer of Parker Drilling Company (the Company) hereby certifies, to such officer’s knowledge, that:
1. The Company’s Quarterly Report on Form 10-Q for the quarter ended September 30, 2019 (the Report) fully complies with the requirements of section 13(a) or15(d) of the Securities Exchange Act of 1934; and
2. The information contained in the Report fairly presents, in all material respects, the financial condition and results of operations of theCompany.
Date: November 6, 2019
/s/ Gary G. RichGary G. RichPresident and Chief Executive Officer
The foregoing certification is being furnished solely pursuant to 18 U.S.C. Section 1350 and is not being filed as part of the Report or as a separate disclosure statement.

EXHIBIT 32.2
CERTIFICATION PURSUANT TO18 U.S.C. SECTION 1350
Pursuant to 18 U.S.C. Section 1350, the undersigned officer of Parker Drilling Company (the Company) hereby certifies, to such officer’s knowledge, that:
1. The Company’s Quarterly Report on Form 10-Q for the quarter ended September 30, 2019 (the Report) fully complies with the requirements of section 13(a) or15(d) of the Securities Exchange Act of 1934; and
2. The information contained in the Report fairly presents, in all material respects, the financial condition and results of operations of theCompany.
Date: November 6, 2019
/s/ Michael W. SumruldMichael W. SumruldSenior Vice President and Chief Financial Officer
The foregoing certification is being furnished solely pursuant to 18 U.S.C. Section 1350 and is not being filed as part of the Report or as a separate disclosure statement.