parque arauco day colombia · parque arauco day colombia october 2017. 2 agenda • parque arauco...
TRANSCRIPT

Parque Arauco Day ColombiaOctober 2017

2
Agenda
• Parque Arauco Corporate Overview
• Parque Arauco Colombia Overview
•
Industry• Managing Parque La Colina• Organizational Improvements• Mixed Use Rationale for Malls• Parque Arboleda Overview
3
40
76
104
147186208

/
1
Parq
ue A
rauc
oCo
rpor
ate
Ove
rvie
w- O
ctob
er 2
017
/
1
Parque Arauco Corporate OverviewOctober 2017
CONTACTSSARAH INMON (HEAD OF INVESTOR RELATIONS) |
EDUARDO PEREZ MARCHANT (CORPORATE FINANCE MANAGER) |
CLAUDIO CHAMORRO (CFO) |TEL: (562) 22990510 | EMAIL: [email protected]

/
2
Parq
ue A
rauc
oCo
rpor
ate
Ove
rvie
w- O
ctob
er 2
017
Important Disclaimer
This document has been prepared by Parque Arauco for the purpose of providing general information about the Company.
The Company assumes no responsibility for, or makes any representation or warranty, express or implied, with respect to,
the accuracy, adequacy or completeness of the information contained herein. The Company expressly disclaims any liability
based on such information, errors therein or omissions therefrom.
This presentation includes certain statements, estimates and forecasts provided by the Company with respect to it’s anticipa-
ted future performance and involves significant elements or subjective judgment and analysis that may or may not prove to
be accurate or correct. There can be no assurance that these statements, estimates and forecasts will be attained and actual
outcomes and results may differ materially from what is estimated or forecast herein.
The information contained herein has been prepared to assist interested parties in making their own evaluation of the
company and does not purport to be all - inclusive or to contain all the information that a potential counterparty may desire.
In all cases, interested parties should conduct their own independent investigation and analysis of the Company. Interested
parties can only rely on the result of their own investigation and the representations and warranties made in any definitive
agreement that may be executed.

/
3
Parq
ue A
rauc
oCo
rpor
ate
Ove
rvie
w- O
ctob
er 2
017
INTRODUCTION
OUR OPERATIONS
INVESTMENT HIGHLIGHTS
FUTURE DEVELOPMENTS

/
4
Parq
ue A
rauc
oCo
rpor
ate
Ove
rvie
w- O
ctob
er 2
017
Parque AraucoOPERATIONAL METRICS BY COUNTRY
OPERATIONAL METRICS BY FORMAT
46.0% 60.6%
14.4%
10.3%
29. 1%39.6%Parque Arauco is the third largest shopping center operator in Chile and Peru, and the fourth largest in Colombia.
24% Foreign
investment funds
22% Local brokers
1% Local mutual funds
6% Others 26%
Controlling Group
5% Said Yarur Family
3% Abumohor Family
13%Local pension funds
DAILY TRADED VOLUME 2Q17: US$MM 2.9
85.6%
6.7%2.7%
5.0%
78.9%
6.4%4.0%
10.7%
Parque Arauco at a glance
Indicator/ Country CHILE PERU COLOMBIA TOTAL
Total GLA (m2)1 455,500 391,500 142,500 989,500
Owned GLA (m2) 418,685 276,750 124,050 818,485
Revenues LTM 2Q17 (US$MM)2 157 76 27 260
# of operations 25 19 3 47
MARKET CAP3
US$MM 2,263
SHAREHOLDER STRUCTURE (JUNE 2017)
Chile Peru Colombia
Regional Neighborhood Outlet Strip center
TOTAL GLA1
989,500 M2
TOTALREVENUES2
US$MM 260
TOTAL GLA1
989,500 M2
TOTAL REVENUES2
US$MM 260
Source: Parque Arauco. (1) Does not include Marina Arauco nor Mall Center Curicó.(2) Revenues from July 2016- June 2017. Exchange Rate: US$= 660.05
(3) Source: Bloomberg

/
5
Parq
ue A
rauc
oCo
rpor
ate
Ove
rvie
w- O
ctob
er 2
017
GLA(1) M2
In the last five years Parque Arauco has doubled GLA, revenues and EBITDA
1982 Parque Arauco Kennedy opens as first shopping center in Chile
1993 Arauco Maipu inaugurates in Santiago
1995 Parque Arauco S.A. IPO
1997 Inauguration of Marina Arauco in Viña del Mar, Chile
2006 Parque Arauco expands into Peru with the purchase of a 45% stake in MegaPlaza Norte in Lima
2008 Parque Arauco acquires Arauco Estación in Santiago, Chile
2010 Parque Arauco opens first mall in Colombia, Parque Arboleda in Pereira
2011 Capital increase for US$145 MM
2012 Parque Arauco enters outlet format in Chile by acquiring Arauco Premium Outlet Buenaventura
2014 Capital increase for US$182 MM
2015 Purchase of minority shareholders in Colombia and Peru
2016 Capital increase for US$100 MM2012 2013 2014 20162015 LTM
2Q17
559,700 693,100 728,500818,500 935,900
989, 500
+1.8x
EBITDA(1) US$ MM
99 113 130152 167
182
REVENUES(1) US$ MM
+1.8x
2012 2013 2014 20162015 LTM 2Q17
141 163 1191222 243
260
2012 2013 2014 20162015 LTM 2Q17
+1.8x
Source: Parque Arauco. Exchange Rate: US$= 660.05(1) Does not include Marina Arauco nor Mall Center Curicó.

/
6
Parq
ue A
rauc
oCo
rpor
ate
Ove
rvie
w- O
ctob
er 2
017
The spread over the cost of capital of our last projects is approximately 3%
Source: Parque Arauco
(1) Real cap rate is the yield on cost rate averaged by amount invested and considers the following properties: Arauco Express Calama, Arauco Express Ciudad Empresarial I, Arauco Express Colón, Arauco Express Huechuraba, Arauco Express Irarrázaval, Arauco Express Las Brujas, Arauco Express Luis Pasteur, Arauco Express Manuel Montt, Arauco Express Palmares, Arauco Premium Outlet Buenaventura, Arauco Premium Outlet Curauma, Arauco Premium Outlet San Pedro, Arauco Premium Outlet Coqumbo, Arauco Quilicura, MegaPlaza Chimbote, MegaPlaza Express Villa El Salvador, MegaPlaza Express Chincha, InOutlet Faucett, Viamix Chorrillos, Viamix Las Malvinas, InOutlet Premium Lurín, MegaPlaza Cañete, MegaPlaza Express Barranca, MegaPlaza Pisco, El Quinde Cajamarca, El Quinde Ica, Plaza Jesús María, Parque Caracolí.
(2) Weighted Average Cost of Capital
9%
REAL CAP RATE(1) REAL WACC (2) SPREAD OVER REAL WACC
6%
3%

/
7
Parq
ue A
rauc
oCo
rpor
ate
Ove
rvie
w- O
ctob
er 2
017
Parque Arauco’s value creation is proven by the fact that it has had one of the highest “Total Return” of the real estate sector in the last years
Total ReturnPa
rque
Ara
uco
GGP
Fala
bella
S&P
500
Igua
tem
i
Mac
eric
h
Uni
bail
Ham
mer
son
Mul
tipla
n
Fibr
a U
no
Klep
ierr
e
Sim
on
IPSA
Taub
man
Intu
BR M
alls
Allia
nsce
Cenc
osud
14%
7%8%
4%
12%
4%
7%
-1%
12%
6%
8%
-1%
11%
4%
7%
-6% -7%
Source: Bloomberg(1) Total return includes dividends as of july 31, 2017.
-6%
TOTAL RETURN1, LAST 5 YEARSANNUALIZED, LOCAL CURRENCY
TOTAL RETURN1, LAST 15 YEARSANNUALIZED, LOCAL CURRENCY
Taubman
Klepierre
Falabella
Hammerson
Macerich
Simon
GGP
Parque Arauco
IPSA
Intu
S&P 500
4%
18%18%
11%11%
9%7%7%
4%
2%-4%

/
8
Parq
ue A
rauc
oCo
rpor
ate
Ove
rvie
w- O
ctob
er 2
017
FIXED VS VARIABLE RENTAL REVENUES AS OF JUNE 30, 2017
CONTRACT LENGTH (BASED ON % OF REVENUES)
32%14%
14%
40% 100%
‹2 YEARS 2-3 YEARS 3-4 YEARS ›4 YEARS TOTAL
Our rental revenues are derived primarily from fixed contracts and are protected against inflation
40% of our contracts have a duration of more than 4 years and the average length is 6.0 years
14%Variable Revenues
86% Fixed Revenues
15% Other Revenues
Revenue type and contract duration
85% Rental Revenues

/
9
Parq
ue A
rauc
oCo
rpor
ate
Ove
rvie
w- O
ctob
er 2
017
CORPORATE PURPOSE
Purpose, Mission and Corporate Values
Our purpose is to create spaces that contribute to improving people’s lives.
MISSION
Our mission is to be leaders in developing and operating real estate assets, through profitable andsustainable growth that generates value for our stakeholders
PILLARS OF OUR CULTURE
Happiness
Excellence
STRATEGIC OBJECTIVES
Growth
Profitability
Sustainability
OUR VALUES
and the environment
Respectfor people
Opennessto change and innovation
Right option,Choose the
not the easiest one things
Makehappen
that inspiresan exceptional
Team
Createa work environment

/
10
Parq
ue A
rauc
oCo
rpor
ate
Ove
rvie
w- O
ctob
er 2
017
INTRODUCTION
OUR OPERATIONS
INVESTMENT HIGHLIGHTS
FUTURE DEVELOPMENTS

/
11
Parq
ue A
rauc
oCo
rpor
ate
Ove
rvie
w- O
ctob
er 2
017
Colombia
Perú
Chile
Chilean Portfolio
Chile GLA (m2) % OwnershipOwned GLA
(m2)Occupancy
Year of incorporation
Parque Arauco Kennedy 112,500 100% 112,500 96.8% 1982
Arauco Maipú 74,000 100% 74,000 99.2% 1993
Arauco Chillán 32,000 100% 32,000 99.9% 2007
Arauco Estación 66,500 83% 55,195 97.1% 2008
Arauco San Antonio 28,500 65% 18,388 95.7% 2009
Arauco Express1 33,000 53% 17,602 82.2% 2012
Arauco Premium Outlets2 47,000 100% 47,000 92.7% 2012
Arauco Quilicura 32,000 100% 32,000 100.0% 2013
Arauco Coronel 30,000 100% 30,000 93.5% 2017
Total Chile 455,500 92% 418,685 95.9%
Source: Parque Arauco(1) Arauco Express has 14 Stripcenters in Chile: 11 strip centers in Santiago, 1 in Viña del Mar, 1 in Calama, and 1 in Antofagasta.(2) Arauco Premium Outlet has four outlets located in Santiago, Concepción, Coquimbo and Curauma.
In Chile Parque Arauco has 7 regional shopping centers, 4 outlets and 14 strip centers. The average age of the portfolio is 16 years.
/
11

/
12
Parq
ue A
rauc
oCo
rpor
ate
Ove
rvie
w- O
ctob
er 2
017
Colombia
Perú
Chile
Peruvian Portfolio
In Peru in the company has 6 regional shopping centers and 9 neighborhood shopping centers, 2 outlets and 2 strip centers. The average age of the portfolio is 6 years.
Peru GLA (m2) % OwnershipOwned GLA
(m2)Occupancy
Year of incorporation
MegaPlaza Norte 111,500 50% 55,750 98.2% 2006
MegaPlaza Express Villa
Chorrillos 8,000 50% 4,000 96.5% 2009
Larcomar 26,500 100% 26,500 92.8% 2010
Parque Lambramani 29,500 100% 29,500 88.2% 2010
MegaPlaza Chimbote 28,000 50% 14,000 94.3% 2012
MegaPlaza Express Villa El Salvador 9,500 50% 4,750 96.4% 2012
MegaPlaza Express Chincha 9,000 50% 4,500 76.8% 2013
InOutlet and Viamix(2) 23,000 100% 23,000 76.1% 2013
MegaPlaza Cañete 16,500 50% 8,250 97.9% 2013
MegaPlaza Express Barranca 10,000 50% 5,000 98.7% 2013
MegaPlaza Pisco 14,500 50% 7,250 97.3% 2015
El Quinde Cajamarca 31,000 100% 31,000 80.8% 2015
El Quinde Ica 36,500 100% 36,500 96.5% 2015
Plaza Jesús María 14,500 100% 14,500 47.7% 2016
MegaPlaza Jaén 14,500 50% 7,250 82.8% 2016
MegaPlaza Huaral 9,000 50% 4,500 65.6% 2017
Total Peru 391,500 71% 276,250 90.2%
Source: Parque Arauco(1) Only partner in peru is Grupo Wiese, which includes MegaPlaza formats (50%).(2) InOutlet and Viamix includes two premium outlets in Lima and two strip centers in Lima.
/
12

/
13
Parq
ue A
rauc
oCo
rpor
ate
Ove
rvie
w- O
ctob
er 2
017
Colombia
Perú
Chile
Colombian Portfolio
Parque Arauco has 3 regional shopping centers in Colombia and the average age of the portfolio is 3 years
Colombia GLA (m2) % OwnershipOwned GLA
(m2)Occupancy
Year of incorporation
Parque Arboleda 41,000 55% 22,550 95.3% 2010
Parque Caracoli 38,500 100% 38,500 87.8% 2013
Parque La Colina 63,000 100% 63,000 88.1% 2016
Total Colombia 142,500 87% 124,050 90.1%
Source: Parque Arauco
/
13

/
14
Parq
ue A
rauc
oCo
rpor
ate
Ove
rvie
w- O
ctob
er 2
017
INTRODUCTION
OUR OPERATIONS
INVESTMENT HIGHLIGHTS
FUTURE DEVELOPMENTS

/
15
Parq
ue A
rauc
oCo
rpor
ate
Ove
rvie
w- O
ctob
er 2
017
Our operations
PortfolioParque Arauco has 3 regional shopping centers in Colombia and the average age of the portfolio is 3 years
1.Consistent results in a
challenging macroeconomic environment
2.Stable and
diversified revenues
4.Solid corporate governance and increased concern with
sustainability
6.Important growth
opportunities
3.Strong commercial
relationships with local and global businesses
5.Conservative debt
structure and outstanding financial performance
Investment Highlights

/
16
Parq
ue A
rauc
oCo
rpor
ate
Ove
rvie
w- O
ctob
er 2
017
Consistent results in a challenging macroeconomic environment
Parque Arauco is positioned in countries with strong macroeconomic prospects
Positive but weaker macroeconomic outlook and attractive industry dynamics
2015
2.3%
2016
1.6%
2017f
1.7%
2015
3.3%
2016
3.9%
2017f
3.5%
2015
3.1%
2016
1.9%
2017f
2.3%
2014
7.4%
2015
6.0%
2016
4.9%
2014
8.2%
2015
4.9%
2016
7.6%
2014
5.9%
2015
7. 1%
2016
7.2%
2015
18.0
2016
18.2
2017f
18.4
2015
31. 1
2016
31.5
2017f
31.8
2015
48.2
2016
48.8
2017f
49.3
2015
23,682
2016
24,113
2017f
24,797
2015
12,389
2016
12,903
2017f
13,501
2015
13,833
2016
14, 103
2017f
14,609Av. Latam:
15,078
Av. Latam:41.7
Source: GDP Growth, Population and GDP Per Capita: International Monetary Fund. Retail Sales: Euromonitor.
GDP GROWTH
POPULATION (MILLIONS) GDP PER CAPITA, PPP
RETAIL SALES GROWTH
Chile Peru Colombia
Chile Peru Colombia Chile Peru Colombia
Chile Peru Colombia

/
17
Parq
ue A
rauc
oCo
rpor
ate
Ove
rvie
w- O
ctob
er 2
017
+8.3% +8.5% +9.9%+9.5%
Chile
Peru
Tenant sales1 Revenues1 NOI1,2
Colombia
(1) Chile in MMCLP, Peru in ThPEN and Colombia in MMCOP. (2) Not including overhead expenses (Corporate headquarters, regional Services Center, Chile Division, Peru Division and Colombia Division)
GLA1
983,814 1 ,077 , 18895,716 103,848 85,191 93,660
LTM 2Q16
420,500 455,500
LTM 2Q17 LTM 2Q16 LTM 2Q17 LTM 2Q16 LTM 2Q17 LTM 2Q16 LTM 2Q17
Consistent results in a challenging macroeconomic environment
Results have been positive in all three countries
+4.8% +3.9% +7.6% +12.3%
2,701 , 1072,807 ,789
230,717248,242
172,496193,714
373,500391 ,500
LTM 2Q16 LTM 2Q17 LTM 2Q16 LTM 2Q17 LTM 2Q16 LTM 2Q17 LTM 2Q16 LTM 2Q17
+80. 4% +49.9% +69.9% +89.3%
369,553554,027
42,68172,532
30,88658,468
79,000142,500
LTM 2Q16 LTM 2Q17 LTM 2Q16 LTM 2Q17 LTM 2Q16 LTM 2Q17 LTM 2Q16 LTM 2Q17

/
18
Parq
ue A
rauc
oCo
rpor
ate
Ove
rvie
w- O
ctob
er 2
017
Consistent Same Store Growth and a Healthy Occupancy Cost
2Q17
1 .7
4Q16
7 .2
3.7
2Q16 3Q16
4. 1
1Q17
2.6
2Q17
2.6
3Q16
6.2 7 .0
1Q172Q16
4.3
4Q16
2.7
2Q16
10.2%
2Q17
10.2%
58%Others
CHILE SAME STORE SALES / CHG. % CHILE SAME STORE RENT / CHG. % CHILE OCCUPANCY COST
42%Anchor Stores
1) Peru’s Same Store Sales and Same Store Rent in 4Q16 do not include Larcomar due to contingencies.
2Q17
0.2
4Q16
5.7
-2.4
2Q16 3Q16
9.2
1Q17
8.2
2Q17
-0.9
8.4
4Q16
5.5
2Q16 3Q16
5.3
1Q17
7 .6
70%Others
2Q16
11.8%
2Q17
13.9%
COLOMBIA SAME STORE SALES1 / CHG. % COLOMBIA SAME STORE RENT1 / CHG. % COLOMBIA OCCUPANCY COST
30%Anchor Stores
PERU SAME STORE SALES1 / CHG. % PERU SAME STORE RENT1 / CHG. % PERU OCCUPANCY COST
4. 2
2Q174Q16
2.0-1 . 1
2Q16 3Q16
1 .6
1Q17
0.4
2Q17
3.0
4Q16
5.8
-2.9
2Q16 3Q16
3.8
1Q17
4.641%Others
2Q16
7.6%
2Q17
7.5%
59%Anchor Stores
Consistent results in a challenging macroeconomic environment

/
19
Parq
ue A
rauc
oCo
rpor
ate
Ove
rvie
w- O
ctob
er 2
017
Stable and diversified revenues
Parque Arauco diversifies its market risks at a country, format, and socio-economic level
5043 7 100
Medium to HighIncome: Includes ABC1
and C2 in Chile, A and B in Peru and 6, 5 and 4
in Colombia
Medium Income:Includes C3 and D in
Chile, C and D in Peru and 3 in Colombia
Medium to LowIncome: Includes
E in Chile and Peru and 2 and 1 in
Colombia
10.3%
29.1%
85.6%
6.7%2.7%
5.0%
COUNTRY LEVEL DIVERSIFICATION (%REVENUES)
SOCIO-ECONOMIC LEVEL DIVERSIFICATION (% REVENUES)
FORMAT LEVEL DIVERSIFICATION (% REVENUES)
Chile Peru Colombia Regional Neighborhood Outlet Strip center
60.6%

/
20
Parq
ue A
rauc
oCo
rpor
ate
Ove
rvie
w- O
ctob
er 2
017
Stable and diversified revenues
With a 39% market share in Chile, Parque Arauco is the outlet market leader in the countries where we operateOutlets currently in our portfolio
Keys to the Premium Outlet Format >>1 >> Location
Located near main cities
2 >> Brands Premium name-brands
3 >> Discounts More than 30% discount
ARAUCO PREMIUM OUTLET BUENAVENTURA, CHILE ARAUCO PREMIUM OUTLET CONCEPCIÓN, CHILE
INOUTLET PREMIUM OUTLET LURIN, PERÚINOUTLET FAUCETT, PERÚ
ARAUCO PREMIUM OUTLET CURAUMA, CHILE
ARAUCO PREMIUM OUTLET CURAUMA, CHILE

/
21
Parq
ue A
rauc
oCo
rpor
ate
Ove
rvie
w- O
ctob
er 2
017
Strong commercial relationships with local and global brands
Consolidated commercial relationships with well-known tenants
Anchor Stores
Non AnchorStores
>>
>>
Malls
11
4
10
5
12
Years as a client
35
16
3512
9
Total GLA (m2)
96.554
33.011
74.54848.050
6.058
Country
CHILEPERU
COLOMBIA
CHILEPERU
CHILEPERU
CHILEPERU
CHILEPERU
COLOMBIA
18 117.316CHILEPERU
COLOMBIA
4 188.934CHILEPERU
COLOMBIA
14 142.307CHILEPERU
COLOMBIASource: Parque Arauco

/
22
Parq
ue A
rauc
oCo
rpor
ate
Ove
rvie
w- O
ctob
er 2
017
Strong commercial relationships with local and global brands
Parque Arauco is supporting the globalization of several brands entering the Andean region
Source: Parque Arauco
NEW TENANTS PARQUE ARAUCO KENNEDY IN THE LAST 5 YEARS:
80% of new GLA leased in Parque Arauco Kennedy over the last 5 years has been leased to international brands.
Many brands have opened their first store in Chile in Parque Arauco Kennedy during the last five years including Tiffany & Co., Dolce & Gabbana, Forever 21, Bath & Body Works, Tory Burch, Victoria’s Secret, Omega, Versace Collection, Vince Camuto, and BCBG.
International Local
NOMBRE GLA
FOREVER 21 1,639
TOP SHOP 464
UNDER ARMOUR 445
LOUIS VUITTON 420
GUCCI 406
BANANA REPUBLIC 363
AMERICAN EAGLE 351
AEROPOSTALE 342
DOLCE & GABBANA 316
BURBERRY 276
EMPORIO ARMANI 247
SALVATORE FERRAGAMO 241
TIFFANY & CO 219
EL VOLCAN 218
BOLD 214
NOMBRE GLA
ETIQUETA NEGRA 209
MICHAEL KORS 208
RALPH LAUREN 207
TORY BURCH 201
ERMENEGILDO ZEGNA 197
ENTEL 190
ARTE ISABEL ANINAT 161
VICTORIA´S SECRET 129
ETAM 123
MILK 117
CANELA HOME & DECOR 105
METRO CUADRADO 114
JUSTICE 104
BATH & BODY WORKS 103
OCTOBER 102
OTHERS 3,020
TOTAL 14,956
>>
INTERNATIONAL LOCAL

/
23
Parq
ue A
rauc
oCo
rpor
ate
Ove
rvie
w- O
ctob
er 2
017
Solid corporate governance and increased concern with sustainability
Parque Arauco has received important recognitions from local and international organizations
Workplace Recognition
Investor Relations Recognition
Management Recognition
Sustainability Recognition
Best Capital Markets Strategy:
Andes in 2016.
In 2016, Parque Arauco is part of the Dow Jones
Emerging Market Sustainability Index. We are the
first Latin American real estate company to be part
of this prestigious index.
Best Investor Relations
Department for Mid-Size
companies according to Santander
and Revista Capital in 2016.
Parque Arauco was recognized by
Great Place to Work in Chile and
Peru in 2016.
Source: Parque Arauco

/
24
Parq
ue A
rauc
oCo
rpor
ate
Ove
rvie
w- O
ctob
er 2
017
Solid corporate governance and increased concern with sustainability
In the last years we have continued advancing our sustainability strategy
Source: Parque Arauco
Environmental Management1.We established the baseline for energy, water, greenhouse gases (GHG) and residual consumption in Chile, Peru and Colombia. 2.We developed an environmental management model, which will be implemented in 2017. 3.We continued sustainably building projects in Colombia (Parque La Colina) and Peru (InOutlet Premium Lurin). 4.We began a study to identify and prioritize climate change risks in some of our assets and projects.
Social Management5.We worked on designing a community relationship strategy and policy applicable to all of operations. 6.We approved and implemented a corporate donation policy.7.More than 20 foundations or social organization had access to free space in our assets. 8.Our intellectual disability intern program had more than 40 participants. 9.We supported more than 340 small entrepreneurs, with more than 20 local and emerging entrepreneur fairs.
Corporate Governance10. We evaluated our corporate governance practices with an expert consultant in this matter. 11. We redefined our values, purpose, mision and long term strategy. 12.We strengthened our risk management team, which performed an exhaustive examination of this matter.13.We initiated a diagnostic with international experts in safety and security standards in our assets. 14.We continued being one of the best places to work, according to the ranking Great Place to Work.
Other Highlights15.We adhere to the United Nations Global Compact.16. We are the first Latin American Real Estate Company to enter into the Dow Jones Sustainability Emerging Markets Index.
2016 Highlights

/
25
Parq
ue A
rauc
oCo
rpor
ate
Ove
rvie
w- O
ctob
er 2
017
Conservative debt structure and outstanding financial performance
Parque Arauco's policy is to finance projects with 50% debt and 50% equity, and is comfortably within all its covenantsLIABILITIES / EQUITY
EBITDA/FINANCIAL EXPENSES NET FINANCIAL DEBT/EBITDA
|NET FINANCIAL DEBT / EQUITY
2012 2013 2014 20162015 2Q17
3.42x3.89x
3.37x 3.33x3.04x 3.12x
2012
2012
2013
2013
2014
2014
2016
2016
2015
2015
2Q17
2Q17
0.43x
3.85x
0.59x
5.00x
0.47x
4.25x
0.76x
5.87x
0.72xx
5.88x
0.79x
6.06x
> 2.50x
< 1.40x < 1.50x
2012 2013 2014 20162015 2Q17
0.78x0.89x 0.81x
1.14x 1.18x 1.16x

/
26
Parq
ue A
rauc
oCo
rpor
ate
Ove
rvie
w- O
ctob
er 2
017
JUNE 2017
Conservative debt structure and outstanding financial performance
The Company has a conservative debt structure
JUNE 2014
175
938
6498
3311
77
188
25-36months
13-24months
0-3months
49-60months
7-12months
11-20years
37-48months
4-6months
6-10years
21-35years
0
150
4
80
156300134
735
158
25-36months
13-24months
0-3months
49-60months
7-12months
11-20years
37-48months
4-6months
6-10years
21-35years
181
333
IMPROVEMENT IN LOCAL DEBT RATINGFitch: AA- Feller: AA- ICR:AA-
BBB- BBB BBB+ A- AA-A AAA+ AA+
Source: Parque Arauco(1) Does not include accrued interests and the exchange rate is at the close of June 30, 2017.
55% UF
66% UF
12% CLP 7% CLP
13% PEN 16% PEN
1 1% USD 10% COP
9% COP
7% Variable79%
Fixed 93% Fixed
21% Variable
DEC. 2016
SUMMARY OF DEBT BY CURRENCY
LIABILITY AMORTIZATION PROFILE AND DURATION1
SUMMARY OF DEBT RATES
JUNE 2017JUNE 2014
June 2014 (US$MM)Average Duration: 4.1 Years
June 2017 (US$MM)Average Duration: 7.0 Years

/
27
Parq
ue A
rauc
oCo
rpor
ate
Ove
rvie
w- O
ctob
er 2
017
Conservative debt structure and outstanding financial performance
The cost of debt has decreased importantly in the past 5 years
The cost of debt of Parque Arauco has decreased 160 points from 4.1% to 2.5%The spread five years ago had collateral agreements, while the current spread is
unsecured with no collateral.
Date: 12-12-2014Base: 1.66%Spread: 1.74%Duration: 14.3
Date: 04-17-2015Base: 1.62%Spread: 1.68%Duration: 14.77
Date: 10-12-2016Base: 1.46%Spread: 1.02%Duration: 12.71
Generic long-term bond issued by Parque Arauco in Chile
Source: Risk America

/
28
Parq
ue A
rauc
oCo
rpor
ate
Ove
rvie
w- O
ctob
er 2
017
Important growth opportunities
Parque Arauco has 0.9 million m2 and a 2% market participation in Latin American and a 8% market participation in the Andean Region.
Source: Prepared using information published by the International Council of Shopping Centers (ICSC)., Peruvian Shopping Center Council (ACCEP) and Parque Arauco analysis
BrazilGLA: 14.7 million de m2
32% of total
Latin AmericaGLA: 46.1 million m2 Andean Region
GLA: 11.9 million m2
25% of total
MexicoGLA: 17.4 million m2
38% of total
ArgentinaGLA: 2.1 million m2
5% of total
Indicator CHILE PERU COLOMBIA
Total GLA (th) 3,600 2,700 5,600
GLA Parque Arauco (th) 454 382 142
Market Share 13% 14% 3%
Rank #3 #3 #5

/
29
Parq
ue A
rauc
oCo
rpor
ate
Ove
rvie
w- O
ctob
er 2
017
Parque Arauco participates in markets with a growing retail market
2,500
2,000
1,500
1,000
500
-
OPENING PEAKING MATURING CLOSING
Chile
Mexico
Brazil
PeruColombia
(1) Source: International Council of Shopping Centers, World Bank, Parque Arauco analysis(2) Source: AT Kearney Global Retail Development Index 2016(3) Source: CBRE- How Global is the business of retail?. This report did not include Colombia.
Important growth opportunities
RETAIL SALES PER CAPITA AND GLA PER 1,000 INHABITANTS1
AT KEARNEY GRDI WINDOW OF OPPORTUNITY2
GLA
per
1,0
00
hab
itant
s
Middle class is growing; consumers are willing to explores organized
formats; government is relaxing restrictions
Consumers seek organized formats and
greater exposure to global brands; retail
shopping districts are being developed; real
estate is affordable and available
Consumer spending has expanded significantly; desirable real estate is
more difficult to secure; local competition has
become more sofisticated
Consumes are more used to modern retail; discretionary spending is higher; competition
is fierce both from local and foreign retailers;
real estate is expensive and not readily available
RETAIL PRESENCE BY COUNTRY3 (% OF GLOBAL BRANDS IN COUNTRY)
39.5%
Mexico
21.0%
Chile Brazil
20.7%
Argentina
11.7%
Venezuela
10.2%
Peru
9.9%
United States
16,000
12,000
8,000
4000
Canada Australia UK Chile Mexico Colombia Peru Brazil Argentina
Reta
il Sa
les
Per
Capi
ta
51.5%
United States
57.5%
UK
Retail sales per capitaGLA per 1,000 habitants

/
30
Parq
ue A
rauc
oCo
rpor
ate
Ove
rvie
w- O
ctob
er 2
017
Parque Arauco's growth has come from greenfield projects and M&A
Important growth opportunities
Total GLA
in 2006
194,74555,651
83,708 24,59591,625 27,676
80,242
132,85837,400
90,000
989,500
Total GLA
in 2007
Total GLA
in 2010
Total GLA
in 2014
Total GLA
in 2008
Total GLA
in 2011
Total GLA
in 2015
Total GLA
in 2009
Total GLA
in 2013
Total GLA
in 2012
New GLA
in 2016
Greenfields663,143 m2
M&A326,357 m2
Greenfield M&A
67%
33%
Total GLA
2Q2017
126,500
New GLA
in 2017
44,500
Source: Parque Arauco

/
31
Parq
ue A
rauc
oCo
rpor
ate
Ove
rvie
w- O
ctob
er 2
017
INTRODUCTION
OUR OPERATIONS
INVESTMENT HIGHLIGHTS
FUTURE DEVELOPMENTS
/
32
Parq
ue A
rauc
oCo
rpor
ate
Ove
rvie
w- O
ctob
er 2
017
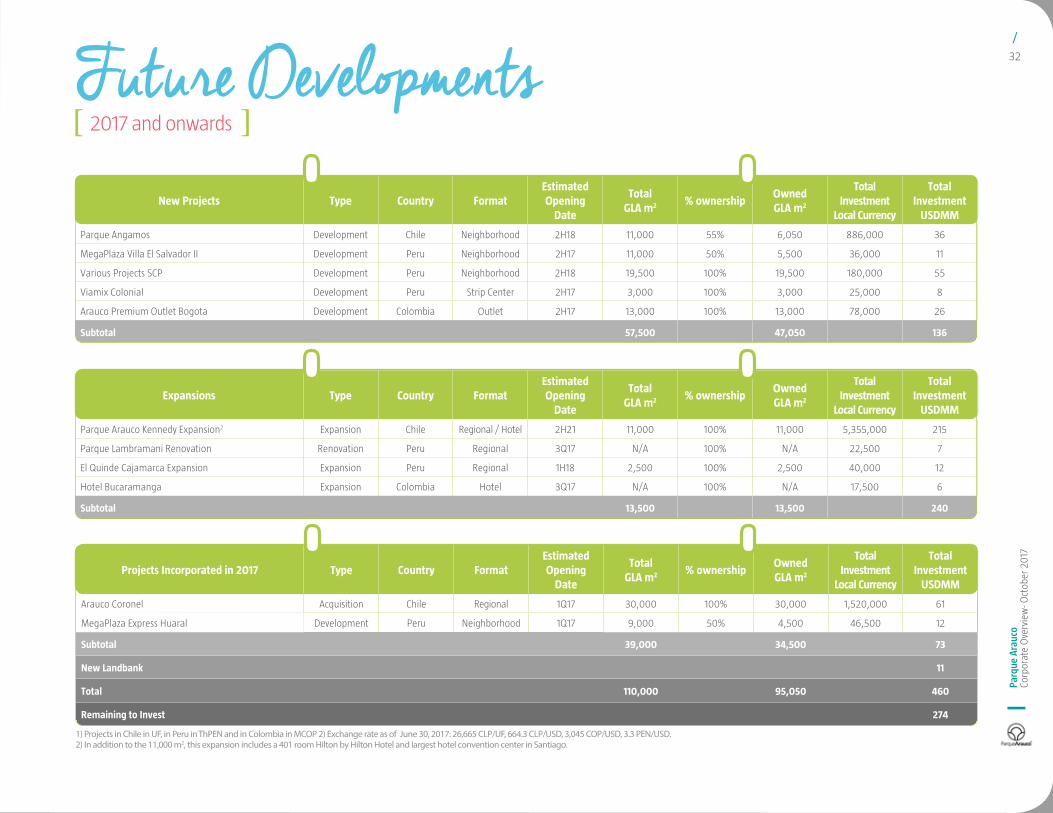
Future Developments2017 and onwards
New Projects Type Country FormatEstimated Opening
Date
Total GLA m2 % ownership
Owned GLA m2
Total Investment
Local Currency
Total Investment
USDMM
Parque Angamos Development Chile Neighborhood 2H18 11,000 55% 6,050 886,000 36
MegaPlaza Villa El Salvador II Development Peru Neighborhood 2H17 11,000 50% 5,500 36,000 11
Various Projects SCP Development Peru Neighborhood 2H18 19,500 100% 19,500 180,000 55
Viamix Colonial Development Peru Strip Center 2H17 3,000 100% 3,000 25,000 8
Arauco Premium Outlet Bogota Development Colombia Outlet 2H17 13,000 100% 13,000 78,000 26
Subtotal 57,500 47,050 136
Expansions Type Country FormatEstimated Opening
Date
Total GLA m2 % ownership
Owned GLA m2
Total Investment
Local Currency
Total Investment
USDMM
Parque Arauco Kennedy Expansion2 Expansion Chile Regional / Hotel 2H21 11,000 100% 11,000 5,355,000 215
Parque Lambramani Renovation Renovation Peru Regional 3Q17 N/A 100% N/A 22,500 7
El Quinde Cajamarca Expansion Expansion Peru Regional 1H18 2,500 100% 2,500 40,000 12
Hotel Bucaramanga Expansion Colombia Hotel 3Q17 N/A 100% N/A 17,500 6
Subtotal 13,500 13,500 240
Projects Incorporated in 2017 Type Country FormatEstimated Opening
Date
Total GLA m2 % ownership
Owned GLA m2
Total Investment
Local Currency
Total Investment
USDMM
Arauco Coronel Acquisition Chile Regional 1Q17 30,000 100% 30,000 1,520,000 61
MegaPlaza Express Huaral Development Peru Neighborhood 1Q17 9,000 50% 4,500 46,500 12
Subtotal 39,000 34,500 73
New Landbank 11
Total 110,000 95,050 460
Remaining to Invest 274
1) Projects in Chile in UF, in Peru in ThPEN and in Colombia in MCOP 2) Exchange rate as of June 30, 2017: 26,665 CLP/UF, 664.3 CLP/USD, 3,045 COP/USD, 3.3 PEN/USD.2) In addition to the 11,000 m2, this expansion includes a 401 room Hilton by Hilton Hotel and largest hotel convention center in Santiago.

/
33
Parq
ue A
rauc
oCo
rpor
ate
Ove
rvie
w- O
ctob
er 2
017
OPENING DATE: The shopping center opened on December 6, 2016.
COMMERCIALIZATION STATE: 88.1% of the GLA is open. H&M opened on May 6, 2017.
BRANDS:
Parque La Colina was inaugurated in December 2016

/
34
Parq
ue A
rauc
oCo
rpor
ate
Ove
rvie
w- O
ctob
er 2
017
We announced a new expansion of Parque Arauco Kennedy
PROJECT DETAILS:
Investment: 5,355,000 UF5-star hotel: Hilton by HiltonRooms: 401Convention center: 3,000 m2
Parking spots: 700Additional GLA: 11,000 m2
- The project will have the first five star Hilton Hotel in Chile, a convention center, as well as theincorporation of new stores and more parking.
- The five star Hilton hotel will have 401 rooms, two restaurants, three bars, two pools, a gym and an executive lounge. It will have the largest hotel convention center in the country, with the possibility of hosting over 2,800 people.
- The expansion will include a new flagship Falabella store with almost 25,000 m2 of GLA. This store will occupy the first four floors of the
HOTEL OPERATOR:

/
35
Parq
ue A
rauc
oCo
rpor
ate
Ove
rvie
w- O
ctob
er 2
017
LandbankName m2 % Ownership Total Cost (local currency) Total Cost (USD MM)
Quilicura 25,486 100% 78,000 3
Buenaventura 115,864 100% 455,000 18
Chicureo 47,614 100% 206,000 8
Los Andes 39,254 100% 117,000 5
Others in Chile 67,550 92% 522,000 21
Total Chile 295,768 98% 1,378,000 55
Parque El Golf - San Isidro 16,350 68% 127,590 40
Chimbote 42,657 100% 18,000 6
Talara 30,675 100% 9,400 3
Ica 12,643 100% 13,500 4
Chiclayo 6,609 100% 6,300 2
Pomalca Chiclayo 45,042 100% 6,565 2
Lambayeque- MegaPlaza 25,260 50% 18,900 6
San Juan de Lurigancho- MegaPlaza 80,000 50% 10,415 3
Others MegaPlaza 106,157 50% 85,685 26
Total Peru 365,393 70% 296,355 92
Neiva 49,537 100% 18,000 6
Valledupar 46,000 100% 30,000 10
Barranquilla 56,166 100% 76,000 26
Total Colombia 151,703 100% 124,000 42
Total 812,864 86% 189
1) Landbank in Chile in UF, in Peru in ThPEN and in Colombia in MCOP 2) Exchange rate as of June 30, 2017: 26,665 CLP/UF, 664.3 CLP/USD, 3,045 COP/USD, 3.3 PEN/USD.

/
36
Parq
ue A
rauc
oCo
rpor
ate
Ove
rvie
w- O
ctob
er 2
017
Glossary»Adjusted FFO Margin - AFFO / revenues
»AFFO -Adjusted Funds From Operations: Net Profit - Depreciation & Amortization - Other Income/expenses - Share of Profit (Loss) of Associates Accounted - Foreign Exchange Differences - Income (Loss) for indexed assets and liabilities - Gains (losses) from the difference between the previous book value and the fair value of financial assets - Deferred tax+ Associates accounted Adjusted FFO
»Controlling Adjusted FFO -AFFO attributable to the shareholders of the company
»Controlling FFO -FFO attributable to the shareholders of the company
»EBITDA - Earnings Before Income Tax Depreciation and Amortization: Revenues + Cost of Sales + Administration Expenses - Depreciation and Amortization EBITDA margin -EBITDA divided by revenues
»EPS -Earnings Per Share: Net income attributable to the equity holders of the company/weighted average number of shares outstanding
»FFO -Funds From Operations: Net Profit - Depreciation & Amortization - Share of Profit (Loss) of Associates Accounted + Associates Accounted FFO
»GLA -Gross Leasable Area. Equivalent to the sum of all
the areas available for lease
»Greenfield Projects - Organic development of new shopping centers
»Landbank -Land held by the company for future development
»LTM -Refers to information from the last twelve months
»Monthly Revenues/m2 -Monthly revenues divided by the occupied GLA for the period
»Monthly Sales/m2 -Monthly tenant sales divided by the occupied GLA for the period
»Neighborhood Mall -A shopping mall with a GLA between 6,000 and 20,000 m2
» Net income margin -Net profit / revenues
»NOI -Net Operating Income: Revenues + Cost of Sales + Administration Expenses - Depreciation & Amortization + Associates accounted NOI
»Occupancy -GLA paying rent divided by total GLA
»Occupancy cost -Minimum rent, plus variable rent, plus common expenses, plus a promotion fund that the
tenants pay Parque Arauco divided by the sales of the tenant.
»Owned GLA -Total GLA weighted by Parque Arauco’s interest in the mall
»Pipeline -Greenfield and expansion projects under development
»Premium Outlet - Shopping center located outside of the city offering name brand clothing and goods for a reduced price
»Regional Mall - A shopping mall with a GLA over 20,000 m2.
»SSR -Same Store Rent: Percentage change in rent collected from tenants that paid rent in both of the periods compared
»SSS -Same Store Sales: Percentage change in sales from tenants that reported sales in both of the periods compared
»Strip Center -A shopping center with a GLA less than 6,000 m2 Tenant Sales Tenant sales of the consolidated assets
»UF -Unidad de Fomento: A chilean currency unit indexed according to inflation on a daily basis.


Parque Arauco ColombiaOctober 2017
[2]
I. Introduction to Colombia
II. Parque Arauco Colombia
Agenda
Versión 16-10-2017 20:30

[3]
I. Introduction to Colombia
II. Parque Arauco Colombia
Agenda
4
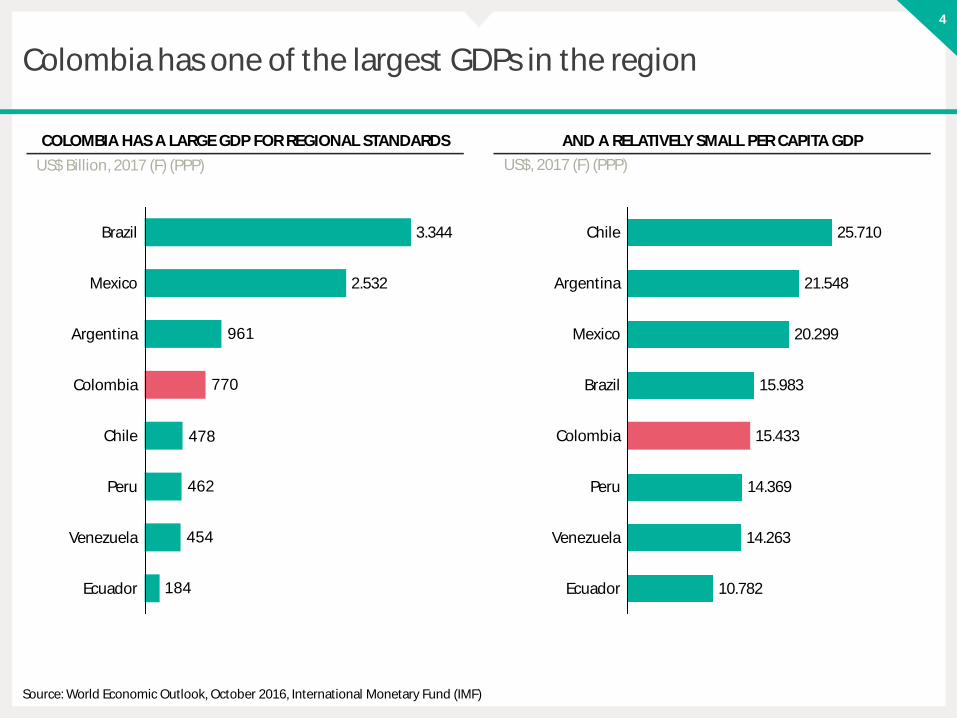
Colombia has one of the largest GDPs in the region
US$, 2017 (F) (PPP)US$ Billion, 2017 (F) (PPP)
184
454
462
478
770
961
Venezuela
Colombia
Ecuador
Peru
Chile
Brazil 3.344
Argentina
2.532Mexico
Venezuela
10.782
14.263
Ecuador
Colombia 15.433
14.369
15.983Brazil
20.299
Argentina
Peru
Mexico
Chile
21.548
25.710
COLOMBIA HAS A LARGE GDP FOR REGIONAL STANDARDS AND A RELATIVELY SMALL PER CAPITA GDP
Source: World Economic Outlook, October 2016, International Monetary Fund (IMF)

5
Colombia will continue to have a leading growth in the region
Colombia
Mexico
Ecuador
Argentina
0,3
3,2
3,7
2,6
Chile 2,5
Brazil
2,4
1,6
Peru
20192017
2,3
3,6
3,0
2018
3,63,6
20212020
Source:, World Economic Outlook, April, 2017, International Monetary Fund (IMF)
Real GDP% Change ForecaseRead GDP% Change, Average 2017-2012
COLOMBIA HAS STRONG GROWTH GOING FORWARD COLOMBIA GDP GROWTH EXPECTATION

6
Colombia has a diversified economy
17,1%
23,1%
Transport and communicationsAgricultureElectricity, gas and water
Commerce
7,9%
Financial intermediation
Social and personal services
Manufacturing
6,7%
13,5%
Construction
Mining
8,2%
7,1%
12,4%
3,8%
Source: Colombian Central Bank
2016 GDP BREAKDOWN BY ECONOMIC ACTIVITY

7
diversified exports and imports
TOP 2016 EXPORTS (% OF TOTAL) TOP 2016 IMPORTS BY USE (% OF TOTAL)
Source: Central Bank of Colombia
Ferronickel
Petroleum and derivtives1,0%
7,7%
Coffee
14,8%
Carbon
33,2%
Mining
Industrial
5,8%
8,9%
Farming
28,5%
11,2%
Farming
Industrial
Non-durable goods
8,5%
13,3%7,8%
Transportation
3,9%
Durable Goods
Combustibles
32,9%
Industrial (Raw material)
3,1%Construction
18,9%
8
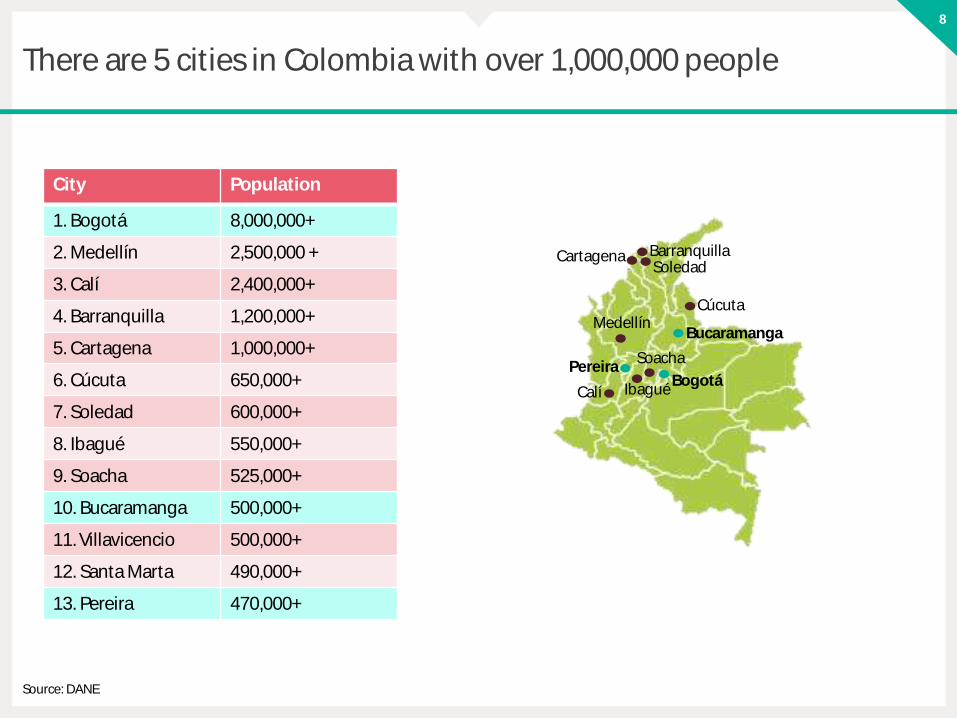
There are 5 cities in Colombia with over 1,000,000 people
Bucaramanga
City Population
1. Bogotá 8,000,000+
2. Medellín 2,500,000 +
3. Calí 2,400,000+
4. Barranquilla 1,200,000+
5. Cartagena 1,000,000+
6. Cúcuta 650,000+
7. Soledad 600,000+
8. Ibagué 550,000+
9. Soacha 525,000+
10. Bucaramanga 500,000+
11. Villavicencio 500,000+
12. Santa Marta 490,000+
13. Pereira 470,000+
BogotáPereira
Cartagena
Calí
Barranquilla
Cúcuta
Soledad
Ibagué
Soacha
Source: DANE
Medellín

9
Macroeconomic indicators are sending mixed signals
-40
-30
-20
-10
0
10
20
30
40
20152013 20172014 20162012 2018
CHALLENGING CONSUMER CONFIDENCE
Consumer confidence levels (DANE)
STABLE UNEMPLOYMENT RATES
Unemployment rates(DANE)
10,5
11,0
10,0
20182017
9,0
20162015201420132012
0,0
9,5
DECREASING INFLATION
Inflation % (DANE)
4
6
0
7
5
3
2017201420132012 20162015
DECREASING LONG TERM RATES
Colombia generic 10 year bond (Bloomberg)
7
0
6
8
9
20152013 20142012 20172016

10
Some consumption indicators are improving
DECREASING POVERTY RATES
Poverty headcount (% of population)
2015
28%
20142009
34%
2008
33% 31%
20132010 2012
37%42%
29%
40%
2011
IMPROVED BANKING PENETRATION
%Population with at least one financial product
64,9%62,2%71,5%67,2%
75,0%72,5%
20152010 2012 2013 20142011
A STEADY POPULATION GROWTH
1,0%
1,2%
0,9%1,1%
2010
1,1%
20142012 2013
1,0%
2011
1,1%0,9%
20092008 2015
Population growth %
GROWING URBAN POPULATION
2015
1,4%
2011
1,4%1,5%
201320102008
1,3%1,6% 1,5%
2009 2014
1,3%
2012
1,3%
Urban population growth %
Source: World Bank for poverty rates, population growth rates and Asobancaria for banking penetration.

11
CHILE
PERÚ
COLOMBIA
improving institutional frameworks
EASE OF DOING BUSINESS RANK (2016)
Mexico 47
Colombia 53
Peru 54
Chile 57
Argentina 116
Brazil 123
WEF GLOBAL COMPETITIVENESS DETAIL FOR COLOMBIA
01234567
Institutions
Infrastructure
Macroeconom
Health and
Higher
Goods marketefficiency
Labor marketefficiency
Financial
Technologicalreadiness
Market size
Businesssophistication
Innovation
WEF GLOBAL COMPETITIVENESS RANK (2016)
Chile 33
Mexico 51
Colombia 61
Peru 67
Brazil 81
Argentina 104
Score 1 (low) to 7 (high)
Source: Ease of Business, World Economic Forum

12
Shopping center sales have outpaced sector dynamics in Colombia
10.000
0
5.000
15.000
20142013
+11,6%
201620152011 2012
SHOPPING CENTER SALES (RADDAR/ ACE COLOMBIA) (THUSD)
50.000
40.000
30.000
20.000
10.000
0
70.000
60.000
20162013
+6,1%
20122011 20152014
RETAIL SALES (EUROMONITOR) (THUSD)
200.000
100.000
150.000
50.000
0
+3,9%
201520132011 201620142012
FINAL CONSUMPTION (COLOMBIAN CENTRAL BANK) (THUSD)
RETAIL AND MALL SALES AS % OF TOTAL FINAL CONSUMPTION
60,6% 60,3%
7,3%6,1%
33,3% 32,3%
2012
32,8%
2011
6,9%
59,8%
33,0% 33,6%
8,0%
60,4% 58,4%
2013
7,3%
2014 2016
35,0%
8,7%
56,3%
2015
Retail (ex mall)Mall OthersSource: Colombian Central Bank, Euromonitor, Raddar, ACE Colombia

13
Distribution of Colombian spend
HOW 100 COLOMBIAN PESOS ARE SPENT IN A SHOPPING CENTER
4,5% 5,2%
27,7%28,6%
7,5%8,6%
EducationHousing
7,3%
Eating outside
of the home
Entertainment& culture
Transport. & Comm.
Health
6,5%
38,4%
Clothing and shoes
OthersAnchor stores
39,0%
7,2%6,6%
0,1%
2,6% 3,0%3,7%
0,0%
3,6%
2017
2016
Source: Raddar

14
Colombian elections
• Presidential elections take place in May 2018• Latest Datexco voting intention survey results:
4,1%
20,1%
Germán Vargas Lleras
5,9%
16,5%
7,6%
12,1%
Gustavo Petro
Sergio Fajardo
11,2%
Juan Manuel Galan
Clara Lopez know
No Response
WHO WOULD YOU VOTE FOR IF THE ELECTIONS WERETOMORROW?
Simón Gaviria
4,3%
18,6%
13,1%
2,4%
Germán Vargas Lleras
3,3% 2,6%
Gustavo Petro
Francisco Santos
13,7%
Alejandro Ordoñez
Roy Barreras
Piedad Córdoba
WHICH CANDIDATE WOULD YOU NEVER VOTE FOR?
52,9%
Unemploy.
41,0%
Political corruption
Common crimes
Health National safety
Educational coverage
15,4% 12,8%
Education quality
11,5% 9,8%
EconomySafety Health coverage
39,4%
11,6% 10,1%20,0%
WHAT ARE THE THREE PROBLEMS THE NEXT PRESIDENTSHOULD SOLVE?
Source: Datexco

15
Peace agreement
• The agreement is to end the civil war with the FARC and create a stable and during peace for Colombia. The agreements are summarized as:
1. A new Colombian countryside: Comprehensive rural reform2. Political participation: A democratic opportunity to build peace3. End of the conflict: Agreement on the bilateral and definitive
ceasefire and cessation of hostilities and laying down of arms4. Solution to the problems of illicit drugs5. Agreement regarding the victims of the conflict:
Comprehensive system from truth, justice, reparation and non-repetition
6. Implementation and verification mechanisms
Source: Colombia Peace Organization

[16]
I. Introduction to Colombia
II. Parque Arauco Colombia
Agenda

17
CHILE
PERÚ
COLOMBIA
Purchase of Barranquilla
land
Purchase of
minority stake
Parque Caracolí opens in
Bucaramanga
History of Parque Arauco in Colombia
2008 2009 2010 2011 2012 2013 2014 2015 2016 2017
Parque Arauco opens
office in Colombia
Parque Arboleda opens in Pereira
Parque La Colina opens in Bogotá
Agreementsigned with
Bancolombia
Purchase of Valledupar land
Purchase of La Colina
land
Purchase of Bucaramanga
land
Agreementsigned withMerheg´sfamily to developParque
Arboleda
Source: Parque Arauco

18
Legal Structure
INVERSIONES INMOBILIARIASARAUCO ALAMEDA S.A.S.
INVERSIONES COLOMBIANASARAUCO S.A.S.
INMOBILIARIA LA COLINA ARAUCO S.A.S
INVERSIONES INMOBILIARIAS BUCARAMANGA ARAUCO S.A.S
EJE CONSTRUCCIONES S.A.S
100% 100%
6,0001632%
48,9998878%100%100%
PARQUE ARAUCO INTERNACIONAL S.A. PARQUE ARAUCO S.A.
99,9956392%
Source: Parque Arauco

19
Organizational chart
Gerencia Legal
Gerencia de Administración y
Finanzas
Gerencia Inmobiliaria
Country ManagerJuan Pablo Romero
Subgerencia de Personas
Gerencia de Centros Comerciales
Gerencia Comercial
Source: Parque Arauco

20
CHILE
PERÚ
COLOMBIA
Parque Arauco has three shopping centers in Colombia
BogotáPereira
Bucaramanga
Colombia GLA (m2) % OwnershipOwned GLA
(m2) OccupancyYear of incorporation
Parque Arboleda 41,000 55% 22,550 95.3% 2010
Parque Caracoli 38,500 100% 38,500 87.8% 2013
Parque La Colina 63,000 100% 63,000 88.1% 2016
Total Colombia 142,500 87% 124,050 90.1%
Source: Parque Arauco

21
Parque Arboleda - Pereira
TENANTS SALES (MMCOP)REVENUES WITHOUTOVERHEAD (MMCOP)
NOI WITHOUT OVERHEAD(MMCOP)
GLA (M2) AND OCCUPANCY (%)
LTM 2Q16
33.000
LTM 2Q17
40.500 41.000
2016
40.500
2015 LTM 2Q17
218.743
2016
198.348 215.055
+10,3%
2015
+3,8%
LTM 2Q16
210.655 25.07924.373
20162015
21.636
LTM 2Q17
+15,9% +9,2%
22.959
LTM 2Q16
+23,0%
LTM 2Q17
16.27920.01919.436
2015 2016
+14,4%
LTM 2Q16
17.501
92,9%94,6% 95,3%95,6%
KEY METRICS
PARQUE ARBOLEDA
Opening: 2010
Location: Cra. 14 #5-20, Pereira
Anchor: Falabella
Type of mall: Regional
Total GLA: 41,000 m²
Owner: Parque Arauco (55%) and
Merheg´s family (45%)
Pereira
Source: Parque Arauco

22
Parque Caracolí - Bucaramanga
TENANTS SALES (MMCOP)REVENUES WITHOUTOVERHEAD (MMCOP)
NOI WITHOUT OVERHEAD(MMCOP)
GLA (M2) AND OCCUPANCY (%)
38.500
LTM 2Q16
38.500
LTM 2Q17
20162015
38.500 38.500
158.898 158.129
LTM 2Q17
-0,5%
LTM 2Q16
+4,5%
2016
161.384
2015
151.378
LTM 2Q16
19.723
-0,3%
20.073
LTM 2Q17
2015
18.978 19.656
+3,6%
2016
12.801 13.385
LTM 2Q16
+1,5%+6,2%
LTM 2Q17
13.591
2016
13.909
2015
KEY METRICS
100,0%
87,8%88,4%87,3%
PARQUE CARACOLÍ
Opening: 2013
Location: Carrera 27 #29 145
Bucaramanga
Anchor: Falabella
Type of mall: Regional
Total GLA: 38,500 m²
Owner: Parque Arauco (100%)
Bucaramanga
Source: Parque Arauco

23
Parque La Colina - Bogotá
SALES / M2 (MMCOP)REVENUES / M2 WITHOUT
OVERHEAD (MMCOP) NOI MARGINGLA (M2) AND
OCCUPANCY (%)
63.00063.000
2017 E
63.000
2Q171Q17 1Q17
663.194
2Q17
505.343
2Q17
94.093
1Q17
89.97590,8%
1Q17 2Q17
87,9%
KEY METRICS
90,0%88,1%77,7%
PARQUE LA COLINA
Opening: 2016
Location: Cra. 58d #146-51,
Bogotá
Anchor: Falabella
Type of mall: Regional
Total GLA: 63,000 m²
Owner: Parque Arauco (100%)
Bogotá
Source: Parque Arauco

24
Revenue type and contract duration
16%
84%
Other Revenues
Rental Revenues
Fixed Revenues
Variable Revenues
97%
3%
47
9
21
23
< 2 years >4 years3-4 years2-3 years
FIXED VS VARIABLE RENTAL REVENUES COLOMBIA
As of June 30, 2017
CONTRACT LENGTH IN COLOMBIA
Based on % of revenues
Source: Parque Arauco

25
CHILE
PERÚ
COLOMBIA
Parque GLA in Colombia has tripled since 2010
142.500
20172015
71.500
2014 20162013
143.000
71.500
+331,8%
33.000 33.000
20122011
33.000
71.500
2010
Parque Arboleda
Parque Caracolí
Parque La Colina
Total GLA
Source: Parque Arauco

26
CHILE
PERÚ
COLOMBIA
The owned GLA has increased over 12x
Parque Caracolí
Parque Arboleda
Parque La Colina
Own GLA
0,2
0,1
140.000
120.000
100.000
0,9
0,0
60.000
0
80.000
0,4
0,8
0,7
0,6
0,5
0,340.000
20.000 9.999
2012
31.174
2013
31.174
2010
9.999
20162015
9.999
123.775
2011 2017
56.650
124.050
2014
Ownership %
We increased our ownership when we purchased minority participationin 2015

27
The GLA of Parque Arauco Colombia has increased fourfoldin the last five years
GLA (M²) TENANT SALES (MUSD)2
REVENUES (MUSD)1,2 NOI¹ (MMCOP)
(1) Not including overhead expenses (Corporate headquarters, regional Services Center and Colombia Division)(2) 1 USD= 2,921.72 COPSource: Parque Arauco
79.000
+80,4%
20162015 LTM 2Q2017
141.500
+331,8%
142.500
71.500
33.000
2013
33.000
71.500
20122011
71.500
2014 LTM 2Q16
190
113129120
10578
4943
LTM 2Q16
2012 2015
346%
LTM 2Q17
2016201420132011
+68,1%
25
1515141210
54
+69,9%
2016 LTM 2Q17
20122011 2013 2014
544%
2015 LTM 2Q16
20
1111109
84
3
+89,3%
LTM 2Q17
568%
20162015201420132011 2012 LTM 2Q16

28
The company has stable management indicators in Colombia
2Q16
90%
1Q15 3Q152Q15 1Q16
90% 93%93%
4Q15
89% 90% 90%
3Q16
92% 92%
2Q171Q17
85%
4Q16
OCCUPANCY (%)
0,2%
1Q16 4Q16
-1,1%
2Q16
1,6%
11,5%
4Q15
8,6%
5,3%
1Q173Q151Q15
4,5%
0,9%
2Q15
2,0%
3Q16
-0,5%
2Q17
SAME STORE SALES (CHG. %)
-0,9%
2Q17
5,3%
8,4%
4Q16 1Q17
7,6%
3Q16
11,2%
4Q15
5,5%
2Q161Q16
12,5%
1Q15
1,1%
3Q15
5,5%
2Q15
1,5%
SAME STORE RENT (CHG. %)
3Q16
12%
9%
1Q16 2Q16
15%
12%
1Q174Q162Q151Q15 3Q15
10%
12%14% 13%
12%
4Q15 2Q17
14%
OCCUPANCY COST (%)
Source: Parque Arauco

29
Diversified assets and revenues
57
100
29
14
TotalMedium Income: 4 and 3 in Colombia
Medium to Low Income: 2 and 1 in Colombia
Medium to High Income: 6 and 5 in Colombia
Source: Parque Arauco. Based on socio-economic composition of community in which malls are located.
ASSET LEVEL DIVERSIFICATION (º/º REVENUES 2017E) REVENUE TYPE DIVERSIFICATION (º/º REVENUES)
SOCIO-ECONOMIC LEVEL DIVERSIFICATION (º/º REVENUES)
Variable Revenues
Fixed Revenues
Other Revenues
12%
Parking Revenues
3%2%
84%
Parque Arboleda
Parque Caracoli19%
Parque La Colina
22%
58%

30
Future growth will come from pipeline and landbank
Project Type Format Estimatedopening
date
Total GLA m2
% ownership
OwnedGLA m2
Total investment
local currency
Total investment
USDMM
Arauco Premium Outlet Bogotá
Develop. Outlet 2H17 13,000 100% 13,000 78,000 26
Hotel Bucaramanga
Expansion Hotel 3Q17 N/A 100% N/A 17,500 6
Total 13,000 100% 13,000 95,500 32
NEW PROJECTS
LANDBANK
Name M2 % ownership Total cost (local currency)
Total Cost (USDMM)
Neiva 49,537 100% 18,000 6
Valledupar 46,000 100% 30,000 10
Barranquilla 56,166 100% 76,000 26
Total Colombia 151,703 100% 124,000 42
Source: Parque Arauco

31
CHILE
PERÚ
COLOMBIA
Project Arauco Premium Outlet Bogotá - Bogotá
Opening: 2H2017
Location: Sopó, Bogotá
Type of mall: Outlet
Total GLA: 13,000 m²
Total Investment: US$ 26 millones
Owner: Parque Arauco (100%)
Commercial %: 25% of contracts signed, 50% in negotiation
Bogotá
ARAUCO PREMIUM OUTLET BOGOTÁ
Source: Parque Arauco

32
Brands signed in Arauco Premium Outlet Bogotá

33
CHILE
PERÚ
COLOMBIA
Bucaramanga Hotel Project
Opening: 3Q2017
Location: Bucaramanga
Type of project: Hotel
N° of rooms: 104
Hotel Brand: Sonesta
Total Investment: US$ 6 millones
Owner: Parque Arauco (100%)
PARQUE CARACOLÍBucaramanga
Source: Parque Arauco

34
Bucaramanga Hotel
Source: Parque Arauco

35
Landbank
Barranquilla
Neiva
Name: NeivaM2: 49,537% Ownership: 100%Total Cost: 6(MMUS$)
Valledupar
Name: ValleduparM2: 46,000% Ownership: 100%Total Cost: 10(MMUS$)
Name: BarranquillaM2: 56,166% Ownership: 100%Total Cost: 26(MMUS$)
Source: Parque Arauco

[36]
Colombia’s Shopping Center IndustryOctober 2017

[2]
I. Competitive landscape
II. Sector dynamics
III. Rental vs. condominium
IV. eCommerce in Colombia
V. Globalization of Brands
Agenda

[3]
I. Competitive landscape
II. Sector dynamics
III. Rental vs. condominium
IV. eCommerce in Colombia
V. Globalization of Brands
Agenda

4
Parque Arauco has almost one million m², a 2% market participation in Latin America and a 8% market participation in the Andean Region
#5
456 392 143
5
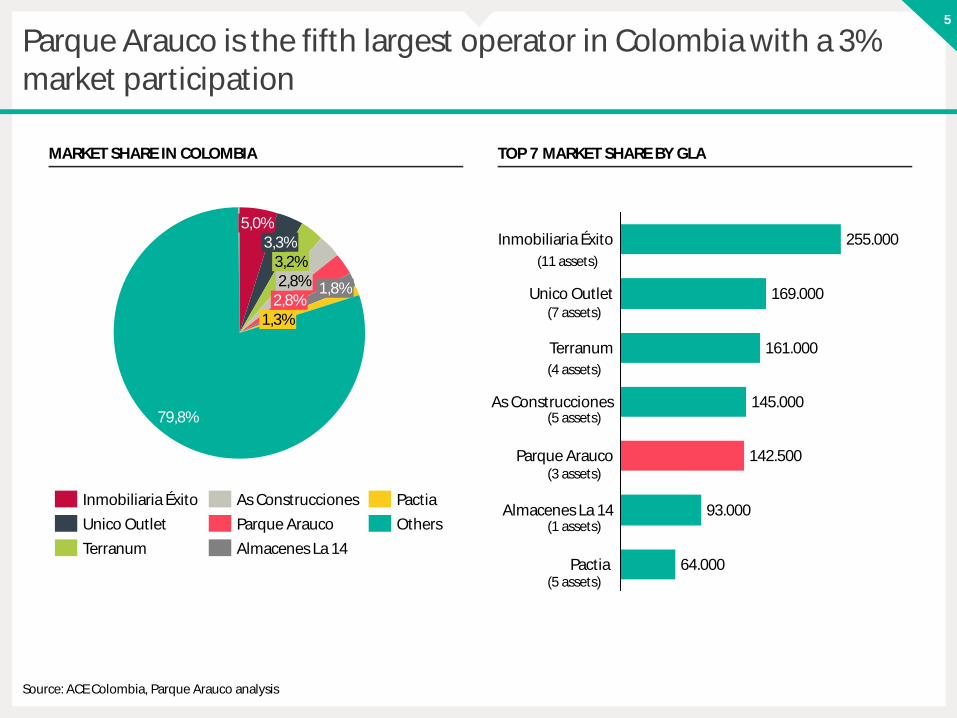
Parque Arauco is the fifth largest operator in Colombia with a 3% market participation
3,2%
2,8%2,8%
3,3%5,0%
79,8%
1,8%
1,3%
Parque Arauco
As ConstruccionesInmobiliaria Éxito
Terranum
Unico Outlet
Almacenes La 14
Others
Pactia
MARKET SHARE IN COLOMBIA
Terranum
Unico Outlet 169.000
145.000
161.000
Parque Arauco
255.000
142.500
As Construcciones
Inmobiliaria Éxito
Almacenes La 14
Pactia 64.000
93.000
TOP 7 MARKET SHARE BY GLA
Source: ACE Colombia, Parque Arauco analysis
(11 assets)
(7 assets)
(4 assets)
(5 assets)
(3 assets)
(1 assets)
(5 assets)

6
Parque Arauco has improved its market share in a fragmented market
2010 2011 2012 2013 2014 2015 2016
0,5
0,0
4,5
4,0
3,5
3,0
5,0
1,0
2,0
2,5
1,5
As Construcciones Pactia
Parque Arauco
Terranum
Unico Outlet Almacenes La 14
Inmobiliaria Éxito
HISTORICAL MARKET SHARE
Source: ACE Colombia, Parque Arauco analysis

7
In Colombia market share is diversified by type of mall
57,9%
14,5%
27,6%
36,7%
33,5%
29,8%
Medium ( 20,000-39,999)
Large (>40,000)
Small (5,000-19,999)
Source: ACE Colombia
NUMBER OF SHOPPING MALLS BY SIZE GLA BY TYPE OF MALL
Total # of shopping malls: 214
Total m2: 4,942,791

8
Colombia has international developers
Owner Parque Arauco Falabella Spectrum Grupo Roble
Country Chile Chile Guatemala El Salvador
Assets Parque Arboleda (Pereira)Parque Caracolí (Bucaramanga)Parque La Colina (Bogotá)
El Castillo (Cartagena)
Fontanar (Bogotá) MultiPlaza (Bogotá)
Projects Arauco PremiumOutlet Bogotá
ManizalesBarranquillaCalí
Medellín
GLA (m2)¹ 142,500 40,000 57,000 65,000
(1) Rental Model GLASource: ACE Colombia
Brand
9
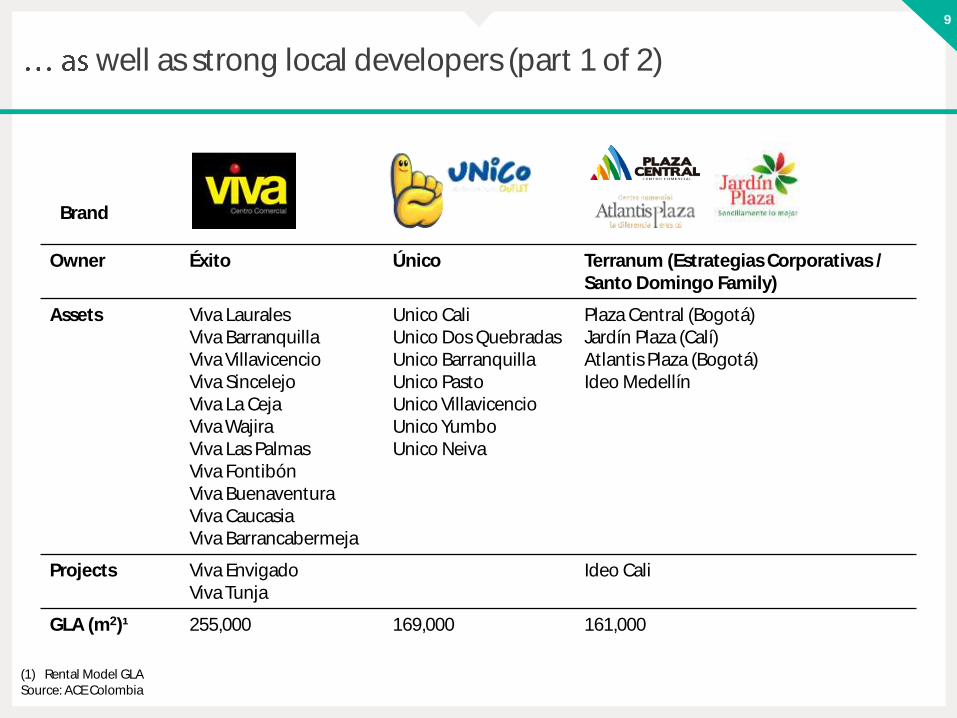
well as strong local developers (part 1 of 2)
Owner Éxito Único Terranum (Estrategias Corporativas / Santo Domingo Family)
Assets Viva LauralesViva BarranquillaViva VillavicencioViva SincelejoViva La CejaViva WajiraViva Las PalmasViva FontibónViva BuenaventuraViva CaucasiaViva Barrancabermeja
Unico CaliUnico Dos QuebradasUnico BarranquillaUnico PastoUnico VillavicencioUnico YumboUnico Neiva
Plaza Central (Bogotá)Jardín Plaza (Calí)Atlantis Plaza (Bogotá)Ideo Medellín
Projects Viva EnvigadoViva Tunja
Ideo Cali
GLA (m2)¹ 255,000 169,000 161,000
(1) Rental Model GLASource: ACE Colombia
Brand

10
well as strong local developers (part 2 of 2)
Owner As Construcciones Almacenes La 14 Pactia (Conconcreto / Grupo Argos)
Assets Buenavista BarranquillaBuenavista MonteriaBuenavista Santa MartaPanorama (Barranquilla)Americano (Barranquilla)
Calima Bogotá Gran Plaza SoledadGran Plaza PitalitoGran Plaza FlorenciaGran Plaza IpialesGran Plaza AntaresGran Plaza AlcaravánGran Plaza San AntonioGran Plaza del SolSan Pedro Plaza (Neiva)Guatapurí Plaza (Valledupar)
Projects Gran Plaza BosaGran Plaza El Ensueño
GLA (m2)¹ 145,000 93,000 64,000
(1) Rental Model GLASource: ACE Colombia
Brand

[11]
I. Competitive landscape
II. Sector dynamics
III. Rental vs. condominium
IV. eCommerce in Colombia
V. Globalization of Brands
Agenda

12
GLA in Colombia has been growing on average at 7% in the last 5 years
4.000
5.000
2.000
1.000
3.000
0
2013
+7%
201620152014
+7%
2011200920082007 20122010
214204198188166158152139133121
20162014
+7%
201220112010 2015
+6%
2013200920082007
Source: ACE Colombia
161.500199.030
20142012
437.779
20132010
168.680
322.482
2016
216.372
2011 2015
383.599
2009
318.622
95.666
268.965
2007 2008 2007 2008 2009 2010 2011 2012 2013 2014 2015 2016
12%
8%
4%5%
6%5%
11%10%
13%
3%
EVOLUTION OF GLA IN COLOMBIA(TH M2)
NUMBERS OF SHOPPING CENTERS IN COLOMBIA(#)
ANNUAL VARIATION OF GLA (M2)
ANNUAL GROWTH RATE (% CHANGE)

13
Shopping center sales have outpaced retail sales in Colombia
10.000
0
15.000
5.000
2013 2015 20162014
+11,6%
20122011
2011 2012 2013 2014 2015 2016
10,8%
18,9%19,8%
11,5%13,9%
3,6%
80.000
60.000
20.000
0
40.000
2015 2016
+6,1%
20142011 20132012
2011 2012 2013 2014 2015 2016
5,6%7,1%
16,9%
7,2%5,9%4,6%
Source: ACE Colombia / Raddar- Shopping Centerr Sales, Euromonitor- Retail Sales
RETAIL SALES (EUROMONITOR) (THUSD)
SHOPPING CENTER SALES (RADDAR/ACE COLOMBIA) (THUSD)
RETAIL SALES GROWTH (% CHANGE)
SHOPPING CENTER SALES GROWTH (% CHANGE)

14
Rental model malls are gaining market share in Colombia
75 73 69 68 67 65 61
11 11 13 13 13 1313
14 17 18 19 20 22 26
2013 20162011 2015201420122010
Mixed Model
Rental Model
Condominium
Source: ACE Colombia
Rental 553,321 698,015 778,021 910,887 1,007,585 1,145,744 1,469,668
Mixed 434,752 451,656 561,904 623,238 654,931 677,031 734,834
Condo. 2,964,218 2,997,357 2,982,415 3,260,016 3,375,411 3,385,153 3,448,067
Total 3,952,290 4,147,028 4,322,340 4,794,141 5,037,927 5,207,927 5,652,569
% OF GLA BY PROPERTY TYPE IN COLOMBIA

15
New malls opening are predominately rental model
6,0%
New development GLA
60,6%
33,4%
Rental Model
Mixed Model
Condominium
Source: ACE Colombia
% NEW GLA IN COLOMBIA BY PROPERTY TYPE (% OF TOTAL GLA)

[16]
I. Competitive landscape
II. Sector dynamics
III. Rental vs. condominium
IV. eCommerce in Colombia
V. Globalization of Brands
Agenda

17
Colombian shopping center industry is unique
• Sometimes operational standard (i.e. marketing efforts, cleaning and security, window display standard, etc.) is lower
• Operational standard (i.e. marketing efforts, cleaning and security, window display standard, etc.) is higher
Condominium Malls Rental Model Malls
Owner
Financing
Construction quality
Layout
Commercial Mix
Operational standard
Capex
Several owners buy stores; most of them are retailers, some of them are investors that sublease the store
• Single owner lease stores
• Construction is financed by pre-selling stores
• Construction is financed by issuing debt
• Sometimes construction materials and equipment are acquired thinking about short term
• Construction materials and equipment are acquired thinking about long term
• Sometimes layout is not optimum since construction companies minimize common areas in order to maximize area to be sold
• Layout is defined by single owner that think about the customer experience afterwards
• Sometimes commercial mix is not optimum since it is defined by maximizing money collected in selling process
• Commercial mix is defined by criteria of maximizing long term sales and revenues and tends to be optimum
• Sometimes agreeing on capex between 200 tenants can be challenging because of
Free Riders
• Single owner define capex (growth and/or maintenance capex) thinking about the long term
Source: Parque Arauco

18
Case Study Pereira: Rental Sales vs. Condominium Sales
0
10
20
30
40
50
60
70
80
2008 2009 2010 2011 2012 2013 2014 2015 2016
Condo. Mall 3
Condo. Mall 2Parque Arboleda
Condo. Mall 1
PEREIRA MALL SALES (USDMM)
Source: Raddar / Parque Arauco
[19]
I. Competitive landscape
II. Sector dynamics
III. Rental vs. condominium
IV. eCommerce in Colombia
V. Globalization of Brands
Agenda

20
Colombia has one of the lowest ecommerce penetrationsin the region
4,7%
Argentina
1,6%
4,0%
2,5%
United States
2,6%
United Kingdom
Mexico ChileBrazil PeruColombia
10,5%
14,9%
1,1%
Source: ICSC, Euromonitor
INTERNET RETAIL AS % OF TOTAL RETAIL IN 2016
21
CHILE
PERÚ
COLOMBIA
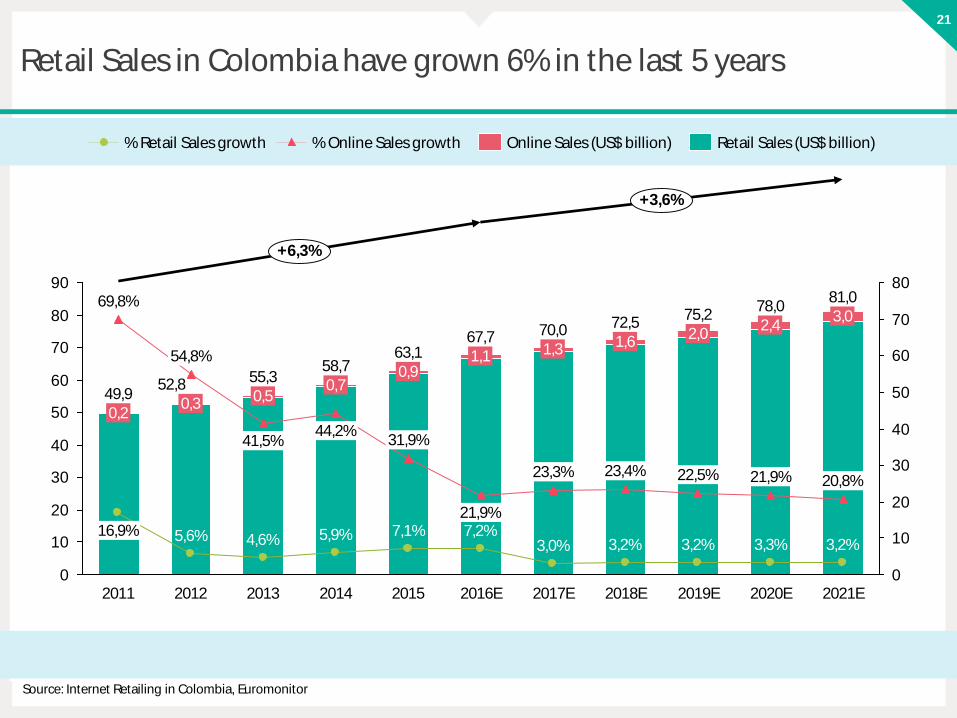
Retail Sales in Colombia have grown 6% in the last 5 years
0
10
20
30
40
50
60
70
80
90
0
10
20
30
40
50
60
70
80
22,5%
3,2%
20,8%
3,2%
2018E
78,02,4
21,9%
+6,3%
3,3%
2020E2019E
1,3
7,2%
44,2%
2013
63,1
23,3%
1,1
2015
7,1%3,0%
2014
21,9%
72,51,6
2017E
31,9%
67,7
58,7
23,4%
0,9
3,2%
70,0
2016E
0,7
5,9%
55,30,5
69,8%
41,5%
52,849,9
2012
4,6%
0,3
54,8%
2011
0,2
5,6%16,9%
2021E
75,22,0
+3,6%
81,03,0
% Online Sales growth% Retail Sales growth Retail Sales (US$ billion)Online Sales (US$ billion)
Source: Internet Retailing in Colombia, Euromonitor

22
Retail eCommerce concentration in Colombia is low
0,4%
Online Retail
Retail
99,6%
Online Retail
Retail
98,4%
1,6%
96,4%
Online Retail
3,6%
Retail
2011 2016E 2021E
Source: Internet Retailing in Colombia, Euromonitor
RETAIL SALES IN COLOMBIA

[23]
I. Competitive landscape
II. Sector dynamics
III. Rental vs. condominium
IV. eCommerce in Colombia
V. Globalization of Brands
Agenda

24
Colombia is still an underpenetrated market by global retailers
9%
Me
xico
19%
8%
Ch
ile
10%
14%
Pe
ru
Co
lom
bia
8%
Arg
en
tin
a
Bra
zil
Can
ada
UK
27%
32%
46%
USA
Source: Parque Arauco analysis Powers of Retailing by Deloitte
% OF TOP 100 LARGEST GLOBAL RETAILERS IN COUNTRY GLOBAL RETAILERS PRESENT IN COLOMBIA

25
La Colina has a higher penetration of global brandsthan its competitors in Bogotá
0
5
10
15
20
25
30
35
40
45
50 48%
Mall 5 Mall 6
12%
28%
23%
Mall 2
30%
Mall 1
12%
Mall 4
33%
Mall 3Parque La Colina
International Brand %
Source: Parque Arauco analysis of tenants in each mall
Parque La Colinadirect competitor
PENETRATION OF GLOBAL BRANDS IN BOGOTÁ MALLS (% OF TOTAL STORES)

26
Parque Arboleda has a higher penetration of global brandsthan its competitors
0
2
4
6
8
10
12
14
16
18
20
22
24
Mall 3
6%
Mall 2
9%
Mall 1
10%
23%
Parque Arboleda
International Brand %
Source: Parque Arauco analysis of tenants in each mall
PENETRATION OF GLOBAL BRANDS IN BOGOTÁ MALLS (% OF TOTAL STORES)

27
Parque Caracolí has a higher penetration of global brandsthan its competitors
0
5
10
15
20
25
Mall 2
8%
15%
Mall 3
18%
Mall 1Parque Caracolí
25% International Brand %
Source: Parque Arauco analysis of tenants in each mall
PENETRATION OF GLOBAL BRANDS IN BOGOTÁ MALLS (% OF TOTAL STORES)
[28]

Managing Parque La ColinaOctober 2017

[2]
I. Introduction Parque La Colina
II. Commercial mix
III. Parque La Colina teamresponsibilities
V. Parque La Colina marketing activities
VI. Sustainability at Parque La Colina
Agenda
Versión 16-10-2017 20:32

[3]
I. Introduction Parque La Colina
II. Commercial mix
III. Parque La Colina teamresponsibilities
V. Parque La Colina marketing activities
VI. Sustainability at Parque La Colina
Agenda

[4]
Parque La Colina
Source: Parque Arauco
PARQUE LA COLINA
• Total investment of US$ 221 million
• 63,000 m2 of GLA
• 199 stores
• Opening date: December 2016
• 13,262 m2 of park
• 2,900 m2 of vertical gardens
• 3,000 parking spots
• 235 bicycle parking spots
• First openings of H&M, Crate & Barrel and Purificación García in Colombia

5
Mall is located by Avenida Boyacá, an important transportation road in Bogotá
Source: Parque Arauco
6
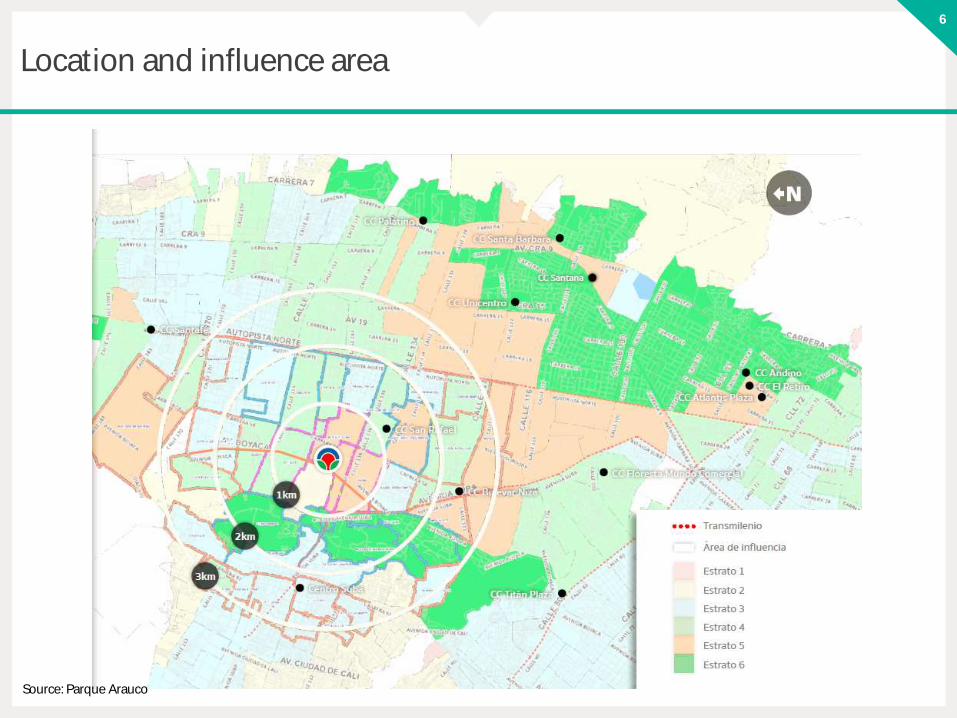
Location and influence area
Source: Parque Arauco

7
Influence area
41%
38%
3
4
5
18%
6
3%
6
2.584
5
1.803
1.195
43
2.133
Socio Economic Class Population HomesAverage Household
Income (USD)Clothing Spend
(USD)Recreational Spend
(USD)
3 197,027 62,999 1,195 251 117
4 117,720 50,707 1,803 481 187
5 62,857 25,853 2,133 563 223
6 13,022 4,113 2,584 721 299
HOMES BY SOCIOECONOMIC LEVEL AVERAGE INCOME BY HOME (USD)
Source: Parque Arauco

8
Consumer profile
HOME SIZE
1 2 3 49.11% 17.3% 29.46% 28.8%
5+15.33%
SEX OF
HEAD OF HOUSEHOLD
M F40.97% 59.03%
SEX OF MAIN
SHOPPERM F
6.15% 93.85%
Soure: EGM Ola III 2016 M +25 NSE 456 Bogotá
9
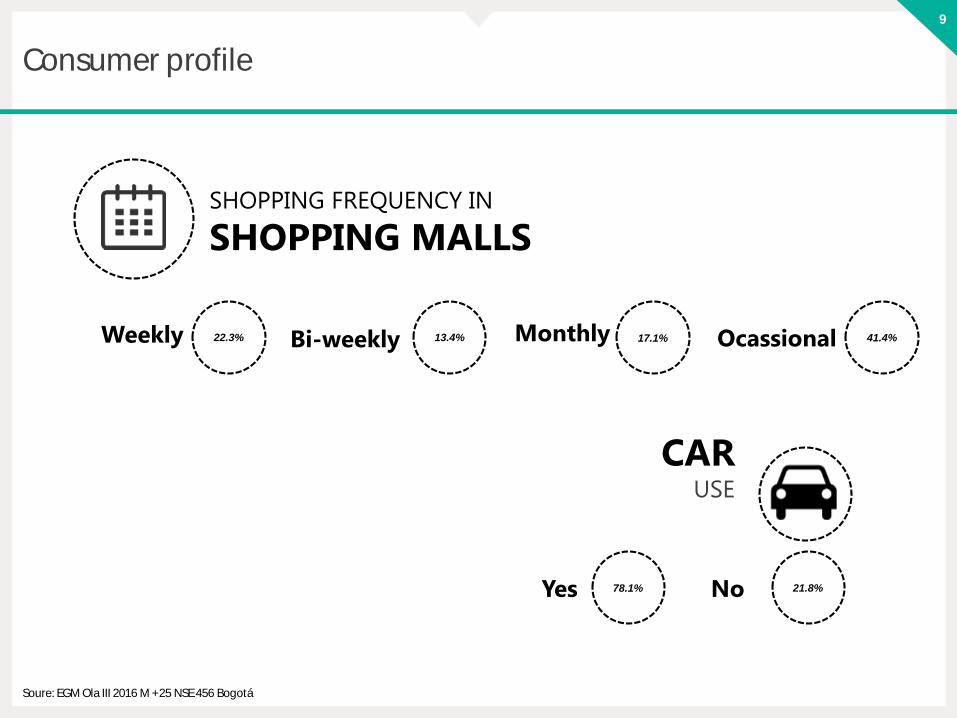
Consumer profile
Soure: EGM Ola III 2016 M +25 NSE 456 Bogotá
SHOPPING FREQUENCY IN
SHOPPING MALLS
OcassionalWeekly MonthlyBi-weekly 41.4%22.3% 17.1%13.4%
Yes No78.1% 21.8%
CARUSE

10
Consumer profile
Soure: EGM Ola III 2016 M +25 NSE 456 Bogotá
Women’s
ClothesLingerie
Women’s
ShoesBooks
Men’s
Clothes
Children’s
Clothes
Children’s
Shoes
Men’s
Shoes
Technology Bathing
Suits
81.2% 56.8% 54.6% 51.7%
48.3%
21.4%
35.6%
16.8%
34.9%30.0%
PURCHASES IN THE
LAST
3 MONTHS

11
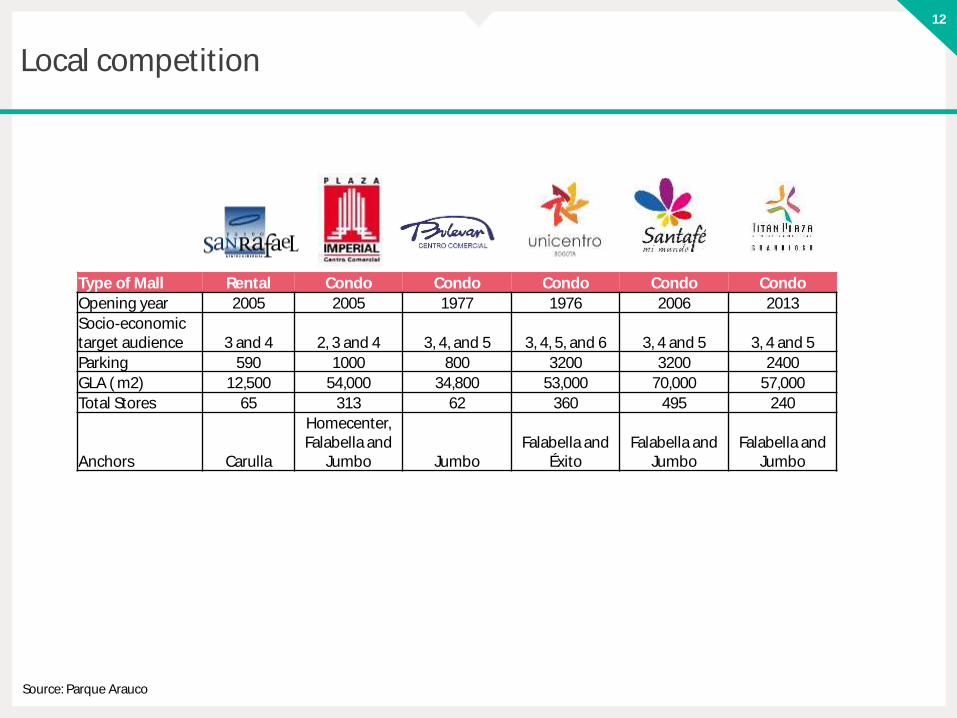
Local competition
• Local competition: 6 shopping centers are located in the North of Bogotá. Only three are within 4 km of Parque La Colina
Source: Parque Arauco
12
Local competition
Type of Mall Rental Condo Condo Condo Condo Condo
Opening year 2005 2005 1977 1976 2006 2013
Socio-economictarget audience 3 and 4 2, 3 and 4 3, 4, and 5 3, 4, 5, and 6 3, 4 and 5 3, 4 and 5
Parking 590 1000 800 3200 3200 2400
GLA ( m2) 12,500 54,000 34,800 53,000 70,000 57,000
Total Stores 65 313 62 360 495 240
Anchors Carulla
Homecenter, Falabella and
Jumbo JumboFalabella and
ÉxitoFalabella and
JumboFalabella and
Jumbo
Source: Parque Arauco

[13]
I. Introduction Parque La Colina
II. Commercial mix
III. Parque La Colina teamresponsibilities
V. Parque La Colina marketing activities
VI. Sustainability at Parque La Colina
Agenda

14
Commercial mix
1
2
5
5
16
17
25
28
Movie Theatre
Medium Sized Stores
Department Stores
Minor Stores
Small Sized Stores
Games
Restaurants
Food Court
GLA M² BY TYPE OF STORE BRANDS OPENING IN COLOMBIA IN PARQUE LA COLINA
Source: Parque Arauco

15
First floor layout
Source: Parque Arauco

16
Second floor layout
Source: Parque Arauco

17
Third floor layout
Source: Parque Arauco

18
La Colina has a higher penetration of global brands than itscompetitors in Bogotá
0
5
10
15
20
25
30
35
40
45
50 48%
Mall 5 Mall 6
12%
28%
23%
Mall 2
30%
Mall 1
12%
Mall 4
33%
Mall 3Parque La Colina
International Brand %
PENETRATION OF GLOBAL BRANDS IN BOGOTÁ MALLS (% OF TOTAL STORES)
Source: Parque Arauco analysis of tenants in each mall
Direct competition

19
Brands in Parque La Colina
Source: Parque Arauco

20
Brands in Parque La Colina
Source: Parque Arauco

21
I. Introduction Parque La Colina
II. Commercial mix
III. Parque La Colina teamresponsibilities
V. Parque La Colina marketing activities
VI. Sustainability at Parque La Colina
Agenda

22
Strategic Plan Parque La Colina
• Parque La Colina is the meeting placefor women and their circle of friends andfamily in the North of Bogota, with aninnovative and modern construction. The
objective is to provide a uniqueand different experience, guaranteeingsatisfactory service for the stylish womenwho visit the mall.
• This mall has unique brands that womenand their social, family and work circleswill want to go to.
Source: Parque Arauco

23
Target Consumer
Female
Socio-economic level 4 to 6
in the North of Bogotá
Over 25
Brand-conscious
Working
Wife, friend, coworker,
head of household
Stylish

24
Parque La Colina Strategic Pillars
Stra
teg
ic P
illar
s
1. Positioning & Client Loyalty
2. Visitor Experience
3. Optimized Commercial mix
4. Operational Excellence
Source: Parque Arauco

25
Center Manager
• Responsible for the results and general performance of the mall, which is measured
different areas in the team.
• Natural leader of the team actively involved in the development of the Strategic Plan for each of the functional areas of the mall.
• Responsible for measuring and providing periodic feedback to the teams regarding the compliance of each of the stages of the strategic plan and goals.
• Should have their own leadership style that allows the team to be motivated and meet their objectives.
Source: Parque Arauco

26
Center Manager Team
• Functional areas report to center manager: Different functional areas report to the Center Manager regarding the advances on the strategic plan.
Center Manager
Commercial Lead
Marketing Lead
Operations Lead
Administration and Finance
Lead
Source: Parque Arauco

27
Commercial Lead
• Responsible for maintaining effective communication between the shopping center tenants and the team. This is the main contact for all tenats in the shopping center.
•
• Responsible for the common areas of the shopping center.
• Reports to the shopping center Committee and the Center Manager regarding direct management and to the Divisional Commercial Area regarding the strategic plan as well as revenue versus budget.
• Supports retailers in the shopping center to manage tenant sales.
Source: Parque Arauco

28
Commercial Inputs
Center Manager
1° Commercial Input
Commercial results
2°Commercial Input
Current projects for tenants and kiosks
(next openings)
3° Commercial Input
Potential interested clients 4°Commercial
Input
Special requests (discounts, remodels,
branding etc.)
5° Commercial Input
Budget control
• The center manager should use this committee to make suggestions regarding the commercial mix.
• Responsible for revenues.• Challenges: tenants (window displays, other administrative challenges, etc.).
Source: Parque Arauco

29
Commercial Lead
Head of Commercial:
The head of commercial is responsible for maintaining and improving the mall revenues. This is the main contact person for all the mall tenants.
Source: Parque Arauco

30
Marketing Lead
• Responsible for implementing the annual marketing plan in the shopping center.
• Should ensure the proper implementation of events, sales and alliances which help position the mall.
• Responsible for generating necessary traffic so that the shopping center will have increased sales.
• Help in the management of tenant sales in the mall by accompanying the retailers in their implementation of a strategic plan.
• Responsible for client service, which results in managing incidents that occur in the shopping center. All incidents should be reported to the shopping center committee and dealt with according to the appropriate policy.
• Responsible for registering traffic and the types of clients that visit the mall, and communicating this to the team.
Source: Parque Arauco

31
Marketing Inputs
Center Manager
1°Marketing Input
Current campaign progress
2°Marketing Input
Future marketing campaigns
3°Marketing Input
Newsletters
4°Marketing Input
Special project advancement
(Loyalty plan tenant support plan- etc.)
5°Marketing Input
Budget control
• The center manager should use this committee to make suggestions regarding the marketing plan.
• Marketing is responsible for traffic in mall.• Challenges: attracting the correct client.
Source: Parque Arauco

32
Operations Lead
• Responsible for the proper functioning of the mall facilities, safety & security.
• Responsible for the implementation of maintenance plans (preventive and corrective).
• Responsible for the operation of shopping center services (security, cleaning, parking logistics, etc.).
• Responsible for monitoring special projects of new or current tenants.
• Responsible for the analysis, measurement and management of public services of the mall.
• Responsible for managing and keeping up mall permits.
• Responsible for maintaining excellent relationships with the authorities (police, fireman, Health Secretary, Environmental Agencies, Traffic Agencies, Local Government, etc.).
Source: Parque Arauco

33
Operations Inputs
Center Manager
1° Operations Input
Capex execution
2° Operations Input
Execution of maintenance
plans
3° Operations Input
Various incidents
4° Operations Input
Budget control
5° Operations Input
Safety & Security
• The center manager should use this committee to make suggestions regarding operating measures, including capex.
• Operations is responsible for operational excellence.• Challenge: maintenance of mall.
Source: Parque Arauco

34
Administration & Finance Lead
• Responsible for the billing and payment process for the entire mall.
• Responsible for managing the finance team and the timely reporting of tenant sales.
• Responsible for accuracy of mall info in SAP.
• Responsible for the reporting and analysis of sales, EBITDA trends, and CAPEX budget.
• Responsible for the general review and consolidation of the shopping center sales, revenues and expense annual budgets with input from all team members.
Source: Parque Arauco

35
Administration & Finance Inputs
Center Manager
1° Adm & Fin. Input
Budget control
2° Adm & Fin. Input
Collections
3° Adm & Fin. Input
Monthly results: sales, EBITDA- KPIs
4°Adm & Fin. Input
Billing
5° Adm & Fin. Input
Contract parametrization
SAP
• The center manager should use this committee to make suggestions regarding the administration and finance team.
• Admin. And finance is responsible for controlling the operation.• Challenges: meeting EBITDA budget (revenues and expense control).
Source: Parque Arauco

[36]
I. Introduction Parque La Colina
II. Commercial mix
III. Parque La Colina teamresponsibilities
V. Parque La Colina marketing activities
VI. Sustainability at Parque La Colina
Agenda

37
Example marketing campaigns
Source: Parque Arauco

38
Example marketing campaigns
Source: Parque Arauco

39
Example marketing campaigns
Source: Parque Arauco

[40]
I. Introduction Parque La Colina
II. Commercial mix
III. Parque La Colina teamresponsibilities
V. Parque La Colina marketing activities
VI. Sustainability at Parque La Colina
Agenda

41
Parque La Colina Sustainable Features
Source: Parque Arauco

42
Social Management Plan at Parque La Colina
From the very beginning of the construction process, we required Constructora Colpatria to include a Social Management Plan to handle neighbors' observations and inquiries in a timely manner. The 31-month plan (April 2014 to December 2016) included a permanent liaison for social issues, responsible for managing areas like: • Coordinating and implementing the Social Management
Plan.• Participating on social, socio environmental and/or technical
committees. • Attending to and monitoring permits.• Maintaining an ongoing relationship with the different
project areas.• Preparing presentations for scheduled community meetings.• Overseeing the community service point.• Drafting and sending informational memos.• Training project personnel.• Responding to and resolving citizen observations and
inquiries.• Taking part in community activities.
The following are highlights of the Social Management Plan: Information Program: This program included presentations on the project's characteristics and scope to neighboring communities. The Social Management Plan and mitigation measures were also presented.
• Community Service Program: This program formalized communication mechanisms and ensured appropriate and timely resolution of the inquiry response process.
• Disclosure Program: This program included an inventory of the properties adjacent to the spaces to be intervened. This program aimed to assess objectively and on a case-by-case basis any inconveniences that the construction could cause for neighboring lots. It also included publication of the procedure for escalating complaints as well as the established community information channels and provided updates on project characteristics and progress.
• Construction Personnel Training Program: This program provided general information about the project to construction personnel in order to alignthe Social Management Plan, criteria and community service channels.
Source: Parque Arauco
SOCIAL MANAGEMENT PLAN AT PARQUE LA COLINA

[43]

OrganizationalImprovementsOctober 2017

[2]Versión 10/16/2017 4:06 PM
I. Purpose, Mission and Values
II. Top Line Growth
III. Organizational Improvements
IV. Cost of Sales
V. Administration Expenses
VI. EBITDA Margin
VII. Conclusions
AGENDA

[3]
I. Purpose, Mission and Values
II. Top Line Growth
III. Organizational Improvements
IV. Cost of Sales
V. Administration Expenses
VI. EBITDA Margin
VII. Conclusions
Versión 10/16/2017 4:06 PM
AGENDA

4
Purpose, Mission and Values
5
I. Purpose, Mission and Values
II. Top Line Growth
III. Organizational Improvements
IV. Cost of Sales
V. Administration Expenses
VI. EBITDA Margin
VII. Conclusions
Versión 10/16/2017 4:06 PM
AGENDA

6
Revenues have grown importantly in all three countries
260233243
222191
163141
+13%+12%
LTM 2Q17
LTM 2Q16
20142012 2013 2015 2016
157145151
139124115104
20162015
+9%
LTM 2Q17
20132012 LTM 2Q16
+9%
2014
76737568
513632
+4%
LTM 2Q16
LTM 2Q17
+19%
201620152013 20142012
27
1517151612
5
20162012
+40%
LTM 2Q16
2014
+80,0%
LTM 2Q17
20152013
CONSOLIDATED REVENUES (USDM)¹¯² CHILE REVENUES (USDM) ¹¯²
PERU REVENUES (USDM) ² COLOMBIA REVENUES (USDM) ²
(1) 2012 numbers do not include Marina Arauco(2) Exchange rate as of June 30,2017 1USD= 660.05Source: Parque Arauco

7
Fixed, variable and parking revenues have contributed to consolidated revenue growth
260233243
222191
163132
2016
+12%
2014 2015
+14%
LTM 2Q17
LTM 2Q16
20132012
32293029
262520
2016
+10%
LTM 2Q17
LTM 2Q16
+10%
2014 201520132012
189168175159
138115
94
20132012
+12%+15%
LTM 2Q16
20162015 LTM 2Q17
2014
14 20 24 23 25
10
1110
898
77
38
2015
26
2016
5
LTM 2Q16
36
20142013
5533
553
2012
18
5
23
11%
LTM 2Q17
405
+17%
Energy OtherParking
(1) 2012 numbers do not include Marina Arauco(2) Exchange rate as of June 30,2017 1USD= 660.05Source: Parque Arauco
CONSOLIDATED REVENUES (USDM)¹¯² FIXED REVENUES (USDM)
VARIABLE REVENUES (USDM) OTHER REVENUES (USDM)

8
Parque revenue stream is stable
71% 71% 73% 72% 72%
15% 15% 13% 13% 12%
7% 7% 8% 9% 10% 10% 10%
73%72%
12%13%
2%
LTM 2Q17
4%2%2%4%
20162015
4%
LTM 2Q16
4%2%
2014
3%4%
3%
2013
4%2%
2012
4%
Variable Rent Energy OthersParkingFixed Rent
CONSOLIDATED REVENUES
Source: Parque Arauco

[9]
I. Purpose, Mission and Values
II. Top Line Growth
III. Organizational Improvements
IV. Cost of Sales
V. Administration Expenses
VI. EBITDA Margin
VII. Conclusions
Versión 10/16/2017 4:06 PM
AGENDA

10
Sustainability
Source: Parque Arauco

11
Safety and Security
Current state
evaluation
Understand future state
Transition plan
Implement changes
Maintain changes
First evaluation stage Second implementation stage
Safe
ty a
nd
Se
curi
ty C
ult
ure
at
Par
qu
e A
rau
co
People and process safety & security
analysisSite visit
Fundamental safety & security element
diagnosticVAC surveys
Change disposition interviews
Executive interviews
Divisional findings
presentation
Strategic alignment workshop
Diagnostic report
Implement critical safety & security
elements
6 months
Progress review
Today
Source: Parque Arauco / DuPont

12
Process and Center of Excelence
• We have identified 4 macro process• We have identified 341 process
Source: Parque Arauco

13
Talent in Parque Arauco
• We have worked to improve the quality of professionals in our organization.
Source: Parque Arauco

14
Share Services Center
• We have been incorporating talent to this area• We moved from a single team to 3 different ones
• Procurement and Payments• We have been working on procurement discipline• VIM improvements
• Billing• We have been reducing the number of billing cycles• We have been reducing manual billing• Country by country billing
• Treasury • Reducing payments with checks• Controlling payment rules.
• Now we are reviewing robotic process automatization• Reporting to divisions
Source: Parque Arauco

15
Technology and Innovation
• Infrastructure• Wi Fi• Systems monitoring• Telephone system improvements (4 technologies)• Meeting rooms• Access systems• Clients counting systems
• Innovation / automatization• Partnership with Accenture
• ERP sophistication• Revenue management • Technology in Mall operations• Technology in Mall construction
Source: Parque Arauco

16
Trade off
• Talent• Saftey & security• Improved quality
• Economies of scale• Standardized processes• Better controls
Higher cost
Lower cost
Source: Parque Arauco

17
I. Purpose, Mission and Values
II. Top Line Growth
III. Organizational Improvements
IV. Cost of Sales
V. Administration Expenses
VI. EBITDA Margin
VII. Conclusions
Versión 10/16/2017 4:06 PM
AGENDA

18
Consolidated gross margin is mainly flat in LTM 2Q17
23%21%
2012 2013
23%
2014
21%
LTM 2Q16
23%
2016
24%
LTM 2Q17
23%
2015
595457
5143
3430
LTM 2Q17
LTM 2Q16
+9%+15%
2016201420132012 2015
78,9% 76,6%76,5%76,9%77,3%79,2%
201620152014 LTM 2Q16
20132012
77,1%
LTM 2Q17
260233243222
191163
132
+14%
20142013 LTM 2Q16
2016
+12%
LTM 2Q17
20152012
(1) 2012 numbers do not include Marina Arauco(2) Exchange rate as of June 30,2017 1USD= 660.05Source: Parque Arauco
CONSOLIDATED REVENUES (USDM)¹¯² COST OF SALES (USDM) ²
COST OF SALES (% REVENUES) GROSS MARGIN (%)
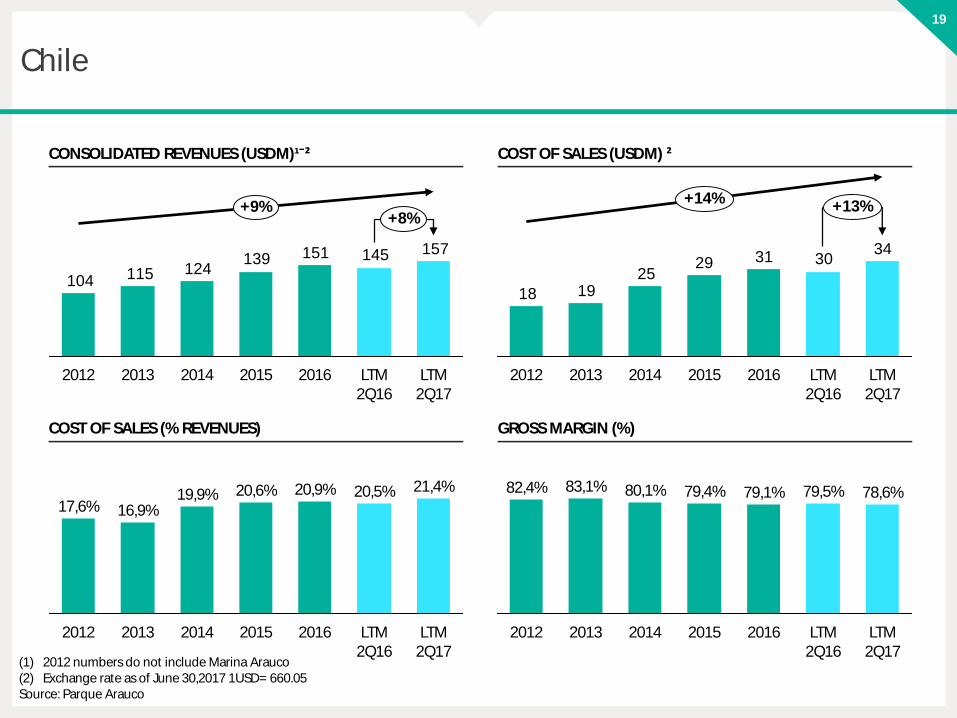
19
Chile
157145151139124115104
2012
+9%+8%
LTM 2Q17
LTM 2Q16
201620152013 2014
20,9%20,6%
201620152012
17,6%
LTM 2Q17
LTM 2Q16
21,4%20,5%
20142013
19,9%16,9%
34303129
251918
20132012 20152014 2016
+13%+14%
LTM 2Q17
LTM 2Q16
79,5%
2016
82,4%
LTM 2Q16
78,6%
LTM 2Q17
2013
83,1%
2012
79,1%80,1%
2015
79,4%
2014
(1) 2012 numbers do not include Marina Arauco(2) Exchange rate as of June 30,2017 1USD= 660.05Source: Parque Arauco
CONSOLIDATED REVENUES (USDM)¹¯² COST OF SALES (USDM) ²
COST OF SALES (% REVENUES) GROSS MARGIN (%)

20
Peru
76737568
513632
+4%+19%
201620142013 20152012 LTM 2Q16
LTM 2Q17
25,3%
2015
25,6%
2016
25,2% 24,3%
20142013
28,7%
LTM 2Q16
2012
27,6%
LTM 2Q17
24,8%
19181917
1310
9
20142012 2013
+4%+16%
LTM 2Q16
2015 2016 LTM 2Q17
LTM 2Q17
75,7%
2016 LTM 2Q16
74,4%74,8%72,4%
20152012
74,7%71,3%
20142013
75,2%
CONSOLIDATED REVENUES (USDM)¹ COST OF SALES (USDM) ¹
COST OF SALES (% REVENUES) GROSS MARGIN (%)
(1) Exchange rate as of June 30,2017 1USD= 660.05Source: Parque Arauco
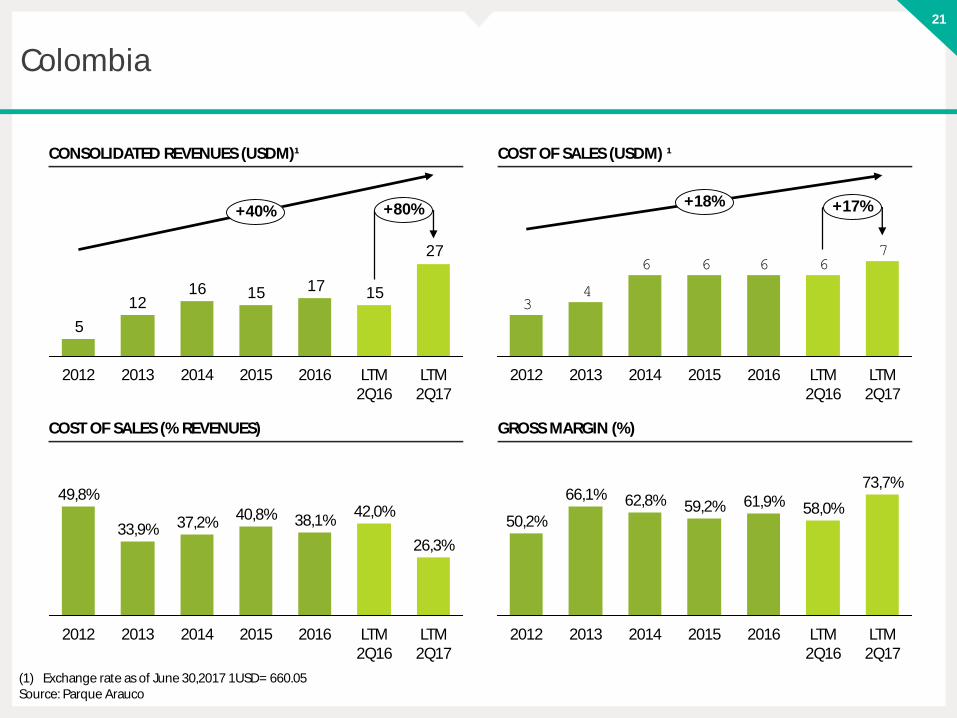
21
Colombia
27
1517151612
5
LTM 2Q16
2014
+80%+40%
20132012 20162015 LTM 2Q17
49,8%
2015
37,2% 38,1%42,0%
2012 2013 2016
33,9%40,8%
2014 LTM 2Q17
26,3%
LTM 2Q16
76666
43
2015
+18%
LTM 2Q17
LTM 2Q16
201620142013
+17%
2012
66,1%
2012
62,8%
2013
50,2%
LTM 2Q17
73,7%
LTM 2Q16
58,0%
2016
61,9%
2015
59,2%
2014
CONSOLIDATED REVENUES (USDM)¹ COST OF SALES (USDM) ¹
COST OF SALES (% REVENUES) GROSS MARGIN (%)
(1) Exchange rate as of June 30,2017 1USD= 660.05Source: Parque Arauco

22
Cost of sales efficiency measures
• Bidding Process Improvement• Competitive bidding process• SLA definitions
• Standardized maintenance model across all three countries• Establish standardized maintenance model• First focus on vertical transportation, climate, and facility management
• Economies of scale • Opening of La Colina with same sized administration• Arauco Coronel is managed by Arauco Chillán team
• Professionalization of Shared Service Center• Improved roles, responsibilities and processes
• Energy efficiency projects• Renegotiation of energy contracts in Chile• Solar panels in Parque Lambramani
Source: Parque Arauco
Maintenance, Cleaning and Security
Personnel
Energy
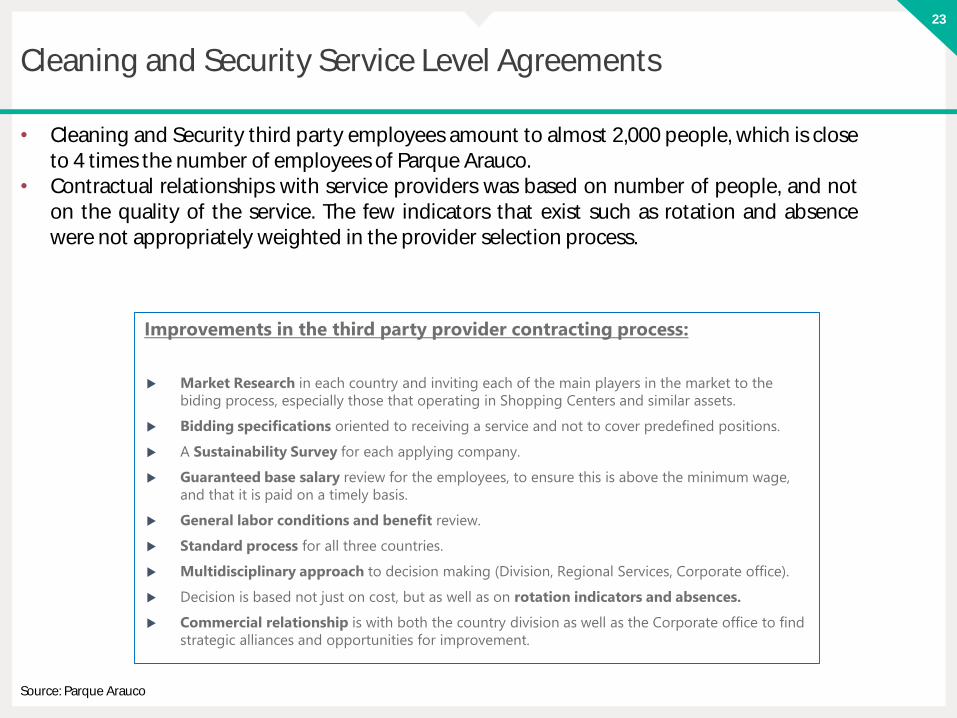
23
Cleaning and Security Service Level Agreements
Improvements in the third party provider contracting process:
Market Research in each country and inviting each of the main players in the market to the
biding process, especially those that operating in Shopping Centers and similar assets.
Bidding specifications oriented to receiving a service and not to cover predefined positions.
A Sustainability Survey for each applying company.
Guaranteed base salary review for the employees, to ensure this is above the minimum wage,
and that it is paid on a timely basis.
General labor conditions and benefit review.
Standard process for all three countries.
Multidisciplinary approach to decision making (Division, Regional Services, Corporate office).
Decision is based not just on cost, but as well as on rotation indicators and absences.
Commercial relationship is with both the country division as well as the Corporate office to find
strategic alliances and opportunities for improvement.
• Cleaning and Security third party employees amount to almost 2,000 people, which is closeto 4 times the number of employees of Parque Arauco.
• Contractual relationships with service providers was based on number of people, and noton the quality of the service. The few indicators that exist such as rotation and absencewere not appropriately weighted in the provider selection process.
Source: Parque Arauco

24
Maintenance Strategy Project
• We are working with an external consultant to help us develop a best in class maintenancemodel.
Maintenance Model Methodology
• Define an agreed upon scalable maintenance model for all of
assets
Maintenance model for critical processes
• Maintenance model definition for critical processes
Infrastructure and Service org. structure
• Define an agreed upon scalable maintenance model for all of
assets
Improvement opportunity identification
• Improve reliability and quality of information related to asset maitenance
Source: Parque Arauco / Matrix
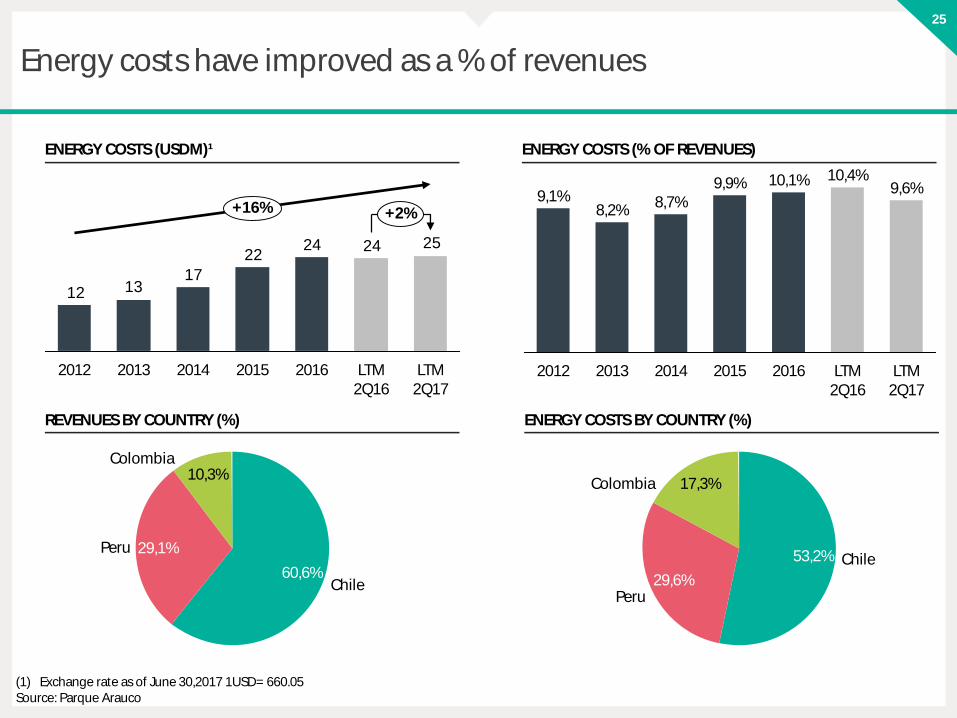
25
Energy costs have improved as a % of revenues
LTM 2Q17
9,6%
LTM 2Q16
10,4%
20162014
8,7%8,2%
2012
9,9% 10,1%
2015
9,1%
2013
25242422
171312
LTM 2Q16
LTM 2Q17
2014
+16%
2013 2016
+2%
20152012
10,3%
29,1%
Colombia
Peru
Chile60,6%
Chile
Peru
Colombia
29,6%
53,2%
17,3%
ENERGY COSTS (USDM)¹
(1) Exchange rate as of June 30,2017 1USD= 660.05Source: Parque Arauco
ENERGY COSTS (% OF REVENUES)
REVENUES BY COUNTRY (%) ENERGY COSTS BY COUNTRY (%)

26
Corporate environmental management plan
Base line diagnostic
Identification of gaps and
opportunities
KPIs and goals
Evaluation and follow
up
Corporate environmental management procedures.Efficiency committees in Chile, Peru and Colombia.
1 2 3 4
Source: Parque Arauco

27
I. Purpose, Mission and Values
II. Top Line Growth
III. Organizational Improvements
IV. Cost of Sales
V. Administration Expenses
VI. EBITDA Margin
VII. Conclusions
Versión 10/16/2017 4:06 PM
AGENDA

28
Admin. Expenses have decreased importantly
260233243
222191
163141
2012
+12%
LTM 2Q16
+13%
LTM 2Q17
20162013 2014 2015
10,0%
2012
9,7%
2015
10,2%
2014
12,2%12,4%
2013
9,4%9,9%
LTM 2Q17
2016 LTM 2Q16
242324232320
15
+10%
LTM 2Q17
+7%
LTM 2Q16
201620132012 2014 2015
LTM 2Q17
87,8%
2015
89,8%
2016
90,3%
2014
90,6%
20132012
90,1%
LTM 2Q16
87,6%90,0%
(1) 2012 numbers do not include Marina Arauco(2) Exchange rate as of June 30,2017 1USD= 660.05
CONSOLIDATED REVENUES (USDM) 1,2 ADMINISTRATIVE EXPENSES (USDM) 1,2
ADMINISTRATIVE EXPENSES (% OF REVENUES) ADMINISTRATIVE EXPENSES MARGIN (% OF REV) 1,2,3
(3) Admin exp. margin= (revenues-SGA)/ revenuesSource: Parque Arauco

29
Chilean admin. expenses have improved over time
157145151139124115104
LTM 2Q17
+8%+9%
2015 LTM 2Q16
201620132012 2014
8,1% 7,8%
2016 LTM 2Q17
2015
8,7%7,8% 7,6%
LTM 2Q16
2014
10,6%
2013
10,8%
2012
121112111312
9
2012 20142013
+5%+6%
LTM 2Q17
2015 LTM 2Q16
2016
91,9% 92,2% 92,4%89,4%
2012 LTM 2Q16
LTM 2Q17
20152014
92,2%
2016
91,3% 89,2%
2013
CONSOLIDATED REVENUES (USDM) 1 ADMINISTRATIVE EXPENSES (USDM) 1
ADMINISTRATIVE EXPENSES (% OF REVENUES) ADMINISTRATIVE EXPENSES MARGIN (% OF REV) 1,2
(1) Exchange rate as of June 30,2017 1USD= 660.05(2) Admin exp. margin= (revenues-SGA)/ revenues Source: Parque Arauco
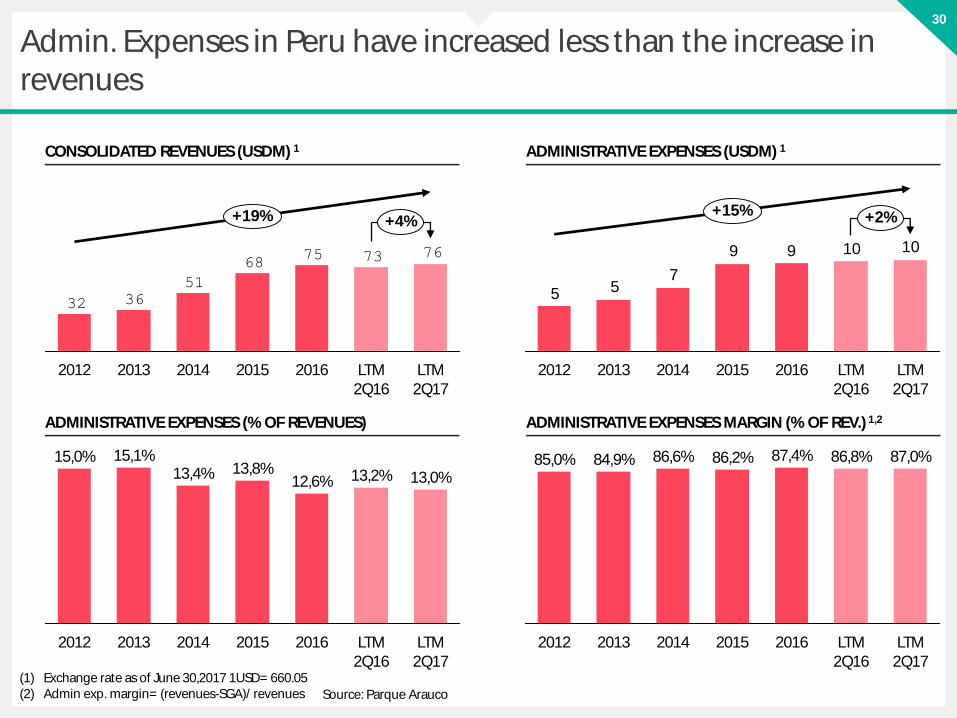
30
Admin. Expenses in Peru have increased less than the increase in revenues
76737568
51
3632
+19%
LTM 2Q16
LTM 2Q17
+4%
201520132012 2014 2016
15,0%13,4%
LTM 2Q16
12,6%
15,1%
20162013 2014 2015
13,2%
LTM 2Q17
2012
13,8%13,0%
101099
755
LTM 2Q17
2012
+15%
2016
+2%
201520142013 LTM 2Q16
87,4%86,2%
2014 2015
86,6%
2013
84,9%
2016
86,8%85,0%
2012 LTM 2Q17
87,0%
LTM 2Q16
CONSOLIDATED REVENUES (USDM) 1 ADMINISTRATIVE EXPENSES (USDM) 1
ADMINISTRATIVE EXPENSES (% OF REVENUES) ADMINISTRATIVE EXPENSES MARGIN (% OF REV.) 1,2
(1) Exchange rate as of June 30,2017 1USD= 660.05(2) Admin exp. margin= (revenues-SGA)/ revenues Source: Parque Arauco
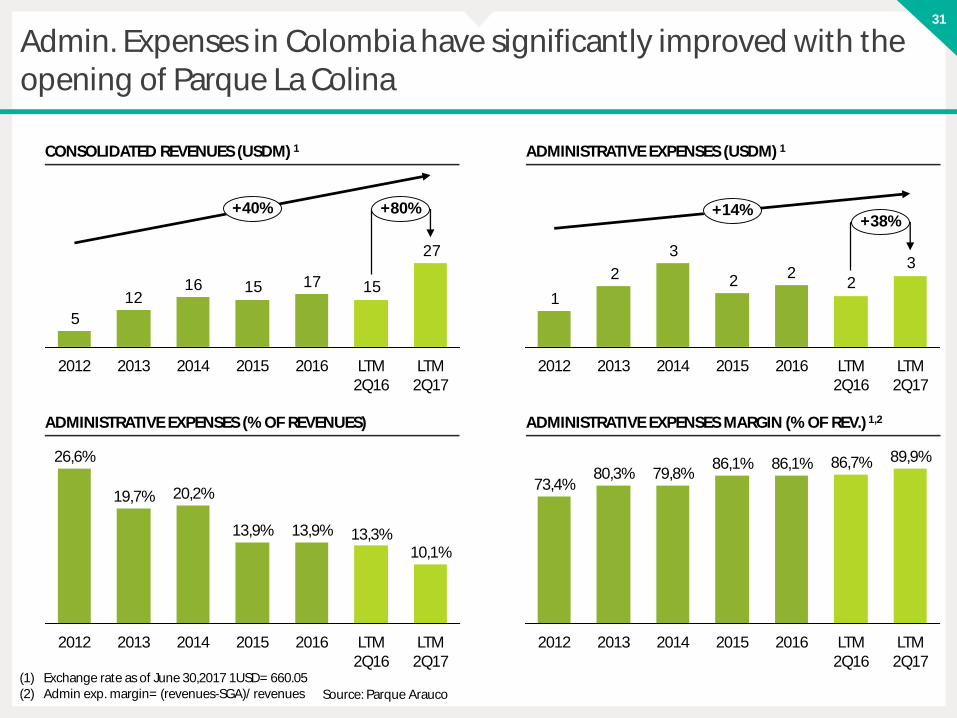
31
27
1517151612
5
+80%
LTM 2Q17
LTM 2Q16
+40%
2012 20162014 20152013
LTM 2Q17
LTM 2Q16
13,3%
2016
10,1%
13,9%
2013 2015
26,6%
2012
13,9%
20,2%19,7%
2014
3
22
2
3
2
1
2012 LTM 2Q16
201620152014 LTM 2Q17
2013
+14%+38%
73,4%
20162015
86,1%79,8%
2013 2014
80,3%
2012 LTM 2Q17
89,9%
LTM 2Q16
86,7%86,1%
CONSOLIDATED REVENUES (USDM) 1 ADMINISTRATIVE EXPENSES (USDM) 1
ADMINISTRATIVE EXPENSES (% OF REVENUES) ADMINISTRATIVE EXPENSES MARGIN (% OF REV.) 1,2
Admin. Expenses in Colombia have significantly improved with the opening of Parque La Colina
(1) Exchange rate as of June 30,2017 1USD= 660.05(2) Admin exp. margin= (revenues-SGA)/ revenues Source: Parque Arauco

32
Professional fees have maintained stable
3,0%
LTM 2Q16
3,3%3,1%
2016
3,2%
2015
3,0%
3,7%
20132012 2014
2,7%
LTM 2Q17
87877
5
4
LTM 2Q17
+17% +7%
LTM 2Q16
2016201520142012 2013
Chile
29,1%
10,3%
Peru
60,6%
Colombia6,5%
Colombia
Peru 32,3%
Chile61,2%
PROFESSIONAL FEES (USDM) 1,2 PROFESSIONAL FEES (% OF REVENUES) 1
REVENUES BY COUNTRY (%) PROFESSIONAL FEES BY COUNTRY (%)
(1) 2012 numbers do not include Marina Arauco(2) Exchange rate as of June 30,2017 1USD= 660.05 Source: Parque Arauco

33
Insurance costs have gone down
1,6%
LTM 2Q17
2012
2,5%
20152014
2,3%2,5%
2,1%
1,8%
LTM 2Q16
2016
1,6%
2013
4445
443
2013 20152014
+4%-1%
2012 LTM 2Q16
2016 LTM 2Q17
Colombia
29,1%
10,3%
Chile
Peru
60,6%
Colombia
64,3%
17,9%
Peru 17,8%
Chile
(1) 2012 numbers do not include Marina Arauco(2) Exchange rate as of June 30,2017 1USD= 660.05 Source: Parque Arauco
INSURANCE COST (USDM) 1,2 INSURANCE COST (% OF REVENUES) 1
REVENUES BY COUNTRY (%) INSURANCE COST BY COUNTRY (%)

34
Improvements in Cost of Sales and Admin. Expenses has improved the EBITDA margin
260233243222
191163
141
+12%+13%
LTM 2Q17
LTM 2Q16
20142013 20162012 2015
0,25
0,15
0,00
0,20
2013 LTM 2Q16
201620152014 LTM 2Q17
2012
30 34 43 51 57 54 5915 20
2323 24 23 24
2012
45
+13%
83
LTM 2Q16
77
+8%
LTM 2Q17
74
2014
66
20152013 2016
81
54
LTM 2Q17
70,0%
LTM 2Q16
68,8%
2016
69,0%69,4%
2015
68,0%69,9%
2013
68,8%
20142012
COGS
SG&A
(1) 2012 numbers do not include Marina Arauco(2) Exchange rate as of June 30,2017 1USD= 660.05 Source: Parque Arauco
CONSOLIDATED REVENUES (USDM) 1,2 COST OF GOODS SOLD + ADMIN. EXPENSES (USDM) 1
COST OF GOODS SOLD + ADMIN. EXPENSES (% REVENUES) EBITDA MARGIN (% REVENUES)

35
I. Purpose, Mission and Values
II. Top Line Growth
III. Organizational Improvements
IV. Cost of Sales
V. Administration Expenses
VI. EBITDA Margin
VII. Conclusions
Versión 10/16/2017 4:06 PM
AGENDA

36
Improvements in the Colombian and Peruvian EBITDA margins have improved the corporate EBITDA margin
70,0%69,0%
LTM 2Q17
2012 LTM 2Q16
2016
68,8%
2015
68,8%
2014
68,0%
2013
69,4%69,9%
2015 2016
50,0%46,4%
2014
43,9%
2013
46,9%
2012
24,1%
64,9%
LTM 2Q16
LTM 2Q17
45,7%
63,2%
2015
58,8%63,7%
2012 2016
63,5%60,2%
20142013
64,5%
LTM 2Q17
65,6%
LTM 2Q16
2016 LTM 2Q17
73,7%72,7%
2013
73,0%
LTM 2Q16
73,9%73,4%
201520142012
75,0%73,6%
CHILE EBITDA MARGIN PERU EBITDA MARGIN
COLOMBIA EBITDA MARGIN CORPORATE EBITDA MARGIN1
(1) 2012 numbers do not include Marina AraucoSource: Parque Arauco
37
I. Purpose, Mission and Values
II. Top Line Growth
III. Organizational Improvements
IV. Cost of Sales
V. Administration Expenses
VI. EBITDA Margin
VII. Conclusions
Versión 10/16/2017 4:06 PM
AGENDA
38
Conclusions
• There is no silver bullet.• We have been able to implement an aggressive
improvement plan without affecting the efficiency of the company.
Source: Parque Arauco

[39]

Mixed Use Rationale for MallsOctober 2017

[2]
I. Real Estate Types and Diversification
II. Growth opportunity analysis for Parque Arauco
III. Mixed use in Parque Arauco
IV. Parque Arboleda Office Tower
Agenda

3
% (US$ Billion)
In developed markets, like the USA, the real estate pie includesother type of real estate assets that are still small in Latin America
201
96
111
177
846
111
TotalSelf Storage
OfficesRetailIndustrial Hotel
55
Health Other
45
Residential
50
USA
• In the USA, the Real Estate Sector has a market cap of US$ 846 billion.
• In the USA there are two types of real estate that are not retail that make up 79% of the market, and which include offices, residential, health, hotel and industrial, among others.
• In Latin America, only 30% of the market is made up of real estate that is not retail.
13% 6% 7% 21% 13% 5% 11% 24%
x%Weight over total
Source: Green Street for size of USA market; Parque Arauco for Latin American market, from the main 17 real estate companies that trade in the region, including Parque Arauco.
LatinAmerica
24
17
4
Total
0
OthersResidential
1
Industrial Self Storage
Health
2
OfficesHotel Retail
0% 17% 3% 70% 9% 0% 0% 1%
MARKET CAP

4
Approximately a third of the real estate companies in the world are diversified
% of market cap(# of companies)
Source: FTSE Real Estate Global Index
5,0%
Industrial
Retail
10,7% HotelResidential
Self Storage
Diversified
Health
Offices
3,1%
13,0%
1,8%
6,7%
Industrial / Offices
3,9%
31,7%
24,2%
#192
#18
#19
#53
#25
#10
#60
#80
#6
TYPE OF REAL ESTATE COMPANIES IN THE FTSE REAL ESTATE GLOBAL INDEX

[5]
I. Real Estate Types and Diversification
II. Growth opportunity analysis for Parque Arauco
III. Mixed use in Parque Arauco
IV. Parque Arboleda Office Tower
Agenda

6
Rationale for entering into new sectors
• Each property type has its own operational complexities and risk profile. Retail is on the complex side of the spectrum, and therefore we believe we can learn to manage other simpler property types
• In some property types that are too complex such as the lodging sector, operations are usually separatedfrom the landlord
• Some property types offer synergies to the Company's retail portfolio
• For example, hotel properties can drive traffic to the Company's malls
• Most property types have similar economic drivers than retail real estate
• One exception is lodging real estate, which has very different economics than retail real estate
• Parque Arauco has 58% and 19% of its total NOI in Santiago and Lima, respectively
• Strong knowledge in its core markets may provide the Company with strategic opportunities in otherproperty types
• Pursuing mixed-use projects is a way of improving the profitability of existing assets
• Mixed use projects also allow the company to develop projects in consolidated urban areas thatotherwise could not be developed only with retail real estate because they do not meet the requiredreturn rates
Source: Green Street Advisors
RATIONALE FOR ENTERING INTO NEW SECTORS
ClientSynergies
EconomicDrivers
MarketSpecialist
Vertical Growth
OperationComplexity

7
Operations
Residential
Industrial
Hotel
Retail
Offices
Self Storage
Health
Yes
Depends
No
Yes
Yes
Yes
Depends
• The operational complexity of each
type of real estate is different.
• Depending on the type of real estate,
the Company should decide whether
or not to externalize the operation.
• In hotel real estate, normally the
owner of the asset does not operate
the hotel.
Source: Parque Arauco
THE COMPLEXITY AND OPERATIONAL RISK ARE DIFFERENT FOR EACH TYPE
OF REAL ESTATE
Type of Real Estate Does real estate company operate asset?

8
Residential
Industrial
Hotel
Offices
Self Storage
Health
• Client synergies: Some types of real
estate have synergies with retail real
estate.
• The types of real estate that have the
most synergies in terms of traffic are
hotel, health and offices.
Source: Parque Arauco
Very HighMediumLowNon-existent High
Type of Real estate Final client amount of synergies

9
Residential
Industrial
Hotel
Offices
Self Storage
Health
P
P
O
P
P
P
• The majority of other types of real estate
have economic and financial drivers that
are similar to retail real estate.
• In general, other types of real estate have
similar drivers, especially if the operation is
externalized.
• An exception to this is hotel real estate
which has higher volatility due to the
shorter duration of contracts.
Source: Parque Arauco
Type of Real Estate Similar drivers?

10
Implicit cap rate in other real estate transactions
7,3% 7,2%7,8%
Suburban Office
Neighborhood Malls
6,7%
4,5%
High Street Retail
Industrial
6,7%
Central Business District Office
Power Centers
Source: CBRE North America Cap Rate Survey 1H 2017.
AVERAGE STABILIZED PROPERTY ACQUISITION CAP RATES FOR 1H 2017 IN USA

11
Santiago¹: 53% del NOI de Parque Arauco
Lima¹: 18% del NOIde Parque Arauco
(1) Santiago represents 78% of Chile NOI, and Lima represents 65% of Peru NOI. Source: Parque Arauco
• Concentration: Parque Arauco is concentrated in Santiago and Lima, which makes us a in the cities, whichcould help with new types of real estate in these locations.

12
• Successful malls in developed countries are located in cities, not outside the
cities.
• These locations have expensive land and the return rates on retail projects can
not be built high enough to be profitable
• In order to have the return rates we require, and have successful malls, we must
build vertically.
• Mixed use is inevitable in older projects (Kennedy) and is necessary in new
projects.
Parque Arauco Kennedy- 1983 Parque Arauco Kennedy- 2016
Source: Parque Arauco

13
Vertical Growth Example
• Parque Arauco Kennedy is surrounded by tall buildings• Residential Real Estate• Offices• Hotels
• Retail real estate only Works up to a certain height • Considering this, it is natural that Parque Arauco participate in mixed use.
Source: Green Street Advisors
• Mixed Use: If Parque Arauco wants to continue having malls in high density areas, it should have mixed use projects.
Parque Arauco Kennedy Mixed Use

[14]
I. Real Estate Types and Diversification
II. Growth opportunity analysis for Parque Arauco
III. Mixed use in Parque Arauco
IV. Parque Arboleda Office Tower
Agenda
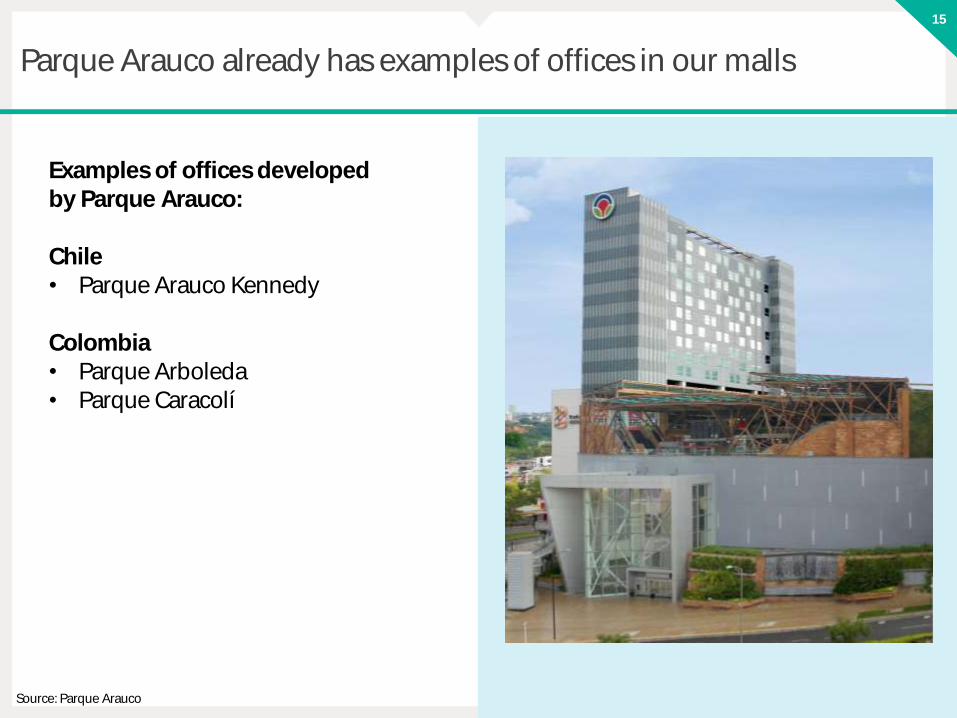
15
Parque Arauco already has examples of offices in our malls
Examples of offices developedby Parque Arauco:
Chile• Parque Arauco Kennedy
Colombia• Parque Arboleda• Parque Caracolí
Source: Parque Arauco

16
Parque Arauco already has examples of clinics in our malls
Examples of clinics developed by Parque Arauco:
Chile• Parque Arauco Kennedy• Arauco Quilicura
Peru• MegaPlaza Norte
Source: Parque Arauco

17
Parque Arauco already has examples of hotels in our malls
Examples of hotels developedby Parque Arauco:
Chile• Arauco San Antonio
Colombia• Parque Caracolí
Source: Parque Arauco

[18]
I. Real Estate Types and Diversification
II. Growth opportunity analysis for Parque Arauco
III. Mixed use in Parque Arauco
IV. Parque Arboleda Office Tower
Agenda
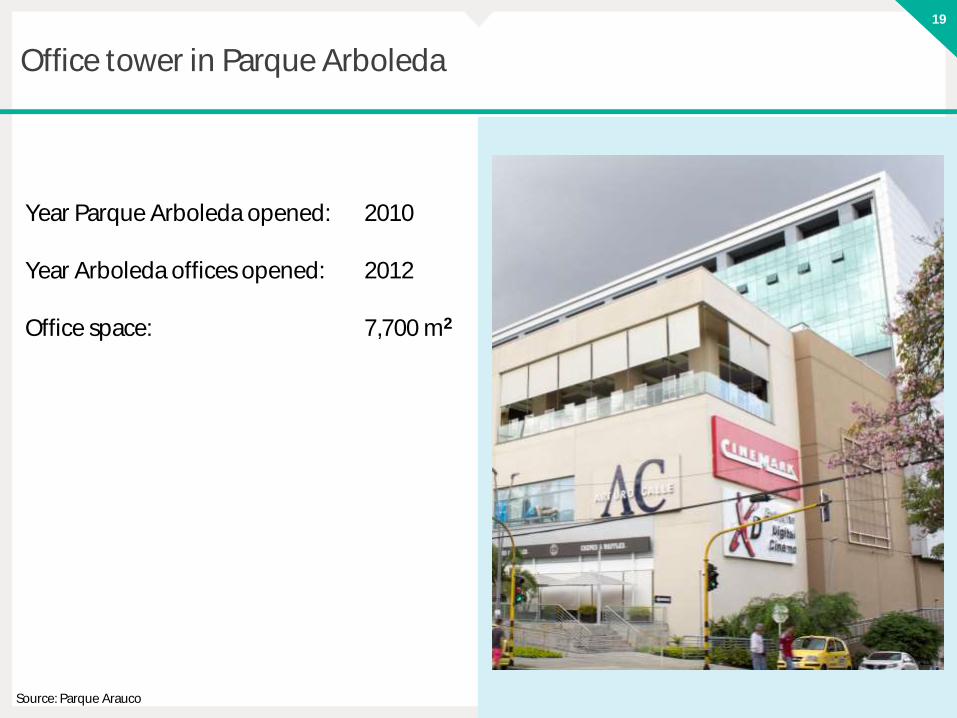
19
Office tower in Parque Arboleda
Year Parque Arboleda opened: 2010
Year Arboleda offices opened: 2012
Office space: 7,700 m2
Source: Parque Arauco

20
Parque Arboleda Office Tenants
Source: Parque Arauco
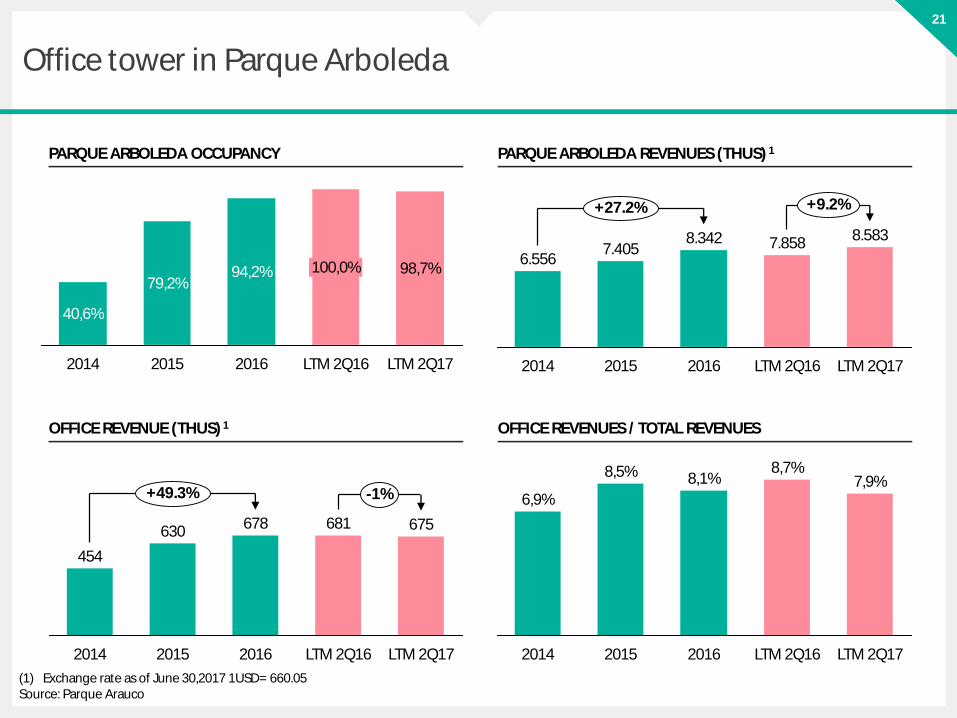
21
Office tower in Parque Arboleda
LTM 2Q17
94,2%79,2%
98,7%
LTM 2Q16
100,0%
201620152014
40,6%
8.583
LTM 2Q172014
6.556
LTM 2Q16
7.8588.342
+9.2%
20162015
7.405
+27.2%
2016 LTM 2Q17LTM 2Q16
8,7%7,9%8,1%
2015
6,9%
8,5%
2014
681678
LTM 2Q17
+49.3%
675
LTM 2Q16
630
2014
-1%
454
20162015
PARQUE ARBOLEDA OCCUPANCY PARQUE ARBOLEDA REVENUES (THUS) 1
OFFICE REVENUE (THUS) 1 OFFICE REVENUES / TOTAL REVENUES
(1) Exchange rate as of June 30,2017 1USD= 660.05Source: Parque Arauco

[22]

Parque ArboledaOverviewOctober 2017

2
I. Introduction to Parque Arboleda
II. Historical figures
II. Target audience
Agenda
Versión 16-10-2017 20:38

3
I. Introduction to Parque Arboleda
II. Historical figures
II. Target audience
Agenda

4
Pereira
Pereira• Capital city of Risaralda• Located in foothills of Colombian coffee region• Medellín and Calí)
• Important city for commerce
Population• In 2007, when project was first analyzed, population had over 400,000 people• Was the sixth largest city in Colombia• Within 50 km of mall there are 1,000,000 people• Within 100km of mall there are 2,000,000 people
Source: Parque Arauco

5
Strategic Rational for project
Parque Arboleda Project• First opportunity to develop in Colombia• Rental model will offer a growth model for smaller retailers• Project already has permits in place• Parque Arauco will have control (55%) through JV with the Merheg Family
Considerations• Rental model• No property taxes for 5 years• Project already validated by retailers
• 64% of GLA already negotiated• Investment of US$ 90 million (in 2010 dollars)
Source: Parque Arauco

6
Location
Parque Arboleda
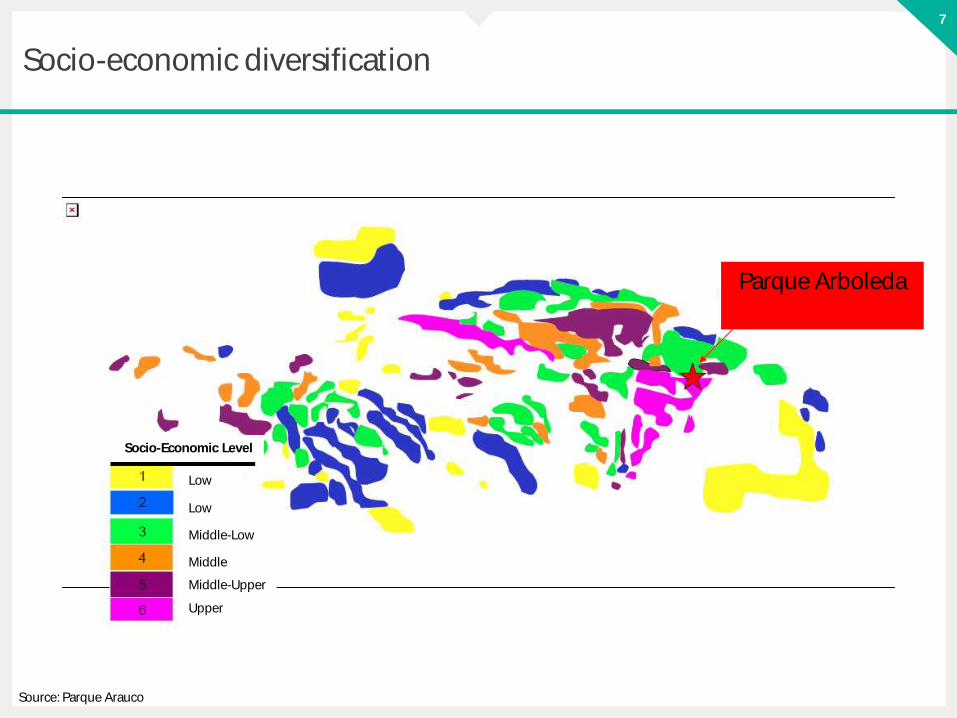
7
Socio-economic diversification
Source: Parque Arauco
Parque Arboleda
Low
Low
Middle-Low
Middle
Middle-Upper
Upper
Socio-Economic Level

8
Market
Source: Parque Arauco
Grocery stores and Homcenter
Existing shopping malls
Future expected shopping malls
Services
Airport
Unicentro
Homecenter and Alkosto
Grocery store Bus station
Éxito
Carrefour
Parque Arboleda

9
I. Introduction to Parque Arboleda
II. Historical figures
II. Target audience
Agenda

10
Historical figures
LTM 2Q17
LTM 2Q16
20132012 201620152014
50%
33% 33% 33% 33%
50%50%
2011
33%
41.000
2015
34.00040.500
34.00040.500
2014 LTM 2Q16
33.000 34.000
2011
34.000
LTM 2Q17
+19,1%+1,2%
201620132012
27,2%
30.124
0,8%
38.304
30.718
38.730
28.926 31.620 30.641
39.056
LTM 2Q16
201520122011 2013 LTM 2Q17
20162014
10.302 10.302
+116,2%
2015
22.275
LTM 2Q17
+1,2%
22.550
LTM 2Q16
2016
22.275
18.150
2014
9.999
20132012
10.302
2011
GLA (M2) OWNERSHIP (%)
OWNED GLA (M2) OCCUPIED GLA (M2)
Source: Parque Arauco

11
Historical figures
98
87
765
4
+9%
20162014 LTM 2Q17
+116%
LTM 2Q16
2015201320122011
75727468
5953
4943
2016 LTM 2Q17
+3,8%+73,2%
LTM 2Q16
201420122011 2013 2015
LTM 2Q16
2011
80%
2015
85%
2012 2016
76%
2013
78%
2014
85%75%78% 80%
LTM 2Q17
76
76
554
3
LTM 2Q16
2013 LTM 2Q17
2015
+122,4%+14,4%
2016201420122011
TENANT SALES (USDM) 1 REVENUES (USDM) 1
EBITDA (USDM) 1 EBITDA MARGIN (% REVENUES)
(1) Exchange rate as of June 30,2017 1USD= 660.05Source: Parque Arauco

12
I. Introduction to Parque Arboleda
II. Historical figures
II. Target audience
Agenda

13
Parque Target Audience
Female
Socio-economic
level 5
Married
Local
30-45 years old
Everyday woman
Decisive
Stylish
Parque Arboleda is the meeting point for the city, which is always innovative and modern with comfortable infrastructure, which has the objective to give the best experience, guarantee client satisfaction, both for the visitors and the brands in the mall, with communication that focuses on a stylish client. Parque Arbolea is an exclusive mall with fun activities for the whole family.

14