parrino chapter 9 – capital budgeting techniques wsj chapters 6 and 7 – insurance – taxes...
TRANSCRIPT

• Parrino chapter 9– Capital budgeting techniques
• WSJ chapters 6 and 7– Insurance– Taxes
• Return Exam 2
• Return graded assignments at end of class– WSJ Assignment #3– International Finance Module Assignment– Pre-Exam “In-Class” Assignment #2
Today’s Agenda
1

Capital Budgeting
2

1. Discuss why capital budgeting decisions are most important investment decisions made by a firm’s management
2. Explain benefits of using net present value (NPV) method to analyze capital expenditure decisions– Calculate NPV for a capital project
3. Describe strengths and weaknesses of payback period as a capital expenditure decision-making tool– Compute payback period – Compute discounted payback period
Learning Objectives
(continued)
3

4. Compute internal rate of return (IRR) for a capital project– Discuss conditions under which IRR technique and
NPV technique produce different results– Discuss and compute Modified IRR (MIRR)
5. Explain how Profitability Index can be used to rank projects– Valid when a firm faces capital rationing– Describe limitations that apply to Profitability Index
6. Explain benefits of post-audit and ongoing reviews of capital projects
Learning Objectives (cont’d)
4

Investment opportunities– Increase shareholder wealth– Enhance a firm’s competitive advantage
• Ideas often generated by employees – Typically long-term projects– Should be evaluated using time value of money
techniques– Large investment– Relate to firm’s mission
5
Capital Budgeting Projects

Key Reasons for Making Capital Expenditures
• Renewal
• Replacement
• Expansion
• Regulatory
• Other
6

1. Independent projects– Accepting or rejecting one project has no effect on other
projects– Cash flows are unrelated
2.Mutually exclusive projects– Accepting one project is a simultaneous decision to reject
another project– These projects typically perform the same function– Example: Build new manufacturing plant in different locations
3.Contingent projects– Decision to accept one project depends on acceptance of
another project– Types of contingent projects• Mandatory projects – evaluate with main as one project• Optional projects – evaluate as separate projects
7
Classifications of Investment Projects

• Generating proposals– Alignment with strategic plan ideal– Find opportunities; replacement and/or expansion– Reviewed by Finance personnel
• Review and analysis– Estimate cash flows (in and out)– Use capital budgeting techniques for evaluation
• Decision making– Which projects will be accepted/rejected?
• Implementation – make it happen
• Post audit and ongoing reviews– Track, review, analyze or audit decisions/projects
8
Capital Budgeting Process

Best method to evaluate capital projects
Considers time value of money
Includes all of project’s cash flows
Value measures dollar impact on shareholder wealth
NPV inputs– Cash inflows/outflows– Cost of capital (firm’s required rate of return)
Decision Rule: Accept projects with NPV > $0
9
Net Present Value (NPV) Technique
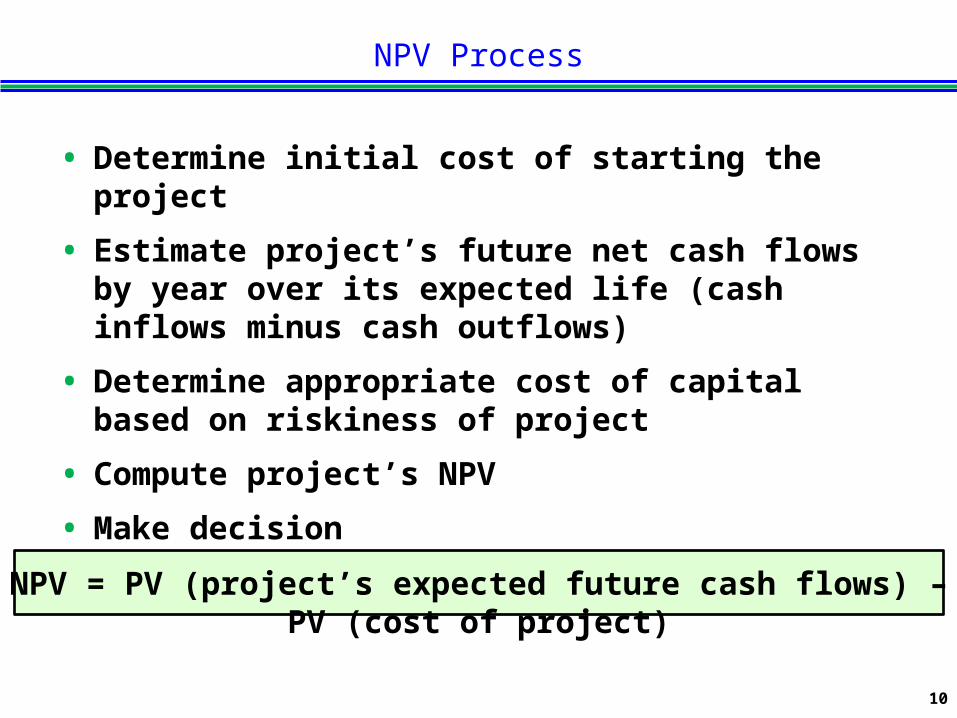
NPV Process
• Determine initial cost of starting the project
• Estimate project’s future net cash flows by year over its expected life (cash inflows minus cash outflows)
• Determine appropriate cost of capital based on riskiness of project
• Compute project’s NPV
• Make decision– Accept projects with NPV > $0
10
NPV = PV (project’s expected future cash flows) – PV (cost of project)

11
Cash Flow Data for Potential Projects
YearReplacement
ProjectExpansion
Project0 (today) (20,000) (25,000)
1 5,800 4,0002 5,800 4,0003 5,800 8,0004 5,800 10,0005 5,800 10,000
Cost of capital (WACC) = 10%
NPV Sample Calculations

Cost of capital (WACC)= 10%
12
NPV of Replacement Project
YearCashFlow
Number of Years
Present Value
0 ($20,000) 0 ($20,000)1-5 5,800 5 ?
Net present value $ ?PV ofordinaryannuity
Sample Calculation
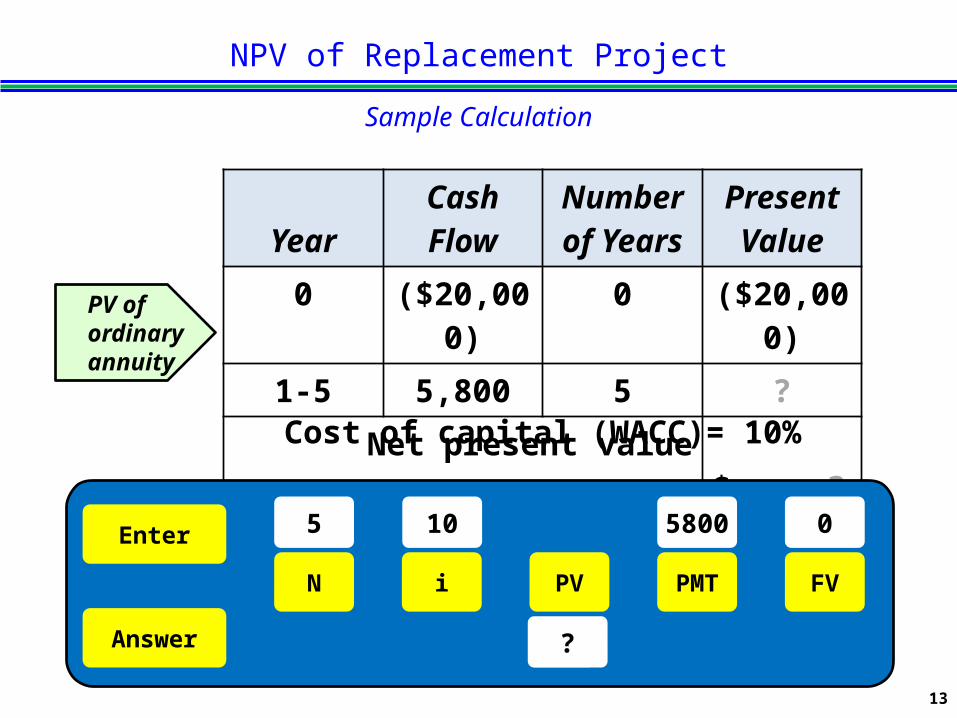
Cost of capital (WACC)= 10%
13
NPV of Replacement Project
YearCashFlow
Number of Years
Present Value
0 ($20,000) 0 ($20,000)1-5 5,800 5 ?
Net present value $ ?PV ofordinaryannuity
Sample Calculation
Enter
Answer
N i PMTPV FV
5
?
5800 010
14
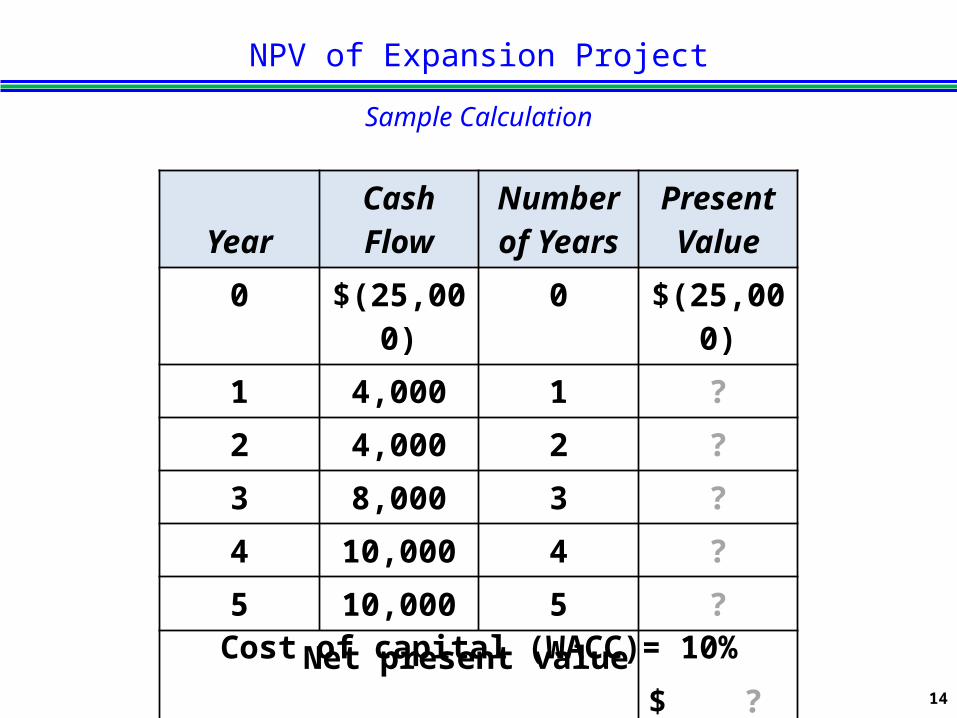
YearCashFlow
Number of Years
Present Value
0 $(25,000) 0 $(25,000)1 4,000 1 ?2 4,000 2 ?3 8,000 3 ?4 10,000 4 ?5 10,000 5 ?
Net present value $ ?
Sample Calculation
Cost of capital (WACC)= 10%
NPV of Expansion Project

15
Sample Calculation
Decision: Accept if NPV > $0
NPV Decisions on Capital Projects
Replacement Project
Expansion Project
Project cost $(20,000) $(25,000)NPV $1,987 $992
• Based on NPV, which project(s) should you accept if:a. Projects are independent and company has
unlimited funds?b. Company only has $25,000 to spend?
• Explain your decision

Summary
Net Present Value (NPV) Method
16

• IRR is the discount rate or “cost of capital” at whichNPV = zero
• Compute IRR by:– Trial and error– Financial calculator– Spreadsheet software
• Easier to compute for annuity cash flows
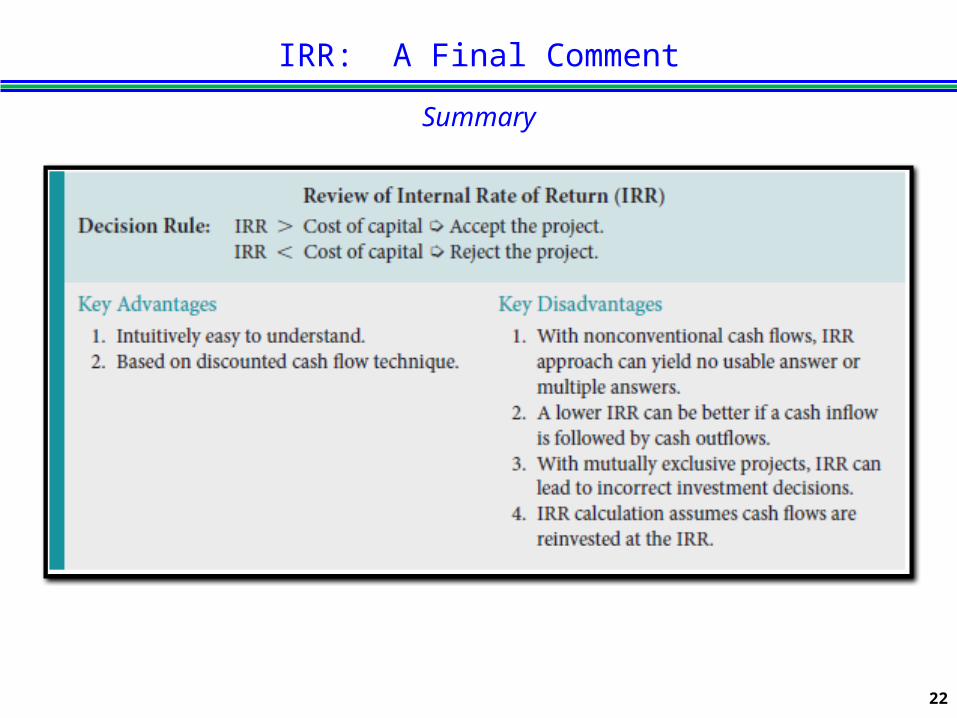
• Decision Rule: Accept if IRR > r – r = required return on project or cost of capital
17
Internal Rate of Return (IRR) Technique

Time Line and Expected Net Cash Flows
EXHIBIT 9.8 The cash flow data in the exhibit are used to compute the project’s IRR. The project’s NPV is a positive $16,440, which indicates that the IRR is greater than the cost of capital of 12%.
Parrino text p. 302 demonstrates the trial-and-error method of determining IRR for this project.
The Ford Project
18
0 321Time line
Net cash flow
Year
$240$(560)
Cost of capital = 12%NPV = $576.44 - $560 = $16.44
$240 $240
($ thousands)

IRR Calculation Example
The Ford Project
19
0 321Time line
Net cash flow
Year
$240$(560)
Cost of capital = 12%NPV = $576.44 - $560 = $16.44
$240 $240
($ thousands)
Enter
Answer
N i PMTPV FV
3
13.7
240 0-560

NPV Profile for Ford Project
20

21
Cash Flow Data for Potential Projects
Year Replacement Expansion0 (today) (20,000) (25,000)
1 5,800 4,0002 5,800 4,0003 5,800 8,0004 5,800 10,0005 5,800 10,000
IRR ? % ? %
Cost of capital (WACC) = 10%
Sample Calculations
• Based on IRR, which project(s) should you accept if:a. Projects are independent and company has
unlimited funds?b. Company only has $25,000 to spend?
• Explain your decision
IRR: A Final Comment
Summary
22

• Always agree on whether to accept or reject a project if projects are independent and cash flows are “conventional” (i.e., no sign changes)
• If projects are independent: Either method is acceptable
• Problem: NPV and IRR may rank projects differently– Lemonade stand vs. convenience store (Parrino p. 309)
• What if projects are mutually exclusive and rankings conflict?– Answer: Use NPV because it measures change in shareholder
wealth
23
NPV vs. IRR
Investment NPV IRRConvenience store $1,000,000 $179,190 18.0%Lemonade stand 1,000 1,694 76.2%

• A project may have more than one IRR– Occurs if project has alternative positive and negative
future cash flows (i.e., more than one sign change)– Most likely to occur if project requires:• Substantial renovations or maintenance during its life
(periodic cash outflows)• High end-of-life shut-down costs
• Solution? MIRR– Find the Terminal Value (TV): future value at project’s end
of all future net cash flows– MIRR is the return earned when the PV of COF = PV of CIF• PV (cost of project) = PV (future net cash flows)
– Decision Rule: Accept if MIRR > r• r = required return on project or cost of capital
24
Problems with IRR
Solution: Modified IRR (MIRR)

MIRR Calculation Example
The Ford Project
25
$240.00268.80301.06
$809.86
Net cash flow $240$(560) $240Time line
Year20 1 312%
Terminal Value (TV)
MIRR = 13.09%$560PV =
Enter
Answer
N i PMTPV FV
3
?
0 809.86(560)
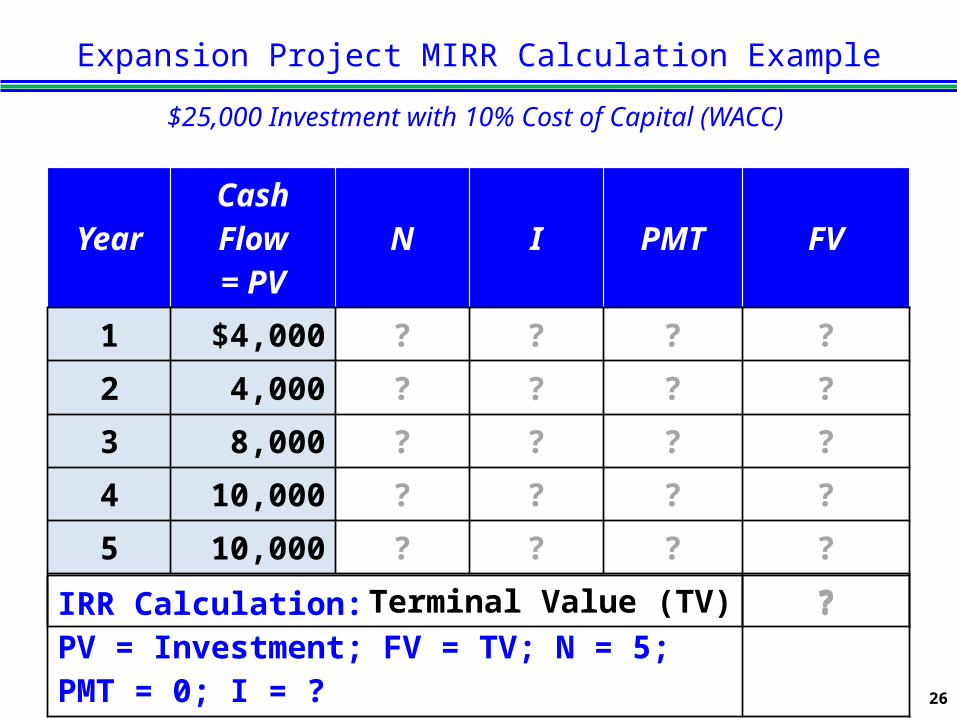
Expansion Project MIRR Calculation Example
$25,000 Investment with 10% Cost of Capital (WACC)
YearCash Flow
= PV N I PMT FV1 $4,000 ? ? ? ?2 4,000 ? ? ? ?3 8,000 ? ? ? ?4 10,000 ? ? ? ?5 10,000 ? ? ? ?
Terminal Value (TV) ?
26
IRR Calculation:PV = Investment; FV = TV; N = 5; PMT = 0; I = ?
?

Expansion Project MIRR Calculation Example
$25,000 Investment with 10% Cost of Capital (WACC)
YearCash Flow
= PV N I PMT FV1 $4,000 4 10 0 $ 5,856.402 4,000 3 10 0 5,324.003 8,000 2 10 0 9,680.004 10,000 1 10 0 11,000.005 10,000 0 10 0 10,000.00
Terminal Value (TV) $41,860.40
27
IRR Calculation:PV = Investment; FV = TV; N = 5; PMT = 0; I = ?
10.86%

Number of years until the cash flows from a project equal the project’s cost– Time to recoup an investment’s cost
Decision Rule: Accept if payback period is less than a maximum desired time period– Management determines the required time period
28
Payback Period Method

Payback Period Example
Replacement Project with $20,000 Investment
Year Cash FlowCumulative Cash Flow
Dollars Needed to Recoup Costs
1 $5,8002 5,8003 5,8004 5,8005 5,800
Fraction of year: ________/5,800 = Payback = _______ years
29

Payback Period Example
Replacement Project with $20,000 Investment
Year Cash FlowCumulative Cash Flow
Dollars Needed to Recoup Costs
1 $5,800 $5,800 $14,2002 5,800 11,600 8,4003 5,800 17,400 2,6004 5,800 23,2005 5,800 29,000
Fraction of year: 2,600/5,800 = 0.45 yearPayback period = 2.45 years
30
Ignores time value of money
Ignores cash flows beyond payback period
Ignores timing of cash flows
Any relationship between payback period and shareholder wealth maximization is purely coincidental
Many companies use it in addition to other methods
Payback Period Method’s Drawbacks
31

• Same idea as Payback Period method– Find PV of net cash flows– Determine payback of initial investment using
PV of net cash flows
• Considerations– TVM– Liquidity of project
• Decision Rule: Accept if DPB Period < Project’s Useful Life
Discounted Payback Period
32

Discounted Payback Period
Example Cash Flows and Calculations
33
Net cash flow (NCF)Cumulative NCF
Discounted NCF (at 10%)Cumulative discounted NCF
Payback period = 2 yearsDiscounted payback period = 2 years + $5,289/$15,026 = 2.35 yearsCost of capital = 10%NPV = $49,737 - $40,000 = $9,737
Time lineYear20 1 3
$20,000$(40,000) $20,000 $20,000$0$(40,000) $(20,000) $20,000
$16,529$(40,000) $18,182 $15,026$(5,289)$(40,000) $(21,818) $9,737

• Measures the value a project generates for each dollar invested in that project– PI value indicate the value of the expected future free
cash flows per dollar invested in each project
• Useful when firms have funding constraints(i.e., capital rationing)
• Choose a set of projects consistent with the idea of shareholder wealth maximization
• Can lead to suboptimal project choices in situations involving multiple periods– More sophisticated analytical techniques (such as linear
programming) beyond scope of this course
Profitability Index
34
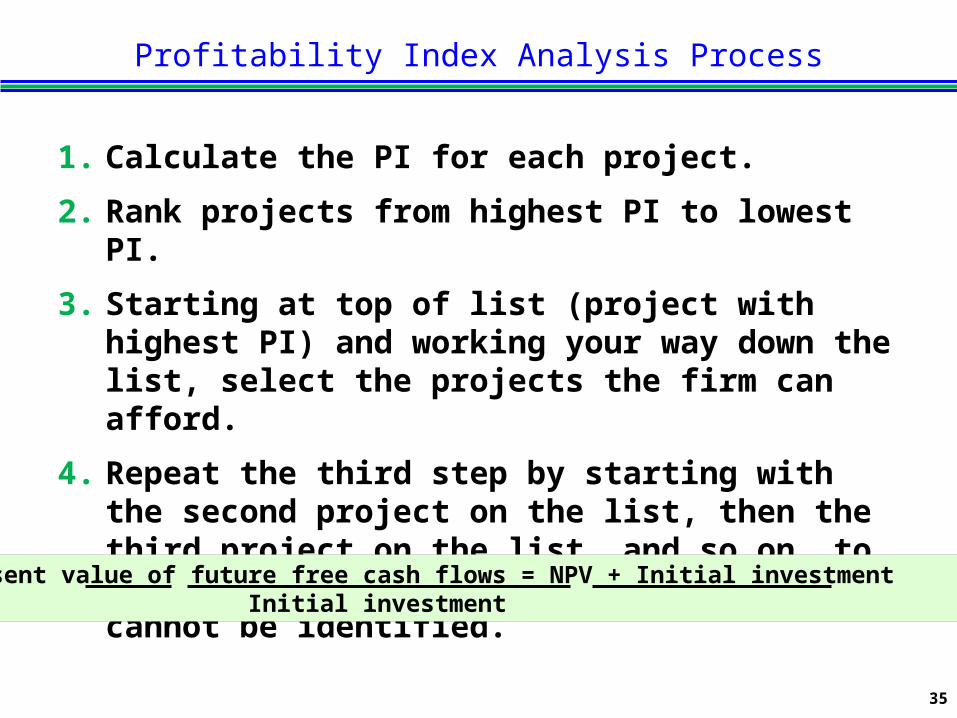
Profitability Index Analysis Process
1. Calculate the PI for each project.
2. Rank projects from highest PI to lowest PI.
3. Starting at top of list (project with highest PI) and working your way down the list, select the projects the firm can afford.
4. Repeat the third step by starting with the second project on the list, then the third project on the list, and so on, to make sure that a more valuable bundle cannot be identified.
PI = Benefits = Present value of future free cash flows = NPV + Initial investment (9.6) Costs Initial investment Initial investment
35

Profitability Index Examples
Calculating PI and Ranking Projects Using PI
Project Year 0 Year 1 Year 2NPV @
10% PI*A $(5,000) $5,500 $6,050 $5,000 ?B (3,000) 2,000 3,850 2,000 ?C (3,000) 4,400 0 1,000 ?D (2,000) 1,500 1,375 500 ?
• With only $10,000 to invest, which of these four positive NPV projects would you select?
• How much shareholder value would be added by the projects you select? $__________
* PI = NPV + Initial investment Initial investment
?
36

• Systematic reviews of all ongoing and completed capital projects
• Post-audit reviews of completed projects– Comparison of actual results of a project with what was
projected in the capital budgeting proposal– May reveal why a project was successful or failed to
achieve its financial goals
• Ongoing reviews of projects in progress– Challenge the business plan, including cash flow
projections and cost assumptions– Progress updates on actual costs and time vs. projections– Evaluate the performance of people responsible for
implementing a capital project
Post-Audit and Ongoing Reviews
37

Capital Budgeting Techniques Used By Businesses
Trends: 1981 - 1999
38

Automated Techniques for NPV and IRR
• USE THE MANUAL AND/OR AUTOMATED CALCULATION TECHNIQUES WITH WHICH YOU ARE MOST COMFORTABLE
• Financial calculator can do NPV and IRR calculations– Be careful doing inputs– Think about how you’ll “show your work” on assignments
and exam• Guidebook for TI BAII Plus Calculator available on BbLearn– “Cash Flow Worksheets” chapter 3– http
://education.ti.com/en/us/guidebook/details/en/ADF11FB65B284B6195B0A7E9502784BA/baiiplus?download=8ED6B8A59A0B49C68A7C41F97B5D4EAE#!
• Excel contains NPV and IRR functions (not for exams)– Examples: Parrino pp. 295 and 304
39

Appendix
40

MIRR Equations
Terminal Value = TV = [CF1 x (1 + k)n-1] + [CF2 x (1 + k)n-2] + . . . + [CFn x (1 + k)n-t]
= Σ CFt x (1 + k)n-t Where:TV = project terminal valueCFt = cash flow from operations in period tk = cost of capitaln = project life
n
t=1
PVcost = PVTV
PV cost of project = PV terminal value
PVcost = TV (1 + MIRR)n
MIRR = TV 1/n - 1 PVcost
41