parry sugars refinery india private limited balance sheet ... · (all amounts are in rupees lakhs...
TRANSCRIPT

Parry Sugars Refinery India Private Limited
Balance Sheet as at March 31, 2017
(Amounts in lakhs)
As at March 31,
2017
As at March
31, 2016As at April 01, 2015
INR INR INR
A
1
(a) Property, Plant and Equipment 4 42,192.53 44,452.57 41,214.87
(b) Capital Work-In-Progress 4 355.92 196.84 63.53
(c) Financial Assets
(i) Deferred Tax Assets(Net) 5 - - -
(ii) Other Financial Assets 6A 118.68 105.17 186.41
(d) Other Non Current Assets 11A 1,233.85 1,282.10 2,287.85
43,900.98 46,036.68 43,752.66
2 Current assets
(a) Inventories 7 106,288.60 81,735.87 40,605.02
(b) Financial Assets
(i) Investments 8 3,043.99 3,302.90 -
(ii) Trade receivables 9 292.45 11,779.76 77.20
(iii) Cash and Cash equivalents 10 7,494.87 2,071.05 27.59
(iv) Other Financial Assets 6B 15,252.70 22,414.58 3,528.43
(c) Other Current Assets 11B 7,574.14 3,350.59 1,057.69
139,946.75 124,654.75 45,295.93
183,847.73 170,691.43 89,048.59
B
1 Equity
(a) Equity Share capital 12 27,072.57 16,628.12 11,628.12
(b) Other Equity 13 (22,692.66) (27,843.42) (21,821.51)
4,379.91 (11,215.30) (10,193.39)
LIABILITIES
2 Non-current liabilities
(a) Financial Liabilities
(i) Borrowings 14 27,000.00 42,271.35 38,956.81
(b) Non-Financial Liabilities
(i) Long term provisions 16A 64.17 46.46 34.31
(ii) Other Non Financial Liabilities 19A 2.30 4,028.11 4,061.69
27,066.47 46,345.92 43,052.81
3 Current liabilities
(a) Financial Liabilities
(i) Borrowings 17 41,475.25 81,990.19 22,150.39
(ii) Trade payables 18 97,422.03 48,519.17 31,937.38
(iii) Other Financial Liabilities 15 13,447.79 4,956.60 2,017.48
(b) Non-Financial Liabilities
(i) Short term provisions 16B 1.67 1.17 21.39
(ii) Other Non Financial Liabilities 19B 54.61 93.68 62.53
152,401.35 135,560.81 56,189.17
183,847.73 170,691.43 89,048.59
See accompanying notes to the financial statements
In terms of our report attached. For and on behalf of the Board of Directors
For Deloitte Haskins & Sells
Chartered Accountants
Chairman Director
M.K. Ananthanarayanan
Partner
Place : Chennai Chief Financial Officer
Date : May 11, 2017
Total Equity and Liabilities (1+2+3)
Note
No.
ASSETS
Total equity
Total Non - Current Liabilities
Total Current Liabilities
Non-current assets
Particulars
Total Non - Current Assets
Total Current Assets
Total Assets (1+2)
EQUITY AND LIABILITIES
Parry Sugars Refinery India Private Limited
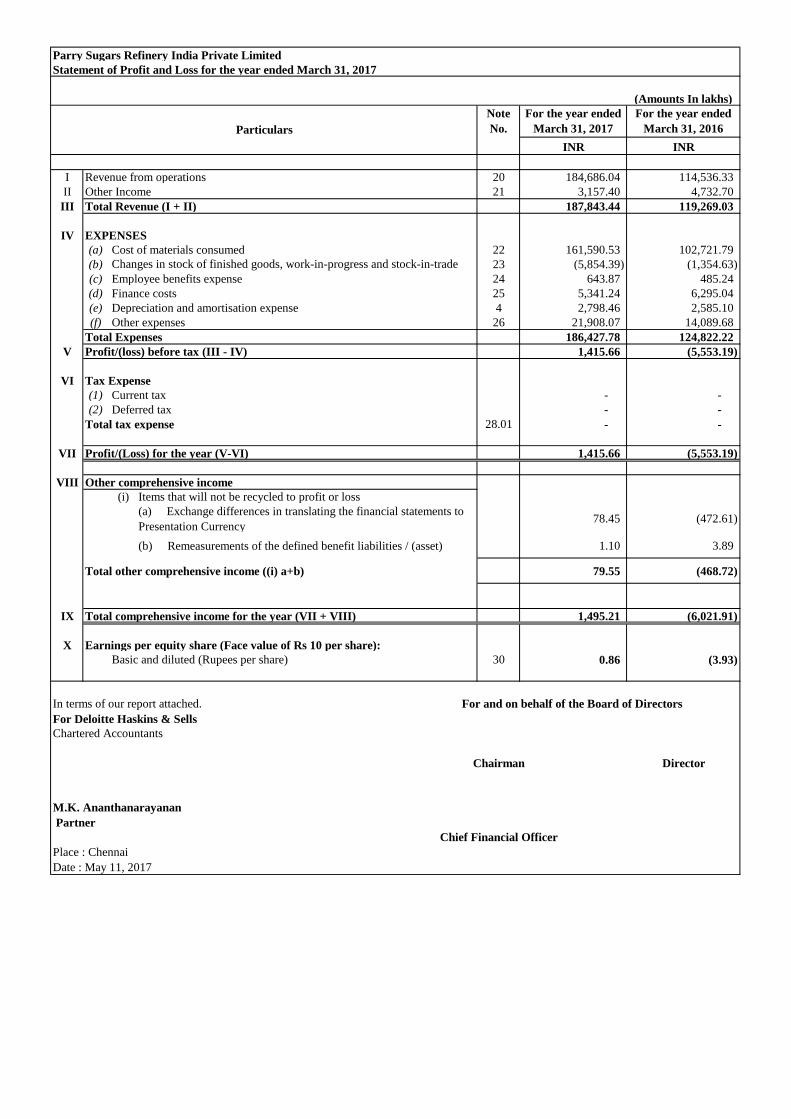
Statement of Profit and Loss for the year ended March 31, 2017
(Amounts In lakhs)
For the year ended
March 31, 2017
For the year ended
March 31, 2016
INR INR
I Revenue from operations 20 184,686.04 114,536.33
II Other Income 21 3,157.40 4,732.70
III Total Revenue (I + II) 187,843.44 119,269.03
IV EXPENSES
(a) Cost of materials consumed 22 161,590.53 102,721.79
(b) 23 (5,854.39) (1,354.63)
(c) Employee benefits expense 24 643.87 485.24
(d) Finance costs 25 5,341.24 6,295.04
(e) Depreciation and amortisation expense 4 2,798.46 2,585.10
(f) Other expenses 26 21,908.07 14,089.68
Total Expenses 186,427.78 124,822.22
V Profit/(loss) before tax (III - IV) 1,415.66 (5,553.19)
VI Tax Expense
(1) Current tax - -
(2) Deferred tax - -
Total tax expense 28.01 - -
VII Profit/(Loss) for the year (V-VI) 1,415.66 (5,553.19)
VIII Other comprehensive income
(i) Items that will not be recycled to profit or loss
(a) Exchange differences in translating the financial statements to
Presentation Currency78.45 (472.61)
(b) Remeasurements of the defined benefit liabilities / (asset) 1.10 3.89
Total other comprehensive income ((i) a+b) 79.55 (468.72)
IX Total comprehensive income for the year (VII + VIII) 1,495.21 (6,021.91)
X Earnings per equity share (Face value of Rs 10 per share):
Basic and diluted (Rupees per share) 30 0.86 (3.93)
In terms of our report attached. For and on behalf of the Board of Directors
For Deloitte Haskins & Sells
Chartered Accountants
Chairman Director
M.K. Ananthanarayanan
Chief Financial Officer
Place : Chennai
Date : May 11, 2017
Partner
Changes in stock of finished goods, work-in-progress and stock-in-trade
Particulars
Note
No.

Parry Sugars Refinery India Private Limited
Statement of Cashflows for the year ended March 31, 2017
Year ended
March 31, 2017
Year ended
March 31, 2016
INR INR
A. Cash flows from operating activities
Profit for the year 1,415.66 (5,553.19)
Adjustments for:
Finance costs recognised in profit or loss 5,341.24 6,295.04
Depreciation and amortisation expenses 2,798.46 2,585.10
Profit on Sale of Assets (1.11) -
Marked to Market loss/(gain) on Forward and Swap Contract (1,669.82) 1,781.54
Marked to Market loss on Commodity Contracts 4,244.99 1,468.07
Interest Income (17.86) (99.17)
Liabilities no longer required written back (187.45)
Deferred Expense (Net of Interest Income) arising from Interest free deposits
carried at amortised cost 35.16 (250.77)
Interest on zero coupon debentures 528.52 480.95
Operating Profit before working capital changes 12,675.23 6,520.12
Movements in working capital:
(Increase)/decrease in trade and other receivables 11,487.31 (11,702.56)
(Increase)/decrease in inventories (23,577.12) (44,142.10)
(Increase)/decrease in Other Financial Assets (Current) 7,663.74 (19,582.88)
(Increase)/decrease in Other Current Assets (4,223.55) (2,292.91)
(Increase)/decrease in other Non Financial Assets (Non Current) (0.42) 1,510.14
Increase /(decrease) in Trade payables 48,902.86 16,769.24
Increase /(decrease) in Long term and Short term provisions 18.21 (8.08)
Increase/(decrease) in Other Non Financial Liabilities (37.96) 35.04
Increase/(decrease) in Other Financial Liabilities (289.91) 228.22
39,943.17 (59,185.89)
Cash generated from / (used in) operations 52,618.40 (52,665.77)
Income taxes paid (172.40)
Net cash generated from / (used in) operating activities 52,618.40 (52,838.17)
B. Cash flows from investing activities
Payments to acquire Property, Plant and Equipment (1,595.25) (3,417.46)
Interest received 15.73 98.79
Dividends received
Proceeds from sale of fixed Assets 1.66
Bank balances not considered as Cash and cash equivalents - Placed (5,800.00) (0.93)
Net cash (used in)/generated by investing activities (7,377.86) (3,319.60)
C. Cash flows from financing activities
Proceeds from issue of equity instruments of the Company - 5,000.00
Proceeds from issue of preference shares - 2,800.00
Proceeds from short term borrowings(net) including bank overdrafts (40,503.05) 59,506.07
Finance costs (5,360.71) (6,136.60)
Net cash used in financing activities (45,863.76) 61,169.48
Net increase in cash and cash equivalents (623.22) 5,011.71
Cash and cash equivalents at the beginning of the year 5,345.26 333.56
Cash and cash equivalents at the end of the year 4,722.05 5,345.26
(623.21) 5,011.70
(Amounts in lakhs)
Particulars

Year ended
March 31, 2017
Year ended
March 31, 2016
INR INR
Cash and Cash Equivalents (Note No 10) 7,494.87 2,071.05
Less: Bank Balances not considered as Cash and Cash Equivalents as defined in
AS 3 Cash Flow Statements
(5,816.80) (16.80)
Add: Bank Overdraft included in Current borrowings (Note 17) - (11.89)
Add: Current investments considered as part of Cash and cash equivalents (as
defined in AS 7 Statement of Cashflows)
3,043.99 3,302.90
Net Cash and Cash Equivalents (as defined in AS 3 Cash Flow Statements) 4,722.05 5,345.26
In terms of our report attached.
For Deloitte Haskins & Sells
Chartered Accountants
Chairman Director
M.K. Ananthanarayanan Chief Financial Officer
Partner
Place : Chennai
Date : May 11, 2017
Reconciliation of Cash and Cash Equivalents with the Balance Sheet:
For and on behalf of the Board of Directors
Particulars

Parry Sugars Refinery India Private Limited
Statement of changes in equity for the year ended March 31, 2017
All amounts are in INR Lakhs unless otherwise stated)
a. Equity
Issued, subscribed and Paid up Capital
Balance at April 1, 2015 11,628.12
Issue of Equity shares to Holding Company 5,000.00
Balance at March 31, 2016 16,628.12
Conversion of Preference shares to Equity shares 10,444.45
Balance at March 31, 2017 27,072.57
b. Other Equity
Securities
premium
reserve
Debenture
redemption
Reserve
Retained
earnings
Foreign
Currency
Translation
Reserve
Other Items of
other
comprehensive
income
INR INR INR INR INR INR
Balance as at 01 April 2015 30,741.44 - (52,562.95) (21,821.51)
2015-16
Loss for the year (5,553.19) (5,553.19)
Remeasurement of defined benefit plans 3.89 3.89
Exchange differences in translating the financial statements to
Presentation Currency(472.61) (472.61)
Balance as at 31 March 2016 30,741.44 - (58,116.14) (472.61) 3.89 (27,843.42)
2016-17
Premium on conversion of preference shares into equity shares 3,655.56 3,655.56
Profit for the year 1,415.66 1,415.66
Transfer to Debenture Redemption Reserve 1,415.66 (1,415.66) -
Exchange differences in translating the financial statements to
Presentation Currency78.45 78.45
Remeasurement of defined benefit plans - 1.10 1.10
Balance as at 31 March 2017 34,397.00 1,415.66 (58,116.14) (394.16) 4.99 (22,692.66)
In terms of our report attached.
For Deloitte Haskins & Sells
Chartered Accountants
M.K. Ananthanarayanan
Partner
Place : Chennai Chief Financial Officer
Date : May 11, 2017
DirectorChairman
For and on behalf of the Board of Directors
Particulars Amount
Particulars
Reserves and SurplusItems of Other
Comprehensive Income
Total

Parry Sugars Refinery India Private Limited
Notes forming part of the financial statements for the year ended March 31, 2017
(All amounts are in Rupees lakhs unless otherwise stated)
1 Corporate Information
2 Statement of compliance
3 Significant Accounting Policies
3.1 Basis of preparation and presentation
Parry Sugars Refinery India Private Limited (‘the Company’) is a private company limited by shares, incorporated on 13 January
2006 and having its Registered Office at Chennai, Tamilnadu. The company is primarily engaged in the manufacturing of refined
Sugar in its factory located in Kakinada. The plant was originally constructed to run on Natural Gas as its fuel and the company had
a firm allocation of Natural gas from Government of India. . However gas supplies to the plant was stopped due to unexpected drop
in overall gas production, due to which the Company's operations were discontinued from 1 November 2011. The Company
assessed the suitability of alternative fuels and concluded that coal would be a viable substitute for running the plant. The Company
also commissioned Coal fired boiler and Power Plant and re-commenced its operations from 16 July 2014.
The financial statements have been prepared in accordance with Ind AS notified under the Companies (Indian Accounting
Standards) Rules, 2015.
Up to the year ended March 31, 2016, the Company prepared its financial statements in accordance with the requirements of
previous GAAP, which includes accounting standards notified under the section 133 of the Companies Act 2013, read together with
paragraph 7 of the Companies (Accounts) Rules, 2014. These financial statements for the year ended 31st March 2017 are the first
financials, the Company has prepared in accordance with Ind AS. The date of transition to Ind AS is April 1, 2015. Refer Note 3.21
for details of first time adoption exemptions availed by the company.
The financial statements of the Company have been prepared and presented in accordance with the Generally Accepted Accounting
Principles (GAAP) which comprises of Indian Accounting Standards (Ind-AS) as specified in Section133 of the Act, read with Rule
4 of Companies (Indian Accounting Standards) Rules 2015 and Rule 4 of Companies (Indian Accounting Standards) Amendment
Rules 2016 to the extent applicable to the Company and other provisions of the Act. The Balance Sheet and the Statement of Profit
and Loss, including related notes, are prepared and presented as per the requirements of the Schedule III to the Companies Act, 2013
amended vide MCA notification G.S.R. 404(E) dated the 6th April 2016. The financial statements for the year ended 31st March
2017 have been prepared in accordance with these Rules, and the financial statements for the comparative year ended 31st March
2016 have been restated accordingly.
All assets and liabilities have been classified and disclosed as current or non-current as per the Company’s normal operating cycle
and other criteria set out in Schedule III. Based on the nature of operations and the time between the acquisition of assets for sale of
goods and their realization into cash and cash equivalents, the Company has ascertained its operating cycle as twelve months for the
purpose of current - non current classification of assets and liabilities.
Accounting policies have been consistently applied to all the periods presented, except where a newly issued accounting standard is
initially adopted, or a revision to existing accounting standards require requires a change in the accounting policy hitherto in use.
The financial statements have been prepared on the historical cost basis except for certain financial instruments that are measured at
fair values at the end of each reporting period, as explained in the accounting policies below.
Historical cost is generally based on the fair value of the consideration given in exchange for goods and services.

Parry Sugars Refinery India Private Limited
Notes forming part of the financial statements for the year ended March 31, 2017
(All amounts are in Rupees lakhs unless otherwise stated)
3.2 Going Concern Assumption
3.3 Functional and presentation currency
The Company has accumulated loss of Rs. 58,116 lakhs resulting in substantial erosion of net worth. The Management is confident
that the Company will be able to generate profits in future years to meet its financial obligation as may arise.The Company's
financial statements have been prepared on a going concern basis based on cumulative impact of the following mitigating factors:-
A. Company has not defaulted in payment of any statutory dues including interest on bank borrowings.
B. In order to strengthen the financial position, the Company has restructured its high cost bank borrowings with low cost
debentures, with support of corporate guarantee from holding Company during the year 2014-15.
C. E.I.D Parry (India) Ltd - Holding Company infused Rs.5,000 lakhs and Rs. 2,800 lakhs in the form of Equity Shares and
Preference Shares respectively during the year 2015-16.
D. To overcome the operational issues arising out of non-availability of gas, the Company has invested in Coal based boiler and
operations commenced during July 2014. The power plant has also been synchronized with AP grid and the plant is exporting the
surplus power.
E. The company's production volumes have increased in 2015-16 and 2016-17. From Feb 2015, the Company has commenced the
locking of raw sugar and white sugar prices in the international commodity exchanges.
Besides the above, the Company has also taken several Strategic initiatives, cost reduction and efficiency improving measures to
improve profitability .
Fair value is the price that would be received to sell an asset or paid to transfer a liability in an orderly transaction between market
participants at the measurement date, regardless of whether that price is directly observable or estimated using another valuation
technique. In estimating the fair value of an asset or a liability, the Company takes into account the characteristics of the asset or
liability if market participants would take those characteristics into account when pricing the asset or liability at the measurement
date. Fair value for measurement and/or disclosure purposes in these financial statements is determined on such a basis, except for
share-based payment transactions that are within the scope of Ind AS 102, leasing transactions that are within the scope of Ind AS
17, and measurements that have some similarities to fair value but are not fair value, such as net realizable value in Ind AS 2 or
value in use in Ind AS 36.
In addition, for financial reporting purposes, fair value measurements are categorized into Level 1, 2, or 3 based on the degree to
which the inputs to the fair value measurements are observable and the significance of the inputs to the fair value measurement in its
entirety, which are described as follows:
• Level 1 inputs are quoted prices (unadjusted) in active markets for identical assets or liabilities that the entity can access at the
measurement date;
• Level 2 inputs are inputs, other than quoted prices included within Level 1, that are observable for the asset or liability, either
directly or indirectly; and
• Level 3 inputs are unobservable inputs for the asset or liability.
The principal accounting policies are set out below.
As mentioned in Note 1 above, the company recommenced its operation on 16 July 2014 with coal fired boilers. During the period
July 2014 to March 2015, the refining plant faced initial teething issues. Production and Sales have stabilised in January to March
2015. During 2015-16, the production and sale have increased and volumes have stabilised. Being in an SEZ location, the company
imports raw sugar and exports white sugar, consequently exposing the company to the risks in the international market. From
February 2015, the company starting locking the premium/margins for its refining business using USD denominated sugar
commodity futures and option contracts. With almost all the company's revenues in USD, the company has swapped its INR
denominated debentures to USD to achieve a natural hedge.
Owing to the above, the management has assessed that the currency of the Company's primary economic environment is USD since
the significant portion of its revenue and cost (and consequently margins) are affected by the USD. The functional currency has been
changed from INR to USD on 1 April 2015 since during 2014-15 the company completed the capitalisation, recommenced
operations and the volumes have stabilised.
Accordingly, items included in the financial statements are measured using USD as the functional currency. The financial statements
are presented in Indian Rupees (INR) ("the presentation currency ") being the common currency in which consolidated financial
statements of its holding company are presented, and has been rounded up to the nearest lakh except where otherwise indicated.

Parry Sugars Refinery India Private Limited
Notes forming part of the financial statements for the year ended March 31, 2017
(All amounts are in Rupees lakhs unless otherwise stated)
3.4 Revenue recognition
Sale of goods
3.5 Leases
As a lessee
3.6 Foreign currency transactions and translations
The main activity of the Company is refinement of raw-sugar. Revenue from sale of refined sugar is measured at the fair value of the
consideration received or receivable, less returns (if any), trade discounts, volume rebates and value added taxes. Revenue from the
sale of goods is recognised when the goods are dispatched and titles have passed, at which time all the following conditions are
satisfied:
• the company has transferred to the buyer the significant risks and rewards of ownership of the goods;
• the company retains neither continuing managerial involvement to the degree usually associated with ownership nor effective
control over the goods sold;
• the amount of revenue can be measured reliably;
• it is probable that the economic benefits associated with the transaction will flow to the company; andDividend and interest income
a). Dividend income from investments is recognised when right to receive it is established.
b). Interest income from a financial asset is recognised when it is probable that the economic benefits will flow to the company and
the amount of income can be measured reliably. Interest income is accrued on a time basis, by reference to the principal outstanding
and at the effective interest rate applicable, which is the rate that exactly discounts estimated future cash receipts through the
expected life of the financial asset to that asset's net carrying amount on initial recognition.
At the inception of a lease, the lease arrangement is classified as either a finance lease or an operating lease, based on the substance
of the lease arrangement. Lease in which significant portion of the risks and rewards of ownership are not transferred to the lessee
are classified as operating lease. Lease other than operating lease is finance lease.
The Company's significant leasing arrangements are in respect of operating leases for premises that are cancellable in nature. The
lease rentals under such agreements are recognised in the Statement of Profit and Loss as per the terms of the lease.
The Company has taken 'Land' on an operating lease. Lease payments thereon are recognised in the Statement of Profit and Loss, on
straight-line basis over the lease period. Where the rentals are structured solely to increase in line with expected general inflation to
compensate for the lessor’s expected inflationary cost increases, such increases are recognised in the year in which such benefits
accrue. Contingent rentals arising under operating leases are recognised as an expense in the period in which they are incurred.
In preparing the financial statements of the company, transactions in currencies other than the entity’s functional currency (foreign
currencies) are recognised at the rates of exchange prevailing at the dates of the transactions. At the end of each reporting period,
monetary items denominated in foreign currencies are retranslated at the rates prevailing at that date. Non-monetary items carried at
fair value that are denominated in foreign currencies are retranslated at the rates prevailing at the date when the fair value was
determined. Non-monetary items that are measured in terms of historical cost in a foreign currency are not retranslated.
For the purpose of presenting these financial statements, the assets and liabilities of the company are translated into Indian Rupee
using exchange rates prevailing at the end of each reporting period. Income and expense items are translated at the average exchange
rates for the period, unless exchange rates fluctuate significantly during that period, in which case the exchange rates at the dates of
transactions are used. Exchange differences arising, if any, are recognized in other comprehensive income and accumulated in
equity.
Exchange differences arising on translation are recognised in the income statement for determination of net profit or loss during the
period.
Parry Sugars Refinery India Private Limited
Notes forming part of the financial statements for the year ended March 31, 2017
(All amounts are in Rupees lakhs unless otherwise stated)
3.7 Borrowing Costs
3.8 Employee Benefits
(I) Retirement benefit costs and termination benefits:
(c) Contributions from employees or third parties to defined benefit plans
Net interest is calculated by applying the discount rate at the beginning of the period to the net defined benefit liability or asset.
Past service cost is recognised in profit or loss in the period of a plan amendment.
Remeasurement, comprising actuarial gains and losses, the effect of the changes to the asset ceiling (if applicable) and the return on
plan assets (excluding net interest), is reflected immediately in the balance sheet with a charge or credit recognised in other
comprehensive income in the period in which they occur. Remeasurement recognised in other comprehensive income is reflected
immediately in retained earnings and is not reclassified to profit or loss.
Curtailment gains and losses are accounted for as past service costs. The retirement benefit obligation recognised in the balance
sheet represents the actual deficit or surplus in the Company’s defined benefit plans. Any surplus resulting from this calculation is
limited to the present value of any economic benefits available in the form of refunds from the plans or reductions in future
contributions to the plans.
Contributions paid/payable to defined contribution plans comprising of Superannuation (under a scheme of Life Insurance
Corporation of India) and Provident Funds for certain employees covered under the respective Schemes are recognised in the
Statement of Profit and Loss each year.
The Company makes contributions to Provident Fund Trusts for certain employees, at a specified percentage of the employees’
salary. The Company has an obligation to make good the shortfall, if any, between the return from the investments of trust and the
notified interest rates.
A liability for a termination benefit is recognised at the earlier of when the entity can no longer withdraw the offer of the termination
benefit and when the entity recognizes any related restructuring costs.
A liability is recognised for benefits accruing to employees in respect of wages and salaries in the period the related service is
rendered.
Liabilities recognised in respect of short-term employee benefits are measured at the undiscounted amount of the benefits expected
to be paid in exchange for the related service.
Liabilities recognised in respect of other long-term employee benefits are measured at the present value of the estimated future cash
outflows expected to be made by the Company in respect of services provided by employees up to the reporting date.
Discretionary contributions made by employees or third parties reduce service cost upon payment of these contributions to the plan.
Gratuity for certain employees is covered under a Scheme of Life Insurance Corporation of India (LIC) and contributions in respect
of such scheme are recognized in the Statement of Profit and Loss. The liability as at the Balance Sheet date is provided for based on
the actuarial valuation carried out as at the end of the year.
(b) Short-term and other long-term employee benefits
Payments to defined contribution retirement benefit plans are recognised as an expense when employees have rendered service
entitling them to the contributions.
The Company has an employees’ gratuity fund managed by the Life Insurance Corporation of India (LIC).
For defined benefit retirement benefit plans, the cost of providing benefits is determined using the projected unit credit method, with
actuarial valuations being carried out at the end of each annual reporting period.
Defined benefit costs are categorized as follows:
• Service cost (including current service cost, past service cost, as well as gains and losses on curtailments and settlements);
• net interest expense or income; and
• Remeasurement
The company presents the first two components of defined benefit costs in profit or loss in the line item ‘Employee benefits
expense’.
Borrowing costs that are directly attributable to the acquisition, construction or production of a qualifying asset are capitalized as
part of the cost of that asset. Qualifying assets are assets that necessarily take a substantial period of time to get ready for their
intended use or sale. All other borrowing costs are recognised as expenses in the period in which they are incurred.
To the extent the Company borrows funds generally and uses them for the purpose of obtaining a qualifying asset, the Company
determines the amount of borrowing costs eligible for capitalization by applying a capitalization rate to the expenditure incurred on
such asset. The capitalization rate is determined based on the weighted average of borrowing costs applicable to the borrowings of
the Company which are outstanding during the period, other than borrowings made specifically towards purchase of the qualifying
asset. Investment income earned on the temporary investment of specific borrowings pending their expenditure on qualifying assets
is deducted from the borrowing costs eligible for capitalization. The amount of borrowing costs that the Company capitalizes during
a period does not exceed the amount of borrowing costs incurred during that period.

Parry Sugars Refinery India Private Limited
Notes forming part of the financial statements for the year ended March 31, 2017
(All amounts are in Rupees lakhs unless otherwise stated)
3.9 Earnings Per Share
3.10 Income taxes
Current tax
Deferred tax
Current and Deferred tax
3.11 Property, plant and equipment
Estimated useful lives of the assets are as follows:
Description of assets Estimate of Useful
Lives (yrs.)
Buildings 10-60
Plant and machinery (Continuous process) 18
Plant and equipment (General) 3-5
Furniture and fittings 10
Office equipment 5
Motor vehicles 4
Income tax expense represents the sum of the tax currently payable and deferred tax.
The tax currently payable is based on taxable profit for the year. Taxable profit differs from ‘profit before tax’ as reported in the
statement of profit and loss because of items of income or expense that are taxable or deductible in other years and items that are
never taxable or deductible. The Company’s current tax is calculated using tax rates that have been enacted or substantively enacted
by the end of the reporting period.
Deferred tax is recognised on temporary differences between the carrying amounts of assets and liabilities in the financial statements
and the corresponding tax bases used in the computation of taxable profit. Deferred tax liabilities are generally recognised for all
taxable temporary differences. Deferred tax assets are generally recognised for all deductible temporary differences to the extent that
it is probable that taxable profits will be available against which those deductible temporary differences can be utilized. Such
deferred tax assets and liabilities are not recognised if the temporary difference arises from the initial recognition (other than in a
business combination) of assets and liabilities in a transaction that affects neither the taxable profit nor the accounting profit. In
addition, deferred tax liabilities are not recognised if the temporary difference arises from the initial recognition of goodwill.
The carrying amount of deferred tax assets is reviewed at the end of each reporting period and reduced to the extent that it is no
longer probable that sufficient taxable profits will be available to allow all or part of the asset to be recovered.
Deferred tax liabilities and assets are measured at the tax rates that are expected to apply in the period in which the liability is settled
or the asset realized, based on tax rates (and tax laws) that have been enacted or substantively enacted by the end of the reporting
period.
The measurement of deferred tax liabilities and assets reflects the tax consequences that would follow from the manner in which the
Company expects, at the end of the reporting period, to recover or settle the carrying amount of its assets and liabilities.
Current and deferred tax are recognised in profit or loss, except when they relate to items that are recognised in other comprehensive
income or directly in equity, in which case, the current and deferred tax are also recognised in other comprehensive income or
directly in equity respectively. Where current tax or deferred tax arises from the initial accounting for a business combination, the
tax effect is included in the accounting for the business combination.
Land and buildings held for use in the production or supply of goods or services, or for administrative purposes, are stated in the
balance sheet at cost less accumulated depreciation and accumulated impairment losses. Freehold land is not depreciated.
Properties in the course of construction for production, supply or administrative purposes are carried at cost, less any recognised
impairment loss. Cost includes professional fees and, for qualifying assets, borrowing costs capitalized in accordance with the
Company’s accounting policy. Such properties are classified to the appropriate categories of property, plant and equipment when
completed and ready for intended use. Depreciation of these assets, on the same basis as other property assets, commences when the
assets are ready for their intended use.
Fixtures and equipment are stated at cost less accumulated depreciation and accumulated impairment losses.
Depreciation is recognised so as to write off the cost of assets (other than freehold land and properties under construction) less their
residual values over their useful lives, using the straight-line method. The estimated useful lives, residual values and depreciation
method are reviewed at the end of each reporting period, with the effect of any changes in estimate accounted for on a prospective
basis.
Assets held under finance leases are depreciated over their expected useful lives on the same basis as owned assets. However, when
there is no reasonable certainty that ownership will be obtained by the end of the lease term, assets are depreciated over the shorter of
the lease term and their useful lives.
The Company presents basic and diluted earnings / (loss) per share (EPS) data for its ordinary shares. Basic EPS is calculated by
dividing the profit or loss attributable to ordinary shareholders by the weighted average number of ordinary shares outstanding
during the period. Where ordinary shares are issued but not fully paid, they are treated in the calculation of basic earnings per share
as a fraction of an ordinary share to the extent that they were entitled to participate in dividends during the period relative to a fully
paid ordinary share. Diluted EPS is determined by adjusting the profit or loss attributable to ordinary shareholders and the weighted
average number of ordinary shares outstanding for the effects of all dilutive potential ordinary shares. To the extent that partly paid
shares are not entitled to participate in dividends during the period they are treated as the equivalent of warrants or options in the
calculation of diluted earnings per share.

Parry Sugars Refinery India Private Limited
Notes forming part of the financial statements for the year ended March 31, 2017
(All amounts are in Rupees lakhs unless otherwise stated)
3.12 Impairment of Non-Financial assets
3.13 Inventories
3.14 Provisions
Asset retirement obligation:
3.15 Financial Instruments
The Company recognizes the estimated liability for future costs to be incurred in the remediation of site restoration in regards to
plant and equipment removal and disposal thereof, only when a present legal or constructive obligation has been determined and that
such obligation can be estimated reliably. Upon initial recognition of the obligation, the corresponding costs are added to the
carrying amount of the related items of property, plant and equipment and amortized as an expense over the economic life of the
asset, or earlier if a specific plan of removal exists. This obligation is reduced every year by payments incurred during the year in
relation to these items. The obligation might be increased by any required remediation to the owned assets that would be required
through enacted legislation.
Financial assets and financial liabilities are recognised when a company entity becomes a party to the contractual provisions of the
instruments.
Financial assets and financial liabilities are initially measured at fair value. Transaction costs that are directly attributable to the
acquisition or issue of financial assets and financial liabilities (other than financial assets and financial liabilities at fair value
through profit or loss) are added to or deducted from the fair value of the financial assets or financial liabilities, as appropriate, on
initial recognition. Transaction costs directly attributable to the acquisition of financial assets or financial liabilities at fair value
through profit or loss are recognised immediately in profit or loss.
An item of property, plant and equipment is derecognized upon disposal or when no future economic benefits are expected to arise
from the continued use of the asset. Any gain or loss arising on the disposal or retirement of an item of property, plant and
equipment is determined as the difference between the sales proceeds and the carrying amount of the asset and is recognised in profit
or loss.
Useful lives, residual value and the method of depreciation charged on Property, Plant and Equipment are reviewed at each reporting
date and adjusted where necessary.
At the end of each reporting period, the Company reviews the carrying amounts of its tangible assets to determine whether there is
any indication that those assets have suffered an impairment loss. If any such indication exists, the recoverable amount of the asset is
estimated in order to determine the extent of the impairment loss (if any). When it is not possible to estimate the recoverable amount
of an individual asset, the Company estimates the recoverable amount of the cash-generating unit to which the asset belongs. When a
reasonable and consistent basis of allocation can be identified, corporate assets are also allocated to individual cash-generating units,
or otherwise they are allocated to the smallest company of cash-generating units for which a reasonable and consistent allocation
basis can be identified.
Recoverable amount is the higher of fair value less costs of disposal and value in use. In assessing value in use, the estimated future
cash flows are discounted to their present value using a pre-tax discount rate that reflects current market assessments of the time
value of money and the risks specific to the asset for which the estimates of future cash flows have not been adjusted.
If the recoverable amount of an asset (or cash-generating unit) is estimated to be less than its carrying amount, the carrying amount
of the asset (or cash-generating unit) is reduced to its recoverable amount. An impairment loss is recognised immediately in the
statement of profit or loss.
When an impairment loss subsequently reverses, the carrying amount of the asset (or a cash-generating unit) is increased to the
revised estimate of its recoverable amount, but so that the increased carrying amount does not exceed the carrying amount that would
have been determined had no impairment loss been recognised for the asset (or cash-generating unit) in prior years. A reversal of an
impairment loss is recognised immediately in profit or loss.
Inventories comprise raw sugar, white sugar, work in progress, and white sugar in finished condition. Inventories of raw-materials
are generally measured at cost, unless the white-sugar of finished goods does not have adequate realizable value to meet the cost.
Finished goods of white sugar are measured at lower of cost (determined using specific identification method) and net realizable
value. Cost comprises cost of purchase, and all directly attributable costs incurred in bringing the inventories to their present
location and condition. Net realizable value is the estimated selling price in the ordinary course of business, less the estimated costs
of completion and selling expenses.
Inventories of by-products are valued at estimated net realisable value.
Provisions are recognised when the Company has a present obligation (legal or constructive) as a result of a past event, it is probable
that the Company will be required to settle the obligation, and a reliable estimate can be made of the amount of the obligation.
The amount recognised as a provision is the best estimate of the consideration required to settle the present obligation at the end of
the reporting period, taking into account the risks and uncertainties surrounding the obligation. When a provision is measured using
the cash flows estimated to settle the present obligation, its carrying amount is the present value of those cash flows (when the effect
of the time value of money is material).
When some or all of the economic benefits required to settle a provision are expected to be recovered from a third party, a receivable
is recognised as an asset if it is virtually certain that reimbursement will be received and the amount of the receivable can be
measured reliably.

Parry Sugars Refinery India Private Limited
Notes forming part of the financial statements for the year ended March 31, 2017
(All amounts are in Rupees lakhs unless otherwise stated)
3.16 Financial Assets:
a. Classification of Financial Assets
b. Effective Interest Method
d. Impairment of Financial Assets:
e. Derecognition of financial assets
All regular way purchases or sales of financial assets are recognised and derecognized on a trade date basis. Regular way purchases
or sales are purchases or sales of financial assets that require delivery of assets within the time frame established by regulation or
convention in the marketplace.
All recognised financial assets are subsequently measured in their entirety at either amortized cost or fair value, depending on the
classification of the financial assets.
Debt instruments that meet the following conditions are subsequently measured at amortized cost (except for debt instruments that
are designated as at fair value through profit or loss on initial recognition):
• the asset is held within a business model whose objective is to hold assets in order to collect contractual cash flows; and
• the contractual terms of the instrument give rise on specified dates to cash flows that are solely payments of principal and interest
on the principal amount outstanding.
• the debt instruments carried at amortised cost include Deposits, Debtors, Loans and advances recoverable in cash.
For the impairment policy on financial assets measured at amortized cost, refer Note 3.16.d
The effective interest method is a method of calculating the amortised cost of a debt instrument and of allocating interest income
over the relevant period. The effective interest rate is the rate that exactly discounts estimated future cash receipts (including all fees
and points paid or received that forms an integral part of the effective interest rate, transaction costs and other premiums or
discounts) through the expected life of the debt instruments, or, where appropriate a shorter period, to the net carrying amount on
initial recognition.
Income is recognized on an effective interest basis for debt instruments other than those financial assets classified as at FVTPL.
Interest Income is recognized in Statement of profit or loss and is included in 'Other Income' line item.
The Company carries derivative contracts not designated in a hedge relationship at FVTPL. Financial assets at FVTPL also includes
assets held for trading.
A financial asset is held for trading if:
• it has been acquired principally for the purpose of selling it in the near term; or
• on initial recognition it is part of a portfolio of identified financial instruments that the Company manages together and has a recent
actual pattern of short-term profit-taking; or
• it is a derivative that is not designated and effective as a hedging instrument or a financial guarantee.
Financial assets at FVTPL are measured at fair value at the end of each reporting period, with any gains or losses arising on
remeasurement recognised in profit or loss. The net gain or loss recognised in profit or loss incorporates any dividend or interest
earned on the financial asset and is included in the ‘Other income’ line item. Dividend on financial assets at FVTPL is recognised
when the Company’s right to receive the dividends is established, it is probable that the economic benefits associated with the
dividend will flow to the entity, the dividend does not represent a recovery of part of cost of the investment and the amount of
dividend can be measured reliably.
The Company derecognises a financial asset when the contractual rights to the cash flows from the asset expire, or when it transfers
the financial asset and substantially all the risks and rewards of ownership of the asset to another party. If the Company neither
transfers nor retains substantially all the risks and rewards of ownership and continues to control the transferred asset, the Company
recognises its retained interest in the asset and an associated liability for amounts it may have to pay. If the Company retains
substantially all the risks and rewards of ownership of a transferred financial asset, the Company continues to recognise the financial
asset and also recognises a collateralised borrowing for the proceeds received.
On derecognition of a financial asset in its entirety, the difference between the asset’s carrying amount and the sum of the
consideration received and receivable and the cumulative gain or loss that had been recognised in other comprehensive income and
accumulated in equity is recognised in profit or loss if such gain or loss would have otherwise been recognised in profit or loss on
disposal of that financial asset.
Further, for the purpose of measuring lifetime expected credit loss allowance for trade receivables, the Company has used a practical
expedient as permitted under Ind AS 109. This expected credit loss allowance is computed based on a provision matrix which takes
into account historical credit loss experience and adjusted for forward-looking information.
Expected credit losses are the weighted average of credit losses with the respective risks of default occurring as the weights. Credit
loss is the difference between all contractual cash flows that are due to the Company in accordance with the contract and all the cash
flows that the Company expects to receive (i.e. all cash shortfalls), discounted at the original effective interest rate (or credit-adjusted
effective interest rate for purchased or originated credit-impaired financial assets). The Company estimates cash flows by
considering all contractual terms of the financial instrument through the expected life of that financial instrument.
The Company applies the expected credit loss model for recognising impairment loss on financial assets measured at amortised cost,
lease receivables, trade receivables, other contractual rights to receive cash or other financial asset, and financial guarantees not
designated as at FVTPL.
For trade receivables or any contractual right to receive cash or another financial asset that result from transactions that are within
the scope of Ind AS 11 and Ind AS 18, the Company always measures the loss allowance at an amount equal to lifetime expected
credit losses.
c. Financial Assets measured at Fair Value through Profit or loss (FVTPL):

Parry Sugars Refinery India Private LimitedNotes forming part of the financial statements for the year ended March 31, 2017
(All amounts are in Rupees lakhs unless otherwise stated)
f. Foreign exchange gains and losses
3.17 Financial liabilities and equity instruments
a. Classification as debt or equity
b. Equity instruments
c. Financial liabilities
c.1. Financial liabilities at FVTPL
c.2. Financial liabilities subsequently measured at amortised cost
c.3. Foreign exchange gains and losses
c.4. Derecognition of financial liabilities
All financial liabilities are subsequently measured at amortised cost using the effective interest method or at FVTPL.
However, financial liabilities that arise when a transfer of a financial asset does not qualify for derecognition or when the continuing
involvement approach applies, financial guarantee contracts issued by the Company, and commitments issued by the Company to
provide a loan at below-market interest rate are measured in accordance with the specific accounting policies set out below.
Financial liabilities at FVTPL includes derivative liabilities. Non-derivative financial liabilities are classified as at FVTPL when the
financial liability is either contingent consideration recognised by the Company as an acquirer in a business combination to which
Ind AS 103 applies or is held for trading or it is designated as at FVTPL. There are no non-derivative financial liabilities carried at
FVTPL.
A Financial liability is classified as held for trading if
i) It has been incurred principally for the purpose of repurchasing it in the near term; or
ii) on initial recognition it is part of a portfolio of identified financial instruments that the company manages together and has a
recent actual pattern of short-term profit taking; or
iii) it is a derivative that is not designated and effective as a hedging instrument.
Fair value is determined in the manner described in note 32.
Financial liabilities that are not held-for-trading and are not designated as at FVTPL are measured at amortized cost at the end of
subsequent accounting periods. The carrying amounts of financial liabilities that are subsequently measured at amortized cost are
determined based on the effective interest method. Interest expense that is not capitalized as part of costs of an asset is included in
the 'Finance costs' line item.
The effective interest method is a method of calculating the amortised cost of a financial liability and of allocating interest expense
over the relevant period. The effective interest rate is the rate that exactly discounts estimated future cash payments (including all
fees and points paid or received that form an integral part of the effective interest rate, transaction costs and other premiums or
discounts) through the expected life of the financial liability, or (where appropriate) a shorter period, to the net carrying amount on
initial recognition.
For financial liabilities that are denominated in a foreign currency and are measured at amortized cost at the end of each reporting
period, the foreign exchange gains and losses are determined based on the amortized cost of the instruments and are recognised in
‘Other income’.
The fair value of financial liabilities denominated in a foreign currency is determined in that foreign currency and translated at the
spot rate at the end of the reporting period. For financial liabilities that are measured as at FVTPL, the foreign exchange component
forms part of the fair value gains or losses and is recognised in profit or loss.
The Company derecognizes financial liabilities when, and only when, the Company’s obligations are discharged, cancelled or have
expired. An exchange between with a lender of debt instruments with substantially different terms is accounted for as an
extinguishment of the original financial liability and the recognition of a new financial liability. Similarly, a substantial modification
of the terms of an existing financial liability (whether or not attributable to the financial difficulty of the debtor) is accounted for as
an extinguishment of the original financial liability and the recognition of a new financial liability. The difference between the
carrying amount of the financial liability derecognized and the consideration paid and payable is recognised in profit or loss.
The fair value of financial assets denominated in a foreign currency is determined in that foreign currency and translated at the spot
rate at the end of each reporting period.
• For foreign currency denominated financial assets measured at amortized cost and FVTPL, the exchange differences are recognised
in profit or loss except for those which are designated as hedging instruments in a hedging relationship.
• Changes in the carrying amount of investments in equity instruments at FVTOCI relating to changes in foreign currency rates are
recognised in other comprehensive income.
• For the purposes of recognizing foreign exchange gains and losses, FVTOCI debt instruments are treated as financial assets
measured at amortized cost. Thus, the exchange differences on the amortized cost are recognized in profit or loss and other changes
in the fair value of FVTOCI financial assets are recognised in other comprehensive income.
Debt and equity instruments issued by the company are classified as either financial liabilities or as equity in accordance with the
substance of the contractual arrangements and the definitions of a financial liability and an equity instrument.
An equity instrument is any contract that evidences a residual interest in the assets of an entity after deducting all of its liabilities.
Equity instruments issued by a company entity are recognised at the proceeds received, net of direct issue costs.
Repurchase of the Company's own equity instruments is recognised and deducted directly in equity. No gain or loss is recognised in
profit or loss on the purchase, sale, issue or cancellation of the Company's own equity instruments.

Parry Sugars Refinery India Private LimitedNotes forming part of the financial statements for the year ended March 31, 2017
(All amounts are in Rupees lakhs unless otherwise stated)
3.18 Derivative financial instruments
a. Commodity Derivatives
b. Other Financial Derivatives
3.19 Cash flow statement
3.20 Fair Value Measurement
3.21
Overall principle
Derecognition of financial assets and financial liabilities
Classification of debt instruments
Impairment of financial assets and financial liabilities
Assessment of embedded derivatives
Determining whether an arrangement contains a lease
Decommissioning liabilities included in the cost of property, plant and equipment
First-time adoption – mandatory exceptions, optional exemptions
Appendix ‘A’ to Ind AS 16 Changes in Existing Decommissioning, Restoration and Similar Liabilities requires specified changes in
a decommissioning, restoration or similar liability to be added to or deducted from the cost of the asset to which it relates; the
adjusted depreciable amount of the asset is then depreciated prospectively over its remaining useful life., But being the first time
adopter the Company has calculated decommissioning liability at the date of transition and it is assumed that the same liability
(adjusted only for the time value of money) existed when the asset was first acquired/constructed.
The Company has applied the derecognition requirements of financial assets and financial liabilities prospectively for transactions
occurring on or after April 1, 2015 (the transition date).
The Company has determined the classification of debt instruments in terms of whether they meet the amortized cost criteria or the
FVTOCI criteria based on the facts and circumstances that existed as of the transition date.
The Company has applied the impairment requirements of Ind AS 109 retrospectively; however, as permitted by Ind AS 101, it has
used reasonable and supportable information that is available without undue cost or effort to determine the credit risk at the date that
financial instruments were initially recognised in order to compare it with the credit risk at the transition date. Further, the company
has not undertaken an exhaustive search for information when determining, at the date of transition to Ind ASs, whether there have
been significant increases in credit risk since initial recognition, as permitted by Ind AS 101.
The Company has assessed whether an embedded derivative is required to be separated from the host contract and accounted for as a
derivative on the basis of the conditions that existed at the later of the date it first became a party to the contract and the date when
there has been a change in the terms of the contract that significantly modifies the cash flows that otherwise would be required under
the contract.
The Company has applied Appendix C of Ind AS 17 Determining whether an arrangement contains a lease to determine whether an
arrangement existing at the transition date contains a lease on the basis of facts and circumstances existing at that date.
All other financial derivatives are initially recognised at fair value at the date the derivative contracts are entered into and are
subsequently remeasured to their fair value at the end of each reporting period. The resulting gain or loss is recognised in profit or
loss immediately.
The Company has prepared the opening balance sheet as per Ind AS as of April 1, 2015 (the transition date) by recognising all assets
and liabilities whose recognition is required by Ind AS, not recognising items of assets or liabilities which are not permitted by Ind
AS, by reclassifying items from previous GAAP to Ind AS as required under Ind AS, and applying Ind AS in measurement of
recognised assets and liabilities. However, this principle is subject to the certain exception and certain optional exemptions availed
by the Company as detailed below;
The Company enters into a variety of derivative financial instruments to manage its exposure to interest rate and foreign exchange
rate risks, including foreign exchange forward contracts, interest rate swaps and cross currency swaps.
Non derivative financial liabilities: Fair value, which is determined for disclosure purposes, is calculated based on the present value
of future principal and interest cash flows, discounted at the market rate of interest at the reporting date.
Some of the company's commodity derivatives are treated as own use contracts, since they are both entered into, and continue to be
held in accordance with the entity's purchase, sale or usage requirements, and the Company takes physical delivery of the commodity
concerned. 'Own use' contracts are scoped out from the requirements under Ind AS 109. Hence such contracts have been identified
and are not recognized in books. Contracts other than 'own use' contracts i.e. where there is no physical delivery involved are treated
as 'held for trading' and marked to market through income statement.
Cash flows are reported using the indirect method, whereby profit / (loss) before extraordinary items and tax is adjusted for the
effects of transactions of non-cash nature and any deferrals or accruals of past or future cash receipts or payments. The cash flows
from operating, investing and financing activities of the Company are segregated based on the available information.
In a number of areas, accounting policies and disclosures being made by the Company require the determination of fair value, for
both financial and non-financial assets and liabilities. Fair Value is the price that would be received to sell an asset or paid to transfer
a liability in an orderly transaction between market participants at the measurement date.
For purpose of fair value disclosures, the Company has determined classes of assets and liabilities on the basis of the nature,
characteristics and risks of the asset or liability, and the fair value hierarchy.
Fair values have been determined for measurement and disclosure purposes based on the following method:
Investments in Mutual Funds: The fair value of these financial assets is determined by reference to their quoted price at the
reporting date. When the fair value of the financial asset cannot be measured reliably, it is measured at cost.
Derivatives: The fair value of forward exchange contracts is based on their quoted price. The fair value of cross currency swaps that
involves interest is determined by using appropriate valuation models.
Parry Sugars Refinery India Private Limited
Notes forming part of the financial statements for the year ended March 31, 2017
(All amounts are in Rupees lakhs unless otherwise stated)
3.22
Critical judgements in applying accounting policies
Revenue recognition
Determination of functional currency
Key sources of estimation uncertainty
Fair value measurements and valuation processes
Useful life of Property, Plant and Equipments
In making their judgement, the directors considered the past purchase and sale patterns, business plans of the company and also
considers data from Hedge desk team to evaluate the contracts that are scoped out.
The following are the key assumptions concerning the future, and other key sources of estimation uncertainty at the end of the
reporting period that may have a significant risk of causing a material adjustment to the carrying amounts of assets and liabilities
within the next financial year.
Some of the Company’s assets and liabilities are measured at fair value for financial reporting purpose.
In estimating the fair value of an asset or a liability, the Company uses market-observable data to the extent it is available. Where
Level 1 inputs are not available, the Company engages third party qualified valuers to perform the valuation. The CFO works closely
with the qualified external valuers to establish the appropriate valuation techniques and inputs to the model. Information about the
valuation techniques and inputs used in determining the fair value of various assets and liabilities are disclosed in notes 3 and 32.
As described in note 3.11 above, the company reviews the estimated useful lives of the property, plant and equipment at the end of
each reporting period. During the current year, the directors determined that the useful lives of all the assets in the property, plant
and equipment with respect to previous year shall remain unchanged.
Critical accounting judgements and key sources of estimation uncertainty
In the application of the Company's accounting policies, which are described in above notes, the directors of the Company are
required to make judgements,estimates and assumptions about the carrying amounts of assets and liabilities that are not readily
apparent from other sources. The estimates and associated assumptions are based on historical experience and other factors that are
considered to be relevant. Actual results may differ from these estimates.
The estimates and underlying assumptions are reviewed on an ongoing basis. Revisions to accounting estimates are recognised in the
period in which the estimate is revised if the revision affects only that period, or in the period of the revision and future periods if the
revision affects both current and future periods.
The following are the critical judgements, apart from those involving estimations, that the directors have made in the process of
applying the Company's accounting policies and that have the most significant effect on the amounts recognised in the financial
statements.
In making their judgement, the directors considered the detailed criteria for the recognition of revenue from the sale of goods set out
in Ind AS 18 and, in particular, whether the Company had transferred to the buyer the significant risks and rewards of ownership of
the goods.
In making their judgement, the directors considered the detailed scenario for the determination of USD as functional currency on the
basis of criteria laid down in Ind AS 21 and, in particular in which currency major purchases and sales are made.
Identifying non financial derivative instruments entered into and continued to be held for receipt or delivery of a non-financial
item in accordance with the entity's expected purchase, sale or usage requirements

Parry Sugars Refinery India Private Limited
Notes forming part of the financial statements for the year ended March 31, 2017
(All amounts are in Rupees lakhs unless otherwise stated)
4 Tangible Assets
Buildings Plant and Equipment Office Equipment Furniture and Fixtures Vehicles Total
INR INR INR INR INR INR
I. Cost or Deemed CostBalance as at 1 April, 2015 11,002.17 30,170.55 7.11 31.67 3.37 41,214.87
Additions 2,728.82 647.58 2.54 1.26 - 3,380.20
Effect of foreign currency translation from functional
currency to reporting currency660.62 1,811.58 0.43 1.90 0.20 2,474.73
Balance as at 31 March, 2016 14,391.61 32,629.71 10.08 34.83 3.57 47,069.80
Additions 253.84 1,113.74 16.79 6.71 0.24 1,391.32
Disposals - - (0.54) - (0.35) (0.89)
Effect of foreign currency translation from functional
currency to reporting currency
(304.68) (690.79) (0.75) (0.74) (0.36) (997.32)
Balance as at 31 March, 2017 14,340.77 33,052.66 25.58 40.80 3.10 47,462.91
II. Accumulated depreciation and impairment for the
Balance as at 1 April, 2015 - - - - - -
Depreciation / amortisation expense for the year 450.97 2,123.48 2.94 5.11 2.60 2,585.10
Effect of foreign currency translation from functional
currency to reporting currency5.60 26.40 0.04 0.06 0.04 32.14
Balance as at 31 March, 2016 456.57 2,149.88 2.98 5.17 2.64 2,617.24
Depreciation / amortisation expense for the year 559.84 2,221.85 11.07 5.53 0.17 2,798.46
Depreciation on disposals during the year - - (0.29) - (0.29) Effect of foreign currency translation from functional
currency to reporting currency(25.07) (111.61) (8.05) (0.29) - (145.02)
Balance as at 31 March, 2017 991.34 4,260.12 5.71 10.41 2.81 5,270.39
III.Carrying Amount
Balance as at 1 April, 2015 11,002.17 30,170.55 7.11 31.67 3.37 41,214.87
Additions 2,728.82 647.58 2.54 1.26 - 3,380.20
Depreciation (450.97) (2,123.48) (2.94) (5.11) (2.60) (2,585.10)Effect of foreign currency translation from functional
currency to reporting currency655.02 1,785.19 0.39 1.84 0.17 2,442.60
Balance as at 31 March, 2016 13,935.04 30,479.84 7.10 29.66 0.93 44,452.57
Additions 253.84 1,113.74 16.79 6.71 0.24 1,391.32
Disposals - - (0.25) - (0.35) (0.60)
Depreciation (559.84) (2,221.85) (11.07) (5.53) (0.17) (2,798.46)
Effect of foreign currency translation from functional
currency to reporting currency(279.61) (579.18) 7.30 (0.45) (0.36) (852.30)
Balance as at 31 March, 2017 13,349.43 28,792.54 19.87 30.39 0.29 42,192.53
4.01 Refer to note 14 and 17 for details of charge on fixed assets.
Description of Assets

Parry Sugars Refinery India Private Limited
Notes forming part of the financial statements for the year ended March 31, 2017
(All amounts are in Rupees lakhs unless otherwise stated)
4.02 Property, Plant and Equipment and Capital Work In Progress
As at March 31, 2017 As at March 31, 2016 As at April 1, 2015
INR INR INR
Carrying amounts of:
Buildings 13,349.43 13,935.04 11,002.17
Plant and equipment 28,792.54 30,479.84 30,170.55
Furniture and Fixtures 30.39 29.66 31.67
Office Equipments 19.87 7.10 7.11
Vehicles 0.29 0.93 3.37
42,192.53 44,452.57 41,214.87
Capital Work in Progress 355.92 196.84 63.53
5 Deferred tax assets
As at March 31, 2017 As at March 31, 2016 As at April 1, 2015
INR INR INR
Deferred Tax Liability:
Depreciation 6,568.07 6,562.08 5,976.34
Total 6,568.07 6,562.08 5,976.34
Deferred Tax Asset:
Tax losses 6,366.30 5,964.76 5,385.57
Employee benefit obligations 7.56 12.50 5.95
Allowance for doubtful debts – trade receivables 180.71 362.58 362.58
Provision for decommissioning liability 13.50 222.24 222.24
Total 6,568.07 6,562.08 5,976.34
Set-off of deferred tax liabilities pursuant to set-off provisions 6,568.07 6,562.08 5,976.34
Net deferred tax assets - - -
5.01
5.02
6 Other Financial Assets
A. Non Current:
As at March 31, 2017 As at March 31, 2016 As at April 1, 2015
INR INR INR
Carried at amortised cost:
Security Deposits with related parties*
- Unsecured, considered good 118.68 105.17 186.41
Unsecured deposit
considered doubtful
Other Deposits 46.87 46.87 46.87
Less : Allowance for bad and doubtful deposits (46.87) (46.87) (46.87)
TOTAL 118.68 105.17 186.41
Particulars
Particulars
Particulars
* The security deposit is against land taken on operating lease from "Parry Infrastructure Company Private Limited" (A fellow
subsidiary).
The unabsorbed business loss and depreciation as at the balance sheet dates have given rise to deferred tax asset aggregating to Rs.
23,525.61 Lakhs (Previous Year.:Rs 21,549.95 Lakhs ) However since the entity has a history of recent losses, the entity recognises a
deferred tax asset arising from unused tax losses or tax credits only to the extent that the entity has sufficient taxable temporary
differences or there is convincing other evidence that sufficient taxable profit will be available against which the unused tax losses or
unused tax credits can be utilised by the entity, accordingly the same has been recognised only to the extent of deferred tax liability (net)
resulting in "Nil" deferred tax asset/ liability as on 31st March, 2017 .
The Company is registered as a unit under SEZ and shall claim 50% exemption from income tax under Section 10AA of the Income Tax
Act, 1961 (IT Act) from FY 2015-16 and such exemption is available only up to financial year ending March 31, 2020.
Parry Sugars Refinery India Private Limited
(All amounts are in Rupees lakhs unless otherwise stated)
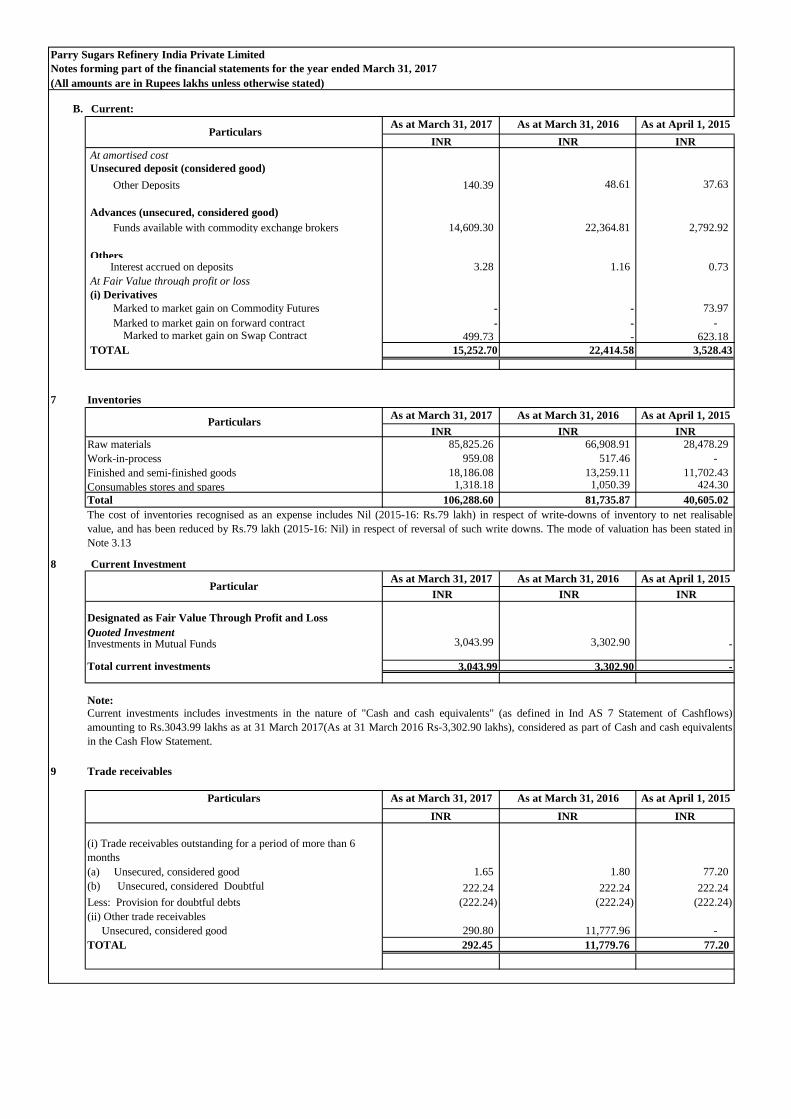
B. Current:
As at March 31, 2017 As at March 31, 2016 As at April 1, 2015
INR INR INR
At amortised cost
Unsecured deposit (considered good)
Other Deposits 140.39 48.61 37.63
Advances (unsecured, considered good)
Funds available with commodity exchange brokers 14,609.30 22,364.81 2,792.92
Others Interest accrued on deposits 3.28 1.16 0.73
At Fair Value through profit or loss
(i) Derivatives
Marked to market gain on Commodity Futures - - 73.97
Marked to market gain on forward contract - - - Marked to market gain on Swap Contract 499.73 - 623.18
TOTAL 15,252.70 22,414.58 3,528.43
7 Inventories
As at March 31, 2017 As at March 31, 2016 As at April 1, 2015
INR INR INR
Raw materials 85,825.26 66,908.91 28,478.29
Work-in-process 959.08 517.46 -
Finished and semi-finished goods 18,186.08 13,259.11 11,702.43
Consumables stores and spares 1,318.18 1,050.39 424.30
Total 106,288.60 81,735.87 40,605.02
8 Current Investment
As at March 31, 2017 As at March 31, 2016 As at April 1, 2015
INR INR INR
Designated as Fair Value Through Profit and Loss
Quoted InvestmentInvestments in Mutual Funds 3,043.99 3,302.90 -
Total current investments 3,043.99 3,302.90 -
Note:
9 Trade receivables
As at March 31, 2017 As at March 31, 2016 As at April 1, 2015
INR INR INR
(i) Trade receivables outstanding for a period of more than 6
months
(a) Unsecured, considered good 1.65 1.80 77.20
(b) Unsecured, considered Doubtful 222.24 222.24 222.24
Less: Provision for doubtful debts (222.24) (222.24) (222.24)
(ii) Other trade receivables
Unsecured, considered good 290.80 11,777.96 -
TOTAL 292.45 11,779.76 77.20
Notes forming part of the financial statements for the year ended March 31, 2017
Particular
Particulars
Current investments includes investments in the nature of "Cash and cash equivalents" (as defined in Ind AS 7 Statement of Cashflows)
amounting to Rs.3043.99 lakhs as at 31 March 2017(As at 31 March 2016 Rs-3,302.90 lakhs), considered as part of Cash and cash equivalents
in the Cash Flow Statement.
Particulars
Particulars
The cost of inventories recognised as an expense includes Nil (2015-16: Rs.79 lakh) in respect of write-downs of inventory to net realisable
value, and has been reduced by Rs.79 lakh (2015-16: Nil) in respect of reversal of such write downs. The mode of valuation has been stated in
Note 3.13

Parry Sugars Refinery India Private Limited
(All amounts are in Rupees lakhs unless otherwise stated)
9.01 Movement in the allowance for doubtful debts
Particulars
Balance at beginning of the year (222.24) (222.24)
Foreign exchange translation gains and losses - -
Balance at end of the year (222.24) (222.24)
9.02
10 Cash and Cash Equivalents
Particulars As at March 31, 2017 As at March 31, 2016 As at April 1, 2015
INR INR INR
Cash and bank balances
Cash in hand 0.20 0.23 0.20
Balances with banks
In current account 1,677.87 2,054.02 11.52
In deposit accounts with original maturity of less than 3 months - - -
Total Cash and and Cash equivalents (As per Ind AS 7:
Statement of Cash flows) 1,678.07 2,054.25 11.72
Other bank balances
Deposit accounts with original maturity period of more than three
months 5,816.80 16.80 15.87
Total Cash and cash equivalent 7,494.87 2,071.05 27.59
Note:
10.01 Cash and cash equivalents here includes cash in hand and in banks excluding overdraft.
10.02 Details of Specified Bank Notes held and transacted during the period from 08/11/2016 to 30/12/2016:
Particulars Specified Bank Notes Other denomination notes
INR Lakhs INR Lakhs
Closing cash in hand as on 08.11.2016 0.08 0.01
(+) Permitted receipts 0.15
(-) Permitted payments 0.08 0.08
(-) Amount deposited in Banks
Closing cash in hand as on 30.12.2016 - 0.07
10.03 Non-cash transactions
The maximum credit period on sale of goods is 60 days. No interest is charged on trade receivable beyond 60 days. The company mostly deals
with the commodity exchange registered dealers. Before accepting any new customer for sales other than mentioned above, the company uses
publicly available financial information and its own trading records to assess the potential customer's credit quality .
Notes forming part of the financial statements for the year ended March 31, 2017
During the current year, the Company has converted 10% 11,300,000 cumulative redeemable preference shares of Rs. 100/- and 8% 2,800,000
cumulative redeemable preference shares of Rs.100/- each respectively aggregating to Rs. 14,100 lakhs into 104,444,445 equity shares of Rs.10/-
each at premium of Rs.3.50/- per share. Refer Note 12.04
For the year ended
March 31, 2017 (INR)
For the year ended March
31, 2016 (INR)
During the year, the Company had specified bank notes or other denomination note as defined in the MCA notification G.S.R.308€ dated March
31, 2017 on the details of Specified Bank Notes (SBN) held and transacted during the period from November 08, 2016 to December 30, 2016,
the denomination wise SBNs and other notes as per the notification is given below:

11 Other non-current and current assets
As at March 31,
2017
As at March 31,
2016
As at April 1,
2015
INR INR INR
A. NON CURRENT
(a) Security deposit
Deferred Expense arising from Interest free deposits
carried at amortised cost 1,021.99 1,070.66 2,238.65
(b) Balances with government authorities (other
than income taxes)
Deposits with Government Authorities 26.51 26.51 21.22
(c) Loans and Advances
Advance income tax(net of provision for
income tax - Nil (Previous Year - Nil) 185.35 184.93 27.98
Total 1,233.85 1,282.10 2,287.85
B. CURRENT
(a) Advances to suppliers
- Unsecured, considered good 814.00 484.38 1,043.32
- Unsecured and considered doubtful 315.71 315.71 315.71
Less : Provision for doubtful advances (315.71) (315.71) (315.71)
(b) Deferred losses on Commodity future
contracts 6,711.21 2,826.60 -
(b) Balances with government authorities (other
than income taxes)
Service Tax Recoverable 36.40 21.60 10.74
VAT Recoverable 0.93 - -
(c) Prepayments
Prepaid expenses 11.60 18.01 3.63
Total 7,574.14 3,350.59 1,057.69
11.01
12
Amount Amount Amount
INR INR INR
Authorised Share capital:
Equity Shares of Rs.10 each 320,000,000 32,000.00 170,000,000 17,000.00 120,000,000 12,000.00
Redeemable Preference Shares of Rs.100 each - - 15,000,000 15,000.00 17,000,000 17,000.00
Issued, Subscribed and Fully Paid:
Equity Shares of Rs.10 each 270,725,670 27,072.57 166,281,225 16,628.12 116,281,225 11,628.12
Total 270,725,670 27,072.57 166,281,225 16,628.12 116,281,225 11,628.12
Notes:
12.01 Increase in Authorised Share Capital
12.02 Reclassification of Authorised Share Capital
Parry Sugars Refinery India Private Limited
Notes forming part of the financial statements for the year ended March 31, 2017
(All amounts are in Rupees lakhs unless otherwise stated)
Particulars
Equity
During the year ended March 2017, the authorised share capital of the company was reclassed as follows:
170,000,000 Equity shares of Rs 10 each amounting to Rs 1,700,000,000 and 15,000,000 Preference shares of Rs 100 each amounting to Rs 1,500,000,000 has
been reclassified into 320,000,000 equity shares of Rs 10 each amounting to Rs 3,200,000,000.
As at April 1, 2015
No. of shares
Advances to suppliers (unsecured, considered good) as at 31, March 2017 includes INR 42.27 lakhs dues from the holding company E.I.D Parry (India)
Limited.
During the year ended March 2016, the authorised share capital of the Company was reclassed and increased in the case of equity shares and decreased in the
case of preference shares as follows:
a) 120,000,000 Equity Shares of Rs.10 each to 170,000,000 Equity Shares of Rs 10 each.
b) 17,000,000 Preference Shares of Rs 100 each to 15,000,000 Preference shares of Rs 100 each.
No. of sharesParticulars
No. of shares
As at March 31, 2017 As at March 31, 2016
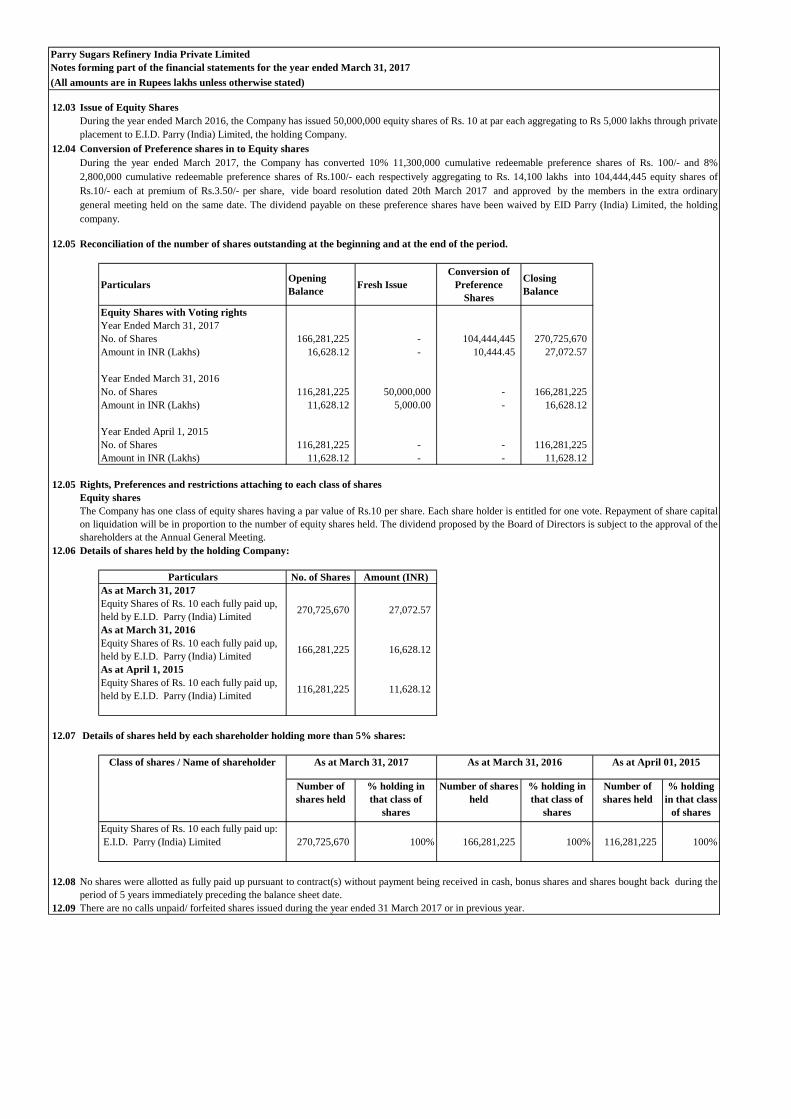
(All amounts are in Rupees lakhs unless otherwise stated)
12.03
12.04
12.05 Reconciliation of the number of shares outstanding at the beginning and at the end of the period.
ParticularsOpening
BalanceFresh Issue
Conversion of
Preference
Shares
Closing
Balance
Equity Shares with Voting rights
Year Ended March 31, 2017
No. of Shares 166,281,225 - 104,444,445 270,725,670
Amount in INR (Lakhs) 16,628.12 - 10,444.45 27,072.57
Year Ended March 31, 2016
No. of Shares 116,281,225 50,000,000 - 166,281,225
Amount in INR (Lakhs) 11,628.12 5,000.00 - 16,628.12
Year Ended April 1, 2015
No. of Shares 116,281,225 - - 116,281,225
Amount in INR (Lakhs) 11,628.12 - - 11,628.12
12.05 Rights, Preferences and restrictions attaching to each class of shares
Equity shares
12.06
Particulars No. of Shares Amount (INR)
As at March 31, 2017
Equity Shares of Rs. 10 each fully paid up,
held by E.I.D. Parry (India) Limited 270,725,670 27,072.57
As at March 31, 2016
Equity Shares of Rs. 10 each fully paid up,
held by E.I.D. Parry (India) Limited 166,281,225 16,628.12
As at April 1, 2015
Equity Shares of Rs. 10 each fully paid up,
held by E.I.D. Parry (India) Limited 116,281,225 11,628.12
12.07
Number of
shares held
% holding in
that class of
shares
Number of shares
held
% holding in
that class of
shares
Number of
shares held
% holding
in that class
of shares
Equity Shares of Rs. 10 each fully paid up:
E.I.D. Parry (India) Limited 270,725,670 100% 166,281,225 100% 116,281,225 100%
12.08
12.09 There are no calls unpaid/ forfeited shares issued during the year ended 31 March 2017 or in previous year.
Notes forming part of the financial statements for the year ended March 31, 2017
Parry Sugars Refinery India Private Limited
No shares were allotted as fully paid up pursuant to contract(s) without payment being received in cash, bonus shares and shares bought back during the
period of 5 years immediately preceding the balance sheet date.
Issue of Equity Shares
During the year ended March 2016, the Company has issued 50,000,000 equity shares of Rs. 10 at par each aggregating to Rs 5,000 lakhs through private
placement to E.I.D. Parry (India) Limited, the holding Company.
Conversion of Preference shares in to Equity shares
During the year ended March 2017, the Company has converted 10% 11,300,000 cumulative redeemable preference shares of Rs. 100/- and 8%
2,800,000 cumulative redeemable preference shares of Rs.100/- each respectively aggregating to Rs. 14,100 lakhs into 104,444,445 equity shares of
Rs.10/- each at premium of Rs.3.50/- per share, vide board resolution dated 20th March 2017 and approved by the members in the extra ordinary
general meeting held on the same date. The dividend payable on these preference shares have been waived by EID Parry (India) Limited, the holding
company.
The Company has one class of equity shares having a par value of Rs.10 per share. Each share holder is entitled for one vote. Repayment of share capital
on liquidation will be in proportion to the number of equity shares held. The dividend proposed by the Board of Directors is subject to the approval of the
shareholders at the Annual General Meeting.
Details of shares held by the holding Company:
Details of shares held by each shareholder holding more than 5% shares:
Class of shares / Name of shareholder As at March 31, 2017 As at March 31, 2016 As at April 01, 2015

Parry Sugars Refinery India Private Limited
Notes forming part of the financial statements for the year ended March 31, 2017
(All amounts are in Rupees lakhs unless otherwise stated)
13 Other Equity
As at March 31, 2017 As at March 31, 2016
INR INR
(a) Securities Premium Account
Opening balance 30,741.44 30,741.44
Add :Addition on Conversion of Preference
shares (Refer Note 12.04)3,655.56 -
Closing balance 34,397.00 30,741.44
(b) Debenture Redemption Reserve
Opening balance - -
Add Transfer from Retained Earnings 1,415.66 -
Closing balance 1,415.66 -
(c) Retained Earnings
Opening Balance (58,116.14) (52,562.95)
Add: (Loss) / Profit for the year 1,415.66 (5,553.19)
Less: Transfer to Debenture Redemption Reserve (1,415.66)
Closing Balance (58,116.14) (58,116.14)
(d) Foreign Currency Translation Reserve
Opening balance (472.61) -
Add :Addition during the period 78.45 (472.61)
Closing balance (394.16) (472.61)
(e) Other Items of other comprehensive income
Opening balance 3.89 -
Remeasurements of post-employment benefit
obligation, net of tax 1.10 3.89
Closing balance 4.99 3.89
Total Other Equity (a+b+c+d+e) (22,692.66) (27,843.42)
Note:
(i) Securities Premium Reserve
(ii) Debenture Redemption Reserve
(iii) Retained Earnings
(iv) Foreign Currency Translation Reserve
The amount that can be distributed by the Company as dividends to its equity shareholders is
determined considering the requirements of the Companies Act, 2013.
Exchange differences relating to the translation of the assets and liabilities, Income or expenses from
functional currency in to presentation currency is recognised directly in the foreign currency translation
reserve.
Debenture redemption reserve is created as per the statutory requirements to maintain funds to repay the
debenture liability. These will be subsequently transferred to Retained Earnings on payment of the
debenture liability.
Particulars
Securities premium reserve is used to record the premium on issue of shares. The reserve is utilised in
accordance with the provisions of Companies Act, 2013.
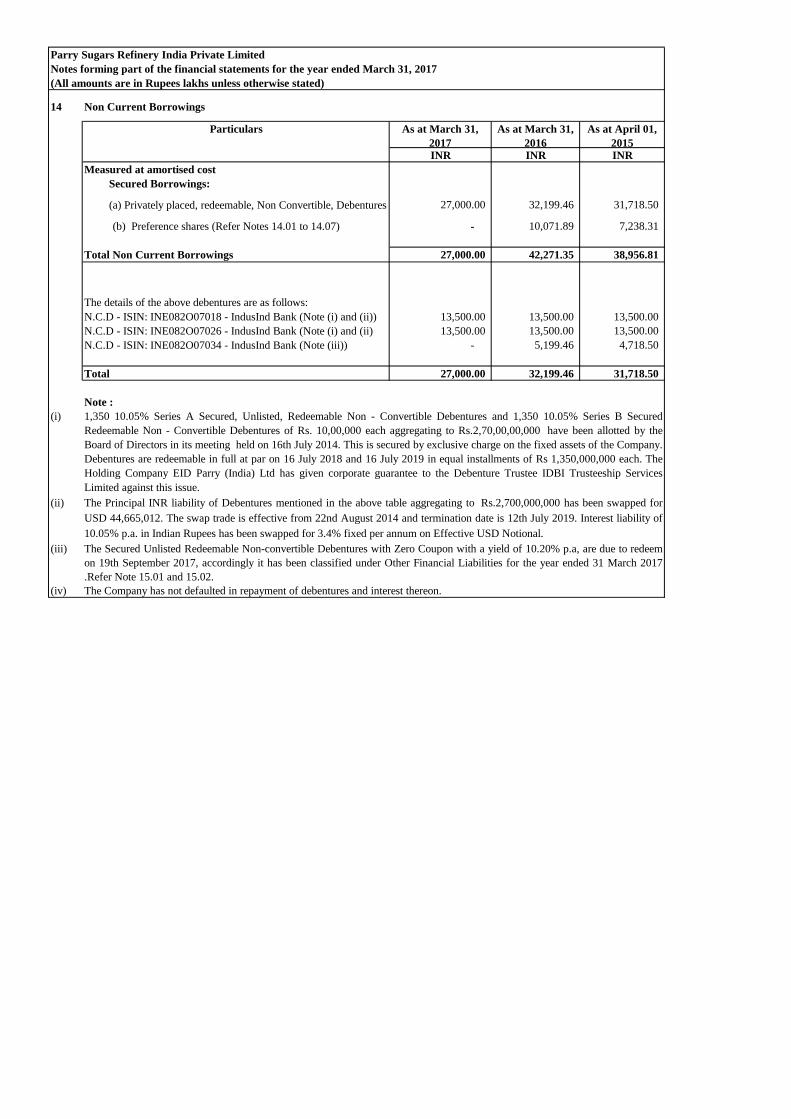
Parry Sugars Refinery India Private Limited
(All amounts are in Rupees lakhs unless otherwise stated)
14 Non Current Borrowings
As at March 31,
2017
As at March 31,
2016
As at April 01,
2015INR INR INR
Measured at amortised cost
Secured Borrowings:
(a) Privately placed, redeemable, Non Convertible, Debentures 27,000.00 32,199.46 31,718.50
(b) Preference shares (Refer Notes 14.01 to 14.07) - 10,071.89 7,238.31
Total Non Current Borrowings 27,000.00 42,271.35 38,956.81
13,500.00 13,500.00 13,500.00
N.C.D - ISIN: INE082O07026 - IndusInd Bank (Note (i) and (ii) 13,500.00 13,500.00 13,500.00
N.C.D - ISIN: INE082O07034 - IndusInd Bank (Note (iii)) - 5,199.46 4,718.50
Total 27,000.00 32,199.46 31,718.50
Note :
(i)
(ii)
(iii)
(iv)
The Principal INR liability of Debentures mentioned in the above table aggregating to Rs.2,700,000,000 has been swapped for
USD 44,665,012. The swap trade is effective from 22nd August 2014 and termination date is 12th July 2019. Interest liability of
10.05% p.a. in Indian Rupees has been swapped for 3.4% fixed per annum on Effective USD Notional.
The Secured Unlisted Redeemable Non-convertible Debentures with Zero Coupon with a yield of 10.20% p.a, are due to redeem
on 19th September 2017, accordingly it has been classified under Other Financial Liabilities for the year ended 31 March 2017
.Refer Note 15.01 and 15.02.
The Company has not defaulted in repayment of debentures and interest thereon.
Notes forming part of the financial statements for the year ended March 31, 2017
N.C.D - ISIN: INE082O07018 - IndusInd Bank (Note (i) and (ii))
The details of the above debentures are as follows:
Particulars
1,350 10.05% Series A Secured, Unlisted, Redeemable Non - Convertible Debentures and 1,350 10.05% Series B Secured
Redeemable Non - Convertible Debentures of Rs. 10,00,000 each aggregating to Rs.2,70,00,00,000 have been allotted by the
Board of Directors in its meeting held on 16th July 2014. This is secured by exclusive charge on the fixed assets of the Company.
Debentures are redeemable in full at par on 16 July 2018 and 16 July 2019 in equal installments of Rs 1,350,000,000 each. The
Holding Company EID Parry (India) Ltd has given corporate guarantee to the Debenture Trustee IDBI Trusteeship Services
Limited against this issue.

Parry Sugars Refinery India Private Limited
(All amounts are in Rupees lakhs unless otherwise stated)
14.01
Amount Amount
INR INR
Issued, Subscribed and Fully Paid:
10% Redeemable Cumulative Preference shares of Rs.100 each - 11,300,000 11,300.00 11,300,000 11,300.00
8% Redeemable Cumulative Preference shares of Rs.100 each
(Refer Note 14.02) - 2,800,000 2,800.00 - -
Total 14,100,000 14,100.00 11,300,000 11,300.00
14.02
14.03
14.04 Reconciliation of Issued, subscribed and paid up Preference Shares
ParticularsAs at March 31,
2017 (INR)
As at March 31, 2016
(INR)
As at April 1, 2015
(INR)
Total Issued, subscribed and paid up preference shares as per Note
14.01- 14,100.00 11,300.00
Shown in Balance sheet as:
Non Current Borrowings (At amortised cost) - 10,071.89 7,238.31
Other Non Financial Liabilities Deferred Revenue arising from
Preference shares carried at amortised cost (Note 19)- 4,028.11 4,061.69
Total - 14,100.00 11,300.00
14.05 Reconciliation of the number of preference shares outstanding at the beginning and at the end of the period.
Particulars Opening Balance Fresh Issue Conversion to
Equity
(Note 12.04)
Closing Balance
Redeemable, Cumulative Preference Shares
Year Ended March 31, 2017
No. of Shares 14,100,000 (14,100,000) -
Amount in INR (Lakhs) 14,100.00 (14,100.00) -
Year Ended March 31, 2016
No. of Shares 11,300,000 2,800,000 14,100,000
Amount in INR (Lakhs) 11,300.00 2,800.00 14,100.00
Year Ended April 1, 2015
No. of Shares 11,300,000 - 11,300,000
Amount in INR (Lakhs) 11,300.00 - 11,300.00
14.06 Rights, Preference and restrictions attaching to each class of shares
(i)
(ii)
14.07
Number of
shares held
% holding in that
class of shares
Number of shares
held
% holding in
that class of
shares
Preference Shares of Rs. 100 each fully paid up:
E.I.D. Parry (India) Limited 14,100,000 100% 11,300,000 100%
During the year ended March 2016, the Company has issued 8% Cumulative Redeemable Preference Shares of Rs. 100 each aggregating to Rs 280,000,000 to E.I.D-
Parry (India) Limited, the holding Company. These shares along with the pro rata dividend (if any) shall be redeemed on expiry of 36 months from the date of
allotment. These redeemable preference shares do not contain any equity component.
During the year 8% Cumulative Redeemable Preference Shares of Rs. 100/- each aggregating to Rs 280,000,000 , and 10% 1,13,00,000 cummulative redeemable
preference shares of Rs. 100/- each respectively aggregating to Rs. 141,00,00,000 were converted in to 10,44,44,445 equity shares of Rs.10/- each issued at premium of
Rs.3.50/- per share during the year ended on March 2017.These redeemable preference shares do not contain any equity component.
Notes forming part of the financial statements for the year ended March 31, 2017
Particulars
As at March 31, 2016 As at April 1, 2015
No. of shares No. of shares
Details of Issued, Subscribed and Fully paid Preference Shares
As at March 31,
2017
10% Redeemable Cumulative Preference shares of Rs.100 each - These shares shall confer the holders thereof, the right to a fixed preferential dividend (cumulative in
nature and payable in arrears) from the date of allotment at a rate of 10 %, on the capital being paid up. These shares are redeemable at par at the end of 5 years from
the date of allotment. However the right to receive dividend has been waived by EID Parry (India) Limited, the holding company.
8% Redeemable Cumulative Preference shares of Rs.100 each - These shares shall confer the holders thereof, the right to a fixed preferential dividend (cumulative in
nature and payable in arrears) from the date of allotment at a rate of 8 %, on the capital being paid up. These shares are redeemable at par at the end of 3 years from the
date of allotment. However the right to receive dividend has been waived by EID Parry (India) Limited, the holding company.
Details of shares held by each shareholder holding more than 5% shares:
Class of shares / Name of shareholder
As at March 31, 2016 As at April 01, 2015

Parry Sugars Refinery India Private Limited
15 Other Financial Liabilities
As at March
31, 2017
As at March
31, 2016
As at April
01, 2015
INR INR INR
Current
(i) Other Financial Liabilities Measured at amortised cost
(a) Current Maturities of Long-term debt (Note 15.01 and 15.02) 5,727.98 - -
(b) Interest accrued but not due on borrowings 2,079.73 2,099.20 1,940.75
(c) Payables on purchase of Fixed Assets - 293.21 64.99
(d) Other Payables 1.00
(ii) Other Financial Liabilities Measured at FVTPL
(a) Derivatives
Marked to Market Liability on Swap Contracts - 1,170.09 -
Marked to Market Liability on Commodity Contracts 5,639.08 1,394.10 -
Marked to Market Liability on Forward Contracts - - 11.74
Total Current other financial liability 13,447.79 4,956.60 2,017.48
15.01
15.02
16 Provisions
As at March
31, 2017
As at March
31, 2016
As at April
01, 2016
INR INR INR
A. Long term provisions:
Provision for employee benefits
Provisions for compensated absences (Also refer note 29 c) 20.48 7.74 -
Provision for decommissioning liability 43.69 38.72 34.31
Total Long term Provisions 64.17 46.46 34.31
B. Short term provisions:
Provision for employee benefits
Provisions for compensated absences( Also refer note 29 c) 1.67 1.17 5.95
Provision for tax - - 15.44
Total Short term Provisions: 1.67 1.17 21.39
Movement in provisions
As at March
31, 2017
As at March
31, 2016
INR INR
Provisions for compensated absences (Current and Non current)
Opening Balance 8.91 5.95
Current Service Cost 5.69 1.91
Interest Expense or Cost 0.71 0.46
Re-measurement (or Actuarial) (gain)/loss 7.99 0.98
Benefits paid (1.16) (0.39)
Closing Balance 22.15 8.91
Provision for tax (Current)
Opening Balance - 15.44
Utilisation during the year - (15.44)
Closing Balance - -
Provision for decommissioning liability (Non Current)
Opening Balance 38.72 34.31
Addition during the year 4.97 4.41
Closing Balance 43.69 38.72
Particulars
(All amounts are in Rupees lakhs unless otherwise stated)
Notes forming part of the financial statements for the year ended March 31, 2017
Particulars
Particulars
The allotment of 600 Secured Unlisted Redeemable Non-convertible Debentures with Zero Coupon with a yield of
10.20% p.a.; having 3 years tenor aggregating to Rs. 4,482.19 lakhs has been approved by the Board of Directors in its
meeting held on 19th September 2014. The debenture has been discounted for Rs. 1,517.80 lakhs It is secured by First
Charge on the fixed assets of the Company with an asset cover of 1.25 times (based on market value) at all times during
the tenure of the debentures. The due date for redemption is 19th September 2017. The Holding Company EID Parry
(India) Ltd has given corporate guarantee to the Debenture Trustee IDBI Trusteeship Services Limited against this issue.
The Principal INR liability of Debentures mentioned in the above table aggregating to Rs.4,482.19 lakhs (Carried at
amortised cost Rs 5,727.98 lakhs) has been swapped for USD 72.76 lakhs. The swap trade is effective from 19th
September 2014 and maturity date is 19th September 2017. Interest liability of 10.20% p.a. in Indian Rupees has been
swapped for 3.84% fixed per annum on Effective USD Notional.
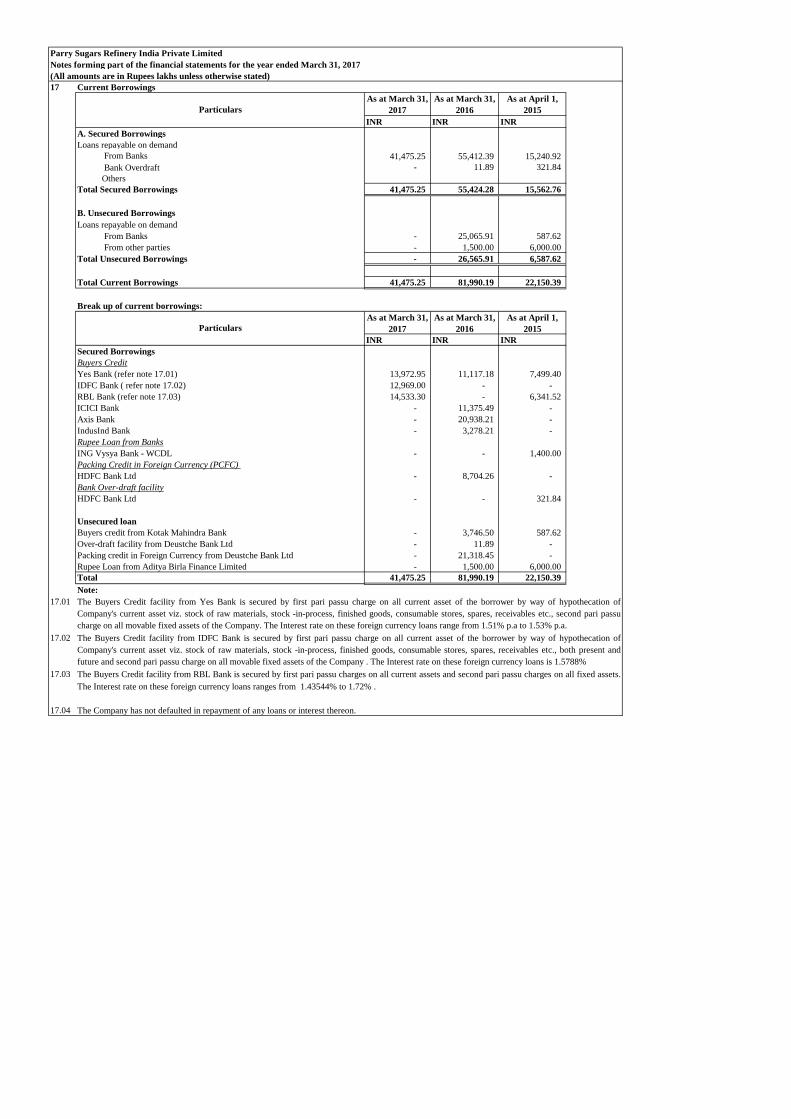
Parry Sugars Refinery India Private Limited
17 Current Borrowings
As at March 31,
2017
As at March 31,
2016
As at April 1,
2015
INR INR INR
A. Secured Borrowings
Loans repayable on demand
From Banks 41,475.25 55,412.39 15,240.92
Bank Overdraft - 11.89 321.84
Others
Total Secured Borrowings 41,475.25 55,424.28 15,562.76
B. Unsecured Borrowings
Loans repayable on demand
From Banks - 25,065.91 587.62
From other parties - 1,500.00 6,000.00
Total Unsecured Borrowings - 26,565.91 6,587.62
Total Current Borrowings 41,475.25 81,990.19 22,150.39
Break up of current borrowings:
As at March 31,
2017
As at March 31,
2016
As at April 1,
2015
INR INR INR
Secured Borrowings
Buyers Credit
Yes Bank (refer note 17.01) 13,972.95 11,117.18 7,499.40
IDFC Bank ( refer note 17.02) 12,969.00 - -
RBL Bank (refer note 17.03) 14,533.30 - 6,341.52
ICICI Bank - 11,375.49 -
Axis Bank - 20,938.21 -
IndusInd Bank - 3,278.21 -
Rupee Loan from Banks
ING Vysya Bank - WCDL - - 1,400.00
Packing Credit in Foreign Currency (PCFC)
HDFC Bank Ltd - 8,704.26 -
Bank Over-draft facility
HDFC Bank Ltd - - 321.84
Unsecured loan
Buyers credit from Kotak Mahindra Bank - 3,746.50 587.62
Over-draft facility from Deustche Bank Ltd - 11.89 -
Packing credit in Foreign Currency from Deustche Bank Ltd - 21,318.45 -
Rupee Loan from Aditya Birla Finance Limited - 1,500.00 6,000.00
Total 41,475.25 81,990.19 22,150.39
Note:
17.01
17.02
17.03
17.04
Particulars
The Company has not defaulted in repayment of any loans or interest thereon.
The Buyers Credit facility from Yes Bank is secured by first pari passu charge on all current asset of the borrower by way of hypothecation of
Company's current asset viz. stock of raw materials, stock -in-process, finished goods, consumable stores, spares, receivables etc., second pari passu
charge on all movable fixed assets of the Company. The Interest rate on these foreign currency loans range from 1.51% p.a to 1.53% p.a.
The Buyers Credit facility from IDFC Bank is secured by first pari passu charge on all current asset of the borrower by way of hypothecation of
Company's current asset viz. stock of raw materials, stock -in-process, finished goods, consumable stores, spares, receivables etc., both present and
future and second pari passu charge on all movable fixed assets of the Company . The Interest rate on these foreign currency loans is 1.5788%
The Buyers Credit facility from RBL Bank is secured by first pari passu charges on all current assets and second pari passu charges on all fixed assets.
The Interest rate on these foreign currency loans ranges from 1.43544% to 1.72% .
Notes forming part of the financial statements for the year ended March 31, 2017
(All amounts are in Rupees lakhs unless otherwise stated)
Particulars

Parry Sugars Refinery India Private Limited
Notes forming part of the financial statements for the year ended March 31, 2017
(All amounts are in Rupees lakhs unless otherwise stated)
18 Trade Payables
Current:
As at March 31,
2017
As at March 31,
2016
As at April 1,
2015
INR INR INR
Trade payable for goods and services 97,327.54 48,426.31 31,888.79
Trade payable (Employee related) 94.49 92.86 48.59
Total trade payables 97,422.03 48,519.17 31,937.38
18.01 Trade payable for goods and services includes INR 76.19 lakhs due to the holding company E.I.D Parry India Ltd.
18.02
18.03
19 Other Non Financial Liabilities
As at March 31,
2017
As at March 31,
2016
As at April 1,
2015
INR INR INR
A. Non Current
Deferred Revenue arising from Preference shares carried at amortised cost - 4,028.11 4,061.69
Gratuity payable (Also refer note 29 b) 2.30 - -
Total Non Current other Non financial liability 2.30 4,028.11 4,061.69
B. Current
Statutory remittances (Contributions to PF, Withholding Taxes, VAT) 54.61 90.09 55.82
Gratuity payable (Also refer note 29 b) - 3.59 6.71
Total Current other Non financial liability 54.61 93.68 62.53
20 Revenue from Operations
For the year
ended March
31, 2017
For the year
ended March 31,
2016
INR INR
Revenue from sale of goods 184,132.19 110,610.99
Other operating income 553.85 3,925.34
Total Revenue from Operations 184,686.04 114,536.33
20.01
For the year
ended March
31, 2017
For the year
ended March 31,
2016
INR INR
Export Sales:
Sugar 182,064.64 109,392.65
PP Bags 75.29 39.07
Domestic Sales:
Molasses 1,595.29 644.32
Power 396.97 534.95
184,132.19 110,610.99
Particulars
Particulars
Particulars
Classes of Products-Sales
There are no dues to enterprises as defined under Micro, Small and Medium Enterprises Development Act, 2006, as at March 31, 2017, March 31,
2016 and March 31, 2015 which is on the basis of such parties having been identified by the management and relied upon by the auditors.
The average credit period is 30 days and there is no interest outstanding on amount outstanding for more than 30 days. The company has financial risk
management policies in place to ensure that all payables are paid within the pre agreed credit terms.

Parry Sugars Refinery India Private Limited
Notes forming part of the financial statements for the year ended March 31, 2017
(All amounts are in Rupees lakhs unless otherwise stated)
20.02
For the year
ended March
31, 2017
For the year
ended March
31, 2016
INR INR
Realised Gains on commodity futures - 3,432.74
Despatch Money earnings 260.77 274.18
Scrap Sales 0.06 33.27
Liabilities no longer required written back - 185.15
Contract cancellation charges 293.02 -
553.85 3,925.34
21 Other Income
For the year
ended March
31, 2017
For the year
ended March
31, 2016INR INR
Interest Income
On Financial Assets at Amortised Cost 17.86 99.17
Dividend Income
On Financial Assets at FVTPL (Mutual Funds) 231.87 36.86
Net Gain on derecognition of financial assets measured at amortized cost - 305.09
Net gain on foreign currency transactions and translations 441.55 1,971.62
Profit on sale of assets 1.11 -
Gain on Swap Interest and Principal Settlement 2,419.52 1,590.62
Interest Income recognized on Redeemable preference shares carried at
amortised cost- 729.34
Net gain arising on financial assets designated as at FVTPL 45.49 -
Total Other Income 3,157.40 4,732.70
22 Cost of materials consumed
For the year
ended March
31, 2017
For the year
ended March
31, 2016
INR INR
Material consumed comprises of :
Raw Sugar 158,379.73 100,035.19
Coal 3,210.80 2,686.60
Total 161,590.53 102,721.79
23 Changes in inventories of finished goods, work-in-progress and stock-in-trade
For the year
ended March
31, 2017
For the year
ended March
31, 2016
INR INR
Inventories at the end of the year:
Finished goods 18,186.08 13,259.11
Work-in-progress 959.08 517.46
19,145.16 13,776.57
Inventories at the beginning of the year:
Finished goods 13,259.11 11,702.43
Work-in-progress 517.46 -
13,776.57 11,702.43
Foreign currency translation (485.80) 719.51
Net Increase (5,854.39) (1,354.63)
24 Employee Benefits Expense
For the year
ended March
31, 2017
For the year
ended March
31, 2016
INR INR
Salaries and wages, including bonus 473.17 358.65
Contribution to provident and other funds (Refer note 29 a) 37.85 25.41
Staff welfare expenses 132.85 101.18
Total Employee Benefit Expense 643.87 485.24
Particulars
Other operating income
Particulars
Particulars
Particulars

(All amounts are in Rupees lakhs unless otherwise stated)25 Finance Cost
For the year
ended March
31, 2017
For the year
ended March
31, 2016
INR INR
Interest Expenses:
- On Borrowings 4,053.23 4,468.75
- On zero coupon debentures 528.98 475.05
Interest Expense recognized on Redeemable preference shares carried at
Amortised cost- 729.34
Other borrowing costs 759.03 621.90
Total finance costs 5,341.24 6,295.04
25.01 Note
26 Other Expenses
For the year
ended March
31, 2017
For the year
ended March
31, 2016
INR INR
Consumption of Stores, Spares and Consumables 4,102.33 2,827.81
Freight and Forwarding 1,865.64 434.95
Power and Fuel 226.15 268.93
Water Charges 519.43 361.80
Repairs and Maintenance - Machinery 1,949.19 1,309.51
Repairs and Maintenance - Buildings 450.32 323.52
Repairs and Maintenance - Others 749.58 680.19
Audit Fee (Refer note:27) 7.35 7.74
Communication Expenses 14.16 10.36
Insurance 91.70 68.09
Professional and Outsourcing Expenses 1,000.56 767.00
Printing and Stationery 11.81 4.55
Rates and Taxes 298.58 109.58
Rent 1,314.67 1,727.68
Material Handling Expenses 857.92 1,635.67
Selling Expenses 2,893.70 2,040.61
Travelling Expense 90.93 90.02
Unwinding of Decommissioning costs 4.98 4.35
Net realised losses on commodity futures 1,013.95 -
Marked to Market losses on commodity futures 4,422.36 1,394.10
Miscellaneous expenses 22.76 23.22
Total Other Expenses 21,908.07 14,089.68
27 For the year
ended March
31, 2017
For the year
ended March
31, 2016INR INR
Statutory audit 4.50 4.50
Tax audit 0.75 0.50
Other services 2.10 2.74
Total 7.35 7.74
28.01 Reconciliation of tax expense and the accounting profit multiplied
by India’s tax rate: For the year
ended March
31, 2017
For the year
ended March
31, 2016INR INR
Profit from operations before income tax expense 1,415.66 (5,553.19)
Tax at the Indian tax rate of 30.90% (2015-2016 – 30.90%) 437.44 -
Tax effect of amounts which are not deductible (taxable) in calculating
taxable income:
Effect of unused tax losses and tax offsets not recognised as deferred tax
assets
(437.44) -
Income tax expense - -
28.02 Tax losses
For the year
ended March
31, 2017
For the year
ended March
31, 2016
INR INR
Unused tax losses for which no deferred tax asset has been recognised 68,352.69 70,169.90
Potential tax benefit @ 30.9% 21,120.98 21,682.50
Notes forming part of the financial statements for the year ended March 31, 2017
Parry Sugars Refinery India Private Limited
Particulars
Particulars
Particulars
Payments to the statutory auditors comprises of (net of service tax):
Particulars
Other borrowing costs includes commitment charges, loan processing charges, guarantee charges, loan
facilitation charges and other ancillary costs incurred in connection with borrowings.


Parry Sugars Refinery India Private Limited
(All amounts are in Rupees lakhs unless otherwise stated)
29 Employee benefits
(a) Defined Contribution Plan
For the year
ended 31
March, 2017
For the year
ended 31
March, 2016
INR INR
Employers contribution to Provident Fund 20.69 14.36
Employers contribution to Superannuation Fund 17.16 11.15
(b) Defined Benefit Plans:
Gratuity
Defined benefit plans – as per actuarial valuation on 31st March, 2017
March 31,2017 March 31,2016
INR INR
I. Net Asset/(Liability) recognised in the Balance Sheet
as at 31st March
1. Present value of defined benefit obligation as at 31st
March 15.44 11.67
2. Fair value of plan assets as at 31st March 13.14 8.09
3. Surplus/(Deficit) 2.30 3.59
4. Current portion of the above - 3.59
5. Non current portion of the above 2.30 -
II. Change in the obligation during the year ended 31st
March
1. Present value of defined benefit obligation at the
beginning of the year 11.67 12.37
2. Expenses Recognised in Profit and Loss Account
- Current Service Cost 4.32 3.34
- Interest Expense (Income) 0.93 0.92
3. Benefit payments (0.38) (1.63)
4. Remeasurement or Actuarial (gain)/loss arising from:
'-change in financial assumption 1.18 -
'- experience variance (2.28) (3.33)
5. Present value of defined benefit obligation at the end of
the year 15.44 11.67
Particulars
Particulars
Gratuity - Funded Plan
The Company makes Provident Fund and Superannuation Fund contributions which are defined contribution plans, for
qualifying employees. Under the Schemes, the Company is required to contribute a specified percentage of the payroll costs to
fund the benefits. The contributions payable to these plans by the Company are at rates specified in the rules of the schemes.
During the year the following amounts have been recognised in the Profit and loss Statement on account of defined contribution
The Company operates a gratuity plan covering qualifying employees. The benefit payable is the greater of the amount
calculated as per the Payment of Gratuity Act, 1972 or the Company scheme applicable to the employee. The benefit vests upon
completion of five years of continuous service and once vested it is payable to employees on retirement or on termination of
employment. In case of death while in service, the gratuity is payable irrespective of vesting. The Company makes annual
contribution to the Company gratuity scheme administered by the Life Insurance Corporation of India through its Gratuity Trust
Fund.
The Company is exposed to various risks in providing the above gratuity benefit which are as follows:
Interest Rate risk : The plan exposes the Company to the risk of fall in interest rates. A fall in interest rates will result in an
increase in the ultimate cost of providing the above benefit and will thus result in an increase in the value of the liability (as
shown in financial statements).
Investment Risk : The probability or likelihood of occurrence of losses relative to the expected return on any particular
investment.
Salary Escalation Risk : The present value of the defined benefit plan is calculated with the assumption of salary increase rate
of plan participants in future. Deviation in the rate of increase of salary in future for plan participants from the rate of increase in
salary used to determine the present value of obligation will have a bearing on the plan's liability.
Demographic Risk : The Company has used certain mortality and attrition assumptions in valuation of the liability. The
Company is exposed to the risk of actual experience turning out to be worse compared to the assumption.
Notes forming part of the financial statements for the year ended March 31, 2017

Parry Sugars Refinery India Private Limited
Notes forming part of the financial statements for the year ended March 31, 2017
(All amounts are in Rupees lakhs unless otherwise stated)
III. Change in fair value of assets during the year ended
31st March
1. Fair value of plan assets at the beginning of the year 8.09 5.66
2. Investment Income 0.65 0.42
4. Contributions by employer 4.78 3.08
5. Benefit payments (0.38) (1.63)
6. Return on plan assets excluding amount recognised in net
interest expense - 0.56
Fair value of plan assets at the end of the year 13.14 8.09
Current Service Cost 4.32 3.34
Net interest expense 0.29 0.50 Expenses recognised in the income statement 4.60 3.84
Actuarial gains/ (losses)
-Changes in financial assumptions 1.18 -
-experience variance (2.28) (3.33)
Return on plan assets, excluding amount recognised in net
interest expense - (0.56)
Expenses recognised in other comprehensive income (1.10) (3.89)
Total expenses recognised during the period 3.50 (0.04)
V. The Major categories of plan assets
- LIC Trusts
VI. Actuarial assumptions
1. Discount rate 7.25% 8%
2. Expected rate of return on plan assets 7.25% 8%
3. Attrition rate 5% 5%
4. Salary escalation rate 6% 6%
5. Mortality rate
VII. Experience Adjustments :
1. Defined Benefit Obligation 15.44 11.67
2. Fair value of plan assets 13.14 8.09
3. Surplus/(Deficit) (2.30) (3.59)
4. Experience adjustment on plan liabilities [(Gain)/Loss] (1.10) (3.33)
5. Experience adjustment on plan assets [Gain/(Loss)] - (0.56)
VIII. Sensitivity Analysis :
March 31,2017 March 31,2016
Discount rate (-/+1%)
- 1% increase 13.88 10.51
- 1% decrease 17.26 13.04
Salary growth rate
- 1% increase 16.93 12.82
- 1% decrease 14.13 10.48
Attrition rate
- increase of 50% of attrition rate 15.40 11.75
- decrease of 50% of attrition rate 15.32 11.45
Mortality rate
- increase of 10% of mortality rate 15.44 11.68
- decrease of 10% of mortality rate 15.43 11.67
INR (Lakhs)Particulars
The remeasurement of the net defined benefit liability is included in other comprehensive income.
IV.Amounts recognised in comprehensive income in
respect of these defined benefit plans are as follows:
IALM (2006-2008) Ultimate
The current service cost and the net interest expense for the year are included in the 'Employee benefits expense' line item in the
statement of profit and loss.
Significant actuarial assumptions for the determination of the defined benefit obligation are discount rate, expected salary
increase and mortality. The sensitivity analysis below have been determined based on reasonably possible changes of the
assumptions occurring at the end of the reporting period, while holding all other assumptions constant. The results of sensitivity
analysis is given below:

Parry Sugars Refinery India Private Limited
Notes forming part of the financial statements for the year ended March 31, 2017
(All amounts are in Rupees lakhs unless otherwise stated)
IX. Effect of Plan on Entity's Future Cash Flows:
a) Funding arrangements and Funding Policy
b) Expected Contribution during the next annual reporting period
c) Maturity Profile of Defined Benefit Obligation
d) Expected cash flows over the next (valued on undiscounted basis): INR
1 year 0.52
2 to 5 years 3.92
6 to 10 years 6.76
More than 10 years 29.28
(c) Long Term Compensated Absences
The assumption used for computing the accumulated compensated absences on actuarial basis are as follows:
Discount rate 8% 8%
Attrition Rate 5% 5%
Expected rate of salary increases 6% 6%
Mortality
30 Basic earnings per share
For the year
ended
31 March, 2017
For the year
ended
31 March, 2016
Profit / (loss) for the year attributable to owners of the
Company (INR Lakhs)
1,415.66 (5,553.19)
Number of Equity Shares of Rs.10 each outstanding at the
beginning of the year (Nos)
166,281,225 116,281,225
Number of Equity Shares of Rs.10 each outstanding at the
end of the year (Nos)
270,725,670 166,281,225
Weighted average number of equity shares (b) (Nos) 164,632,244 141,281,225
Basic and Diluted Earnings Per Share (a/b) (INR) 0.86 (3.93)
Note:
30.01
30.02
31 Financial Instruments
31.01 Capital Management
As at 31, March
2017
As at 31, March
2016
As at 01,
April 2015
INR INR INR
Debt* 68,475.25 124,261.54 61,107.20
Cash and Cash equivalents 7,494.87 2,071.05 27.59
Net debt 60,980.38 122,190.49 61,079.61
Total equity** 4,379.91 (11,215.30) (10,193.39)
Net debt to equity ratio 13.92 (10.89) (5.99)
* Debt includes all long term and short term borrowings (excluding derivatives).
The Company has purchased an insurance policy to provide for payment of gratuity to the employees. Every year, the insurance
company carries out a funding valuation based on the latest employee data provided by the Company. Any deficit in the assets
arising as a result of such valuation is funded by the Company.
The Company's best estimate of the contribution expected to be paid to the plan during the next year is Rs. 8.31 lakhs which is
equivalent as per exchange rate existing on the end of reporting period.
Weighted average duration (based on discounted cashflows) - 11 years
The Basic earnings per share are computed by dividing the net loss attributable to equity shareholders for the year by the
weighted average number of equity shares during the year. There are no potential equity shares hence the Basic and Diluted
earnings per share are the same.
During the year ended March 2017, the Company's preference shares have been converted in to 10,44,44,445 equity shares of
Rs.10/- each (Refer note: 12.04) there by increasing the issued capital by that amount.
Particulars
Particulars
Particulars
IALM (2006-2008) Ultimate
2016-17 2015-16
The Company manages its capital to ensure that it will able to continue as going concern while maintaining the return to
stakeholders through the optimization of the debt and equity balance. The Company is not subject to any externally imposed
capital requirements. Consistent with others in the industry, the Company monitors capital on the basis of the following gearing
ratio: Net debt (total borrowings net of cash and cash equivalents) divided by Total ‘equity’ (as shown in the balance sheet).
The Company has invested the plan assets with the insurer managed funds. The insurance company has invested the plan assets
in Government Securities, Debt Funds, Equity shares, Mutual Funds, Money Market Instruments and Time Deposits. The
expected rate of return on plan asset is based on expectation of the average long term rate of return expected on investments of
the fund during the estimated term of the obligation. Fair value of plan assets is determined on the basis of their market prices.
** Equity includes equity capital, securities premium and all other reserves attributable to the equity shareholders of the
Company.
The gearing ratios at the end of reporting period were as follows :

Parry Sugars Refinery India Private Limited
Notes forming part of the financial statements for the year ended March 31, 2017
(All amounts in lakhs unless otherwise stated)
31.02 Categories of financial instruments
As at 31,
March 2017
As at 31, March
2016
As at 01, April
2015
INR INR INR
Financial Asset
Measured at amortised costs
a) Cash and Bank Balances 7,494.87 2,071.05 27.59
b)Other financial asset 15,164.10 34,299.51 3,094.89
Measured at Fair value through Profit or Loss(FVTPL)
a) Designated as at FVTPL (Investments in Mutual Funds) 3,043.99 3,302.90 -
b) Derivative Instruments designated as at FVTPL 499.73 - 697.15
Financial Liabilities
Measured at amortised costs
a) Trade payables 97,422.03 48,519.17 31,937.38
b) Current Borrowings 41,475.25 81,990.19 22,150.39
c) Long term Borrowings 27,000.00 42,271.35 38,956.81
d) Other Financial liabilities 7,808.71 2,392.41 2,005.74
Measured at Fair value through Profit or Loss(FVTPL)
a) Derivative Instruments designated as at FVTPL 5,639.08 2,564.19 11.74
Financial risk management objectives
Credit Risk
Market Risk
Currency Risk
As at 31, March
2017
As at 31,
March 2016
As at 01, April
2015
INR INR INR
Trade Payables INR 4,364.52 2,398.51 66.90
Trade Payables EUR 15.64 15.64 3,855.51
Secured Borrowings INR 32,727.98 32,199.46 31,718.50
Preference Share Capital INR - 10,071.89 7,238.31
Unsecured Borrowings INR - 1,500.00 7,721.84
Other financial liabilities INR 2,080.73 2,392.41 2,005.74
Trade Receivables INR 186.42 242.33 77.20
Cash and Cash Equivalents INR 7,494.87 2,071.05 27.59
Current Investment INR 3,043.99 3,302.90 -
Advances and other financial assets INR 262.35 154.94 298.74
Currency risk is the risk that the fair value or future cash flows of a financial instrument will fluctuate because of changes in the foreign exchange rate. The Company
undertakes transactions denominated in foreign currencies; consequently, exposures to exchange rate fluctuation arise. Exchange rate exposures are managed within
approved policy parameters utilising forward foreign exchange contracts.
The carrying amounts of the Company's foreign currency denominated monetary assets and monetary liabilities at the end of the reporting period are as
follows.
Note: The secured borrowings are hedged to protect against foreign currency fluctuation risk through a cross currency swap contract. Refer Note 14(ii) and 17.05 for
details of swap contract. All other foreign currency assets and liabilities are not hedged as at the year end. During the year ended 31 March 2017, there is partial closure
of swap, however the same will not have any adverse impact on the financial position of the entity.
Particulars
Particulars Currency
The Company has adequate internal processes to assess, monitor and manage financial risks. These risks include market risk (including price risk, currency risk, interest
rate risk), credit risk and liquidity risk.
The Company seeks to minimise the effects of these risks by using financial instruments such as commodity futures, foreign currency forward contracts, interest and
currency swaps to hedge risk exposures and appropriate risk management policies as detailed below. The use of these financial instruments is governed by the Company's
policies approved by the Board of Directors, which provide written principles on price risk, foreign exchange risk, interest rate risk, credit risk and the investment of
excess liquidity. The Company does not enter into trade financial instruments, including derivative financial instruments, for speculative purposes.
The Company's risk management is carried out by a central treasury department under policies approved by the board of directors. The board provides written principles
for overall risk management, as well as policies covering specific areas, such as foreign exchange risk, interest rate risk, credit risk, use of derivative financial instruments
and non-derivative financial instruments, and investment of excess liquidity.
Most of the sales are made to registered dealers with commodity exchange. Credit sales are only made to trusted parties/dealers and credit risk for each customer is
established based on past experience with the customer. Based on the management's evaluation of customer credit risks, the company may opt for securing sales through
letter of credits. Hence the credit risk is very minimal. The company has reviewed its collection patterns in the past and there has been no bad debt experience.
Accordingly no provision has been made in books.
The Company's activities expose it primarily to the financial risks of changes in foreign currency exchange rates and price risk. The objective of market risk management
is to manage and control market risk exposures within acceptable parameters, while optimising the return. The Company enters into variety of derivatives to manage
market risk including:
i) Non Financial Derivatives such as commodity futures to mitigate the price risks associated with movement in sugar prices.
ii) Forward foreign exchange contracts and Cross Currency Swaps to hedge the exchange rate risks
Market risk exposures are measured using sensitivity analysis. There has been no change to the Company's exposure to market risks or the manner in which these risks
are being managed and measured.

Parry Sugars Refinery India Private Limited
Notes forming part of the financial statements for the year ended March 31, 2017
(All amounts are in Rupees lakhs unless otherwise stated)
As at the end of the reporting period, the company had the following fixed rate borrowings hedged against interest rate swap contracts :
As at 31, March
2017
As at 31,
March 2016
As at 01, April
2015
INR INR INR
Debentures carried at amortised cost 10.07% 32,727.98 32,199.46 31,718.50
Fixed Interest Rate Swap carried at FVTPL (Marked to Market
value)3.46% 499.73 (1,170.09) 73.97
Sensitivity Analysis
March 31,
2017March 31, 2016 April 01, 2015
March 31,
2017
March 31,
2016
April 01,
2015
Impact on Profit or loss for the year (7.76) 17.79 N.A (6.35) 14.56 N.A
Impact on total Equity as at the end of the reporting period (7.76) 17.79 N.A (6.35) 14.56 N.A
Commodity Price Risk
As at March
31, 2017
As at March 31,
2016
As at March
31, 2017
As at March
31, 2016
INR INR INR INR
Raw sugar
Less than 1 year 49,933.06 20,206 5,463.84 (2,046)
In 1 to 2 year 3,047.15 - 165.55 -
In 2 to 3 year 446.37 - 9.69 -
White Sugar
Less than 1 year - 34,477 - 3,440
March 31,
2017March 31, 2016 April 01, 2015
March 31,
2017
March 31,
2016
April 01,
2015
Impact on Profit or loss for the year (4,623.95) 1,566.53 N.A 4,623.95 (1,566.53) N.A
Impact on total Equity as at the end of the reporting period (4,623.95) 1,566.53 N.A 4,623.95 (1,566.53) N.A
Other price risk
Impact on INR (-10% change) Impact on INR (+10% change)
The table below illustrates the sensitivity of the Company’s commodity pricing contracts as at 31 March to the price movement of commodities:
Particulars
The Company's sensitivity to foreign currency has changed due to decrease in financial liability and increase in financial asset denominated in foreign currency with
respect to previous period.
This sensitivity analysis is without considering hedged items.
Weighted
average
interest rate
Particulars
Impact on INR (-10% change)
The Company's currency exposures in respect of foreign currency monetary items at each period end presented that result in net currency gains and losses in the income
statement and equity arise principally from movement in INR exchange rates. At each period end, if INR had weakened by 10% against the functional currency (USD),
with all other variables held constant, the changes in profit or loss will be as summarised in the following table. 10% is the sensitivity rate used when reporting to foreign
currency risk internally to key management personnel and represents management's assessment of the reasonably possible change in foreign exchange rates.
This is mainly attributable to the exposure outstanding on INR receivables and payables in the Company at the end of the reporting period.
The company does not have significant sensitivities in respect of accounting for it on-balance sheet commodity contracts.
Disclosure of Commodity Exchange positions outstanding as of March 31, 2017
Particulars
Booking Price at ExchangeFair value at the end of
reporting period
Other price risk represents the risk that the fair value of future cash flows of a financial instrument will fluctuate because of changes in market prices (other than those
arising from interest rate risk or currency risk), whether those changes are caused by factors specific to the individual financial instruments or its issuer, or factors
affecting all similar financial instruments traded in the market. However the management believes that the such risk is minimal with nil or insignificant impact on
Company's performance.
Impact on INR (+10% change)
The majority of forward physical contracts and commodity derivatives have original maturities of less than three years.
In management’s opinion, the sensitivity analysis is unrepresentative of the inherent foreign exchange risk because the exposure at the end of the reporting period does
not reflect the exposure during the year.
Exposure to the market prices of the raw sugar procured and white sugar sold is managed through the use of commodity futures and other hedging instruments, including
options primarily to convert floating or indexed prices to fixed prices. The use of such contracts to hedge commodity exposures is governed by the company's risk
management policies and continuously monitored by the Trade desk team. Commodity derivatives also provides a way to meet customer's pricing requirements whilst
achieving a price structure consistent with the company's over all pricing strategy.
Commodity Price Risk arises from the procurement of white sugar and sale of refined sugar and the consequent exposure to changes in market prices.
Some of the company's commodity derivatives are treated as own use contracts, since they are both entered into, and continue to be held in accordance with the entity's
purchase, sale or usage requirements, and the Company takes physical delivery of the commodity concerned. 'Own use' contracts are scoped out from the requirements
under Ind AS 109. Hence such contracts have been identified and are not recognized in books. Contracts other than 'own use' contracts i.e. where there is no physical
delivery involved are treated as 'held for trading' and marked to market through income statement.
Particulars

Notes forming part of the financial statements for the year ended March 31, 2017
(All amounts are in Rupees lakhs unless otherwise stated)
Interest Rate risk
Sensitivity analysis
Credit Risk
Liquidity Risk
Weighted
average
interest rate
Less than 1 Year 1 to 3 yearsMore than 3
years
% INR INR INR
31-Mar-17
Non-interest bearing
- Trade payables 97,422.03 - -
Fixed interest rate instruments
-Current borrowings 47,475.25 - -
-Non current borrowings 10.08% 2,713.50 31,070.25 -
-Preference Share Capital - - -
Other financial liabilities 162.69 -
Total 147,773.47 31,070.25 -
31-Mar-16
Non-interest bearing
- Trade payables 48,519.17 - -
Fixed interest rate instruments
-Current borrowings 81,990.19 - -
'-Non current borrowings 10.08% 2,713.50 24,927.00 14,856.76
-Preference Share Capital - 1,100.00 13,000.00
Other financial liabilities 474.37 - -
Total 133,697.24 26,027.00 27,856.76
01-Apr-15
Non-interest bearing
- Trade payables 31,937.38 - -
Fixed interest rate instruments
-Current borrowings 22,150.39 - -
'-Non current borrowings 10.08% 2,713.50 11,427.00 31,070.25
-Preference Share Capital 11,300.00
Other financial liabilities 2,005.74 - -
Total 58,807.01 11,427.00 42,370.25
The changes in interest rates which may be due to revision in base lending rates in case of fixed rate short term borrowings very rare and minimal. Hence there is no
significant impact due to changes in interest rates for short term borrowings. Long term borrowings are not subject to interest rate risk being debentures at fixed interest
which are further swapped against its cash flow exposures.
Credit Risk refers to the risk that a counterparty will default on its contractual obligations resulting in financial loss to the Company. Credit risk arises from cash and cash
equivalents, investments carried at amortised cost and deposits with banks and financial institutions, as well as credit exposures to wholesale customers including
outstanding receivables. For receivables; the Company mostly deals with exchange registered dealers. The exchange clearing house used is one of the world’s largest
capitalized financial institutions with excellent long-term credit ratings. The Company's exposure and credit ratings of its counterparties are continuously monitored and
the aggregate value of transactions concluded is spread amongst approved counterparties.
The credit risk on liquid funds and derivative financial instruments is limited because the counterparties are banks with high credit-ratings assigned by international credit-
agencies.
Prudent liquidity risk management implies maintaining sufficient cash and marketable securities and the availability of funding through an adequate amount of committed
credit facilities to meet obligations when due and to close out market positions. The group treasury maintains flexibility in funding by maintaining availability under
committed credit lines. The Company manages liquidity risk by maintaining adequate reserves, banking facilities and reserve borrowing facilities, by continuously
monitoring forecast and actual cash flows, and by matching the maturity profiles of financial assets and liabilities.
Particulars
The following tables detail the Company's remaining contractual maturity for its non-derivative financial liabilities with agreed repayment periods. The tables have been
drawn up based on the undiscounted cash flows of financial liabilities based on the earliest date on which the Company can be required to pay. The tables include both
interest and principal cash flows.
The contractual maturity is based on the earliest date on which the Company may be required to pay.
The Company has availed the borrowings (both Short term and Long Term) at the fixed rates and hence the company is not exposed to interest rate risk.
Parry Sugars Refinery India Private Limited
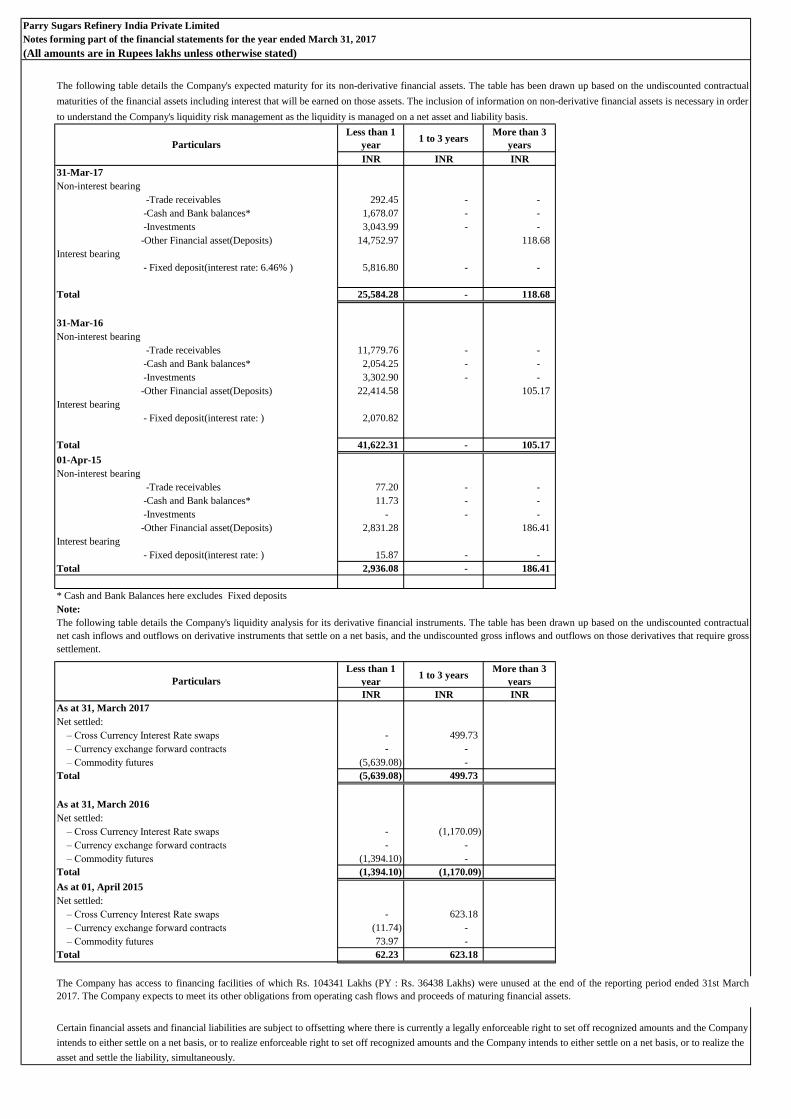
Parry Sugars Refinery India Private Limited
Notes forming part of the financial statements for the year ended March 31, 2017
(All amounts are in Rupees lakhs unless otherwise stated)
Less than 1
year1 to 3 years
More than 3
years
INR INR INR
31-Mar-17
Non-interest bearing
-Trade receivables 292.45 - -
-Cash and Bank balances* 1,678.07 - -
-Investments 3,043.99 - -
-Other Financial asset(Deposits) 14,752.97 118.68
Interest bearing
- Fixed deposit(interest rate: 6.46% ) 5,816.80 - -
Total 25,584.28 - 118.68
31-Mar-16
Non-interest bearing
-Trade receivables 11,779.76 - -
-Cash and Bank balances* 2,054.25 - -
-Investments 3,302.90 - -
-Other Financial asset(Deposits) 22,414.58 105.17
Interest bearing
- Fixed deposit(interest rate: ) 2,070.82
Total 41,622.31 - 105.17
01-Apr-15
Non-interest bearing
-Trade receivables 77.20 - -
-Cash and Bank balances* 11.73 - -
-Investments - - -
-Other Financial asset(Deposits) 2,831.28 186.41
Interest bearing
- Fixed deposit(interest rate: ) 15.87 - -
Total 2,936.08 - 186.41
* Cash and Bank Balances here excludes Fixed deposits
Note:
Less than 1
year1 to 3 years
More than 3
years
INR INR INR
As at 31, March 2017
Net settled:
– Cross Currency Interest Rate swaps - 499.73
– Currency exchange forward contracts - -
– Commodity futures (5,639.08) -
Total (5,639.08) 499.73
As at 31, March 2016
Net settled:
– Cross Currency Interest Rate swaps - (1,170.09)
– Currency exchange forward contracts - -
– Commodity futures (1,394.10) -
Total (1,394.10) (1,170.09)
As at 01, April 2015
Net settled:
– Cross Currency Interest Rate swaps - 623.18
– Currency exchange forward contracts (11.74) -
– Commodity futures 73.97 -
Total 62.23 623.18
The Company has access to financing facilities of which Rs. 104341 Lakhs (PY : Rs. 36438 Lakhs) were unused at the end of the reporting period ended 31st March
2017. The Company expects to meet its other obligations from operating cash flows and proceeds of maturing financial assets.
Certain financial assets and financial liabilities are subject to offsetting where there is currently a legally enforceable right to set off recognized amounts and the Company
intends to either settle on a net basis, or to realize enforceable right to set off recognized amounts and the Company intends to either settle on a net basis, or to realize the
asset and settle the liability, simultaneously.
The following table details the Company's expected maturity for its non-derivative financial assets. The table has been drawn up based on the undiscounted contractual
maturities of the financial assets including interest that will be earned on those assets. The inclusion of information on non-derivative financial assets is necessary in order
to understand the Company's liquidity risk management as the liquidity is managed on a net asset and liability basis.
The following table details the Company's liquidity analysis for its derivative financial instruments. The table has been drawn up based on the undiscounted contractual
net cash inflows and outflows on derivative instruments that settle on a net basis, and the undiscounted gross inflows and outflows on those derivatives that require gross
settlement.
Particulars
Particulars

Parry Sugars Refinery India Private Limited
(All amounts are in Rupees lakhs unless otherwise stated)
32 Fair Value Measurement
Fair Valuation Techniques and Inputs used - recurring Items
31, March 201731, March
201601,April 2015
INR INR INR
Fair value hierarchy -Level 1
1) Commodity derivatives (5,639.08) (1,394.10) 73.97 Level 1
Quoted bid prices
in an active
market.
NA NA
2) Investment in Mutual funds 3,043.99 3,302.90
-
Level 1
Quoted bid prices
in an active
market.
NA NA
Sub-total (2,595.09) 1,908.80 73.97
Fair value hierarchy -Level 2
3) Foreign currency forward contracts - (11.74) Level 2 Refer Note 3(a) NA NA
4) Cross Currency Interest rate swaps 499.73 (1,170.09) 623.18 Level 2 Refer Note 3(b) NA NA
Sub-total 499.73 (1,170.09) 611.44
Note:
1. Derivatives value here represents Marked to Market value.
2. The Level 1 financial instruments are measured using quotes in active market
3. The following table shows the valuation technique and key input used for Level 2:
Financial InstrumentValuation
Technique
(a) Foreign currency forward
contracts
Discounted Cash
Flow
(b) Currency and interest rate swap
contracts
Discounted Cash
Flow
Financial assets/ financial liabilities
Notes forming part of the financial statements for the year ended March 31, 2017
Forward exchange rates, contract forward and interest rates, observable yield curves.
These are swaps where the Company has fixed its interest obligation and converted the foreign currency
interest and principal obligations to its functional currency (`USD). Future cash flows are estimated based on
forward interest rates (from observable yield curves at the end of the reporting period) and contract interest
rates, discounted at a rate that reflects the credit risk of various counterparties. Forward exchange rates,
contract forward and interest rates, observable yield curves are key inputs used.
Fair value as atRelationship of
unobservable inputs to fair
value and sensitivity
Significant
unobservable
input(s)
Valuation
technique(s) and
key input(s)
Fair value
hierarchy
Key Inputs used

Parry Sugars Refinery India Private Limited
Notes forming part of the financial statements for the year ended March 31, 2017
(All amounts are in Rupees lakhs unless otherwise stated)
32 Fair Value Measurement ..continued
Fair value of financial assets and financial liabilities that are not measured at fair value
Carrying
amountFair value
Carrying
amountFair value Carrying amount Fair value
INR INR INR INR INR INR
Financial assets carried at
Amortised Cost
Security deposit 118.68 158.98 105.17 109.13 186.41 186.41 Level 2
Trade receivables 292.45 292.45 11,779.76 11,779.76 77.20 77.20 Level 2
Cash and cash equivalents 7,494.87 7,494.87 2,071.05 2,071.05 27.59 27.59 Level 1
Other Financial Assets 14,752.97 14,752.97 22,414.58 22,414.58 2,831.28 2,831.28 Level 2
Total 22,658.97 22,699.27 36,370.56 36,374.52 3,122.48 3,122.48
Financial liabilities carried at
Amortised Cost
Non Convertible Debentures 32,727.98 32,871.65 32,199.46 32,207.52 31,718.50 32,146.96 Level 2
Preference shares - - 10,071.89 10,054.22 7,238.31 7,366.54 Level 2
Trade payables 97,422.03 97,422.03 48,519.17 48,519.17 31,937.38 31,937.38 Level 2
Short term borrowings 41,475.25 41,475.25 81,990.19 81,990.19 22,150.39 22,150.39 Level 2
Others 2,080.73 2,080.73 2,392.41 2,392.41 2,005.74 2,005.74 Level 2
Total 173,705.99 173,849.66 175,173.12 175,163.52 95,050.33 95,607.01
Note:
1. In case of trade receivables, cash and cash equivalents, trade payables, borrowings and other financial assets and liabilities it is assessed that the fair values
approximate their carrying amounts largely due to the short-term maturities of these instruments.
2. The categorisation of fair value measurements into the different levels of the fair value hierarchy depends on the degree to which the inputs to the fair value
measurements are observable and the significance of the inputs to the fair value measurement.
Particulars
Level
As at 31, March 2017 As at 31, March 2016 As at 01, April 2015

Parry Sugars Refinery India Private Limited
Notes forming part of the financial statements for the year ended March 31, 2017
(All amounts are in Rupees lakhs unless otherwise stated)
32 Fair Value Measurement ..continued
33 Segment information
34 Leases
For the year
ended
31 March,
2017
For the year
ended
31 March,
2016
INR INR
As Lessee
Future Non-Cancellable minimum lease commitments
not later than one year 94.94 94.94
later than one year and not later than five years 483.40 474.70
later than five years 1,560.01 1,663.65
Expenses recognised in the Statement of Profit and Loss
Minimum Lease Payments 143.99 223.91
Liabilities in respect of Operating Leases - -
Details of leasing arrangements : Operating lease
The Company has entered into operating lease arrangements for land for its manufacturing activities in SEZ unit, for a period of 30 years
commencing from 31 March 2008. The leases are non-cancellable in nature. The lease agreements has a schedule which provides lease
payments for specific period.
Particulars
Level 2: The fair value of financial instruments that are not traded in an active market (for example, over-the counter derivatives) is
determined using valuation techniques which maximise the use of observable market data and rely as little as possible on entity-specific
estimates. If all significant inputs required to fair value an instrument are observable, the instrument is included in level 2.
Level 3: If one or more of the significant inputs is not based on observable market data, the instrument is included in level 3. This is the
case for unlisted equity securities, contingent consideration and indemnification asset included in level 3.
There are no transfers between levels 1 and 2 during the year.
The Company’s policy is to recognise transfers into and transfers out of fair value hierarchy levels as at the end of the reporting period.
The company is engaged in the business of refining sugar which is the only business segment determined in accordance with the IndAS
108, "Operating segment". Hence there are no reportable business segments to be disclosed as required by the said standard. The entire sales
are made outside India and hence there are no reportable geographical segments to be disclosed as required under the said standard.
Level 1: Level 1 hierarchy includes financial instruments measured using quoted prices. This includes mutual funds, call options, put
options, and commodity derivatives that have quoted price. The fair value of all commodity derivatives which are traded in the commodity
exchanges is valued using the closing price as at the reporting period. The mutual funds are valued using the closing NAV.
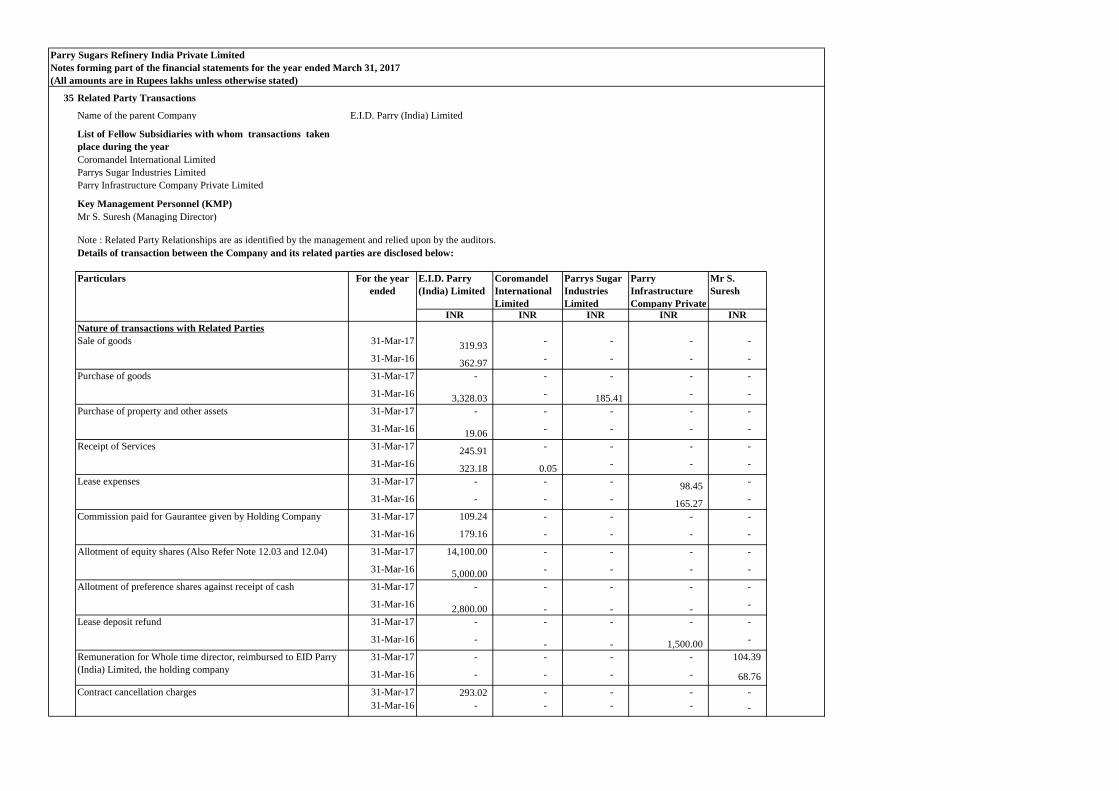
Parry Sugars Refinery India Private Limited
Notes forming part of the financial statements for the year ended March 31, 2017
(All amounts are in Rupees lakhs unless otherwise stated)
35 Related Party Transactions
Name of the parent Company E.I.D. Parry (India) Limited
List of Fellow Subsidiaries with whom transactions taken
place during the year
Coromandel International Limited
Parrys Sugar Industries Limited
Parry Infrastructure Company Private Limited
Key Management Personnel (KMP)
Mr S. Suresh (Managing Director)
Note : Related Party Relationships are as identified by the management and relied upon by the auditors.
Details of transaction between the Company and its related parties are disclosed below:
E.I.D. Parry
(India) Limited
Coromandel
International
Limited
Parrys Sugar
Industries
Limited
Parry
Infrastructure
Company Private
Mr S.
Suresh
INR INR INR INR INR
Nature of transactions with Related Parties
31-Mar-17319.93
- - - -
31-Mar-16362.97
- - - -
31-Mar-17 - - - - -
31-Mar-163,328.03
- 185.41
- -
31-Mar-17 - - - - -
31-Mar-1619.06
- - - -
31-Mar-17245.91
- - - -
31-Mar-16323.18 0.05
- - -
31-Mar-17 - - - 98.45
-
31-Mar-16 - - - 165.27
-
Commission paid for Gaurantee given by Holding Company 31-Mar-17 109.24 - - - -
31-Mar-16 179.16 - - - -
31-Mar-17 14,100.00 - - - -
31-Mar-165,000.00
- - - -
31-Mar-17 - - - - -
31-Mar-162,800.00 - - -
-
31-Mar-17 - - - - -
31-Mar-16 - - - 1,500.00
-
31-Mar-17 - - - - 104.39
31-Mar-16 - - - - 68.76
31-Mar-17 293.02 - - - -
31-Mar-16 - - - - -
Purchase of property and other assets
Receipt of Services
Particulars For the year
ended
Remuneration for Whole time director, reimbursed to EID Parry
(India) Limited, the holding company
Sale of goods
Purchase of goods
Lease deposit refund
Lease expenses
Allotment of preference shares against receipt of cash
Allotment of equity shares (Also Refer Note 12.03 and 12.04)
Contract cancellation charges
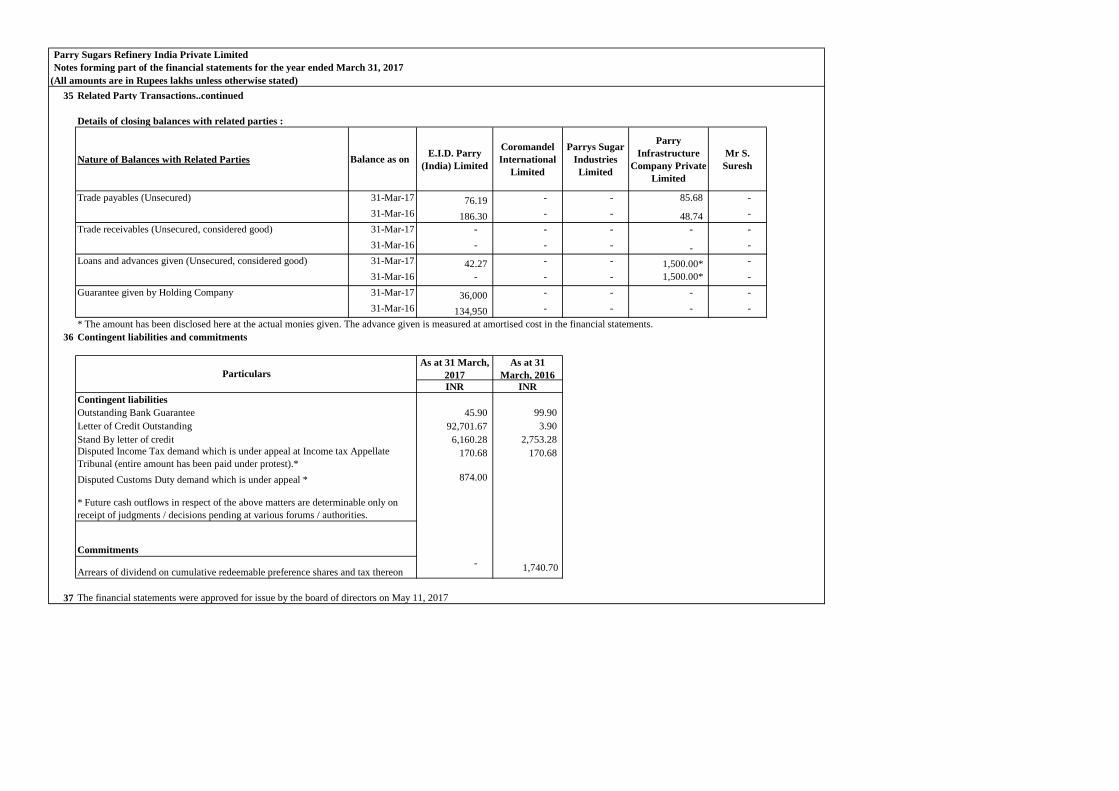
Parry Sugars Refinery India Private Limited
Notes forming part of the financial statements for the year ended March 31, 2017
(All amounts are in Rupees lakhs unless otherwise stated)
35 Related Party Transactions..continued
Details of closing balances with related parties :
Nature of Balances with Related Parties Balance as onE.I.D. Parry
(India) Limited
Coromandel
International
Limited
Parrys Sugar
Industries
Limited
Parry
Infrastructure
Company Private
Limited
Mr S.
Suresh
Trade payables (Unsecured) 31-Mar-17 76.19 - - 85.68 -
31-Mar-16 186.30 - - 48.74 -
Trade receivables (Unsecured, considered good) 31-Mar-17 - - - - -
31-Mar-16 - - - - -
Loans and advances given (Unsecured, considered good) 31-Mar-17 42.27 - - 1,500.00* -
31-Mar-16 - - - 1,500.00* -
Guarantee given by Holding Company 31-Mar-17 36,000 - - - -
31-Mar-16 134,950 - - - -
* The amount has been disclosed here at the actual monies given. The advance given is measured at amortised cost in the financial statements.
36 Contingent liabilities and commitments
As at 31 March,
2017
As at 31
March, 2016
INR INR
45.90 99.90
Letter of Credit Outstanding 92,701.67 3.90
6,160.28 2,753.28
170.68 170.68
874.00
Commitments
- 1,740.70
37 The financial statements were approved for issue by the board of directors on May 11, 2017
Particulars
Disputed Income Tax demand which is under appeal at Income tax Appellate
Tribunal (entire amount has been paid under protest).*
Contingent liabilities
Outstanding Bank Guarantee
Stand By letter of credit
Arrears of dividend on cumulative redeemable preference shares and tax thereon
Disputed Customs Duty demand which is under appeal *
* Future cash outflows in respect of the above matters are determinable only on
receipt of judgments / decisions pending at various forums / authorities.

Parry Sugars Refinery India Private Limited
(All amounts are in Rupees lakhs unless otherwise stated)
38
S.No
Previous GAAP Effect of Transition IND AS
A ASSETS
1
(a) Property, Plant and Equipment 42,023.42 2,429.14 44,452.57
(c) Capital Work-In-Progress 196.30 0.54 196.84
(d) Financial Assets -
(i) Others 1,500.00 (1,394.83) 105.17
(e) Other Non Current Assets 498.04 784.06 1,282.10
44,217.76 1,818.92 46,036.68
2 Current assets
(a) Inventories 81,966.04 (230.17) 81,735.87
(b) Financial Assets -
(i) Investments 3,302.90 - 3,302.90
(ii) Trade receivables 11,780.20 (0.44) 11,779.76
(iii) Cash and Cash equivalents 2,071.05 0.00 2,071.05
(iv) Others 22,365.66 48.92 22,414.58
(c) Other Current Assets 3,844.40 (493.81) 3,350.59
125,330.26 (675.50) 124,654.75
169,548.01 1,143.42 170,691.43
B EQUITY AND LIABILITIES
1 Equity
(a) Equity Share capital 30,728.12 (14,100.00) 16,628.12
(b) Other Equity (29,751.28) 1,907.86 (27,843.42)
976.84 (12,192.14) (11,215.30)
LIABILITIES
2 Non-current liabilities
(a) Financial Liabilities
(i) Borrowings 33,000.00 9,271.35 42,271.35
(ii) Others - - -
(b) Non-Financial Liabilities
(i) Long term provisions - 46.46 46.46
(ii) Other Non-Financial Liabilities - 4,028.11 4,028.11
33,000.00 13,345.93 46,345.93
3 Current liabilities
(a) Financial Liabilities
(i) Borrowings 81,993.23 (3.04) 81,990.19
(ii) Trade payables 48,518.74 0.43 48,519.17
(iii) Others 4,956.60 (0.01) 4,956.60
(b) Non-Financial Liabilities -
(i) Short term provisions 8.91 (7.74) 1.17
(ii) Others 93.68 0.00 93.68
135,571.17 (10.36) 135,560.80
169,548.01 1,143.42 170,691.43
Reconciliation of total equity as at March 31, 2016
Classification of preference share from equity to liability (Note 41(iv)(b)) (14,100.00)
Security deposit measured at amortised cost (Note 41(iv)(c)) (324.17)
Debentures measured at amortised cost (Note 41(iv)(e)) 57.55
Provision for decommissioning liability (Note 41(iv)(a)) (4.40)
Fixed Assets Reinstatement (Note 41(iv)(a)) 34.86
Foreign currency translation (Note 41(iv)(h)) 2,144.02
Total adjustment to equity 1,907.86
Total equity under Ind AS (11,215.30)
INR
As at March 31, 2016
(End of last period presented under Previous
GAAP)
Other adjustments 1,907.86
Total Equity (shareholder's funds) under previous
GAAP 976.84
Particulars
Notes forming part of the financial statements for the year ended March 31, 2017
Total Equity and Liabilities (1+2+3)
First-time Ind AS adoption reconciliation
Effect of Ind AS adoption on the balance sheet as at March 31, 2016
Non-current assets
Total Non - Current Assets
As at March 31, 2016 (End of last period presented under previous GAAP)Particulars
Total Current Assets
Total Assets (1+2)
Total equity
Total Non - Current Liabilities
Total Current Liabilities

Parry Sugars Refinery India Private Limited
Notes forming part of the financial statements for the year ended March 31, 2017
(All amounts are in Rupees lakhs unless otherwise stated)
39 Effect of Ind AS adoption on the Statement of Profit and Loss for the year ended March 31, 2016
Previous GAAP Effect of Transition IND AS
I Revenues from Operations 115,182.95 (646.63) 114,536.33
II Other Income 1,677.66 3,055.04 4,732.70
III Total Income (I+II) 116,860.61 2,408.41 119,269.03
IV Expenses:
Cost of materials consumed 100,821.84 1,899.95 102,721.79
Changes in Inventories of finished goods, work-in-process and stock in trade (2,074.49) 719.86 (1,354.63)
Employee benefits expense 481.32 3.93 485.24
Finance costs 5,610.00 685.04 6,295.04
Depreciation and amortisation expense 2,473.48 111.61 2,585.10
Other expenses 17,293.37 (3,203.69) 14,089.68
Total Expenses (IV) 124,605.53 216.70 124,822.22
V Profit before tax (III-IV) (7,744.91) 2,191.72 (5,553.19)
VI Tax Expense:
(1) Current Tax -
(2) Deferred Tax -
- - -
VII Profit for the year from continuing operations(V-VI) (7,744.91) 2,191.72 (5,553.19)
VIII Profit from discontinued operations before tax - - -
IX Tax expense of discontinued operations - - -
X Profit from discontinued operations after tax (VIII-IX) - - -
XI Profit for the year (VII + X) (7,744.91) 2,191.72 (5,553.19)
XII Other Comprehensive Income - (468.72) (468.72)
XIII Total Comprehensive Income (XI+XII) (7,744.91) 1,723.00 (6,021.91)
Reconciliation of total comprehensive income for
the year ended March 31, 2016
For the year ended
31, March 2016
INR
Profit as per previous GAAP (7,744.91)
Adjustments 2,191.72
Effect of amortisation of Rental Deposit under EIR (Note 41(iv)(c)) 250.77
Depreciation on building (Note 41(iv)(a)) 4.33
(697.15)
Decommissioning Liability Unwinding Cost (Note 41(iv)(a)) (4.41)
Effect of debenture discount under EIR (Note 41(iv)(e)) 25.44
Foreign currency translation(Note 41(iv)(h)) 2,612.73
Total effect of transition 2,191.72
Profit for the year as per Ind AS (5,553.19)
Other comprehensive income for the year (net of
tax) (468.72)
Total comprehensive income under Ind AS (6,021.91)
Note: Under previous GAAP, total comprehensive income was not reported. Therefore, the above reconciliation starts with
profit under previous GAAP.
ParticularsS.No
For the Year ended March 31, 2016
Particulars
Reversal of Marked to Market Gain on Commodity Futures and Cross
Currency Swaps (Note 41(iv)(d))
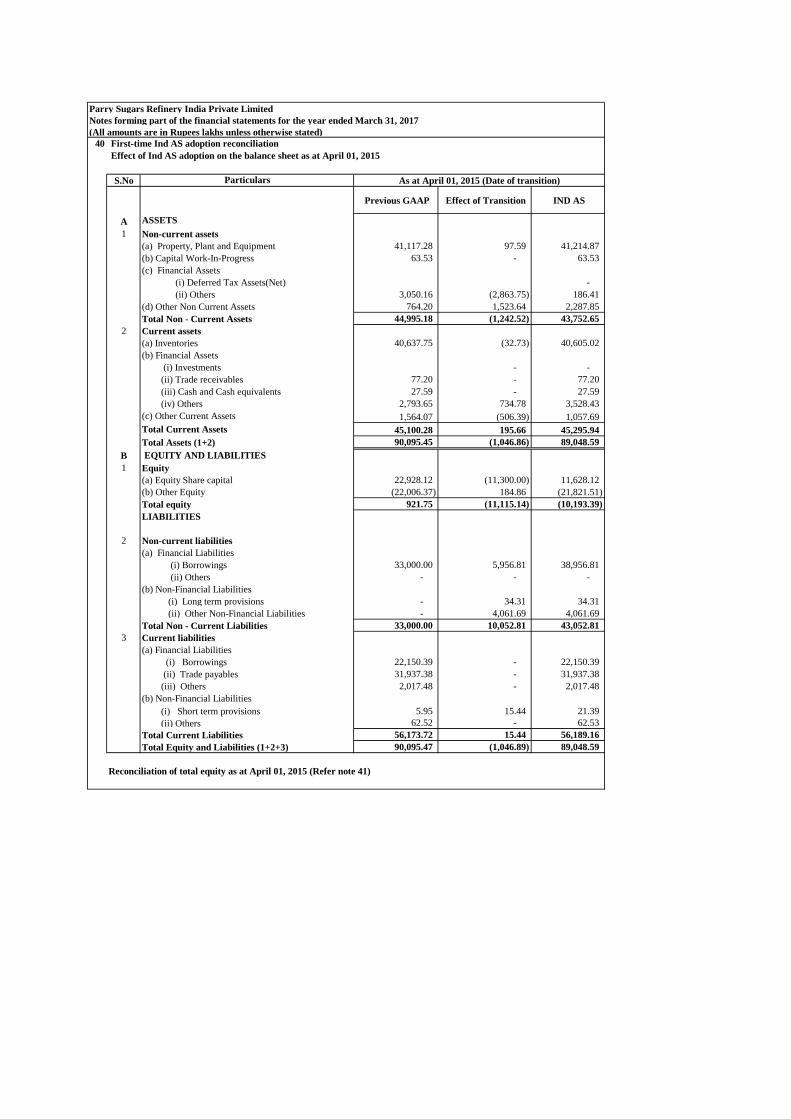
Parry Sugars Refinery India Private Limited
(All amounts are in Rupees lakhs unless otherwise stated)
40
S.No
Previous GAAP Effect of Transition IND AS
A ASSETS
1
(a) Property, Plant and Equipment 41,117.28 97.59 41,214.87
(b) Capital Work-In-Progress 63.53 - 63.53
(c) Financial Assets
(i) Deferred Tax Assets(Net) -
(ii) Others 3,050.16 (2,863.75) 186.41
(d) Other Non Current Assets 764.20 1,523.64 2,287.85
44,995.18 (1,242.52) 43,752.65
2 Current assets
(a) Inventories 40,637.75 (32.73) 40,605.02
(b) Financial Assets
(i) Investments - -
(ii) Trade receivables 77.20 - 77.20
(iii) Cash and Cash equivalents 27.59 - 27.59
(iv) Others 2,793.65 734.78 3,528.43
(c) Other Current Assets 1,564.07 (506.39) 1,057.69
45,100.28 195.66 45,295.94
90,095.45 (1,046.86) 89,048.59
B EQUITY AND LIABILITIES
1 Equity
(a) Equity Share capital 22,928.12 (11,300.00) 11,628.12
(b) Other Equity (22,006.37) 184.86 (21,821.51)
921.75 (11,115.14) (10,193.39)
LIABILITIES
2 Non-current liabilities
(a) Financial Liabilities
(i) Borrowings 33,000.00 5,956.81 38,956.81
(ii) Others - - -
(b) Non-Financial Liabilities
(i) Long term provisions - 34.31 34.31
(ii) Other Non-Financial Liabilities - 4,061.69 4,061.69
33,000.00 10,052.81 43,052.81
3 Current liabilities
(a) Financial Liabilities
(i) Borrowings 22,150.39 - 22,150.39
(ii) Trade payables 31,937.38 - 31,937.38
(iii) Others 2,017.48 - 2,017.48
(b) Non-Financial Liabilities
(i) Short term provisions 5.95 15.44 21.39
(ii) Others 62.52 - 62.53
56,173.72 15.44 56,189.16
90,095.47 (1,046.89) 89,048.59
Reconciliation of total equity as at April 01, 2015 (Refer note 41)
As at April 01, 2015 (Date of transition)
Notes forming part of the financial statements for the year ended March 31, 2017
First-time Ind AS adoption reconciliation
Effect of Ind AS adoption on the balance sheet as at April 01, 2015
Particulars
Total Equity and Liabilities (1+2+3)
Non-current assets
Total Non - Current Assets
Total Current Assets
Total Assets (1+2)
Total equity
Total Non - Current Liabilities
Total Current Liabilities

Parry Sugars Refinery India Private Limited
Notes forming part of the financial statements for the year ended March 31, 2017
41 First-time adoption of Ind-AS
Exemptions applied
Estimates
Reconciliation
.
.
Effect of Ind AS adoption for Balance Sheet
The effect of the Company’s transition to IND AS is summarized in this note as follows:
(i) Reconciliation of equity as previously reported under Indian GAAP to IND AS;
(ii) Reconciliation of retained earnings as previously reported under Indian GAAP to IND
AS;
(i)
Particulars Amount in INR
Equity as reported under previous GAAP as on 01 April, 2015 22,928.12
Ind AS: Adjustments increase/ (decrease):
Preference shares classified from equity to liability (11,300.00)
Equity as reported under IND AS as on 01 April, 2015 11,628.12
(ii) Reconciliation of Other Equity
(Amount in lakhs)
Particulars Amount - INR Amount - INR
Balance as per previous GAAP as on 01 April 2015 (22,006.37)
Effect of debenture discount under Effective interest rate (Note (iv)(e) ) 32.11
Effect of depreciation difference in Building (Note (iv)(a) ) 30.54
Effect of amortisation of Lease Deposit under EIR (Note (iv)(c) ) (574.27)
Marked to Market Gain on Commodity Futures (Note (iv)(d) ) 73.97
Marked to Market Gain on Cross Currency Interest Swap (Note (iv)(d) ) 623.18 184.86
Balance as per Ind As as on 01 April 2015 (21,821.51)
The entity’s date of transition to Ind AS is April 1, 2015, with its first Ind AS financial statements prepared to March 31, 2017;
The changes in accounting policies as a consequence of the transition to Ind AS are as described in the notes following the reconciliations;
(Amount in lakhs)
Reconciliation of equity
Reconciliation of equity , retained earnings and cash flows as previously reported under Indian GAAP to IND AS
These financial statements, for the year ended 31 March 2017, are the first financial statements which the Company has prepared in accordance with
Ind-AS. For periods up to and including the year ended 31 March 2016, the Company prepared its financial statements in accordance with statutory
reporting requirement in India immediately before adopting Ind AS (‘previous GAAP’).
Accordingly, the Company has prepared financial statements which comply with Ind-AS applicable for periods ending on or after 31 March 2017,
together with the comparative period data as at and for the year ended 31 March 2016, as described in the summary of significant accounting policies.
In preparing these financial statements, the Company's opening balance sheet was prepared as at 1 April 2015, the Company's date of transition to Ind-
AS. This note explains the principal adjustments made by the Company in restating its Indian GAAP financial statements, including the balance sheet
as at 1 April 2015 and the financial statements as at and for the year ended 31 March 2016.
Ind AS 101 allows first-time adopters certain exemptions from the retrospective application of certain requirements under Ind AS. Refer Note 3.21
for exemptions availed.
The estimates used by the Company to present these amounts in accordance with Ind AS reflect conditions at 1 April 2015, the date of transition to
Ind AS.
The estimates at 1 April 2015 and at March 31, 2016 are consistent with those made for the same dates in accordance with previous GAAP.

Parry Sugars Refinery India Private Limited
Notes forming part of the financial statements for the year ended March 31, 2017
(iii)
PARTICULARSAs at 31
March, 2016
As at 01 April,
2015
Cash and cash equivalents for the purpose of statement of cash flows as per previous
GAAP5,357.16 11.72
Bank Overdrafts which form an integral part of cash management system (Note (iv)(h))(11.89)
321.84
Cash and cash equivalents as per Ind AS 5,345.26 333.56
(iv) Notes to the reconciliation .
a) Property, Plant and Equipment
b) Preference Shares
c) Rental deposit
As per previous GAAP security deposit used to be recognised as an asset at the transaction value in the books of lessee, but Ind AS 109 requires the
same to be measured at fair value at initial recognition and the difference between lease deposit and fair value shall be recognised as prepaid lease
rentals which will then be recognised in the statement of profit or loss account on straight line basis over the lease term as additional expense for the
lessee. Accordingly a net additional charge of INR: 574.27 lakhs has been debited to the retained earnings for the year ended 01 April 2015.
For the year ended 31 March 2016, the additional charge to Profit or loss due to prepaid lease rent amortisation is INR 77.05 lakhs, due to which
there is a increase in loss by that amount as compared to previous GAAP. Also there is refund in security deposit during the year hence there is a
reversal of prepaid rent amortised earlier resulting in increase in other income by INR: 308.8 lakhs. Interest income on lease deposit recognised
pursuant to Ind AS transition for the year 31 March, 2016 ended is INR: 19.02 lakhs. This has lowered the equity as on March 31, 2016 by Rs 324.17
lakhs.
Under previous GAAP, redeemable preference shares were classified as part of total equity. However, under Ind AS, financial instruments are
classified as a liability or equity according to the substance of the contractual arrangement and not it's legal form. These preference shares do not
contain any equity component and hence, have been classified in their entirely as a financial liability under Ind AS.
As per previous GAAP critical spares pertaining to capital asset were added to the inventory.However under Ind AS 16 Property plant and
Equipment, such items should be capitalised tand should be depreciated over the useful life of the asset. An amount of INR:32.72 lakhs has been
capitalised to plant and machinery from inventory. However since the asset has not been put to use as of the year end, no depreciation has been
charged till date. Hence there is no impact due to this reclassification in the retained earnings of the company.
Under the measurement principles of Ind AS 16, cost of Plant and Equipment also includes the initial estimate of the costs of dismantling and
removing the item and restoring the site on which it is located, the obligation for which an entity incurs either when the item is acquired or as a
consequence of having used the item during a particular period for purposes other than to produce inventories during that period. The company has
estimated such costs as of the transition date pertaining to fixed assets accordingly Plant and equipment is capitalised by INR:34.31 lakhs and a
provision of the equivalent amount has been created resulting in 'nil' impact on retained earnings for the year ended March 2015.The Interest unwind
for decommissioning liability for the year 2015-16 is INR 4.41 lakhs and the equity position as of March 31, 2016 has reduced by INR 4.41 lakhs.
Capital expenditure incurred on developing the land taken under operating lease has been added to the cost of buildings. There is a net charge to
retained earnings to the extent of INR:30.54 lakhs due to the difference in depreciation as per previous GAAP and as per Ind AS on account of this.
During the year ended 31st March 2016, there is a decrease in depreciation by INR: 4.33 lakhs as compared to previous GAAP. This difference is
pursuant to computation of depreciation in the functional currency (USD) instead of INR as per previous GAAP and conversion of this amount back
to INR using the average exchange rate for the year.. The net impact to equity as of March 31, 2016 is INR 34.86 lakhs.
(Amount in lakhs)
Analysis of Cash and Cash Equivalents as at March 31, 2016 and as at April 01, 2015 for the purpose of statement of cash
flow under Ind AS.

d) Marked To Market Gain on Derivative Transactions
e) Discount on issue of debentures
f)
g) Other Comprehensive Income
h) Change in Functional Currency
h) Bank Overdrafts
Under previous GAAP debentures used to be recognised at the face value and the difference between face value and net proceeds were recognised as
discount on issue of debentures. Whereas under Ind As 109 debentures being a financial liability are measured at amortised cost using EIR method at
the end of each period if it meets the relevant criteria as specified therein. Accordingly retained earnings has been credited by the net impact of INR:
32.11 lakhs.
Pursuant to Ind As transition debenture discount for the year ended 31 March 2016 has been reduced by INR: 25.44 lakhs as compared to previous
GAAP resulting in decrease in loss to that extent and the equity balance as on 31 March 2016 has reduced by Rs 57.55 lakhs.
Under Ind AS, bank overdrafts repayable on demand and which form an integral part of the cash management process are included in cash and cash
equivalents for the purpose of presentation of statement of cash flows. Under previous GAAP, bank overdrafts were considered as part of borrowings
and movements in bank overdrafts were shown as part of financing activities. Consequently, cash and cash equivalents have reduced by INR :11.89
lakhs as at 31 March 2016 (1 April 2015 - INR:321.83 lakhs ) and cash flows from financing activities for the year ended 31 March 2016 have also
reduced by INR -309.94 lakhs to the effect of the movements in bank overdrafts.
As per previous GAAP it was optional to record gain on derivative transactions but as per Ind AS 109 it is mandatory to recognise gain on the
derivatives which are marked to market. Accordingly retained earnings has been credited by the gain to the extent of Rs. 623.18 lakhs towards
recognition of MTM on swap contracts where as Rs.73.97 lakhs towards MTM on sugar futures as at 01 April 2015.
Such MTM gain on swap and commodity contracts has been reversed during the year 31 March 2016 to the extent recognised earlier ( total INR
697.15 lakhs ) resulting in increase in the loss for the year then ended by that amount as compared to previous GAAP.
Acturial Gains and losses
Under previous GAAP, acturial gains and losses were recognised in profit or loss. Under Ind AS, the acturial gains and losses form part of
remeasurements of the net defined benefit liability/asset which is recognised in other comprehensive income. The acturial gains for the year ended
March 31, 2016 were Rs 388,664. This does not affect the equity position of the company.
Under previous GAAP, there was no concept of other comprehensive income. Under Ind AS, specific items of income, expense, gains, or losses are
required to be presented in other comprehensive income.
Under Ind AS, the company needs to have an assesment of it's functional currency at the end of each reporting period. The books of accounts are to
be prepared and maintained in the functional currency. Since the functional currency has been identified as US Dollars, the entire books of accounts
have been reworked in USD for 2015-16. While under previous GAAP books of accounts were maintained in INR, due to this change all items in the
Statement of Profit or Loss will be affected since the entries are initially booked in USD and translated into INR for the purpose of preparation and
presentation of financial statements using a yearly average rate. The loss for the year 2015-16 has come down by INR 2612.73 lakhs on account of
this and equity as of March 31, 2016 has increased by INR 2144.02 lakhs.