parsons brinckerhoff / sarah j. siwek & associates, inc. | climate change workshop purpose what...
Post on 21-Dec-2015
215 views
TRANSCRIPT

Parsons Brinckerhoff / Sarah J. Siwek & Associates, Inc. | Climate Change
Workshop Purpose
• What is climate change?• How will it affect state
DOTs?• What is the current status of
federal legislation?• What are proposed CEQ-
NEPA requirements? • How can state DOTs adapt
to climate change?• How can state DOTs
reduce transportation GHG?
Parsons Brinckerhoff / Sarah J. Siwek & Associates, Inc. | Climate Change
Workshop Overview
I. Climate Change Science, Sources, and TrendsII. The Importance of Climate Change to State DOTs III. Federal LegislationIV. Planning and NEPA IssuesV. Climate AdaptationVI. Strategies to Reduce GHG Emissions from
Transportation SourcesVII. Participant Workshop

Parsons Brinckerhoff / Sarah J. Siwek & Associates, Inc. | Climate Change
I. Climate Change Science, Sources and Trends

Parsons Brinckerhoff / Sarah J. Siwek & Associates, Inc. | Climate Change
What is climate change?
The United Nations Framework Convention on Climate Change (UNFCCC) defines Climate Change as:
“A change of climate which is attributed directly or indirectly to human activity that alters the composition of the global atmosphere and which is in addition to natural climate variability observed over comparable time periods.”
Parsons Brinckerhoff / Sarah J. Siwek & Associates, Inc. | Climate Change
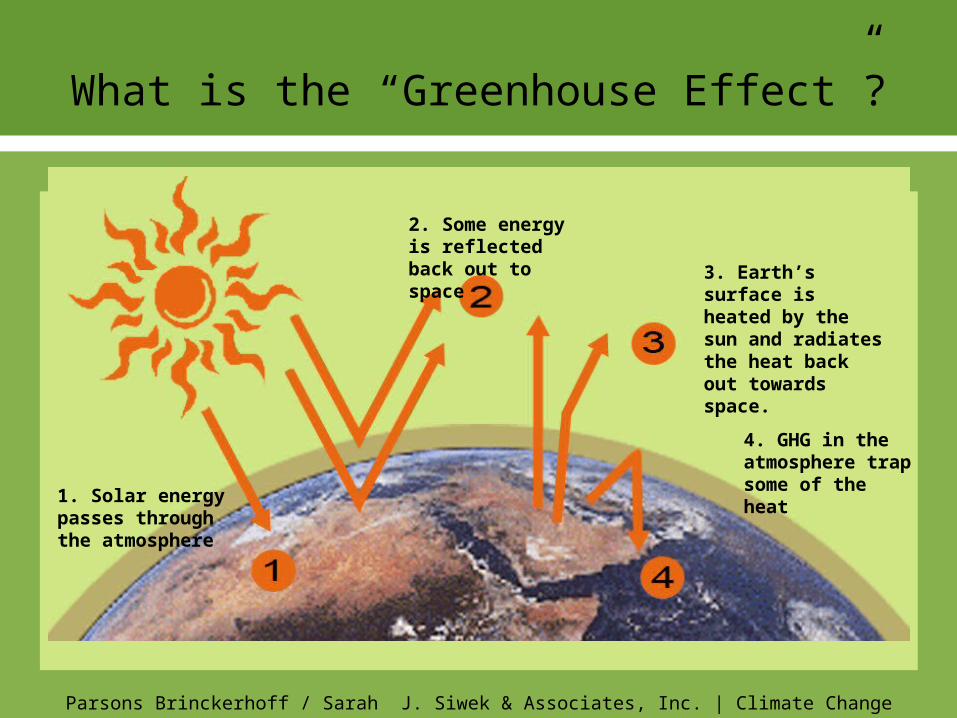
What is the “Greenhouse Effect”?
1. Solar energy passes through the atmosphere
2. Some energy is reflected back out to space 3. Earth’s surface is
heated by the sun and radiates the heat back out towards space.
4. GHG in the atmosphere trap some of the heat

Parsons Brinckerhoff / Sarah J. Siwek & Associates, Inc. | Climate Change
What is the evidence on temperatures?

Parsons Brinckerhoff / Sarah J. Siwek & Associates, Inc. | Climate Change
What are the impacts at different
temperature increases?
Source:Stern Review, 2008
Parsons Brinckerhoff / Sarah J. Siwek & Associates, Inc. | Climate Change
What are the scientific findings?
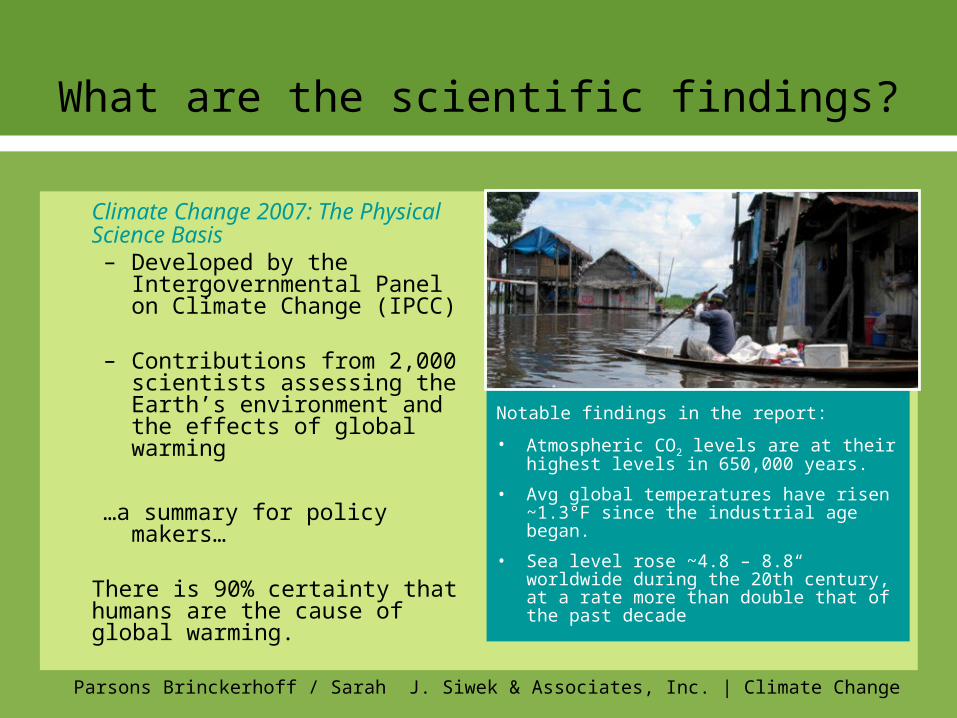
Climate Change 2007: The Physical Science Basis– Developed by the
Intergovernmental Panel on Climate Change (IPCC)
– Contributions from 2,000 scientists assessing the Earth’s environment and the effects of global warming
…a summary for policy makers…
There is 90% certainty that humans are the cause of global warming.
Notable findings in the report:
• Atmospheric CO2 levels are at their highest levels in 650,000 years.
• Avg global temperatures have risen ~1.3°F since the industrial age began.
• Sea level rose ~4.8 – 8.8“ worldwide during the 20th century, at a rate more than double that of the past decade

Parsons Brinckerhoff / Sarah J. Siwek & Associates, Inc. | Climate Change
What is the physical evidence?
Source: NASA
Arctic sea ice is retreating –
a measurable change in climate that can be seen

Parsons Brinckerhoff / Sarah J. Siwek & Associates, Inc. | Climate Change
How certain are the scientists?
• “Warming of the climate system is unequivocal…”-- Intergovernmental Panel on Climate Change
• “An overwhelming body of scientific evidence paints a clear picture: climate change is happening, it is caused in large part by human activity, and it will have many serious and potentially damaging effects in the decades ahead.”
-- Pew Center on Climate Change

Parsons Brinckerhoff / Sarah J. Siwek & Associates, Inc. | Climate Change
What is the evidence of climate change?
• 14% increase in human GHG since 1990 – USA• 26% increase in human GHG since 1990 – world• GHG levels are at highest in 1000s of years• 2000-2009 was the warmest decade on record worldwide• Heat stored in oceans has increased substantially• Sea surface temperatures have been higher during the past three decades than at
any other time since large-scale measurement began in the late1800s. • In recent years, a higher percentage of precipitation in the United States has come in
the form of intense single-day events. • 8 of top 10 years for extreme one-day precipitation events occurred since 1990. • The occurrence of abnormally high annual precipitation totals has increased.• Intensity of tropical storms in the Atlantic, Caribbean, and Gulf has risen noticeably
over the past 20 years. • 6 of the 10 most active hurricane seasons have occurred since the mid-1990s.
Source: EPA, Climate Change Indicators in the U.S., May 2010

Parsons Brinckerhoff / Sarah J. Siwek & Associates, Inc. | Climate Change
What is the evidence of climate change?(continued)
• Sea level worldwide has increased at a rate of roughly 0.6” per decade since 1870. • Sea level increase has accelerated to more than 1”/year in recent years. • Oceans have become more acidic over the past 20 years, and studies suggest that
the ocean is substantially more acidic now than it was a few centuries ago. Rising acidity is associated with increased levels of carbon dioxide dissolved in the water, and affects sensitive organisms such as corals.
• Sept 2007 had least Arctic sea ice of any year on record, followed by 2008 and 2009. • Arctic sea ice in 2009 was 24 percent below the 1979-2000 historical average. • Glaciers in U.S. and around the world have generally shrunk since the 1960s and the
rate at which glaciers are melting appears to have accelerated over the last decade. • Glaciers worldwide have lost more than 2,000 cubic miles of water since 1960.• Average length of the growing season in the lower 48 states has increased by about
two weeks the since beginning of the 20th century. • North American bird species have shifted their wintering grounds northward by an
average of 35 miles since 1966, with a few species shifting by several hundred miles. Source: EPA, Climate Change Indicators in the U.S., May 2010

Parsons Brinckerhoff / Sarah J. Siwek & Associates, Inc. | Climate Change
How widespread are climate change concerns?
• Over 2000 leading scientists worldwide contributed to IPCC report
• 33 U.S. states have developed climate change action plans
• U.S. Climate Action Partnership includes 23 major corporations and 5 nongovernmental groups which have called for U.S. Congress to enact strong GHG targets to achieve significant reductions in GHG:
AES, Alcoa, Alstom, Boston Scientific Corporation, Chrysler, The Dow Chemical Company, Duke Energy, DuPont, Environmental Defense Fund, Exelon Corporation, Ford Motor Company, FPL Group, General Electric, General Motors, Honeywell, Johnson & Johnson, Natural Resources Defense Council, The Nature Conservancy, NRG Energy, PepsiCo, Pew Center on Global Climate Change, PG&E Corporation, PNM Resources, Rio Tinto, Shell, Siemens Corporation, Weyerhaeuser, World Resources Institute.

Parsons Brinckerhoff / Sarah J. Siwek & Associates, Inc. | Climate Change
How is climate change affecting Hawai’i?
• Rapid rise in air temperature in the past 30 years (0.3 degrees F per decade). Warming rate at high elevations is faster than global rate.
• Sea level projected to reach over 3 feet above present by 2100.
• Other indicators– Rainfall and stream flow have decreased– Rain intensity has increased– Sea level and sea surface temperatures have increased– The ocean is acidifying
Source: Hawaii’s Changing Climate; Briefing sheet, 2010, Dr. Chip Fletcher, School of Ocean and Earth Science and Technology, University of Hawai’i at Manoa

Parsons Brinckerhoff / Sarah J. Siwek & Associates, Inc. | Climate Change
How is Hawai’i responding to climate change?
• Ocean Resources Management Plan (ORMP) Workgroup recognizes need to plan for adaptation to climate change impacts
– `Proposed framework for action November 2009
• Hawaii DOT preparing Hawaii Statewide Transportation Plan (HSTP)– STP staff follow efforts underway in Hawaii – Monitors activities and connections between transportation and the climate
change issues within and among various branches of government
• Hawaii Clean Energy Initiative – 2008 U.S. DOE/Hawaii– 70% of energy needs by renewable energy and efficiency by 2030
• Climate Change Solutions Act 234, 2007 Legislature– Reduce GHG to 1990 levels by 2020– Effects of GHG emissions and ways/need for reductions– Workplan to Legislature 2010, Recommendations 2011
• Food & Energy Self-Sufficiency- Act 73, 2010 Legislature– Barrel tax increase, Report to legislature in 2012

Parsons Brinckerhoff / Sarah J. Siwek & Associates, Inc. | Climate Change
Where do all those GHG come from?
Comparison: Annual* & Cumulative** CO2 Emissions
22%
18%
15%
6%4% 5%
1%2% 1% 1% 2% 1% 1%
30%
7%
27%
8%
2%
4%
1%2%
1% 0.5% 1% 1% 1%
0%
5%
10%
15%
20%
25%
30%
35%
USChin
a
EU-25
Russia
India
Japa
nBra
zil
Canad
a
Mexico
Indon
esia
South
Korea
Austra
lia
South
Africa
Countries
Per
cen
tag
e
Source: * Annual Emissions for the year 2004 from IEA (2006) CO2 Emissions from Fossil Fuel Combustion** Cumulative Emissions from 1850-2000, CAIT WRI
Annual Emissions (2004)
Cumulative Emissions (1850-2000)

Parsons Brinckerhoff / Sarah J. Siwek & Associates, Inc. | Climate Change
What GHG targets have been set?
• Scientists recommend 60-80% GHG reduction below 1990 level by 2050
• Many states and countries have adopted targets in this range
• President Obama’s budget: 80% GHG reduction below 2005 by 2050
• Waxman-Markey bill: 17% below 2005 by 2020 and 83% below 2005 by 2050
• Kerry-Lieberman bill: 17% below 2005 by 2020 and 83% below 2005 by 2050

Parsons Brinckerhoff / Sarah J. Siwek & Associates, Inc. | Climate Change
What is transportation’s share of U.S. GHG?Source: U.S. DOT Report to Congress, 2010
18

Parsons Brinckerhoff / Sarah J. Siwek & Associates, Inc. | Climate Change
Change, 1990-2006
All U.S. GHG Sources 15%
U.S. Transportation 27%
Light Duty Vehicles 24%
Freight Trucks 77%
Commercial Aircraft 4%
19
What are U.S. transportation GHG trends? - U.S.DOT Report to Congress, 2010

Parsons Brinckerhoff / Sarah J. Siwek & Associates, Inc. | Climate Change
How much will transportation GHG increase?
• U.S.: GHG from all transportation modes are projected to remain almost constant through 2030 – but light duty vehicle GHGs will actually decline slightly and freight GHG will increase significantly.
• World: GHG emissions from transportation are expected to rise sharply; soon GHG emissions from transportation in the developing world will greatly exceed those of the U.S.

Parsons Brinckerhoff / Sarah J. Siwek & Associates, Inc. | Climate Change
What are the global trends in vehicle ownership and use?
• Today, car ownership in the U.S. is greater than in India, China, and Brazil combined.
• By 2050, car ownership in those countries will by 5x greater than in the U.S.
Source: The King Review, Table 1.1 and Goldman Sachs, “The BRICs and Global Markets: Crude, Cars and Capital: Goldman Sachs Global Economics Paper No 118, 2004.

Parsons Brinckerhoff / Sarah J. Siwek & Associates, Inc. | Climate Change
Why is vehicle “decarbonization” necessary?
“In the long term, carbon free road transport fuel is
the only way to achieve an 80-90% reduction in emissions, essentially “decarbonization.”
--The King Review for the U.K. Government, by Professor Julia King, Vice-Chancellor of Aston University and former Director of Advanced Engineering at Rolls-Royce plc, March 2008
“[I]n the period beyond 2100, total GHG emissions will have to be just 20% of current levels. It is impossible to imagine this without decarbonization of the transport sector.”
-- Sir Nicholas Stern, Stern Review to the U.K. Government,2007

Parsons Brinckerhoff / Sarah J. Siwek & Associates, Inc. | Climate Change
Summary
• Climate change is real• 60-80% GHG reduction is needed• It is a global and cumulative problem• In developing countries, GHG emissions will
increase substantially• Delay will magnify the difficulty of reducing GHG • Hawai’i is especially vulnerable to climate change

Parsons Brinckerhoff / Sarah J. Siwek & Associates, Inc. | Climate Change
II. The Importance of Climate Change
to State DOTs

Parsons Brinckerhoff / Sarah J. Siwek & Associates, Inc. | Climate Change
Transportation’s Role in Climate Change:TRB Executive Committee, June 2008
• Moving away from our dependence on oil and reducing GHG emissions will be the greatest challenge to the greatest challenge to decision-making for transportation policies, programs, decision-making for transportation policies, programs, and investments in the coming decades.and investments in the coming decades.
• Other sectors are moving on climate change policies faster than transportation
• States are adopting sweeping policies with little or no input from transportation agencies or experts

Parsons Brinckerhoff / Sarah J. Siwek & Associates, Inc. | Climate Change
Wal-Mart Perspective
“We know we need to get ready for a world in
which energy will only be more expensive.”Wal-Mart will cut 20 MMT of GHG from its supply chain by the end
of 2015 — equivalent to removing >3.8 million cars from the road for a year.
Wal-Mart is already requiring suppliers to cut packaging, selling “Walmart-label” CFL bulbs in Mexico, and labelling clothes as cold-water wash.
********************************************************Should state DOTs take a page from Wal-Mart’s book?

Parsons Brinckerhoff / Sarah J. Siwek & Associates, Inc. | Climate Change
GHG Emissions – Hawai’i

Parsons Brinckerhoff / Sarah J. Siwek & Associates, Inc. | Climate Change
Petroleum Dependence for Electricity in Hawai’i

Parsons Brinckerhoff / Sarah J. Siwek & Associates, Inc. | Climate Change
DOE expects slight decline in LDV GHG emissions nationally
0200400
600800
10001200
2006 2009 2012 2015 2018 2021 2024 2027 2030
GHG Emissions from Light-Duty Vehicles(USDOE, Annual Energy Outlook 2009)
2009 Report

Parsons Brinckerhoff / Sarah J. Siwek & Associates, Inc. | Climate Change
U.S. VMT growth rates are declining
• VMT growth has been steadily declining since the 1950s• VMT growth slowed to about 1.5% in early 2000s• VMT growth was actually negative in 2008, pattern of upward growth in 2009• VMT is affected by population, economy, transportation prices, demographics, land use• AASHTO supports reducing VMT growth rate to 1% per year
VMT GROWTH RATE PER DECADE
0
1
2
3
4
5
6
1950's 1960's 1970's 1980's 1990's 2000's
perc
en
t ch
an
ge
Source: Alan Pisarski and Cambridge Systematics

Parsons Brinckerhoff / Sarah J. Siwek & Associates, Inc. | Climate Change
VMT closely linked to disposable income

Parsons Brinckerhoff / Sarah J. Siwek & Associates, Inc. | Climate Change
DOE expects VMT and MPG both to rise

Parsons Brinckerhoff / Sarah J. Siwek & Associates, Inc. | Climate Change
As VMT and MPG rise, GHG is nearly flat
Parsons Brinckerhoff / Sarah J. Siwek & Associates, Inc. | Climate Change
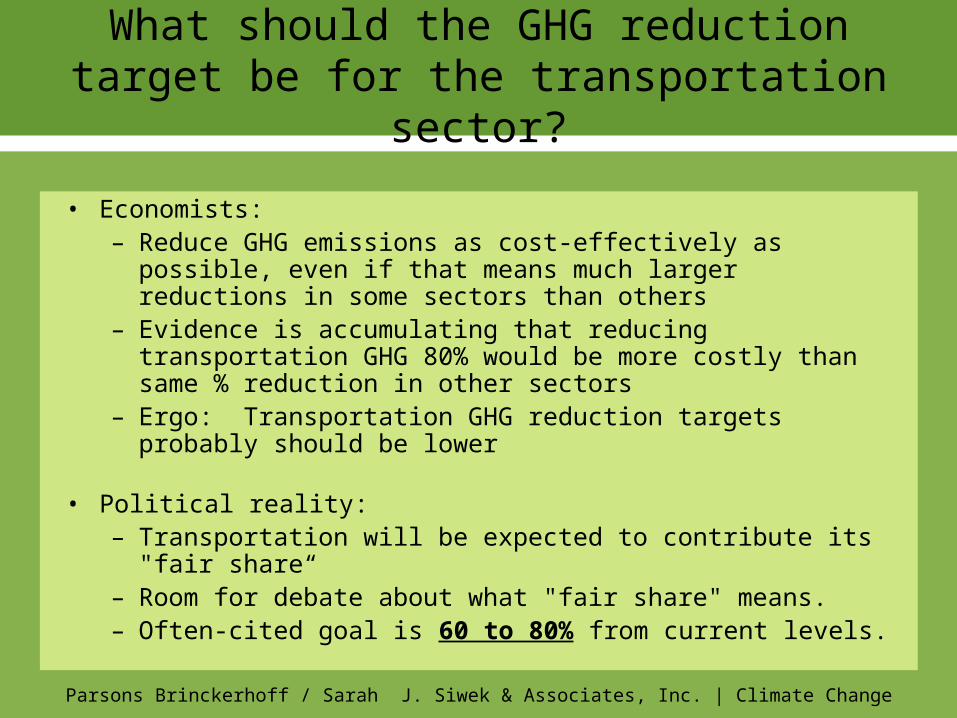
What should the GHG reduction target be for the transportation sector?
• Economists:– Reduce GHG emissions as cost-effectively as possible, even if
that means much larger reductions in some sectors than others– Evidence is accumulating that reducing transportation GHG
80% would be more costly than same % reduction in other sectors
– Ergo: Transportation GHG reduction targets probably should be lower
• Political reality: – Transportation will be expected to contribute its "fair share“ – Room for debate about what "fair share" means.– Often-cited goal is 60 to 80% from current levels.

Parsons Brinckerhoff / Sarah J. Siwek & Associates, Inc. | Climate Change
Policy debate can be intense
• Climate skeptics: Climate change isn’t happening, or isn’t human-induced
• Environmental view: Transform land use, increase transit, and reduce VMT
• Techno-optimist view: Transform vehicle/fuel technology and improve highway/driver operations
• Pragmatic view: Combination -- mostly vehicles/fuels, some operational efficiency, plus modest role for land use, transit, and VMT moderation

Parsons Brinckerhoff / Sarah J. Siwek & Associates, Inc. | Climate Change
State Climate Action Plans Source: Pew Center on Climate Change

Parsons Brinckerhoff / Sarah J. Siwek & Associates, Inc. | Climate Change
State Climate Action Plans
• Highly “aspirational”
• Managed by state environmental agencies
• Steering Committees included multiple environmental advocates and rarely had transportation agency reps
• State DOT involvement was at a technical advisory level, whose input was often rebuffed
• Example: VT strategies would reduce 2030 VMT from 10.5 B (base case) to 3.9 B

Parsons Brinckerhoff / Sarah J. Siwek & Associates, Inc. | Climate Change
State Climate Plans – Transportation Share Of GHG Reductions Varies Widely
State Year % Reduction in Transportation GHG
% of all GHG Reductions from Transportation
Rhode Island 2020 N/A 20%
New York 2020 18% 7%
Connecticut 2020 N/A 7%
Pennsylvania 2025 30% 8%
Maine 2020 23% 27%
Minnesota 2025 27% 5%
Oregon 2025 25% 8%
New Mexico 2020 30% 8%
Colorado 2020 22% 6%
North Carolina 2020 31% 11%

Parsons Brinckerhoff / Sarah J. Siwek & Associates, Inc. | Climate Change
State Climate Plans – Transportation Elements Vary All Across the Map
State Year VehicleLow
Carbon Fuels
Smart Growth and
TransitOther
RI 2020 46% 10% 31% 14%
NC 2020 35% 12% 38% 15%
SC 2020 14% 55% 29% 1%
CT 2020 51% 38% 8% 2%
ME 2020 53% 25% 21% 1%
MD 2025 24% 12% 45% 20%
NY 2020 59% 11% 27% 4%
PA 2025 45% 36% 18% 0%
MN 2025 15% 35% 25% 25%
VT 2028 21% 14% 49% 17%

Parsons Brinckerhoff / Sarah J. Siwek & Associates, Inc. | Climate Change
Hawai’i Clean Energy Initiative

Parsons Brinckerhoff / Sarah J. Siwek & Associates, Inc. | Climate Change
Hawai’i Clean Energy Initiative (continued)
Partnership to accelerate system transformation:
• Achieve a 70% clean energy economy for Hawai’i within a generation
• Increase Hawai’i’s security
• Capture economic benefits of clean energy for all levels of society
• Foster and demonstrate innovation
• Build the workforce of the future
• Serve as a model for the U.S. and the world

Parsons Brinckerhoff / Sarah J. Siwek & Associates, Inc. | Climate Change
Hawai’i Clean Energy Initiative (continued)

Parsons Brinckerhoff / Sarah J. Siwek & Associates, Inc. | Climate Change
Hawai’i Clean Energy Solutions Act 234
Caps state GHG at 1990 levels by 2020
Motivation:
• Islands are likely to be disproportionately affected
• All places/people are responsible for GHG mitigation
• Hawai’i is 0.3% of U.S. GHG emissions– Not in spite of… because of
– Leadership role in U.S. and Pacific
A mechanism to make HCEI a reality
Emphasizes market-based mechanisms– Minimize leakage

Parsons Brinckerhoff / Sarah J. Siwek & Associates, Inc. | Climate Change
What are Other State DOTs Doing on Climate Change?
• California: http://www.dot.ca.gov/docs/ClimateReport.pdf• Maryland:
http://www.mde.state.md.us/assets/document/Air/ClimateChange/Appendix_C_%20MDOT_CLimate_Action_Process.pdf
• Oregon: http://www.oregon.gov/ODOT/SUS/docs/EffortsOnClimate
Change2008.pdf• Vermont: http://www.aot.state.vt.us/planning/Documents/Planning/
VTransClimateActionPlanfinal1.pdf• Washington: http://www.wsdot.wa.gov/environment/climatechange/• New York: http://www.nysdot.gov/nasto/repository/WS4d_Zamurs
%20_AASHTO_0.ppt

Parsons Brinckerhoff / Sarah J. Siwek & Associates, Inc. | Climate Change
GHG reduction debates overshadow 2 more challenges bearing down on state DOTs
• New revenue sources: New revenue sources are needed that are appropriate in a climate change-dominated world, with electric vehicles and new fuels
• Climate adaptation: Huge funding increases, risk-based planning and programming, and tough policy decisions will be needed to adapt to a changing climate

Parsons Brinckerhoff / Sarah J. Siwek & Associates, Inc. | Climate Change
Summary
• DOTs may be expected to reduce transportation GHG by 60-80% by 2050
• Many state climate action plans include “aspirational” transportation elements that have not been thoroughly analyzed or vetted
• VMT reductions may be expected or required• Lower VMT and more fuel efficient cars will
exacerbate the transportation revenue dilemma – new revenue sources will be needed

Parsons Brinckerhoff / Sarah J. Siwek & Associates, Inc. | Climate Change
III. Federal Climate Change Legislation

Parsons Brinckerhoff / Sarah J. Siwek & Associates, Inc. | Climate Change
Federal Climate Legislation and Policy are Taking Shape
• AASHTO position
• EPA proposed “endangerment” finding
• (section 202(a) of CAA
• “Cap and Trade” bills
• 2010 Senate Bill - Kerry-Lieberman

Parsons Brinckerhoff / Sarah J. Siwek & Associates, Inc. | Climate Change
AASHTO Position on Climate Change
• Major R&D to decarbonize vehicles/fuels (comparable to “man on the moon”)
• Reduce VMT growth to 1%/year• Double transit ridership• Increase intercity passenger rail• $100 M/year Federal funding for coordinated land
use/transportation planning• Oppose GHG conformity requirement• See AASHTO “Real Transportation Solutions” at
http://www.climatechange.transportation.org/

Parsons Brinckerhoff / Sarah J. Siwek & Associates, Inc. | Climate Change
Clean Air Act – EPA Endangerment Finding
• EPA can regulate GHG under existing Clean Air Act (CAA)• December 2009 EPA finding:
– Atmospheric concentrations of GHG “endanger” public health and welfare (per CAA section 202(a))
– Emissions of GHG from new motor vehicles “contribute to” air pollution which is endangering public health and welfare
• Based on this finding EPA is obligated to regulate GHG (e.g., GHG standards for autos)
• GHG conformity possible, but not likely• Endangerment finding challenged by several states

Parsons Brinckerhoff / Sarah J. Siwek & Associates, Inc. | Climate Change
Federal Climate Legislation - Status
• House: Passed Waxman-Markey bill on the floor in 2009
• Senate: Boxer-Kerry bill reached floor in 2009, then stalled
• Senate: Kerry-Lieberman introduced May 12, 2010
• President Obama: Strongly supports cap-and-trade legislation

Parsons Brinckerhoff / Sarah J. Siwek & Associates, Inc. | Climate Change
Federal Legislation – Major Elements of Climate Bills
• Cap-and-Trade– Sets “cap” on GHG emissions; cap declines over time
• Energy Production– Provides incentives and other support for production of renewable
energy (and maybe nuclear, oil & gas)• Energy Efficiency
– Provides incentives and tighter regulations to promote greater efficiency – buildings, appliances, vehicles, etc.
• Transition Assistance– Provides assistance to ease impact of higher energy prices on
consumers and U.S. industries Source: Bill Malley, Perkins Coie

Parsons Brinckerhoff / Sarah J. Siwek & Associates, Inc. | Climate Change
2010 Senate Bill: Kerry-Lieberman – American Power Act
• Introduced May 12, 2010• Calls for reductions from 2005 baseline
– 17% by 2020– 42% by 2030– 83% by 2050
• Sets national GHG emissions cap – Transportation fuels under the cap– Tptn fuel producers and importers would purchase emissions
allowances at a fixed price ($12 - $25/ton carbon)– Tptn carbon price would increase at 3% over inflation/year)
• Imposes transportation planning requirements on states and large MPOs

Parsons Brinckerhoff / Sarah J. Siwek & Associates, Inc. | Climate Change
2010 Senate Bill: Kerry-Lieberman – American Power Act (continued)
States and large MPOs (over 200,000 population) must:– Develop GHG targets and strategies– Integrate GHG targets and strategies into plans– Demonstrate progress in stabilizing and reducing GHG emissions
to contribute to achievement of national targets
USEPA is to:– Issue standardized emissions models and methods
USDOT is to:– Determine whether state and MPO plans comply– Administer performance awards (additional funding) for states with
approved plans

Parsons Brinckerhoff / Sarah J. Siwek & Associates, Inc. | Climate Change
2010 Senate Bill: Kerry-Lieberman – American Power Act (continued)
• Provides transportation infrastructure & planning funding • $6.25 billion annually
• One-third to Highway Trust Fund up to $2.5 b/yr• One-third to TIGER grant program $1.875 b/yr• One third for transportation planning and
implementation $1.875 b/yr• Pre-empts states from implementing mandatory GHG
reductions and restricts EPA ability to regulate under CAA• Large portion of funds collected through cost of carbon
related to fuels would be diverted to uses other than transportation

Parsons Brinckerhoff / Sarah J. Siwek & Associates, Inc. | Climate Change
Federal Climate Legislation –Basics of Cap and Trade
How a cap-and-trade program works:– Set a cap on total GHG emissions, and reduce it over time
• 17 to 20% reduction by 2020• 83% reduction by 2050
– Issue "allowances" to emit GHGs within the cap• Some allowances are auctioned; others distributed free
– “Allowances” are an economic asset that can be traded• Receiving a free allowance is like receiving dollars
– “Offsets” can be purchased in lieu of allowances• An offset is obtained by paying for a reduction made by sources
outside the cap, including sources in other countries• Example: pay to avoid deforestation in a developing country
Source: Bill Malley, Perkins Coie

Parsons Brinckerhoff / Sarah J. Siwek & Associates, Inc. | Climate Change
Federal Climate Legislation –Impact on Transportation Fuel Prices
• How would the House and Senate bills affect the price of transportation fuels?– EPA analysis of House Bill (6/23/09) estimated House bill would
raise gas prices by 14 cents/gallon by 2015– EPA makes two key assumptions:
• Relatively low cost to adopt new technologies that reduce GHG emissions, such as carbon capture and sequestration (CCS)
• Relatively widespread use of "offsets"– Without these assumptions, prices could be much higher.– EPA has not yet released an estimate of the gasoline price
impacts of the 2010 Senate bill
Source: Bill Malley, Perkins-Coie

Parsons Brinckerhoff / Sarah J. Siwek & Associates, Inc. | Climate Change
Federal Climate Legislation –Impact on Transportation Fuel Prices
2015 2030 2050
EPA Projection $0.14 $0.24 $0.69
CRA: Base Case $0.19 $0.38 $0.95
CRA: "Low-Cost" $0.17 $0.34 $0.84
CRA: "High-Cost" $0.36 $0.71 $1.82
CRA: "No International Offsets"
$0.52 $1.08 $2.79
Source for CRA Estimates: CRA International, "Impact on the Economy of the American Clean Energy and Security Act of 2009 (H.R.2454), pp. 4 and 64-66.

Parsons Brinckerhoff / Sarah J. Siwek & Associates, Inc. | Climate Change
House and Senate Bills Have Small Impact on Transportation GHG
EPA projects that the price signal from cap-and-trade would have little effect on transportation emissions
"The increase in gasoline prices that results from the increase in the carbon price … is not sufficient to substantially change consumer behavior in their vehicle miles traveled or vehicle purchases …."
"The relatively modest indirect price signal on vehicle manufacturers from this particular cap-and-trade policy creates little incentive for the introduction of low-GHG automotive technology."
Source: http://www.epa.gov/climatechange/economics/economicanalyses.html

Parsons Brinckerhoff / Sarah J. Siwek & Associates, Inc. | Climate Change
IV. Planning and NEPA Issues

Parsons Brinckerhoff / Sarah J. Siwek & Associates, Inc. | Climate Change
Federal Legislation – Transportation Planning Provisions (proposed)
• TARGETS AND STRATEGIES: States and TMA MPOs must develop GHG reduction targets and strategies, as part of transportation plans
• PROGRESS: States and TMA MPOs must “demonstrate progress in stabilizing and reducing” GHG emissions
• METHODOLOGIES: EPA must issue regulations on transportation GHG goals, standardized models, methodologies, and data collection
• CERTIFICATION: US DOT shall not certify state or MPO plans that fail to “develop, submit or publish emission reduction targets and strategies”
• PERFORMANCE REQUIREMENTS: US DOT must establish requirements, including performance measures, “to ensure that transportation plans… sufficiently meet the requirements.., including achieving progress towards national transportation-related GHG emissions reduction goals.”

Parsons Brinckerhoff / Sarah J. Siwek & Associates, Inc. | Climate Change
Transportation Planning – Many GHG Issues and Implications
• GHG planning will be impacted by both state and federal policies• Both state DOTs and MPOs will be affected• Inventories of transportation GHG will probably be required• GHG reduction targets will probably be required• Methodologies to predict GHG for different plans and strategies will be needed• Many Clean Air Act planning issues will carry over into GHG planning – modeling limitations, induced
demand, VMT reduction expectations, uncertainties about travel behavior, land use expectations, etc.• A major new issue – high degree of uncertainly about future potential new technology and fuels to reduce
GHG• Another key issue -- whether/how to include “upstream” and “life cycle” GHG of transportation
• TARGETS AND STRATEGIES: States and TMA MPOs must develop GHG reduction targets and strategies, as part of transportation plans
• PROGRESS: States and TMA MPOs must “demonstrate progress in stabilizing and reducing” GHG emissions• METHODOLOGIES: EPA must issue regulations on transportation GHG goals, standardized models, methodologies,
and data collection• CERTIFICATION: US DOT shall not certify state or MPO plans that fail to “develop, submit or publish emission
reduction targets and strategies”• PERFORMANCE REQUIREMENTS: US DOT must establish requirements, including performance measures, “to
ensure that transportation plans… sufficiently meet the requirements.., including achieving progress towards national transportation-related GHG emissions reduction goals.”

Parsons Brinckerhoff / Sarah J. Siwek & Associates, Inc. | Climate Change
NEPA: Draft CEQ Guidance
• Draft issued by CEQ on February 18, 2010• Comments were due: May 24, 2010• Proposal:
– Evaluate proposed actions that are reasonably expected to cause direct emissions of 25,000 metric tons or more of CO2-equivalent on an annual basis
– Quantify cumulative emissions over the life of the project
– Consider impact of climate change on the project

Parsons Brinckerhoff / Sarah J. Siwek & Associates, Inc. | Climate Change
NEPA: Potential GHG Considerations
• Emissions from vehicles using the highway– In no-action and build alternatives– Usually treated as direct emissions in NEPA air quality
analysis• Construction-related emissions• Up-stream emissions from fueling cycle (drilling, refining,
shipping, etc.) and vehicle cycle• Others?
– Life cycle emissions? – Emissions effects of land use changes, roadway maintenance
and lighting, etc.

Parsons Brinckerhoff / Sarah J. Siwek & Associates, Inc. | Climate Change
NEPA: Roadway GHG Emissions
25,000 metric tons = 43,000,000 VMT/year or about 120,000 VMT/day
– Examples: • One-mile highway with 120,000 new ADT• Two-mile highway with 60,000 new ADT
– Action that would increase VMT by 120,000/day (NEW VMT) would trigger analysis, with all else being equal (e.g. speeds, congestion, fleet mix, etc.)

Parsons Brinckerhoff / Sarah J. Siwek & Associates, Inc. | Climate Change
NEPA: Future Roadway GHG Emissions
• 25,000 tons is based on annual emissions over life of the project
• Future fuel economy projected by US DOE– 2020 fleet - ~14% more fuel efficient than 2010 fleet;
raises VMT threshold to 137,000 VMT/day• Upstream and downstream emissions?
– Fuel supply (well to pump) and vehicle manufacture and disposal included in EPA national inventories
– Proposed approach would add 40% to emissions generated to account for upstream and downstream emissions
• 120,000 VMT becomes 86,000 VMT IF 40% and upstream/downstream emissions included
Parsons Brinckerhoff / Sarah J. Siwek & Associates, Inc. | Climate Change
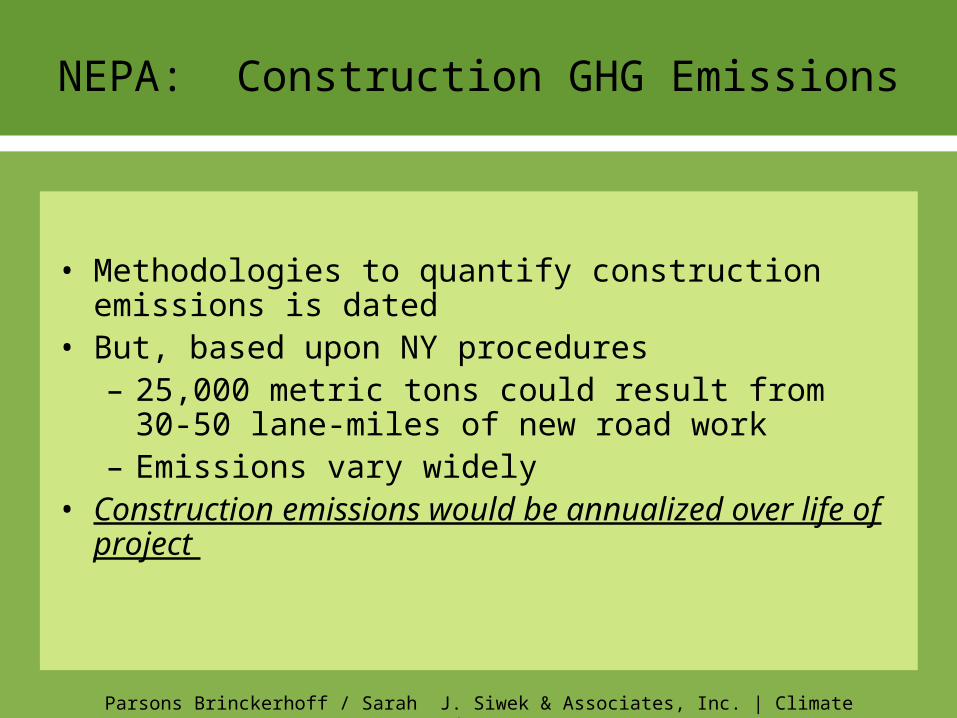
NEPA: Construction GHG Emissions
• Methodologies to quantify construction emissions is dated
• But, based upon NY procedures– 25,000 metric tons could result from 30-50 lane-miles
of new road work – Emissions vary widely
• Construction emissions would be annualized over life of project

Parsons Brinckerhoff / Sarah J. Siwek & Associates, Inc. | Climate Change
NEPA: Construction GHG EmissionsSource: NYSDOT
Construction Energy Factors -- Lane-Mile Approach
Type of ImprovementConstruction Energy Consumed per
Rurala-Lane-Mile (10^9 Btu/mi) CO2, tonnes
New construction 12.70 637
Relocation 10.50 526
Reconstruction 5.20 261
Restoration and rehabilitation 2.30 115
Resurfacing 0.75 38
Major widening 5.00 251
Minor widening 1.90 95
New Bridges 192 9624
Bridge Replacement 222 11128
Major rehabilitation 134.4 6737
Minor rehabilitation 11.91 597a Increase rural energy consumption by 20% for urban construction

Parsons Brinckerhoff / Sarah J. Siwek & Associates, Inc. | Climate Change
NEPA: Projects Potentially Triggering GHG Analysis
• New 6-lane bridge, – 1.2 miles long, 100,000 ADT, 70 mph (in 2020,
114,400 ADT)• New 4-lane highway,
– 3.5 miles long, 40,000 ADT, 70 mph (2020, 45,800 ADT)
• New 2-lane highway, – 6 miles long, 25,000 ADT, 60 mph (2020 ADT 28,600)
• Widening existing highway – – 6 to 10 lanes, 13 miles, speeds increase from 60 to 70
mph (2020 volumes could increase by 14%)• Transit Projects - Light-Rail, Heavy-rail, Inter-city Rail?

Parsons Brinckerhoff / Sarah J. Siwek & Associates, Inc. | Climate Change
NEPA: Also Consider Climate Impacts on Project
• Climate Adaptation Planning– Discuss climate change effects that should be
considered in project development such as flooding in low lying areas, development of coastal infrastructure
– Also discuss reasonably foreseeable future conditions with no action
• Guidance provides references to useful materials and links.
Parsons Brinckerhoff / Sarah J. Siwek & Associates, Inc. | Climate Change
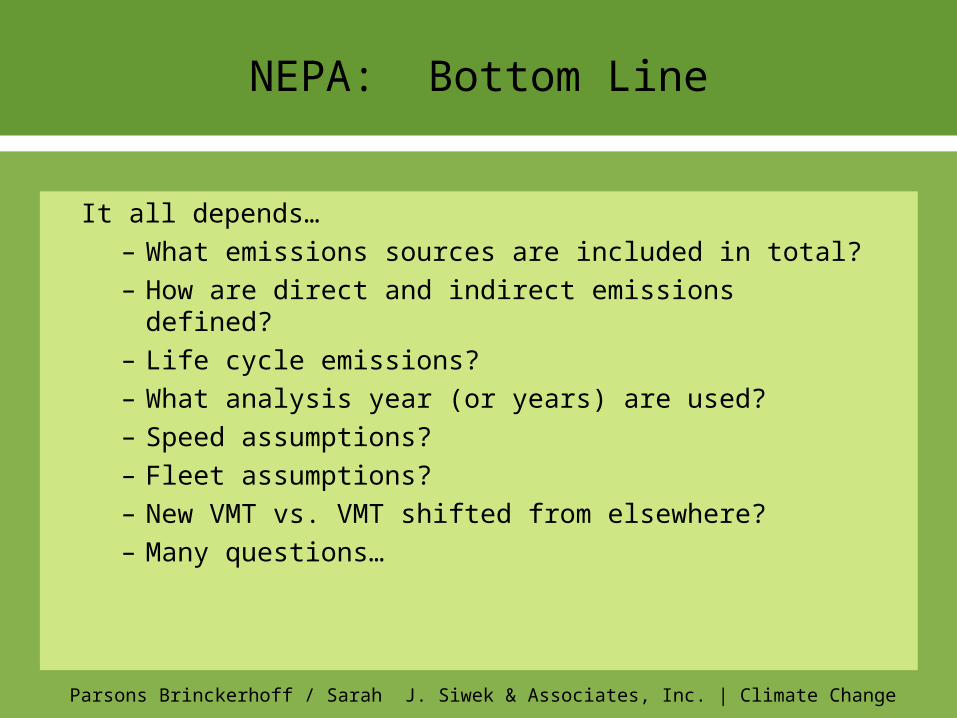
NEPA: Bottom Line
It all depends…– What emissions sources are included in total?– How are direct and indirect emissions defined?– Life cycle emissions?– What analysis year (or years) are used?– Speed assumptions? – Fleet assumptions?– New VMT vs. VMT shifted from elsewhere? – Many questions…

Parsons Brinckerhoff / Sarah J. Siwek & Associates, Inc. | Climate Change
Recent History –Court Rulings on NEPA/GHG
3 cases overturned FONSI/EA/EIS for lack of climate analysis:– Center for Biological Diversity et al. v. NHTSA– Mid States Coalition for Progress v. Surface Transportation
Board– Border Power Plan Working Group v. DOE
4 cases upheld lack of climate analysis or sufficiency of analysis:– Audubon v. DOT, 2007– Friends of the Earth v. Mosbacher, 2007– Association of Public Agency Customers, Inc. v. Bonneville
Power Admin, 1997– Mayo Foundation v. Surface Transportation Board, 2006

Parsons Brinckerhoff / Sarah J. Siwek & Associates, Inc. | Climate Change
DEIS for Columbia River Crossing
• Won national award for GHG analysis from National Association of Environmental Professionals
• DEIS issued May 2008• Project is for congested river crossing between Portland
OR and Vancouver WA• Estimated cost of $3.1 - $4.2 billion• 4 build alternatives – all are a combination of transit
(BRT or LRT) and improved highway capacity

Parsons Brinckerhoff / Sarah J. Siwek & Associates, Inc. | Climate Change
DEIS for Columbia River Crossing

Parsons Brinckerhoff / Sarah J. Siwek & Associates, Inc. | Climate Change
DEIS for Columbia River Crossing- GHG Results
• Build alternatives have lower GHG than no-build• Relatively small differences among build
alternatives• Transit GHG emissions varied substantially• Highest GHG: The alternative with more transit,
higher toll, and less highway improvement Source: Colin McConnaha, Parametrix, Inc.

Parsons Brinckerhoff / Sarah J. Siwek & Associates, Inc. | Climate Change
One Emerging Tool: GreenSTEP
GreenSTEP = Greenhouse gas State Transportation Emissions Planning model
• A statewide planning model to help Oregon develop a statewide transportation strategy on greenhouse gas (GHG) emissions
• Complements metropolitan travel demand models and ODOT’s integrated statewide model
• Peer Review by Oregon travel modelers and experts in other disciplines
• Many elements have been estimated using 2001 NHTS data
• Open source model developed and implemented in open source software (R programming language)
• Partially developed with FHWA SPR program funds

Parsons Brinckerhoff / Sarah J. Siwek & Associates, Inc. | Climate Change
GreenSTEP Overview
Synthetic Household Generation
Urban area land use and transportation system characteristics
Household vehicle ownership
Household vehicle travel
Household vehicle characteristics
Demand management program adjustments to VMT
MPG adjustments due to congestion
Fuel consumption by type
Heavy vehicle VMT
CO2 equivalent emissions by fuel type (including well to wheels)
Adjust household income due to travel cost change
1x
Indi
vidu
al H
ouse
hold
Lev
elA
ggregate Level

Parsons Brinckerhoff / Sarah J. Siwek & Associates, Inc. | Climate Change
GreenSTEP Inputs
• Demographic changes
• Relative amounts of development occurring in urban and rural areas
• Metropolitan and other urban area densities
• Urban form
• Amounts of metropolitan area public transit service
• Highway capacity
• Vehicle fuel efficiency
• Vehicle ages
• Electric vehicles
• Fuel & carbon pricing
• VMT pricing
• Demand management
• Effects of congestion on fuel economy
• Carbon content of fuels – including well to wheels impacts
• CO2 production from electrical power use for transportation

Parsons Brinckerhoff / Sarah J. Siwek & Associates, Inc. | Climate Change
GreenSTEP can Analyze Many Different Strategies
Fuel Economy & Costs Urban Planning Vehicle Tech & Fuel
1990 2000 2010 2020 2030 2040
2.0
e+
10
2.5
e+
10
3.0
e+
10
3.5
e+
10
4.0
e+
10
4.5
e+
10
Annual CO2 Equivalent EmissionsPrice Scenarios
Year
Po
un
ds
CO
2 E
qu
iva
len
ts
Med Lt Veh EffHigh Lt Veh EffHigh Cost & Med Lt Veh EffHigh Cost & High Lt Veh Eff
1990 2000 2010 2020 2030 2040
2.0
e+
10
2.5
e+
10
3.0
e+
10
3.5
e+
10
4.0
e+
10
4.5
e+
10
Annual CO2 Equivalent EmissionsDensity Scenarios
Year
Po
un
ds
CO
2 E
qu
iva
len
ts
Med Lt Veh EffMed Lt Veh Eff & More DenMed Lt Veh Eff, More Den & More PT
1990 2000 2010 2020 2030 2040
2.0
e+
10
2.5
e+
10
3.0
e+
10
3.5
e+
10
4.0
e+
10
4.5
e+
10
Annual CO2 Equivalent EmissionsAll Vehicle Efficiency & Fuels Scenarios
Year
Po
un
ds
CO
2 E
qu
iva
len
ts
Med Lt Veh EffHigh Lt Veh EffEV & High Lt Veh EffEV & High All Veh EffEV, High All Veh Eff & Low Carb Fuel

Parsons Brinckerhoff / Sarah J. Siwek & Associates, Inc. | Climate Change
Summary
• Transportation planning process will need to consider GHG emissions and climate change impacts
• CEQ Draft Guidance will impact required NEPA Analysis• Consider both
* impact of project on GHG; and
* impact of climate change on project• Tools will be needed to evaluate GHG emissions• Documentation will be important• Mitigation actions can be helpful
Parsons Brinckerhoff / Sarah J. Siwek & Associates, Inc. | Climate Change
V. Climate Adaptation for Transportation

Parsons Brinckerhoff / Sarah J. Siwek & Associates, Inc. | Climate Change
Why Transportation Agencies Should Plan
for Adaptation
• Sea level rise & storm surges– Destruction of bridges– Erosion & permanent
inundation of roads– Disruption of evacuation
routes & road network– Bridge clearance
limitations• Other types of impacts
– Increased flooding– Pavement and rail
buckling– Increased flooding– More severe inland storms– Increased maintenance
Source: http://mceer.buffalo.edu/research/Reconnaissance/Katrina8-28-05/05BiloxiBay1/09lg.jpg
Parsons Brinckerhoff / Sarah J. Siwek & Associates, Inc. | Climate Change
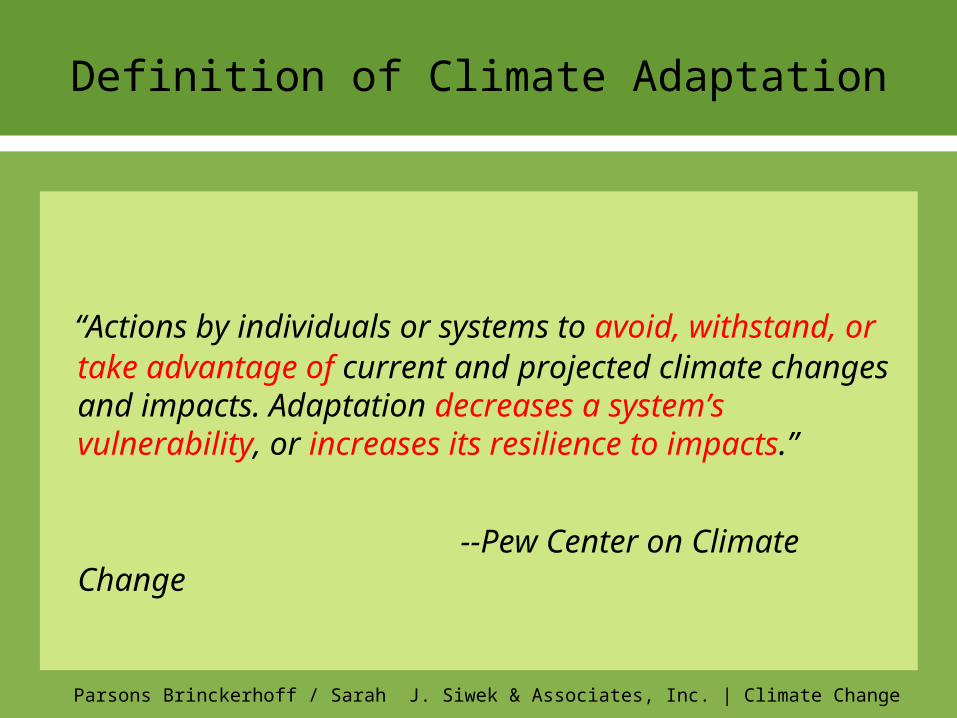
Definition of Climate Adaptation
“Actions by individuals or systems to avoid, withstand, or
take advantage of current and projected climate changes and impacts. Adaptation decreases a system’s vulnerability, or increases its resilience to impacts.”
--Pew Center on Climate Change
Parsons Brinckerhoff / Sarah J. Siwek & Associates, Inc. | Climate Change
Potential Impact of Climate Change
on U.S. Transportation(TRB Special Report 290)
Transportation Research BoardDivision on Earth & Life Studies National Research Council
Transportation Research Board Special Report 290
Parsons Brinckerhoff / Sarah J. Siwek & Associates, Inc. | Climate Change
TRB Special Report 290
• Climate change will affect every mode of transportation and every region in the United States, and the challenges to infrastructure providers will be new and often unfamiliar.
• State and local governments and private infrastructure providers will need to incorporate adjustments for climate change into long-term capital improvement plans, facility designs, maintenance practices, operations, and emergency response plans.

Parsons Brinckerhoff / Sarah J. Siwek & Associates, Inc. | Climate Change
TRB Special Report 290
• Design standards will need to be re-evaluated and new standards developed as progress is made in understanding future climate conditions and the options for addressing them.
• Transportation planners will need to consider climate change and its effects on infrastructure investments. Planning timeframes may need to extend beyond the next 20 or 30 years.
• Institutional arrangements for transportation planning and operations will need to be changed to incorporate cross jurisdictional and regional cooperation.
Parsons Brinckerhoff / Sarah J. Siwek & Associates, Inc. | Climate Change
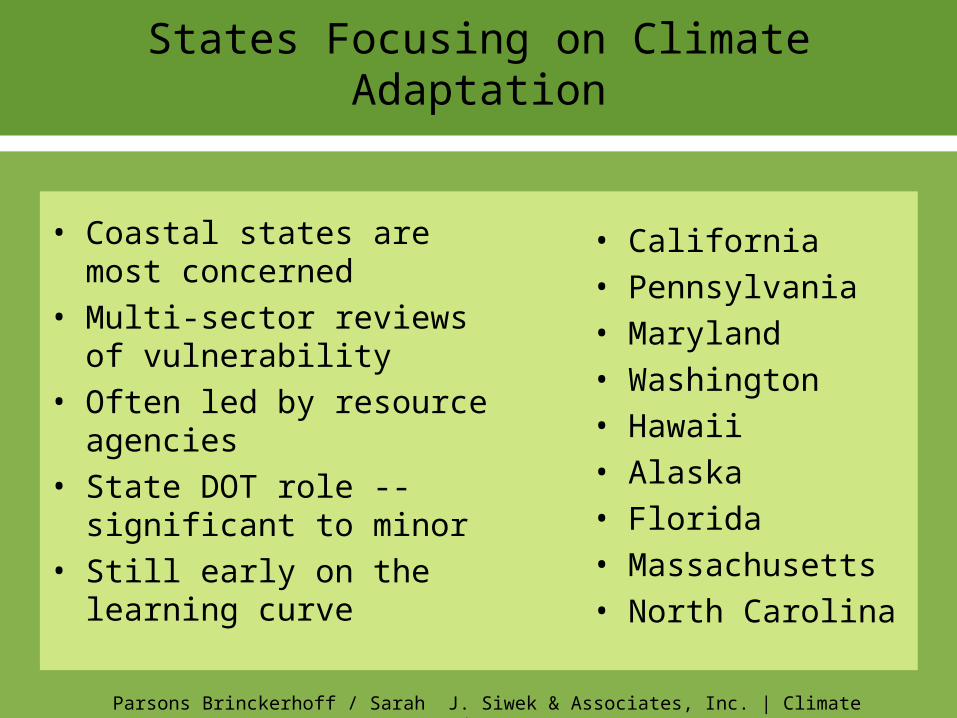
States Focusing on Climate Adaptation
• Coastal states are most concerned
• Multi-sector reviews of vulnerability
• Often led by resource agencies
• State DOT role -- significant to minor
• Still early on the learning curve
• California • Pennsylvania• Maryland• Washington• Hawaii• Alaska• Florida• Massachusetts• North Carolina

Parsons Brinckerhoff / Sarah J. Siwek & Associates, Inc. | Climate Change
Implications for Design
• Changes in bridge height• Changes in bridge foundation and superstructure• Changes in materials specifications• Changes in suspended and cable-stay bridges to
withstand more severe wind and turbulence• Changes in culvert design, capacity, and location• Changes in slope design• Changes in pavement drainage systems

Parsons Brinckerhoff / Sarah J. Siwek & Associates, Inc. | Climate Change
Implications for Maintenance/Operations
• Pavement rutting and rail buckling
• Longer construction season
• Closures and detours due to rock slides, soil erosion, flooding
• Speed reductions
• Flooding of culverts
• Change in weight restrictions
• More grass cutting/less snow plowing
• Work crew limitations during severe heat periods

Parsons Brinckerhoff / Sarah J. Siwek & Associates, Inc. | Climate Change
Implications for Environmental Reviews
• In NEPA process, sponsor must consider project vulnerability to future climate change
• US ACE may raise new issues in wetland permitting due to climate impacts
• USCG may raise climate impacts in bridge permitting
• DOI may raise issues & require more analysis for ESA, due to uncertainty of climate impacts on species

Parsons Brinckerhoff / Sarah J. Siwek & Associates, Inc. | Climate Change
“A Framework for Climate Change Adaptation in Hawaii”
• Issued November 2009• Collaborative effort of the Ocean Resources
Management Plan Working Group with assistance of University of Hawaii Center for Island Climate Adaptation and Policy
• “It is critical for the State to act now in order to prepare for … climate change so that we can better withstand the negative impacts and take advantage of positive opportunities.”

Parsons Brinckerhoff / Sarah J. Siwek & Associates, Inc. | Climate Change
A Framework for Climate Change Adaptation in Hawaii” (continued)
Proposed Framework:
A. Build Climate Change Adaptation Team
B. Develop and Adopt a Long-Term Vision
C. Identify Planning Areas and Opportunities
D. Scope Climate Change Impacts to Major Sectors
E. Conduct a Vulnerability Assessment
F. Conduct a Risk Assessment

Parsons Brinckerhoff / Sarah J. Siwek & Associates, Inc. | Climate Change
A Framework for Climate Change Adaptation in Hawaii” (continued)
Next Steps after Framework:
1. Prioritize areas for adaptation planning
2. Set preparedness goals
3. Develop, select, and prioritize preparedness actions
4. Implement preparedness plan
5. Monitor progress and update plan as appropriate

Parsons Brinckerhoff / Sarah J. Siwek & Associates, Inc. | Climate Change
A Framework for Climate Change Adaptation in Hawaii” (continued)
Transportation concerns identified in Framework:• Submersion of vital transportation infrastructure due to
sea level rise and flooding• Migration of beaches over coastal lands due to wave
climatology• Increased dependence on ocean transportation
networks due to higher fuel cost and submersion of roads and rails
• Higher cost of fuel and drive for clean energy increases need for public transit options

Parsons Brinckerhoff / Sarah J. Siwek & Associates, Inc. | Climate Change
Gulf Coast Study on Climate Change(Sponsored by US DOT)

Parsons Brinckerhoff / Sarah J. Siwek & Associates, Inc. | Climate Change
Gulf Coast Study on Climate Change – Highways and Relative Sea Level Rise

Parsons Brinckerhoff / Sarah J. Siwek & Associates, Inc. | Climate
Change
Gulf Coast Study on Climate Change – Range of Adaptation Approaches
Source: Mike Savonis, FHWA

Parsons Brinckerhoff / Sarah J. Siwek & Associates, Inc. | Climate Change
MASSDOT: Ongoing Adaptation Activities
• Monitor bridges through the Bridge Inspection program and Scour program to ensure safety and develop measures (armoring) to protect the structure until proposed replacement.
• Projects addressed on a case-by-case basis where flooding issues have been identified.
• Bridge projects with low-chord below 10-year flood are subject to more intense review. Two foot clearance preferred but ROW, Environmental, Cultural impacts must be considered.

Parsons Brinckerhoff / Sarah J. Siwek & Associates, Inc. | Climate Change
MASSDOT: Mid-Term Recommendations Being Considered for Coastal Areas
• Map coastal assets, using Light Detection and Ranging (LIDAR) survey
• Develop GIS based asset inventory• Perform sea level rise vulnerability assessment• Identify & prioritize critical transportation assets• Develop design requirements on a project-by-
project and priority basis

Parsons Brinckerhoff / Sarah J. Siwek & Associates, Inc. | Climate Change
U.K. Highways Agency Adaptation Strategy Model
• Model identified potential impacts of climate change of the UK road network
• Resulted in a climate change adaptation strategy
• Strategy addresses design, construction, and maintenance
• Includes a risk appraisal for all operations
1. Define ‘Objectives’ and
‘Decision making criteria’
2. Identify ‘Climatic Trends’
affecting Highways Agency
3. Identify Highways Agency
‘Vulnerabilities’
4. ‘Risk Appraisal’
6. Develop ‘Adaptation
Plans’
Plan
DoReview
Act
6. Develop ‘Adaptation
Plans’
Plan
DoReview
Act
6. Develop ‘Adaptation
Plans’
Plan
DoReview
Act
6. Develop and Implement
‘Adaptation Action Plans’
for each vulnerability
7. ‘Adaptation Programme
Review’
Co
nfirm
alig
nmen
t
‘Research’,‘Monitoring‘ or
periodic review
5. ‘Options Analysis’(to address
vulnerabilities)
5. ‘Options Analysis’(to address
vulnerabilities)
5. ‘Options Analysis’(to address
vulnerabilities)
5. ‘Options Analysis’
to address each vulnerability
1. Define ‘Objectives’ and
‘Decision making criteria’
2. Identify ‘Climatic Trends’
affecting Highways Agency
3. Identify Highways Agency
‘Vulnerabilities’
4. ‘Risk Appraisal’
6. Develop ‘Adaptation
Plans’
Plan
DoReview
Act
6. Develop ‘Adaptation
Plans’
Plan
DoReview
Act
6. Develop ‘Adaptation
Plans’
Plan
DoReview
Act
6. Develop ‘Adaptation
Plans’
Plan
DoReview
Act
6. Develop ‘Adaptation
Plans’
Plan
DoReview
Act
6. Develop ‘Adaptation
Plans’
Plan
DoReview
Act
6. Develop and Implement
‘Adaptation Action Plans’
for each vulnerability
7. ‘Adaptation Programme
Review’
Co
nfirm
alig
nmen
t
‘Research’,‘Monitoring‘ or
periodic review
5. ‘Options Analysis’(to address
vulnerabilities)
5. ‘Options Analysis’(to address
vulnerabilities)
5. ‘Options Analysis’(to address
vulnerabilities)
5. ‘Options Analysis’
to address each vulnerability

Parsons Brinckerhoff / Sarah J. Siwek & Associates, Inc. | Climate Change
Summary
• All modes of transportation threatened• Affects all transportation functions – planning,
programming, environment, location, design, construction, operations, emergency planning – and budgeting
• Low lying coastal areas especially vulnerable• Risk assessment and prioritization is key• Transportation planners need to be aware of and adapt
to climate change impacts on our transportation infrastructure
• Looming in future: where not to build or re-invest?

Parsons Brinckerhoff / Sarah J. Siwek & Associates, Inc. | Climate Change
VI. Strategies to Reduce Transportation GHGs

Parsons Brinckerhoff / Sarah J. Siwek & Associates, Inc. | Climate Change
Five GHG Reduction “Legs”
Transportation GHG reduction has 5 legs:
1. Vehicle efficiency
2. Low-carbon fuels
3. VMT Reductions (including land use)
4. Vehicle/System Operations
5. Construction, Maintenance, and Agency Operations
Examples:
• Higher CAFE standards 380 gm/mile to 250 gm/mile 2016
• CA’s low carbon fuel standard• Less travel, could be in part
due to land use changes• Signalization, ITS, Eco-driving• Materials, maintenance
practices

Parsons Brinckerhoff / Sarah J. Siwek & Associates, Inc. | Climate Change
Vehicle/Fuel Improvements Will be the Dominant Source of GHG Reductions for LDVs
By 2020-2030:
• 50% cut in GHG/mile is feasible from conventional technologies and biofuels
• Compare these GHG rates in U.S. and Europe:380 grams/mile 2009 in the U.S.
250 grams/mile 2016 under new Obama standard256 grams/mile 2007 actual in the E.U.209 grams/mile 2012 under E.U. regulation153 grams/mile 2020 under E.U. regulation
• LDV purchase cost will rise, but fuel savings will be greater than vehicle cost increase
• Win-win-win: reduces energy use, reduces GHG, saves money

Parsons Brinckerhoff / Sarah J. Siwek & Associates, Inc. | Climate Change
2010 NHTSA/EPA Rule Significantly Reduces Highway GHG Below Baseline

Parsons Brinckerhoff / Sarah J. Siwek & Associates, Inc. | Climate Change
Potential Fuel Economy Increase by 2030

Parsons Brinckerhoff / Sarah J. Siwek & Associates, Inc. | Climate Change
Low-Carbon Fuels
• Many different low-carbon fuel possibilities:– Corn ethanol - Sugar cane ethanol - Diesel– Cellulosic biofuel - Algae biofuels - Hydrogen– Electricity from renewable energy or nuclear power– Electricity from utilities with carbon capture & storage
• Carbon intensity measured as GHG/unit of energy – must account for “life-cycle” emissions
• California LCFS:– Adopted in 2008– Aims to reduce carbon intensity of passenger vehicle fuels by 10% by
2020– Measures carbon-intensity on a life-cycle basis – "from field to wheel."

Parsons Brinckerhoff / Sarah J. Siwek & Associates, Inc. | Climate Change
GHG Intensity of Different Fuels

Parsons Brinckerhoff / Sarah J. Siwek & Associates, Inc. | Climate Change
Renewable Fuel Standard
• EISA of 2007 requires use of 36 billion gallons of biofuels by 2022.– Includes 21 billion
gallons of advanced biofuels
– Up from 5 billion in 2006.• To achieve that goal, EPA
mandates % of biofuels to be blended into all gasoline.
Biofuel Usage Mandates under EISA(billions of gallons)
Source: Bill Malley, Perkins-Cole
0
10
20
30
40
2001 2006 2008 2010 2015 2018 2022
Regular Advanced

Parsons Brinckerhoff / Sarah J. Siwek & Associates, Inc. | Climate Change
Possible State DOT Roles in Decarbonization
1. Influence state policies on low-carbon fuels/vehicles2. Use planning scenarios to emphasize need for
decarbonization3. Plan/provide plug-in infrastructure for electric and PHEV
vehicles (coordinate with utilities)4. Support federal transportation funding for technology/fuel
R&D5. Educate the public and elected officials6. Provide incentives for consumers to use lower carbon
fuels/vehicles (lower fees for low-carbon vehicles/fuels)7. Support low -carbon fleet conversion for state vehicle fleets8. Adjust facilities and operations to accommodate decarbonized vehicles and fuels
Parsons Brinckerhoff / Sarah J. Siwek & Associates, Inc. | Climate Change
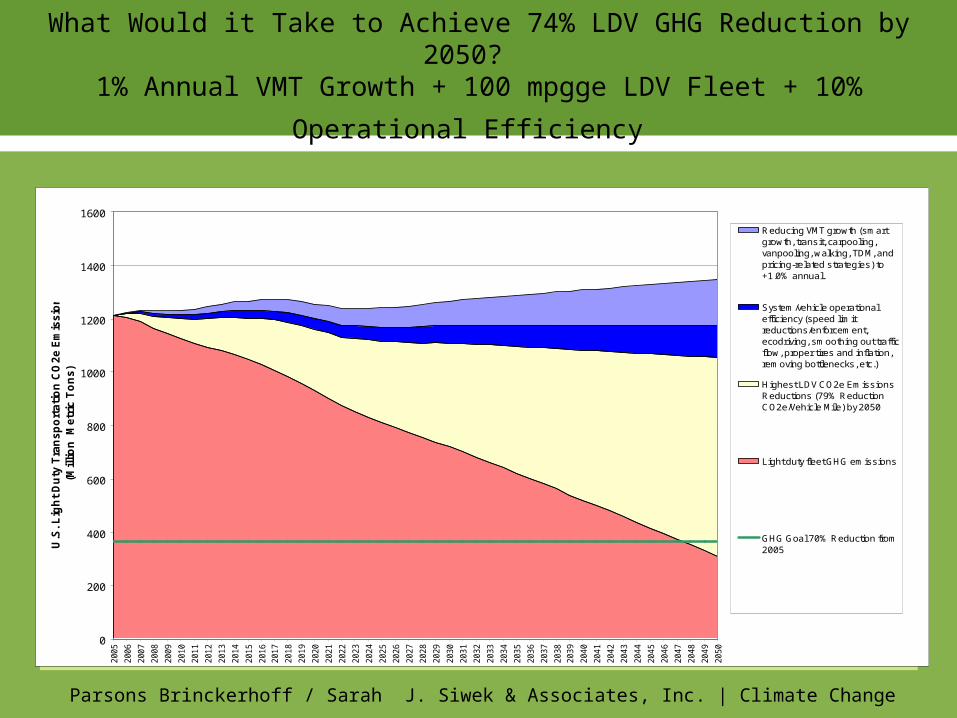
What Would it Take to Achieve 74% LDV GHG Reduction by 2050?
1% Annual VMT Growth + 100 mpgge LDV Fleet + 10% Operational Efficiency
0
200
400
600
800
1000
1200
1400
1600
2005
2006
2007
2008
2009
2010
2011
2012
2013
2014
2015
2016
2017
2018
2019
2020
2021
2022
2023
2024
2025
2026
2027
2028
2029
2030
2031
2032
2033
2034
2035
2036
2037
2038
2039
2040
2041
2042
2043
2044
2045
2046
2047
2048
2049
2050
U.S
. L
igh
t D
uty
Tra
ns
po
rta
tio
n C
O2
e E
mis
sio
ns
(M
illi
on
M
etr
ic T
on
s)
Reducing VMT growth (smartgrowth, transit, carpooling,vanpooling, walking, TDM, andpricing-related strategies) to+1.0% annual.
System/vehicle operationalefficiency (speed limitreductions/enforcement,ecodriving, smoothing out trafficflow, proper tires and inflation,removing bottlenecks, etc.)
Highest LDV CO2e EmissionsReductions (79% ReductionCO2e/Vehicle Mile) by 2050
Light duty fleet GHG emissions
GHG Goal 70% Reduction from2005

Parsons Brinckerhoff / Sarah J. Siwek & Associates, Inc. | Climate Change
Many Strategies to Reduce LDV VMT
• Economy-wide carbon cap and trade (raises fuel prices)• Transportation pricing (PAYD insurance, parking pricing, tolls,
higher user fees, cordon pricing, congestion pricing, etc.)• Carpooling and vanpooling (currently carry 7 times as much work
trip PMT as transit)• Bike/ped and transit (but some transit is higher GHG than LDV)• Trip chaining• Tele-working, tele-shopping, tele-education, tele-medicine• Compact land use
________________ In 2008, when fuel prices spiked and VMT dropped, where did it
go? We know <2% of the lost VMT went to transit, but don’t know where the rest of the drop went.

Parsons Brinckerhoff / Sarah J. Siwek & Associates, Inc. | Climate Change
Cautionary Note on VMT as Metric
• Does not take into account:– Type of fuel– Fuel efficiency of vehicle– Passenger vs freight trip– Number of passengers per vehicle
• As light duty passenger fuel economy increases, cost effectiveness diminishes– TCM lessons from 1990s – marginal emission
reductions, increasing costs as technology improves

Parsons Brinckerhoff / Sarah J. Siwek & Associates, Inc. | Climate Change
Pricing – A Necessary and Powerful Tool
• Without price signals, reducing driving extremely difficult• Pricing incentivizes 3 legs of the GHG stool
• Purchase of lower-carbon vehicles and fuels; and• Lower VMT• Eco-driving behavior
• Many different pricing tools available: auto “feebates,” carbon/fuel prices, PAYD insurance, mileage fees, parking pricing, congestion pricing, etc.
• Pricing produces revenue to invest in alternatives “We know we need to get ready for a world in which
energy will only be more expensive.” -- Wal-Mart

Parsons Brinckerhoff / Sarah J. Siwek & Associates, Inc. | Climate Change
Consumers Respond to Prices

Parsons Brinckerhoff / Sarah J. Siwek & Associates, Inc. | Climate Change
Carpooling and Vanpooling
• Important but underappreciated (7 times as many PMT for work trips nationally are in carpools and vanpools as on transit)
• Low cost for government, wide availability, saves users money
• Effective in all kinds of areas – rural, small urban areas, suburban, urban
• Nearer-term payoff than most transportation strategies• Atlanta MPO and WASHCOG pay for commuters to
carpool ($3/day Atlanta, $2/day WASHCOG)

Parsons Brinckerhoff / Sarah J. Siwek & Associates, Inc. | Climate Change
Transit Helps Reduce GHG – but has Small Impact Nationally
• Transit serves many goals and has broad support, but transit serves just 1% of PMT and 0% of freight
• DOE: Bus transit has higher GHG/passenger mile traveled than average auto use in the U.S.
• APTA studies: (a) Transit reduced GHG by 6.9 MMT in 2005; or (b) by 35 MMT in 2005. This is 0.3% to 1.7% of U.S. transportation GHG
• Transit GHG benefits are realized with highly patronized services in high volume corridors -- a market limited to high volume, generally densely developed corridors.

CO2e Emissions Per Passenger Mile for Various Modes
NATIONAL AVERAGE Energy Intensities Load Factor Co2e
(Btu or kWhrper vehicle mile)
(Btu or kWhrper per passenger
mile)Persons Per
Vehicle
(Estimated Pounds Co2e Per Passenger Mile)
Single Occupancy Vehicle (SOV) LDV’s 5,987 5,987 1.00 0.99
Personal Trucks at Average Occupancy 6,785 4,329 1.72 0.71
Transit Bus 37,310 4,318 8.80 0.71
Cars at Average Occupancy 5,514 3,496 1.57 0.58
Electric Trolley Bus 5.2 0.39 13.36 0.52
High Occupancy Vehicle (HOV) LDVs at 2+ Occupancy 5,987 2,851 2.10 0.47
Intercity Rail (Amtrak) 54,167 2,760 20.50 0.39
Light and Heavy Rail Transit 62,797 2,750 22.50 0.39
Motorcycles 2,226 2,272 1.20 0.37
Commuter Rail 92,739 2,569 31.30 0.36
Vanpool 8,048 1,294 6.10 0.21
Walking or Biking - - 1.00 0.00
Parsons Brinckerhoff / Sarah J. Siwek & Associates, Inc. | Climate Change
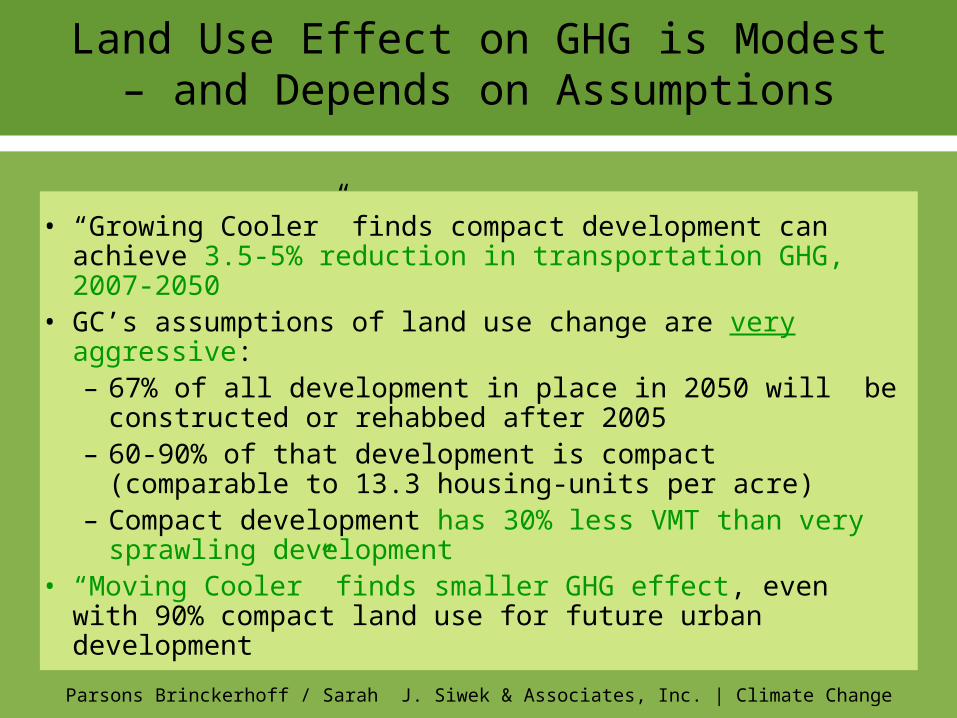
Land Use Effect on GHG is Modest – and Depends on Assumptions
• “Growing Cooler” finds compact development can achieve 3.5-5% reduction in transportation GHG, 2007-2050
• GC’s assumptions of land use change are very aggressive:– 67% of all development in place in 2050 will be
constructed or rehabbed after 2005– 60-90% of that development is compact (comparable
to 13.3 housing-units per acre)– Compact development has 30% less VMT than very
sprawling development• “Moving Cooler” finds smaller GHG effect, even with 90%
compact land use for future urban development

Parsons Brinckerhoff / Sarah J. Siwek & Associates, Inc. | Climate Change
TRB Study: “Driving and the Built Environment”
• 2009 TRB Study finds <1% to 11% household GHG reduction by 2050, depending on aggressiveness of assumptions– Study looks at effects of compact development on travel, energy
use, and CO2 emissions– Disagreement among committee members about feasibility of
changes in development patterns and public policies necessary to achieve high-end of estimated reductions
• Recommendations– Policies that support compact, mixed use development should be
encouraged– More carefully designed studies of the effects of land use patterns
on VMT, energy use, CO2 emissions are needed to implement compact development more effectively
• Source: National Academies, Transportation Research Board, Driving and the Built Environment, August 2009

Parsons Brinckerhoff / Sarah J. Siwek & Associates, Inc. | Climate Change
Less VMT via Land Use: The 8 “D”s
1. Diversity (mix) of land uses
2. Density of urban form – e.g. UGB
3. Design - quality of the (ped/bike) environment
4. Destination accessibility – O/D links
5. Distance to transit
6. Development scale (site, sector, municipality, region)
7. Demographics
8. Demand Management

Parsons Brinckerhoff / Sarah J. Siwek & Associates, Inc. | Climate Change
Example: Tysons Corner VA
Unprecedented transformation • Suburban to urban• Doubling jobs• Adding 10X housing • New land use plan• Adding street connectivity with
redevelopment• New implementing authority
Tysons Today
Tysons Transformed

Parsons Brinckerhoff / Sarah J. Siwek & Associates, Inc. | Climate Change
Tysons Corner VA - Lower Carbon Footprint
Preliminary assessment:• Greenhouse Gas emissions
16% less per capita• 2.5 billion lb. annual reduction• Results from
– Compact development– Fewer auto trips – Greater transit use
Base Case Prototype B
Daily CO2 Per Capita
43 LBS 36 LBS

Parsons Brinckerhoff / Sarah J. Siwek & Associates, Inc. | Climate Change
“Moving Cooler” (MC)
• Evaluated non-technology transportation strategies for (a) GHG reductions and (b) cost-effectiveness in reducing GHG
• Analyzed 46 individual transportation strategies and 6 “bundles” of strategies
• The 46 individual strategies: pricing strategies, transit strategies, land use strategy, operational strategies, freight strategies, nonmotorized strategies, regulatory strategies, bottleneck/capacity strategies, etc.

Parsons Brinckerhoff / Sarah J. Siwek & Associates, Inc. | Climate Change
MC Findings – Individual Strategies
Individual strategies achieve GHG reductions ranging from <0.5% to 4.0% cumulatively 2010-2050, compared to on-road baseline GHG
• 15,186 mmt - carbon pricing equiv to $2.71/gallon • 3,361 mmt – VMT fees equiv to $2.53/gallon• 2,428 mmt – speed limit reductions• 2,233 mmt – PAYD auto insurance (100%)• 1,815 mmt – eco-driving by 20% of drivers• 1,445 mmt – at least 90% of new urban development is
compact, with high quality transit• 1,241 mmt – congestion pricing fully implemented in 120
metro areas at 65 cents/mile• 575 mmt - $1.2 trillion transit expansion • 352 mmt – combination of 10 freight strategies

Parsons Brinckerhoff / Sarah J. Siwek & Associates, Inc. | Climate Change
MC Findings – Maximum Bundle
“Maximum” strategy bundle can reduce cumulative on-road GHG by 16% compared to on-road baseline, over 40 years
• Intercity tolls imposed in 2010 at 5 cents/mile• Congestion pricing at 65 cents/mile in 120 metro areas• $400 permit fee to park on neighborhood streets• $1.2 trillion transit expansion• Bike lanes every 1/4 mile• New and increased parking fees • 90% of new urban development is compact, in dense Census tracts,
with high quality transit• Heavier and longer trucks allowed (up to 139,000 lbs)• Eight more freight strategies• Eco-driving by 20% of drivers• Speed limit reductions• Top 200 bottlenecks improved to LOS D

Parsons Brinckerhoff / Sarah J. Siwek & Associates, Inc. | Climate Change
Vehicle/System Operations to Reduce GHG
Potential for 10-20% LDV GHG reduction by:– Managing speed (35-55 MPH is optimal)– Speed limits/enforcement (could reduce fuel use 2-4%)– Eliminating bottlenecks– “Active” traffic management to smooth traffic flow – Improving signal timing (could reduce 1.315 MMT
CO2/yr) – Roundabouts (multiple benefits)– Reducing car and truck idling – Work zone management to smooth flow– Encouraging eco-driving

Parsons Brinckerhoff / Sarah J. Siwek & Associates, Inc. | Climate Change
Eco-Driving – 15% GHG Reduction Potential
– EcoDrivers can reduce fuel and CO2 by an average of 15% through smart driving and vehicle maintenance.
– If 50% of drivers practiced EcoDriving, CO2 would drop by 100 million tons annually (the equivalent of heating and powering 8.5 million households)
– Pilot by City of Denver with 300 drivers achieved 10% fuel reduction and similar GHG reduction
- Useful for HDV, MDV, and LDV drivers- Major push in Europe as GHG strategy- Aided by dashboard displays of real-time MPG

Parsons Brinckerhoff / Sarah J. Siwek & Associates, Inc. | Climate Change
www.EcoDrivingUSA.com
• EcoDrivingUSA™ -- nationwide effort to increase overall vehicle fuel economy and preserve the environment
• Partnership of Governors, auto industry, environmental groups• Website:
– Be an EcoDriver – EcoCalculator – EcoDriving Quiz – Virtual Road Test – Is Your Community EcoDriving? – Educational Tools – News and Events – Join the EcoDriving Movement – Link this website on your blog or site
• For more information and to join the EcoDriving movement contact: Seena Faqiri at 202.326.5518 or [email protected].

Parsons Brinckerhoff / Sarah J. Siwek & Associates, Inc. | Climate Change
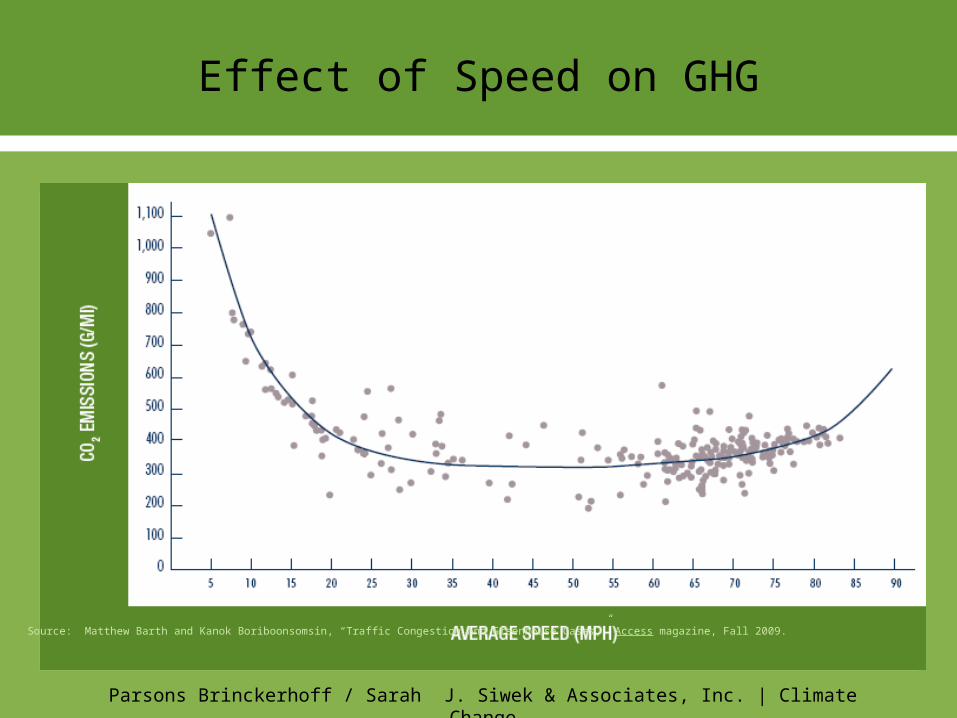
U.C. Riverside - Traffic Congestion and Its Impact of GHG Emissions: Can ITS Help?
• Studied congestion and impact on CO2, used detailed energy and emissions models linked to real-world conditions
• CO2 emissions can be reduced with three strategies– Reduce severe congestion, allow traffic to flow at
higher speeds– Reduce excessively high free-flow speeds to more
moderate conditions– Eliminate accel/decel events associated with stop and
go traffic in highly congested conditions• Author: Dr. Matthew Barth, et al., May 2008• http://www.its.uci.edu/its/whatsnew/barth2.pdf.
Parsons Brinckerhoff / Sarah J. Siwek & Associates, Inc. | Climate Change
Effect of Speed on GHG
Source: Matthew Barth and Kanok Boriboonsomsin, “Traffic Congestion and Greenhouse Gases,” Access magazine, Fall 2009.

Parsons Brinckerhoff / Sarah J. Siwek & Associates, Inc. | Climate
Change
Source: Matthew Barth and Kanok Boriboonsomsin, “Traffic Congestion and Greenhouse Gases,” Access magazine, Fall 2009.
Traffic Operation Strategies To Reduce CO2

Parsons Brinckerhoff / Sarah J. Siwek & Associates, Inc. | Climate
Change
Portland, OR Traffic Signal Timing Project
• Began 2002, 10-year project• Climate Trust funded project and pays for CO2
offsets from project• Improve signal timing on 17 major arterials
– Optimize traffic flow– Reduce idling, acceleration, C02 emissions
and emissions from criteria pollutants• Model for traffic signal offset projects
• http://www.climatetrust.org/traffic_signals.html.

Parsons Brinckerhoff / Sarah J. Siwek & Associates, Inc. | Climate Change
Freight – Ton-Mile/GDP Trends

Parsons Brinckerhoff / Sarah J. Siwek & Associates, Inc. | Climate Change
Truck GHG is Growing Faster than Other
Transportation GHG

Parsons Brinckerhoff / Sarah J. Siwek & Associates, Inc. | Climate Change
Cost of Congestion

Parsons Brinckerhoff / Sarah J. Siwek & Associates, Inc. | Climate Change
Freight GHG Strategies in State Climate Action Plans
• Anti-idling programs• Truck stop electrification• Speed limit enforcement• Freight villages/consolidation
centers• Feeder barge container
service• Traffic flow improvements• Pre-clearances at scale
houses• Truck driver training• EPA SmartWay up-grade kits
& loans & diesel retrofits
• Incentives to retire older trucks • Freight logistics improvements• Shifting freight from truck to rail • Hybrid power trucks• Low-viscosity lubricants• Single wide-base tires• Automatic tire inflation systems• PM and “Black carbon” control
technologies 85% retrofits
Detailed info available in NCHRP 20-24(59), Appendix C

Parsons Brinckerhoff / Sarah J. Siwek & Associates, Inc. | Climate Change
“Best Practices Guidebook for GHG Reductions in Freight Transportation”
• NC State University report to US DOT, 2007• Covers trucks, freight rail, marine, air freight,
pipeline• Identifies 33 “best practices” for reducing truck
GHG (plus 26 for other freight modes)• All 33 could reduce truck GHG in 2025 by 12%
below 2003 (compared to 67% increase in truck GHG if best practices are not implemented)
Parsons Brinckerhoff / Sarah J. Siwek & Associates, Inc. | Climate Change
Potential State DOT Strategies to Reduce HDV/MDV Truck GHG Emissions
• Speed management, traffic flow improvement, and bottleneck reductions that reduce inefficiencies in truck travel
• Programs to clear traffic incidents quickly and reduce construction zone congestion that tie up trucks
• Incentives for truck owners to retrofit or upgrade trucks to reduce GHG emissions. PM reductions also reduce black carbon.
• Support for efficient intermodal freight facilities and efficient access to seaports, rail, and marine facilities

Parsons Brinckerhoff / Sarah J. Siwek & Associates, Inc. | Climate Change
Potential State DOT Strategies to Reduce
HDV/MDV Truck GHG Emissions (continued)
• Truck stop electrification (to reduce engine idling)• Other programs and policies to reduce truck idling• Truck driver training/educational programs for low-GHG
driving practices• Support for R&D and regulations to develop and deploy
technology and fuel improvements that reduce freight GHG
• Obama administration announced fuel economy requirements under development for MDV/HDV in 2011

Parsons Brinckerhoff / Sarah J. Siwek & Associates, Inc. | Climate Change
Diesel Retrofits Reduce PM and Black Carbon
• Black carbon is emitted from burning fossil fuels• EPA conducting study on impact on GHG – due
early 2011• Diesel emissions considerable, smoke and soot• A “forcing” agent in heating up climate, blocking
sunlight• Today’s particulate filters for on road and off
road engines reduce PM up to 99%, including reductions in black carbon

Parsons Brinckerhoff / Sarah J. Siwek & Associates, Inc. | Climate Change
Diesel Retrofits Reduce PM and Black Carbon
• On-road diesel truck retrofits reduce PM 99% = 2007 EPA standards and also reduce black carbon
• Locomotive retrofits reduce PM and black carbon– Achieve over 76% PM and 25% fuel efficiency
• Cost-effective way to reduce emissions and save energy immediately.
• Retrofits of construction equipment and locomotives could be promising as state DOTs work to reduce emissions to meet potential planning requirements

Parsons Brinckerhoff / Sarah J. Siwek & Associates, Inc. | Climate Change
Construction, Maintenance, & Agency Operations Strategies
• Significant sources of GHG and energy use• Many opportunities to reduce GHG and energy cost from
current system:
– LED traffic lights– Low carbon pavement– Energy-efficient buildings– Reduced roadside mowing– Solar panels on ROW– Alt fuels and hybrid vehicles in DOT fleets– Alt fuel buses

Parsons Brinckerhoff / Sarah J. Siwek & Associates, Inc. | Climate Change
Solar Panels for Highway Lighting
• 594 solar panels produce 122,000 KWH/year to light interchange
• Avoids nearly 43 metric tons of GHG/year from normal electricity
• $1.28 M project in operation for over a year• PPP of OR DOT, PGE, and US Bank, using state and
federal tax credits• Could be a model for other DOTs• ORDOT planning 2 additional projects• www.oregonsolarhighway.com

Parsons Brinckerhoff / Sarah J. Siwek & Associates, Inc. | Climate Change
McKinsey: Available Technologies can Reduce 3 Billion Tons GHG/Year at < $50/ton
(compare to projected 9.7 billion tons economy-wide in 2030)
-- McKinsey & Company

Parsons Brinckerhoff / Sarah J. Siwek & Associates, Inc. | Climate Change
European View of Transport GHG Strategies
(European Council of Ministers of Transport, 2006)
• “The most effective measures available include fuel taxes, vehicle and component standards, differentiated vehicle taxation, support for eco-driving and incentives for more efficient logistic organization, including point of use pricing for roads. “
• “More integrated transport and spatial planning policies might contain demand for motorized transport.”
• Mode shifts … cannot … form the corner-stone of effective CO2 abatement policy and the prominence given to modal shift policies is at odds with indications that most modal shift policies achieve much lower abatement levels than measures focusing on fuel efficiency.”
• “Ultimately higher cost energy sources …. will be required if there are to be further cuts in transport sector CO2 emissions.”

Parsons Brinckerhoff / Sarah J. Siwek & Associates, Inc. | Climate Change
Summary
Many strategies are needed to reduce transport GHG. No silver bullet. Will need full mix of strategies including:
Maximize energy efficiency of current vehicle technology Decarbonize vehicles and fuels world-wide Adopt pricing measures to reward conservation and tech innovation Push “eco driving” and system/speed management Adopt more efficient land use Support carpools & vanpools, biking, walking, transit use, trip
chaining, telecommuting Adopt low carbon, energy-conserving strategies in construction,
maintenance, and agency operations Implement wide-ranging freight technology and logistics
improvements

Parsons Brinckerhoff / Sarah J. Siwek & Associates, Inc. | Climate Change
VII. Participant Workshop

Parsons Brinckerhoff / Sarah J. Siwek & Associates, Inc. | Climate
Change
Participant Workshop
A working session in break-out groups to identify an
initial set of activities for Hawai’i DOT to pursue:
(a) GHG reduction strategies and framework;
(b) Climate adaptation planning;
(c) Public communication strategies;
(d) Outreach/collaboration with other agencies and organizations.

Parsons Brinckerhoff / Sarah J. Siwek & Associates, Inc. | Climate Change
INFORMATION RESOURCES

Parsons Brinckerhoff / Sarah J. Siwek & Associates, Inc. | Climate Change
Resources -- Websites
• AASHTO: http://climatechange.transportation.org/• Intergovernmental Panel on Climate Change (IPCC):
http://www.ipcc.ch/ • US DOT Transportation and Climate Change Clearinghouse:
http://climate.dot.gov/index.html• FHWA Climate Change Program http://www.fhwa.dot.gov/hep/climate/index.htm• The Pew Center on Global Climate Change:
http://www.pewclimate.org/ • EPA Climate Change Program
http://www.epa.gov/climatechange/ • TRB Climate Change Activities
http://www.trb.org/main/SpecialtyPageClimateChange.aspx

Parsons Brinckerhoff / Sarah J. Siwek & Associates, Inc. | Climate Change
Resources – Key Documents
• AASHTO, “Primer on Transportation and Climate Change,” 2008
• NCHRP 20-24 (59), “Strategies for Reducing the Impacts of Surface Transportation on Global Climate Change,” 2009
• European Council of Ministers of Transport, “Review of CO2 Abatement Policies for the Transport Sector,” 2006
• U.S. DOE, “Annual Energy Outlook,” 2009 (primary source of official U.S. data on energy and GHG)
• TRB Special Report 290: “Potential Impacts of Climate Change on U.S. Transportation,” 2008
• Pew Center on Climate Change, “Climate Change 101”

Parsons Brinckerhoff / Sarah J. Siwek & Associates, Inc. | Climate Change
Resources – AASHTO
• AASHTO Climate Change Steering Committee: CCSC acts as a focal point and coordinating body for AASHTO’s activities related to climate change. CCSC members act as the focal point for AASHTO on climate change policy issues and provide oversight and guidance to AASHTO’s Climate Change Technical Assistance Program.
• AASHTO Technical Assistance Program on Climate Change: This is a new, voluntary program that provides timely information, tools and technical assistance to assist AASHTO members in meeting the difficult challenges that arise related to climate change.
For more information on AASHTO’s Climate Change Steering Committee and Climate Change Technical Assistance Program, please contact:Caroline Paulsen at AASHTO (202) 624- [email protected]

Parsons Brinckerhoff / Sarah J. Siwek & Associates, Inc. | Climate Change
Contact Info for Workshop Instructors
Cynthia J. Burbank
Parsons Brinckerhoff
202-661-9262
Sarah J. Siwek
Sarah J. Siwek & Associates
310-417-6660 x224