parsons creek aggregates limestone quarry project: · pdf filerob beleutz environmental /...
TRANSCRIPT

June 6, 2012 Susan Schlemko Pat Marriott, P. Eng. Natural Resources Conservation Board Acting Regional Approvals Manager 4th Floor, Sterling Place and 9940 – 106 Street Camille Almeida Edmonton, AB T5K 2N2 Environmental Assessment Coordinator
Alberta Environment and Sustainable Resource Development
111 Twin Atria Building 4999 - 98 Avenue Edmonton, AB T6B 2X3
Dear Madam/Sir:
Re: Parsons Creek Aggregates Limestone Quarry Project Amended Supplemental Information Request 2 Response
Section 2 Air Quality
On May 14 2012, Parsons Creek Aggregates (PCA), a joint venture of Graymont Western Canada Inc. (Graymont) and Lehigh Hanson Materials Limited (Lehigh Hanson), submitted responses for Supplemental Information Request 2 for the proposed Parsons Creek Aggregates Limestone Quarry Project. Please replace Section 2 of the May 14, 2012 SIR2 response with the attached amended Section 2. Also updated is the attached CD with the amended Section 2.
Correspondence respecting these applications should be directed to:
Rob Beleutz Environmental / Safety Manager Graymont Western Canada Inc. Telephone: (604) 249-1911 Cellular: (604) 760-2050 Email: [email protected] Address: #200 – 10991 Shellbridge Way Richmond, BC V6X 3C6

Page 2
With copies sent to:
Derald Starchuk Principal Millennium EMS Solutions Ltd. Telephone: (780) 496-9048 Fax: (780) 496-9049 Email: [email protected] Address: #208, 4207 - 98 Street
Edmonton, Alberta T6E 5R7
Sincerely,
Rob Beleutz Environmental / Safety Manager Graymont Western Canada Inc.

Parsons Creek Aggregates Project
Supplemental Information Request Responses #2
Supplemental Information Request Responses #2 May 2012
PART 2: AIR
Parsons Creek Aggregates Project Supplemental Information Request Responses #2
Supplemental Information Request Responses #2 June 2012 Page 2-i
TABLE OF CONTENTS Page
2. AIR .............................................................................................................................................. 2-1 2.1. Emissions management ...................................................................................................... 2-1
2.2. Dispersion Modelling ........................................................................................................... 2-9
LIST OF TABLES Page
Table 4.1 Comparison of Tier IV and Tier III Engine Emission Factors, above 560 kW, g/kWh (g/bhp-hr) .................................................................................................................... 2-1
Table 5.1 Baseline PM10 emission rates (Parsons Creek Sand and Gravel Operation) ............ 2-3
Table 5.2 Project PM10 emission rates ...................................................................................... 2-3
Table 5.3 Predicted PM10 Concentrations ................................................................................. 2-4
Table 9.1 Background Concentrations Added to Predictions .................................................... 2-10
Table 9.2 Locations of Sensitive Receptors .............................................................................. 2-12
Table 9.3 Emission Rates Associated with Limestone Quarry Operations ............................... 2-13
Table 9.4 Summary of Emission Rates for the Three Emission Scenarios ............................... 2-13
Table 9.5 Summary of Emissions for the Baseline Scenario .................................................... 2-14
Table 9.6 Summary of Emissions for the Application Scenario ................................................ 2-15
Table 9.7 Summary of Emissions for the Planned Development Scenario ............................... 2-16
Table 9.8 Summary of Predicted Sulphur Dioxide Concentrations ........................................... 2-17
Table 9.9 Summary of Predicted Oxides of Nitrogen Concentrations ....................................... 2-19
Table 9.10 Summary of Predicted PM2.5 Concentrations ............................................................ 2-20
Table 9.11 Summary of Predicted Carbon Monoxide Concentrations ........................................ 2-21
Parsons Creek Aggregates Project Supplemental Information Request Responses #2
Supplemental Information Request Responses #2 June 2012 Page 2-1
2. Air
2.1. Emissions management
4. SIR 30, Page 2-1 PCA states that all new vehicles combusting diesel that are owned and operated by Parsons Creek Aggregates will meet the Tier IV standard.
a. Will existing vehicles that are owned and operated by PCA meet the Tier IV standard? If not, indicate, quantitatively, how this affects the results of the impact assessment.
Response:
PCA confirms that existing vehicles owned and operated by the company do not meet Tier IV standards. PCA maintains that the assessment with Tier IV emission standards continues to fairly represent the impact of the project for the following reasons:
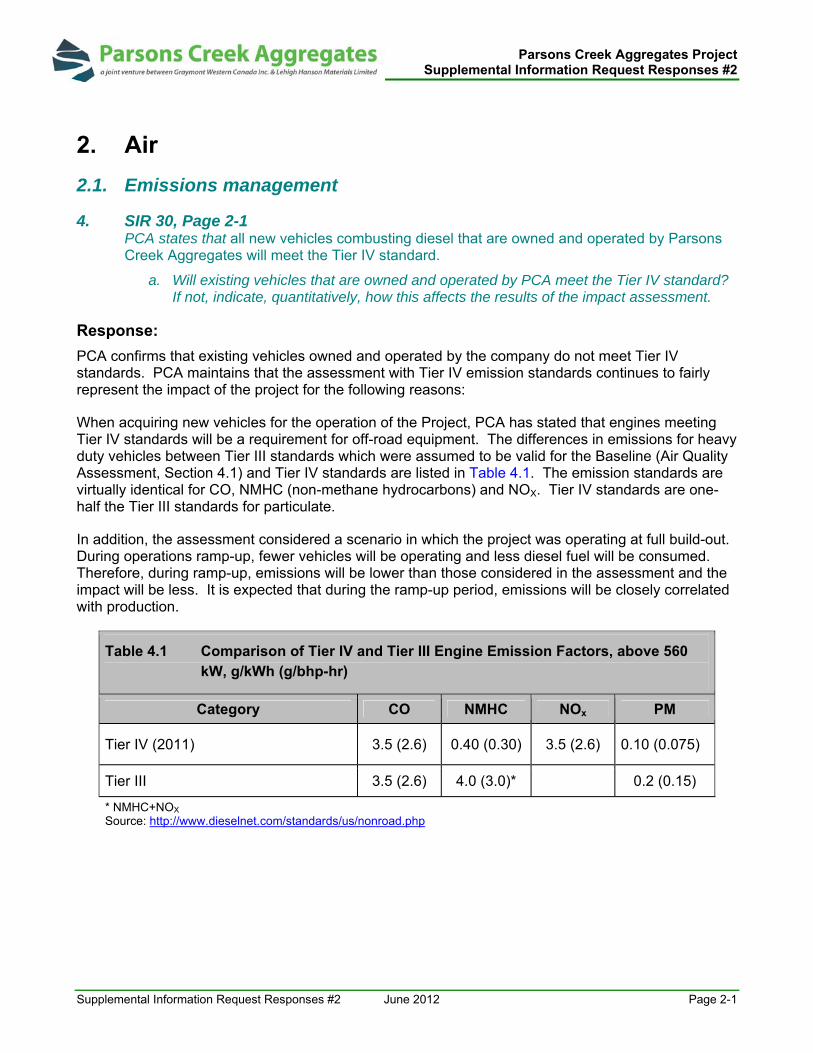
When acquiring new vehicles for the operation of the Project, PCA has stated that engines meeting Tier IV standards will be a requirement for off-road equipment. The differences in emissions for heavy duty vehicles between Tier III standards which were assumed to be valid for the Baseline (Air Quality Assessment, Section 4.1) and Tier IV standards are listed in Table 4.1. The emission standards are virtually identical for CO, NMHC (non-methane hydrocarbons) and NOX. Tier IV standards are one-half the Tier III standards for particulate.
In addition, the assessment considered a scenario in which the project was operating at full build-out. During operations ramp-up, fewer vehicles will be operating and less diesel fuel will be consumed. Therefore, during ramp-up, emissions will be lower than those considered in the assessment and the impact will be less. It is expected that during the ramp-up period, emissions will be closely correlated with production.
Table 4.1 Comparison of Tier IV and Tier III Engine Emission Factors, above 560 kW, g/kWh (g/bhp-hr)
Category CO NMHC NOx PM
Tier IV (2011) 3.5 (2.6) 0.40 (0.30) 3.5 (2.6) 0.10 (0.075)
Tier III 3.5 (2.6) 4.0 (3.0)* 0.2 (0.15)
* NMHC+NOX
Source: http://www.dieselnet.com/standards/us/nonroad.php
Parsons Creek Aggregates Project Supplemental Information Request Responses #2
Supplemental Information Request Responses #2 June 2012 Page 2-2
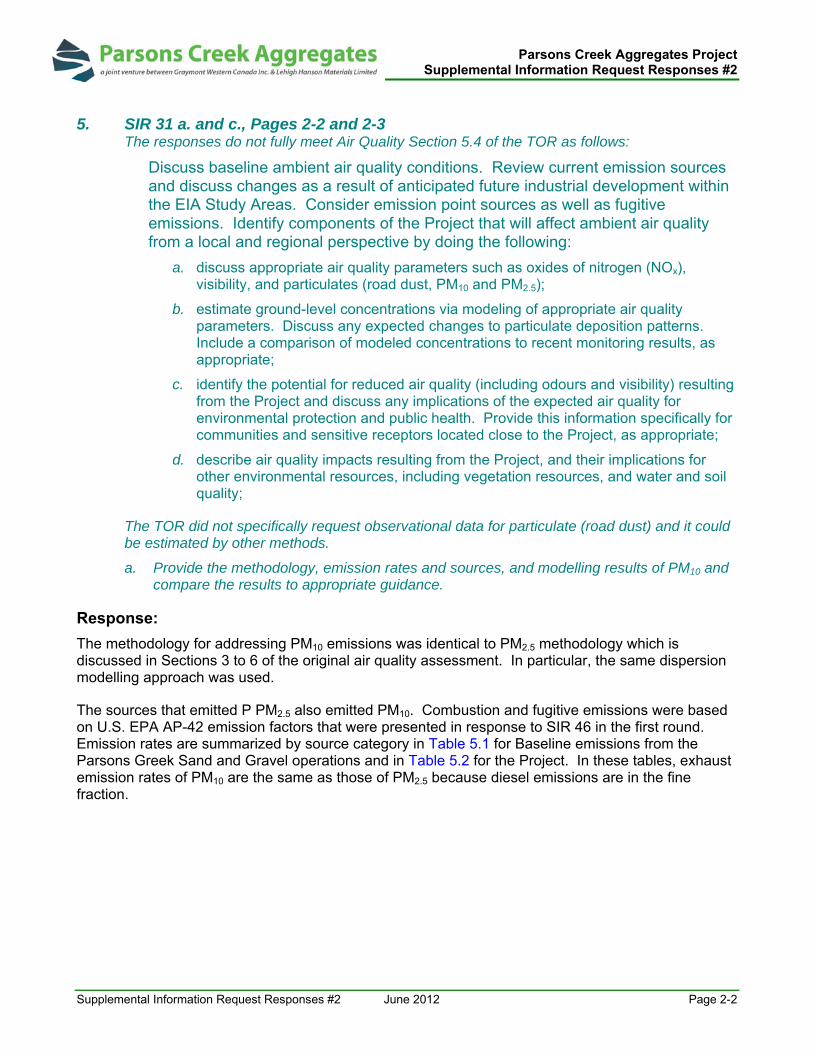
5. SIR 31 a. and c., Pages 2-2 and 2-3 The responses do not fully meet Air Quality Section 5.4 of the TOR as follows:
Discuss baseline ambient air quality conditions. Review current emission sources and discuss changes as a result of anticipated future industrial development within the EIA Study Areas. Consider emission point sources as well as fugitive emissions. Identify components of the Project that will affect ambient air quality from a local and regional perspective by doing the following:
a. discuss appropriate air quality parameters such as oxides of nitrogen (NOx), visibility, and particulates (road dust, PM10 and PM2.5);
b. estimate ground-level concentrations via modeling of appropriate air quality parameters. Discuss any expected changes to particulate deposition patterns. Include a comparison of modeled concentrations to recent monitoring results, as appropriate;
c. identify the potential for reduced air quality (including odours and visibility) resulting from the Project and discuss any implications of the expected air quality for environmental protection and public health. Provide this information specifically for communities and sensitive receptors located close to the Project, as appropriate;
d. describe air quality impacts resulting from the Project, and their implications for other environmental resources, including vegetation resources, and water and soil quality;
The TOR did not specifically request observational data for particulate (road dust) and it could be estimated by other methods.
a. Provide the methodology, emission rates and sources, and modelling results of PM10 and compare the results to appropriate guidance.
Response:
The methodology for addressing PM10 emissions was identical to PM2.5 methodology which is discussed in Sections 3 to 6 of the original air quality assessment. In particular, the same dispersion modelling approach was used.
The sources that emitted P PM2.5 also emitted PM10. Combustion and fugitive emissions were based on U.S. EPA AP-42 emission factors that were presented in response to SIR 46 in the first round. Emission rates are summarized by source category in Table 5.1 for Baseline emissions from the Parsons Greek Sand and Gravel operations and in Table 5.2 for the Project. In these tables, exhaust emission rates of PM10 are the same as those of PM2.5 because diesel emissions are in the fine fraction.

Parsons Creek Aggregates Project Supplemental Information Request Responses #2
Supplemental Information Request Responses #2 June 2012 Page 2-3
Table 5.1 Baseline PM10 emission rates (Parsons Creek Sand and Gravel Operation)
Emission Source Exhaust
Emissions (g/s) Fugitive Emissions
(g/s) Maximum Hourly
Pit Operation 1.52E-01 7.25E-01
Hauling Road1 3.01E-02 3.74E-01
Process Area 1.32E-02 4.67E-01
Hauling Road2 8.85E-02 6.22E-01
Total Hourly Emission 2.84E-01 2.19E+00
Maximum Daily
Pit Operation 8.62E-02 3.65E-01
Hauling Road1 2.01E-02 2.50E-01
Process Area 8.80E-03 3.11E-01
Hauling Road2 2.95E-02 2.07E-01
Total Daily Emission 1.45E-01 1.13E+00
Annual Average
Pit Operation 1.98E-02 7.22E-02
Hauling Road1 6.05E-03 7.52E-02
Process Area 2.65E-03 9.38E-02
Hauling Road2 2.13E-02 1.50E-01
Total Annual Emission 4.99E-02 3.91E-01
Table 5.2 Project PM10 emission rates
Emission Source Exhaust
Emissions (g/s)
Fugitive Emissions (g/s)
Maximum Hourly
Pit Operation 4.67E-02 7.67E-01
Process Area 1.57E-02 2.79E-01
Hauling Road 2.21E-02 8.89E-01
Total hourly Emission 8.45E-02 1.93E+00
Maximum Daily
Pit Operation 3.46E-02 5.57E-01
Process Area 1.37E-02 2.44E-01
Hauling Road 1.29E-02 7.78E-01
Total Daily Emission 6.13E-02 1.58E+00

Parsons Creek Aggregates Project Supplemental Information Request Responses #2
Supplemental Information Request Responses #2 June 2012 Page 2-4
Table 5.2 Project PM10 emission rates
Emission Source Exhaust
Emissions (g/s)
Fugitive Emissions (g/s)
Annual Average
Pit Operation 2.77E-02 3.18E-01
Process Area 1.32E-02 1.71E-01
Hauling Road 1.27E-02 5.97E-01
Total Annual Emission 5.37E-02 1.09E+00
Predicted PM10 concentrations at the maximum point of impingement and at special receptors around the Project, for stage 1C which is considered the worst case, are listed in Table 5.3. The 24-hour predictions are the maximum predictions, not the 2nd highest 24-hour values. Annual averages are the maximum annual value in five years of modelling.
Predictions for the 24-hour averaging period may be compared to the B.C. interim objective of 50 µg/m3 (B.C. MOE, 2009) and the U.S. EPA national air quality standard of 150 µg/m3 which is not be exceeded more than once per year (U.S. EPA, 2011). All predictions at special receptors are less than the B.C. objective and the maximum concentrations which occur on the edge of the quarry pit are less than the U.S. EPA standard. There are no ambient air quality objectives for PM10 in Alberta.
Table 5.3 Predicted PM10 Concentrations
Receptor Name UTM
Easting (m)
UTM Northing
(m) Baseline Application
Planned Development
Max. 24-Hour Average (µg/m3)
Sunset Salvage 473842 6293628 3 13 13
Easy Span Bridge Rentals 473646 6295555 5 30 30
Cabin 474621 6295095 6 29 29
Truck Staging Area 473302 6299583 13 20 20
Northlands Forest Products 473153 6302809 11 5 5
TaigaNova Eco-Industrial Park 474308 6292520 3 9 9
Wastewater Treatment Plant 474754 6291635 3 6 6
E-T Energy 472585 6295807 6 11 11
Timberlea Residential Area 473516 6292250 3 7 7 North Parsons Residential Area (Plateau) 472926 6293451 3 12 12
Patricia McInnes AQ 473406 6288684 1 2 2
Athabasca Valley AQ 476059 6288232 2 3 3
Maximum 24h Concentration 63 109 109

Parsons Creek Aggregates Project Supplemental Information Request Responses #2
Supplemental Information Request Responses #2 June 2012 Page 2-5
Table 5.3 Predicted PM10 Concentrations
Receptor Name UTM
Easting (m)
UTM Northing
(m) Baseline Application
Planned Development
Max. Annual Average Concentration (µg/m3)
Sunset Salvage 473842 6293628 0.04 1.0 1.0
Easy Span Bridge Rentals 473646 6295555 0.07 4.0 4.0
Cabin 474621 6295095 0.07 4.2 4.2
Truck Staging Area 473302 6299583 0.58 4.0 4.0
Northlands Forest Products 473153 6302809 0.20 0.4 0.4
TaigaNova Eco-Industrial Park 474308 6292520 0.04 0.7 0.7
Wastewater Treatment Plant 474754 6291635 0.03 0.6 0.6
E-T Energy 472585 6295807 0.07 1.1 1.1
Timberlea Residential Area 473516 6292250 0.03 0.5 0.5 North Parsons Residential Area (Plateau) 472926 6293451 0.04 0.8 0.8
Patricia McInnes AQ 473406 6288684 0.02 0.2 0.2
Athabasca Valley AQ 476059 6288232 0.02 0.3 0.3
Maximum Annual Value 3 22 22
References:
U.S. Environmental Protection Agency (EPA). 2011. National Ambient Air Quality Standards (NAAQS). Available online: http://www.epa.gov/ttn/naaqs/pm/pm25_index.html.
B.C. Ministry of Environment (MOE). 2009. AIR QUALITY OBJECTIVES AND STANDARDS.
b. Justify why there was no estimation of ground level concentrations of road dust.
Response:
PCA provided rationale for not assessing the TSP component of road dust in the response to SIR 31. It was indicated that the U.S. EPA had dropped TSP as a regulatory standard because it determined there were negligible health or environmental impacts. The response also indicated that there was no observational data in the Fort McMurray area to use as a baseline. Note that the assessment has included the PM2.5, and now PM10, components of road dust.
Estimates of the TSP component of road dust, before the application of mitigation whose efficacy is estimated at 98%, were based on the following equation (AP-42 Section 13.2.2.4)
E = k(s/12)a(W/3)b
Where for TSP, k = 4.9, s = 4.8% silt content, a = 0.7 (AP -42 Table 13.2-2.2), W = 35 t average weight of haul trucks, and b = 0.45.
Parsons Creek Aggregates Project Supplemental Information Request Responses #2
Supplemental Information Request Responses #2 June 2012 Page 2-6
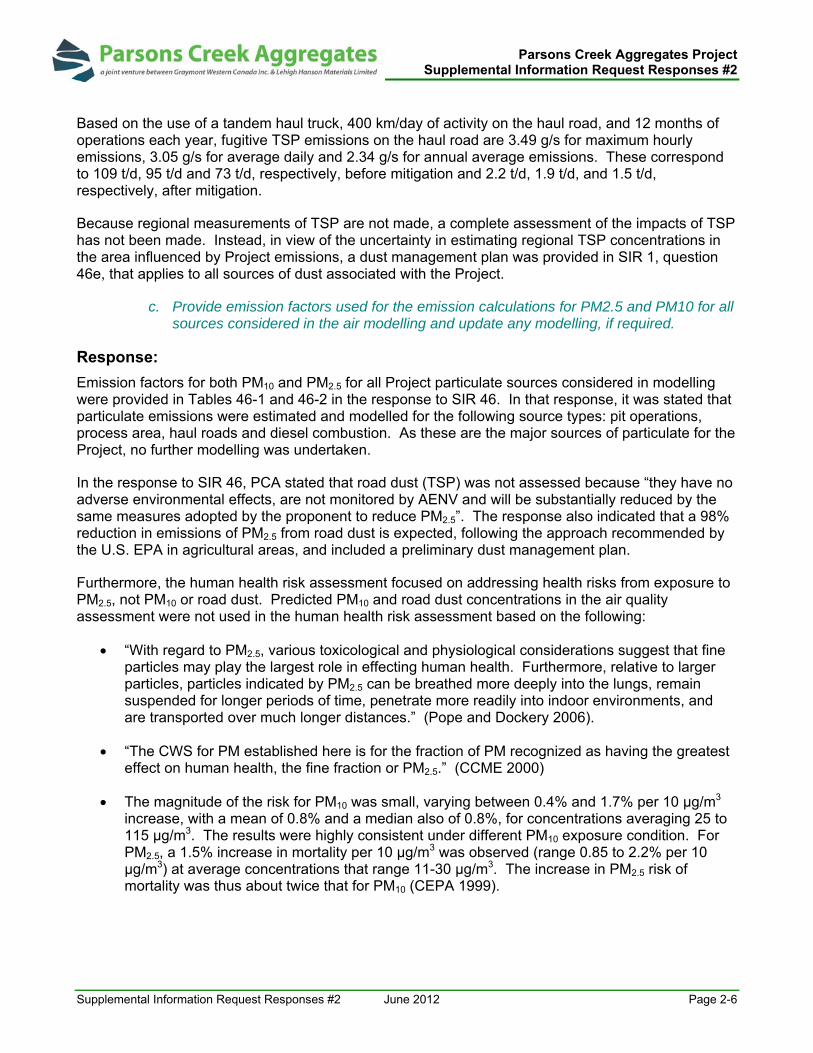
Based on the use of a tandem haul truck, 400 km/day of activity on the haul road, and 12 months of operations each year, fugitive TSP emissions on the haul road are 3.49 g/s for maximum hourly emissions, 3.05 g/s for average daily and 2.34 g/s for annual average emissions. These correspond to 109 t/d, 95 t/d and 73 t/d, respectively, before mitigation and 2.2 t/d, 1.9 t/d, and 1.5 t/d, respectively, after mitigation.
Because regional measurements of TSP are not made, a complete assessment of the impacts of TSP has not been made. Instead, in view of the uncertainty in estimating regional TSP concentrations in the area influenced by Project emissions, a dust management plan was provided in SIR 1, question 46e, that applies to all sources of dust associated with the Project.
c. Provide emission factors used for the emission calculations for PM2.5 and PM10 for all sources considered in the air modelling and update any modelling, if required.
Response:
Emission factors for both PM10 and PM2.5 for all Project particulate sources considered in modelling were provided in Tables 46-1 and 46-2 in the response to SIR 46. In that response, it was stated that particulate emissions were estimated and modelled for the following source types: pit operations, process area, haul roads and diesel combustion. As these are the major sources of particulate for the Project, no further modelling was undertaken.
In the response to SIR 46, PCA stated that road dust (TSP) was not assessed because “they have no adverse environmental effects, are not monitored by AENV and will be substantially reduced by the same measures adopted by the proponent to reduce PM2.5”. The response also indicated that a 98% reduction in emissions of PM2.5 from road dust is expected, following the approach recommended by the U.S. EPA in agricultural areas, and included a preliminary dust management plan.
Furthermore, the human health risk assessment focused on addressing health risks from exposure to PM2.5, not PM10 or road dust. Predicted PM10 and road dust concentrations in the air quality assessment were not used in the human health risk assessment based on the following:
“With regard to PM2.5, various toxicological and physiological considerations suggest that fine particles may play the largest role in effecting human health. Furthermore, relative to larger particles, particles indicated by PM2.5 can be breathed more deeply into the lungs, remain suspended for longer periods of time, penetrate more readily into indoor environments, and are transported over much longer distances.” (Pope and Dockery 2006).
“The CWS for PM established here is for the fraction of PM recognized as having the greatest effect on human health, the fine fraction or PM2.5.” (CCME 2000)
The magnitude of the risk for PM10 was small, varying between 0.4% and 1.7% per 10 μg/m3
increase, with a mean of 0.8% and a median also of 0.8%, for concentrations averaging 25 to 115 μg/m3. The results were highly consistent under different PM10 exposure condition. For PM2.5, a 1.5% increase in mortality per 10 µg/m3 was observed (range 0.85 to 2.2% per 10 µg/m3) at average concentrations that range 11-30 µg/m3. The increase in PM2.5 risk of mortality was thus about twice that for PM10 (CEPA 1999).
Parsons Creek Aggregates Project Supplemental Information Request Responses #2
Supplemental Information Request Responses #2 June 2012 Page 2-7
Particles less than 10 micrometers in diameter (PM10) pose a health concern because they can be inhaled into and accumulate in the respiratory system. Particles less than 2.5 micrometers in diameter (PM2.5) are referred to as "fine" particles and are believed to pose the largest health risks. Because of their small size (less than one-seventh the average width of a human hair), fine particles can lodge deeply into the lungs (US NAAQS 2011).
Nonetheless, PCA has conducted dispersion modelling of PM2.5. Results are presented in response to SIR 7.
References
Canadian Council of the Ministers of the Environment (CCME). 2000. Canada wide standards for particulate matter (PM) and ozone. June 2000.
Canadian Environmental Protection Agency (CEPA). 1999. Addendum to Science Assessment Document Particulate Matter ≤10 µm and ≤2.5 µm. Federal – Provincial Working Group on Air Quality Objectives and Guidelines. April 1999.
Pope III, C.A., Dockery, D.W. 2006. Health effects of fine particulate air pollution: Lines that connect. Journal of the Air and Waste Management Association. 56: 709-742.
United States National Ambient Air Quality Standards (NAAQS). 2011. PM2.5 NAAQS Implementation. Available online: http://www.epa.gov/ttn/naaqs/pm/pm25_index.html. Accessed December 2011.
6. SIR 31, Page 2-22 SIR 46, Page 2-17 PCA states that Results of the PM10 calculations have been given in the Human Health Risk Assessment Study Portion of this EIA… The PM10 results were presented in the Health section. CR #2, the Final HHRA, includes an assessment of PM2.5 only, not PM10.
a. Indicate where in the HHRA the results can be found.
Response:
PCA incorrectly stated that HHRA results included an assessment of PM10. In fact, PM10 was not assessed in the HHRA based on the rationale provided in response to SIR 5b above. The PM10 predictions have now been provided in the response to SIR 5a.
7. SIR 32 b., Page 2-3 PCA states that the inclusion of source #43 would not have affected the conclusions of this study.
a. Provide calculations that show that source #43 would not have affected the conclusions of the study.

Parsons Creek Aggregates Project Supplemental Information Request Responses #2
Supplemental Information Request Responses #2 June 2012 Page 2-8
Response:
To provide the approximate contribution of Source #43 (the Northlands Forest Products Sawmill), PCA modelled emissions from the beehive burner, using the U.S. EPA SCREEN3 model. Following Dover Opco (2010) and others, the emission parameters in modelling were: stack height (24 m), stack diameter (11 m), exit velocity (3.0 m/s) and exit temperature (773 K). The PM10 emission rate was 2.2 g/s (0.19 t/d).
With these parameters, the maximum 1-hour average PM10 concentration was 1.8 µg/m3 at a distance of 1.5 km from the burner stack. The burner stack is about 7.7 km from the stage 1C Project location and, at that distance, the predicted maximum daily concentration from the burner would be about 0.4 µg/m3. Thus the contribution of source #43 is negligible (0.3% of the U.S. EPA standard) at the location of the Project maximum concentration.
Reference:
Dover Operating Corporation (Opco). 2010. Dover Commercial Project.
8. SIR 46 e., Page 2-20 PCA’s dust management plan includes a complaint response protocol.
a. Will the complaint response protocol also apply to noise complaints? If not, why not?
Response:
Noise complaints will be included by PCA as part of complaint response protocol.
b. Discuss how PCA plans to respond to noise complaints.
Response:
Complaint Response Protocol
Signage will posted at the quarry entrance and along fenced boundaries providing a phone number for the public to call should they have any dust or noise concerns. PCA quarry manager will also request that AENV or ASRD notify them immediately if they receive a dust or noise complaint to allow for PCA response and follow-up.
Complainants will be requested by PCA to identify the location of the incident as well as the time of day that it was detected and any other relevant information. All dust and noise complaints will be reviewed by PCA quarry manager and recorded in the logbook as identified in the previous section.
The PCA quarry manager will initiate the following action plan:
Conduct an inspection to identify dust or noise sources contributing to the complaint;
Create a record of this inspection; and
Determine weather conditions (both current and at the time of the complaint).

Parsons Creek Aggregates Project Supplemental Information Request Responses #2
Supplemental Information Request Responses #2 June 2012 Page 2-9
If the information collected from the survey procedures indicates that quarry is not the source of the dust or noise complaint, the complainant shall be notified of this finding. Documentation supporting this response mechanism (inspection record and weather conditions at the time of the complaint) will be provided to the complainant upon request. The PCA quarry manager will respond to all complaints within 24 hours with a phone call to the complainant.
If it is determined that the complaint is related to quarry activities or operations, the PCA quarry manager will implement the following response procedures:
Level 1 – Inspection and operational corrections: PCA quarry manager will ensure that all elements of the DMP are being followed. Control measures will be increased or operations may be curtailed, as required.
Level 2 – Review of the DMP procedures: If the Level 1 response does not adequately resolve the emission source resulting in the dust or noise complaint, the DMP will be reviewed for additional control measures.
Level 3 – Operational modifications: If the Level 2 response does not adequately resolve the source of the dust or noise complaint, the PCA quarry manager will commit to making facility or operational changes to address the source of dust or noise emissions. Such changes may include, but are not limited to relocation of equipment, or additional administration and engineering controls as appropriate.
2.2. Dispersion Modelling
9. SIR 33, Page 2-4
a. Quantitatively account for the anthropogenic emission sources (background and project sources) for the baseline, application and planned development scenarios for PM2.5 and NOx (NO2).
Response:
To respond to this question, PCA has conducted additional dispersion modelling. The modelling approach for this assessment is based on the approach used in the Dover Opco Dover SAGD EIA which was filed in late 2010. Emissions sources are the same and model parameters are the same. The model grid has been updated to be consistent with AEW (2009) guidance.
The CALMET and CALPUFF models were used in the air quality assessment. These models are described in Scire et al. (2000) and Scire and Escoffier-Czaja (2004) and are recommended models by AEW (2009).
The CALMET model used the 2002 MM5 regional meteorological dataset provided by AEW. MM5 data were used for surface and upper wind fields. Surface data from ten regional WBEA stations were also used for meteorological data for modelling, most of them in or near the Athabasca River valley.
In addition to PM2.5 and NOX, PCA has provided model results for sulphur dioxide (SO2) and carbon monoxide (CO).
Parsons Creek Aggregates Project Supplemental Information Request Responses #2
Supplemental Information Request Responses #2 June 2012 Page 2-10
Modelling Scenarios
The assessment is conducted using three emission scenarios:
Baseline including all existing and approved emission sources as of late 2009
Application comprised of Baseline plus Project emissions
Planned Development Case (PDC) (cumulative) including application and all announced future projects at a level of detail that enables a reasonable estimation of emission information.
In addition, a Project-only scenario was considered to clarify the contribution of the Project. The assessment typically compares the Application and Baseline predictions to determine the relative impact of the project, and compares PDC and Baseline predictions to estimate future impacts assuming all announced projects become operational.
Background
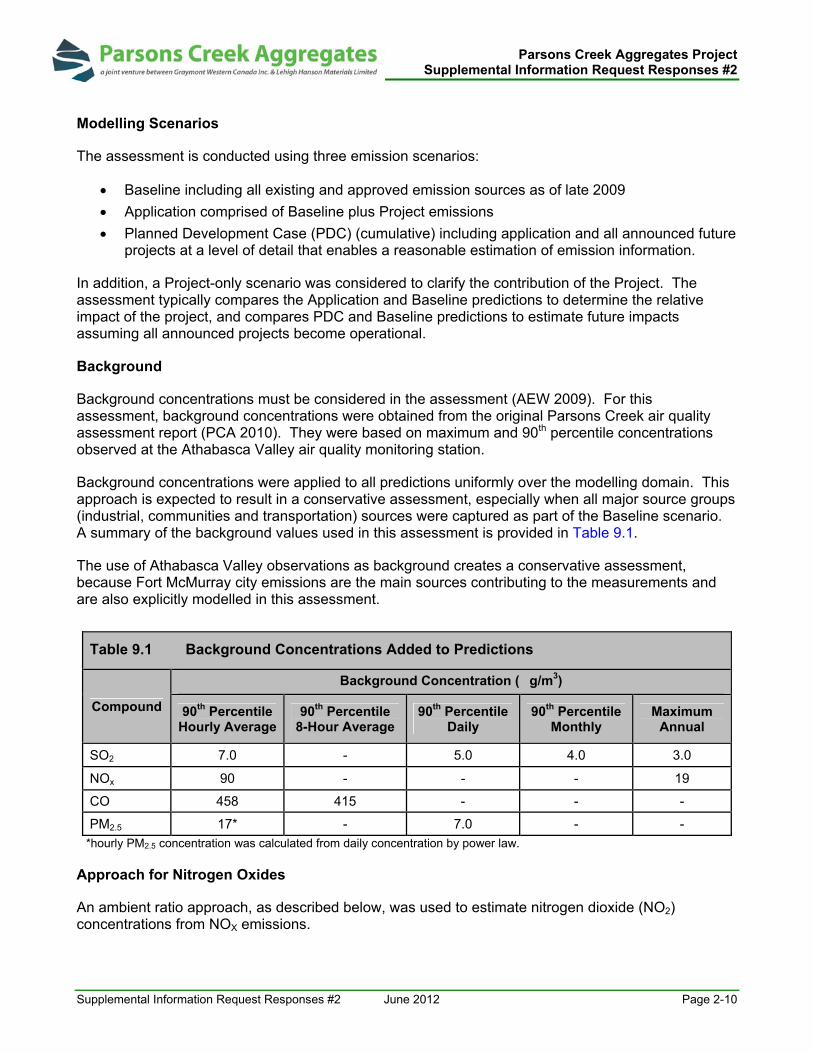
Background concentrations must be considered in the assessment (AEW 2009). For this assessment, background concentrations were obtained from the original Parsons Creek air quality assessment report (PCA 2010). They were based on maximum and 90th percentile concentrations observed at the Athabasca Valley air quality monitoring station.
Background concentrations were applied to all predictions uniformly over the modelling domain. This approach is expected to result in a conservative assessment, especially when all major source groups (industrial, communities and transportation) sources were captured as part of the Baseline scenario. A summary of the background values used in this assessment is provided in Table 9.1.
The use of Athabasca Valley observations as background creates a conservative assessment, because Fort McMurray city emissions are the main sources contributing to the measurements and are also explicitly modelled in this assessment.
Table 9.1 Background Concentrations Added to Predictions
Compound
Background Concentration (�g/m3)
90th Percentile Hourly Average
90th Percentile 8-Hour Average
90th Percentile Daily
90th Percentile Monthly
Maximum Annual
SO2 7.0 - 5.0 4.0 3.0
NOx 90 - - - 19
CO 458 415 - - -
PM2.5 17* - 7.0 - -
*hourly PM2.5 concentration was calculated from daily concentration by power law.
Approach for Nitrogen Oxides
An ambient ratio approach, as described below, was used to estimate nitrogen dioxide (NO2) concentrations from NOX emissions.

Parsons Creek Aggregates Project Supplemental Information Request Responses #2
Supplemental Information Request Responses #2 June 2012 Page 2-11
The ambient ratio method uses simultaneously observed NO2 and NOX values at monitoring sites in the region and is the preferred United States Environmental Protection Agency (U.S. EPA) approach. Direction from the U.S. EPA (Wilson 1997) indicates that the ozone limiting method (OLM) is intended for application in the plume of a single source rather than in multiple source situations.
The ambient ratio method requires that monitoring locations are representative of the areas in which the model is applied. Observed NOX concentrations from four air quality monitoring stations (Fort McKay, Patricia McInnes, Athabasca Valley and Fort Chipewyan) for three years were used to develop parameters for conversion to NO2 (following the approach of Dover 2010).
To estimate ambient NO2 concentrations, emissions were first modelled as NO2 and NO and dispersed without chemical transformation using CALPUFF. Predicted NO2 concentrations were calculated using the ambient ratio method.
Study Area and Receptor Grid
Local (LSA) and regional study (RSA) areas were chosen for this assessment and are shown in Figure 9.1. The size and location were based on several factors:
the location of major regional industrial emission sources; and
the expected spread of project concentration and deposition contours.
The RSA is about 60 km by 110 km and includes the mining areas in the northern oil sands, including the Shell Pierre River Mine. The LSA is a 20 km by 20 km square centred approximately on the modelled Parsons Creek Limestone process area.
The receptor grids described below were used as per AEW (2009). Receptor grids were set according to the following spacing:
Grid A = 20 m spacing along the Project boundary
Grid B =1 x 1 km, 50 m spacing, centred on 474250 m E, 6295250 m N;
Grid C = 4 x 4 km, 250 m spacing, centred on 474250 m E, 6295250 m N;
Grid D = 10 x 10 km, 500 m spacing, centred on 474250 m E, 6295250 m N;
Grid E = 20 X 20 km, 1000 m spacing, centred on 474250 m E, 6295250 m N;
Grid F = 60 X 110 km, 2000 m spacing beyond 10 km from the Project
12 sensitive receptors.
When reporting maximum concentrations, predictions were only made for areas outside the Project fenceline and all regional area sources.
The locations of 12 sensitive receptors were listed in Table 9.2 and shown in Figure 9.1.

Parsons Creek Aggregates Project Supplemental Information Request Responses #2
Supplemental Information Request Responses #2 June 2012 Page 2-12
Table 9.2 Locations of Sensitive Receptors
Receptor Description UTM-E [km]
UTM-N [km]
R1 Sunset Salvage 473.842 6293.628
R2 Easy Span Bridge Rentals 473.646 6295.555
R3 Cabin 474.621 6295.095
R4 Truck Staging Area 473.302 6299.583
R5 Northlands Forest Products 473.153 6302.809
R6 Taiga Nova Eco-Industrial Park 474.308 6292.520
R7 Wastewater Treatment Plant 474.754 6291.635
R8 E-T Energy 472.585 6295.807
R9 Timberlea Residential Area 473.516 6292.250
R10 North Parsons Residential Area (Plateau) 472.926 6293.451
R11 Patricia McInnes AQ 473.406 6288.684
R12 Athabasca Valley AQ 476.059 6288.232
Emissions
Project Emissions
Table 9.3 lists hourly, daily and annual emission rates for SO2, CO, NOX and PM2.5 associated with Limestone Quarry operations, obtained from the original air quality assessment report (PCA 2010). Daily and annual emissions were about 30% and 40% lower than hourly emissions, respectively. For this assessment, hourly emissions were used to model the Project scenario (for hourly, daily and annual averages). The approach is expected to result in a conservative assessment for daily and annual predictions associated with the Project operations.
Figure 9.1 also shows the location of the Project plant process area, mine area and haul road used in the modelling. The mine pit area was located in the southern portion of the Project lease area corresponding to year 2045 (stage 1C), as it is the closest expected location with respect to the City of Fort McMurray and is expect to provide the highest potential concentrations for most surrounding residents. It also shows the layout of area sources for the North Parsons Creek Sand and Gravel Operations, which is expected to operate only in the Baseline scenario.

Parsons Creek Aggregates Project Supplemental Information Request Responses #2
Supplemental Information Request Responses #2 June 2012 Page 2-13
Table 9.3 Emission Rates Associated with Limestone Quarry Operations
Emission Source SO2 NOx PM2.5 (Diesel)
PM2.5 (Dust)
Total PM2.5
CO
Hourly Emission (g/s)
Pit Operation 0.0121 2.60 0.047 0.078 0.125 6.45
Process Area 0.0021 1.06 0.016 0.049 0.066 1.87
Haul Road 0.0033 0.44 0.022 0.089 0.111 3.84
Total hourly Emissions 0.0175 4.10 0.085 0.217 0.302 12.16
Daily Emission (g/s)
Pit Operation 0.0083 2.05 0.035 0.056 0.091 4.57
Process Area 0.0018 0.93 0.014 0.043 0.057 1.64
Haul Road 0.0019 0.26 0.013 0.078 0.091 2.24
Total Daily Emissions 0.0120 3.24 0.061 0.177 0.239 8.45
Annual Emission (g/s)
Pit Operation 0.0054 1.88 0.028 0.032 0.060 3.28
Process Area 0.0017 0.91 0.013 0.033 0.046 1.50
Haul Road 0.0019 0.25 0.013 0.060 0.073 2.21
Total Annual Emissions 0.0090 3.05 0.054 0.125 0.179 6.99
Regional Emissions
Emissions within the RSA from existing operating facilities, approved but not yet operating facilities, and proposed facilities including those under regulatory review, were obtained from Dover Operating Corp. Dover Commercial Project Environmental Impact Assessment (EIA) report (Dover 2010).
Within the Baseline, Application and PDC scenarios, uncertainties exist about whether all facilities will proceed and whether or not all facilities would operate at full capacity concurrently. Therefore, it is likely emission estimates in all three scenarios have been overestimated.
Table 9.4 provides a summary of emissions in the RSA for each emission scenario. Tables 9.5 to 9.7 summarize the emissions of each project within the RSA for the Baseline, Application, and PDC scenarios, respectively. The table demonstrates the negligible contribution of the Project to RSA emissions.
Table 9.4 Summary of Emission Rates for the Three Emission Scenarios
Emission Scenarios Emission Rate[t/d]
SO2 NOx CO PM2.5
Baseline 200.7 399.3 401.3 30.2
Application 200.7 399.3 401.9 30.2
Planned Development 215.7 462.9 511.4 35.5

Parsons Creek Aggregates Project Supplemental Information Request Responses #2
Supplemental Information Request Responses #2 June 2012 Page 2-14
Table 9.5 Summary of Emissions for the Baseline Scenario
Operation Emission Rates [t/d]
SO2 NOx CO PM2.5
Albian Sands Muskeg River Mine Phase 1 & 2 0.61 31.68 27.03 1.61
Birch Mountain Hammerstone 9.46 12.79 11.79 1.17
CNRL Horizon 16 46.64 33.42 2.31
E-T Energy Poplar Creek In-Situ 0 0.006 0.006 0
Husky Sunrise Stage 1-3 1.18 7.56 26.95 0
Imperial Oil Kearl 0.67 42.68 28.6 1.97
Northland Forest Products 0.02 0.19 25 0.19
North Parsons Creek Sand and Gravel Operations 0.001 0.41 0.43 0.05
Shell Jackpine Phase 1 0.33 18.28 12.22 0.85
Suncor Fort Hills 0.4 22.22 13.93 0.88
Suncor MacKay River & Expansion 0.59 5.01 4.45 0.19
Suncor Dover 0.5 0.34 0.13 0.02
Suncor Base Plant and Millennium 57.46 76.27 41.46 6.86
Suncor Firebag & Firebag ETS* 3.13 10.65 6.36 0.94
Suncor MD9 0.003 10.18 12.22 0.55
Suncor Voyageur 9.23 22.9 23.02 1.32
Syncrude Mildred Lake 100.52 55.72 80.85 6.32
Syncrude Aurora (South & North Mine) 0.07 27.76 6.68 1.04
Williams Energy Fort McMurray Chemical Plant 0 0.02 0.02 0
Community and Highway Emissions 0.54 8.02 46.71 3.97
Total Baseline Emissions 200.7 399.3 401.3 30.2 *Facility was included in modelling but out of RSA

Parsons Creek Aggregates Project Supplemental Information Request Responses #2
Supplemental Information Request Responses #2 June 2012 Page 2-15
Table 9.6 Summary of Emissions for the Application Scenario
Operation Emission Rates [t/d]
SO2 NOx CO PM2.5
Albian Sands Muskeg River Mine Phase 1 & 2 0.61 31.68 27.03 1.61
Birch Mountain Hammerstone 9.46 12.79 11.79 1.17
CNRL Horizon 16 46.64 33.42 2.31
E-T Energy Poplar Creek In-Situ 0 0.006 0.006 0
Husky Sunrise Stage 1-3 1.18 7.56 26.95 0
Imperial Oil Kearl 0.67 42.68 28.6 1.97
Northland Forest Products 0.02 0.19 25 0.19
Parsons Creek Limestone Quarry 0.002 0.35 1.05 0.03
Shell Jackpine Phase 1 0.33 18.28 12.22 0.85
Suncor Fort Hills 0.4 22.22 13.93 0.88
Suncor MacKay River & Expansion 0.59 5.01 4.45 0.19
Suncor Dover 0.5 0.34 0.13 0.02
Suncor Base Plant and Millennium 57.46 76.27 41.46 6.86
Suncor MD9 0.003 10.18 12.224 0.55
Suncor Firebag & Firebag ETS* 3.131 10.649 6.357 0.94
Suncor Voyageur 9.23 22.9 23.02 1.32
Syncrude Mildred Lake 100.52 55.72 80.85 6.32
Syncrude Aurora (South & North Mine) 0.07 27.76 6.68 1.04
Williams Energy Fort McMurray Chemical Plant 0 0.02 0.02 0
Community and Highway Emissions 0.54 8.02 46.71 3.97
Total Application Emissions 200.7 399.3 401.9 30.2
*Facility was included in modelling but out of RSA

Parsons Creek Aggregates Project Supplemental Information Request Responses #2
Supplemental Information Request Responses #2 June 2012 Page 2-16
Table 9.7 Summary of Emissions for the Planned Development Scenario
Operation Emission Rates [t/d]
SO2 NOx CO PM2.5
Alberta Oil Sands Clearwater Pilot 0.15 0.12 0.37 0.01
Albian Sands Muskeg River Mine Phase 1 & 2 0.61 21.78 27.03 0.9
Birch Mountain Hammerstone 9.46 12.79 11.79 1.17
CNRL Horizon & Horizon In-situ 16.4 34.5 35.47 1.54
E-T Energy Poplar Creek In-Situ 0 0.006 0.006 0
Excelsior Hangingstone Pilot* 0.66 0.96 0.82 0.07
Husky Sunrise Stage 1-3 1.18 7.56 26.95 0
Imperial Oil Kearl 0.67 41.04 28.6 1.97
Northland Forest Products 0.02 0.19 25 0.19
Parsons Creek Limestone Quarry 0.002 0.35 1.05 0.03
Shell Jackpine Expansion 4.11 18.07 18.44 0.81
Shell Pierre River Mine 4.09 12.45 13.32 0.51
Suncor Fort Hills 0.4 21.28 13.93 0.88
Suncor MacKay River & Expansion 0.59 5.01 4.45 0.19
Suncor Dover 0.5 0.34 0.13 0.02
Suncor Lewis 1.63 7.01 5.39 0.47
Suncor Base Plant and Millennium 55.85 61.32 25.13 5.96
Suncor Firebag & Firebag ETS* 7.35 21.43 14.51 1.67
Suncor MD9 & Pit4 0.1 26.97 30.24 1.43
Suncor Voyageur & Voyageur South 9.35 36.54 31.98 1.93
Syncrude Mildred Lake 100.52 47.33 80.85 5.94
Syncrude Aurora (South & North Mine) 0.56 40.58 20.41 2.05
Total Joslyn North Mine 0.01 7.51 6.91 0.26
UTS Equinox Oil Sands Mine Project 0.17 5.97 3.66 0.23
UTS Frontier Oil Sands Mine Project* 0.4 19.08 11.73 0.75
Williams Energy Fort McMurray Chemical Plant 0 0.02 0.02 0
Community and Highway Emissions 0.91 12.71 73.24 6.56
Total PDC Emissions 215.7 462.9 511.4 35.5
*Facility was included in modelling but out of RSA
Parsons Creek Aggregates Project Supplemental Information Request Responses #2
Supplemental Information Request Responses #2 June 2012 Page 2-17
Assessment Results
Sulphur Dioxide
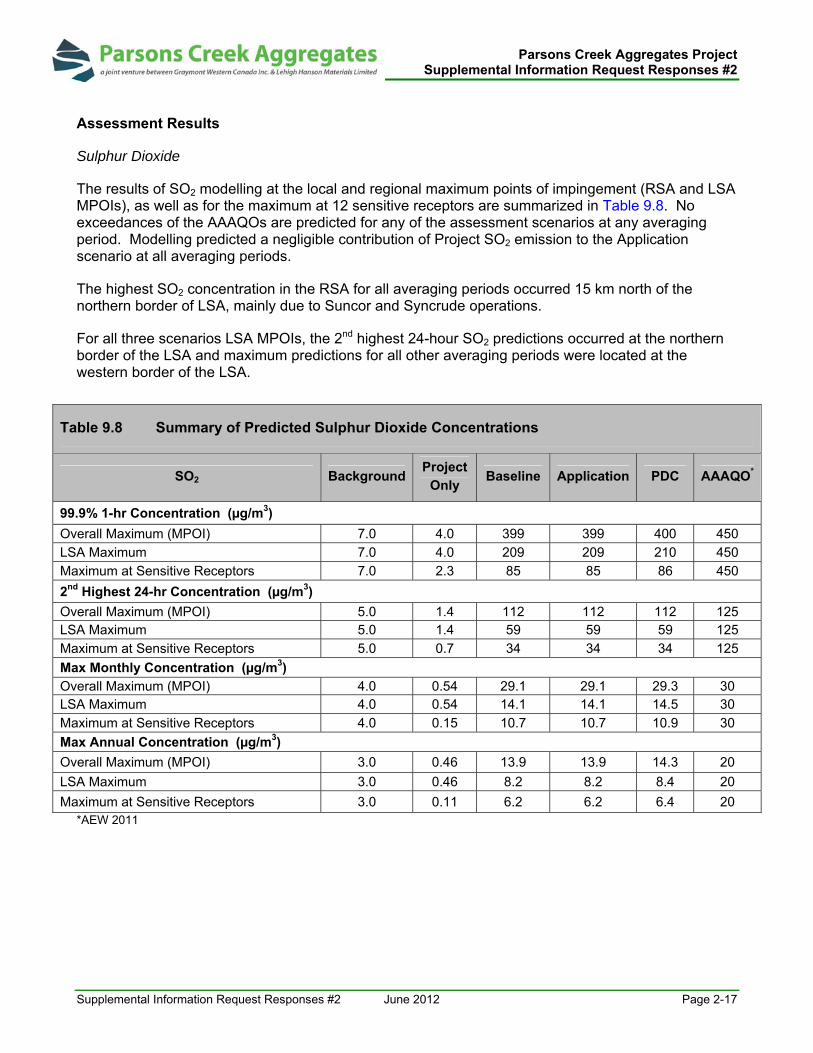
The results of SO2 modelling at the local and regional maximum points of impingement (RSA and LSA MPOIs), as well as for the maximum at 12 sensitive receptors are summarized in Table 9.8. No exceedances of the AAAQOs are predicted for any of the assessment scenarios at any averaging period. Modelling predicted a negligible contribution of Project SO2 emission to the Application scenario at all averaging periods.
The highest SO2 concentration in the RSA for all averaging periods occurred 15 km north of the northern border of LSA, mainly due to Suncor and Syncrude operations.
For all three scenarios LSA MPOIs, the 2nd highest 24-hour SO2 predictions occurred at the northern border of the LSA and maximum predictions for all other averaging periods were located at the western border of the LSA.
Table 9.8 Summary of Predicted Sulphur Dioxide Concentrations
SO2 BackgroundProject
Only Baseline Application PDC AAAQO*
99.9% 1-hr Concentration (µg/m3) Overall Maximum (MPOI) 7.0 4.0 399 399 400 450
LSA Maximum 7.0 4.0 209 209 210 450
Maximum at Sensitive Receptors 7.0 2.3 85 85 86 450
2nd Highest 24-hr Concentration (µg/m3)
Overall Maximum (MPOI) 5.0 1.4 112 112 112 125 LSA Maximum 5.0 1.4 59 59 59 125
Maximum at Sensitive Receptors 5.0 0.7 34 34 34 125
Max Monthly Concentration (µg/m3)
Overall Maximum (MPOI) 4.0 0.54 29.1 29.1 29.3 30 LSA Maximum 4.0 0.54 14.1 14.1 14.5 30
Maximum at Sensitive Receptors 4.0 0.15 10.7 10.7 10.9 30
Max Annual Concentration (µg/m3)
Overall Maximum (MPOI) 3.0 0.46 13.9 13.9 14.3 20
LSA Maximum 3.0 0.46 8.2 8.2 8.4 20
Maximum at Sensitive Receptors 3.0 0.11 6.2 6.2 6.4 20 *AEW 2011

Parsons Creek Aggregates Project Supplemental Information Request Responses #2
Supplemental Information Request Responses #2 June 2012 Page 2-18
Oxides of Nitrogen
The modelling results of NOx and NO2 are presented in Table 9.9. The results indicated no predicted exceedances of the AAAQOs of NO2 for any of the assessment scenarios at any averaging period in the LSA. The annual RSA MPOI values exceeded the AAAQO of 45 g/m3 for the Baseline, Application and PDC scenarios, where the Project contribution is negligible.
The patterns of NO2 concentration for 99.9th percentile 1-hour and annual averages for the three emission scenarios are shown in Figures 9.2 to 9.7, respectively. The patterns indicated the highest NO2 concentration for Baseline and Application scenarios in the RSA occurred 45 km north of the northern border of LSA, mainly due to Albian Sands Muskeg River Mine and CNRL Horizon operations. The RSA MPOIs for the PDC scenario were located near the Suncor mine, 11 km north of the northern border of LSA.
Predicted 99.9th percentile 1-hour concentrations at the LSA MPOI and sensitive receptors were about half of the AAAQO in all assessment scenarios, while modelling predicted a 9% Project contribution at the LSA MPOI and 34% at the sensitive receptor with the highest predicted concentration. The LSA MPOI for hourly NO2 concentration for Application scenario was located at the Project fenceline, and the LSA MPOIs for Baseline and PDC scenarios both occurred at the northern border of the LSA.
The LSA MPOIs for all emission scenarios for annual averages were at Project fenceline. The Project contribution to annual averages is conservative given that annual emissions were about 40% less than modelled.

Parsons Creek Aggregates Project Supplemental Information Request Responses #2
Supplemental Information Request Responses #2 June 2012 Page 2-19
Table 9.9 Summary of Predicted Oxides of Nitrogen Concentrations
NOx and NO2 BackgroundProject Only
Baseline Application PDC AAAQO*
99.9% 1-hr NOx Concentration (µg/m3) Overall Maximum (MPOI) 90 1,542 4,780 4,780 4,963
LSA Maximum 90 1,542 1,378 1,665 1,762
Maximum at Sensitive Receptors 90 984 579 1,114 1,130
99.9% 1-hr NO2 Concentration (µg/m3)
Overall Maximum (MPOI) 166 276 276 281 300 LSA Maximum 166 157 171 176 300
Maximum at Sensitive Receptors 135 106 143 144 300
Annual NOx Concentration (µg/m3)
Overall Maximum (MPOI) 19 156 313 313 390 LSA Maximum 19 156 79 192 198
Maximum at Sensitive Receptors 19 35 49 72 78
Annual NO2 Concentration (µg/m3)
Overall Maximum (MPOI) 40 55 55 61 45
LSA Maximum 40 29 44 45 45
Maximum at Sensitive Receptors 20 23 28 29 45 *AEW 2011
Parsons Creek Aggregates Project Supplemental Information Request Responses #2
Supplemental Information Request Responses #2 June 2012 Page 2-20
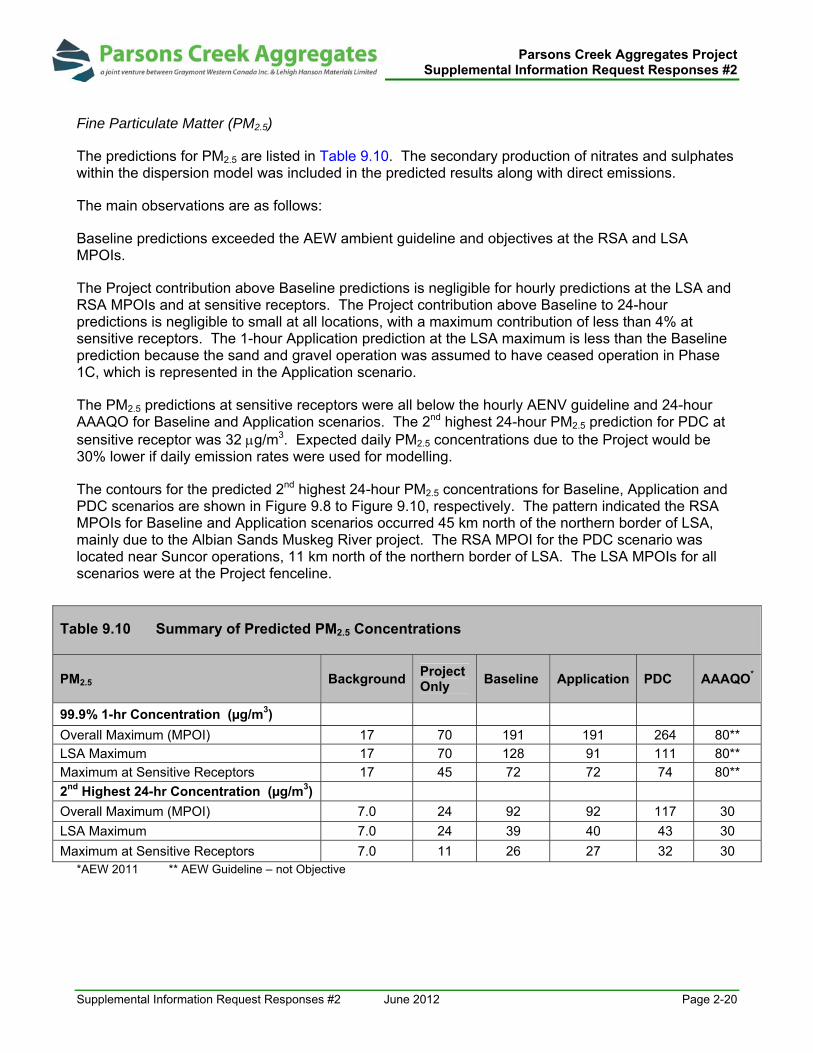
Fine Particulate Matter (PM2.5)
The predictions for PM2.5 are listed in Table 9.10. The secondary production of nitrates and sulphates within the dispersion model was included in the predicted results along with direct emissions.
The main observations are as follows:
Baseline predictions exceeded the AEW ambient guideline and objectives at the RSA and LSA MPOIs.
The Project contribution above Baseline predictions is negligible for hourly predictions at the LSA and RSA MPOIs and at sensitive receptors. The Project contribution above Baseline to 24-hour predictions is negligible to small at all locations, with a maximum contribution of less than 4% at sensitive receptors. The 1-hour Application prediction at the LSA maximum is less than the Baseline prediction because the sand and gravel operation was assumed to have ceased operation in Phase 1C, which is represented in the Application scenario.
The PM2.5 predictions at sensitive receptors were all below the hourly AENV guideline and 24-hour AAAQO for Baseline and Application scenarios. The 2nd highest 24-hour PM2.5 prediction for PDC at sensitive receptor was 32 g/m3. Expected daily PM2.5 concentrations due to the Project would be 30% lower if daily emission rates were used for modelling.
The contours for the predicted 2nd highest 24-hour PM2.5 concentrations for Baseline, Application and PDC scenarios are shown in Figure 9.8 to Figure 9.10, respectively. The pattern indicated the RSA MPOIs for Baseline and Application scenarios occurred 45 km north of the northern border of LSA, mainly due to the Albian Sands Muskeg River project. The RSA MPOI for the PDC scenario was located near Suncor operations, 11 km north of the northern border of LSA. The LSA MPOIs for all scenarios were at the Project fenceline.
Table 9.10 Summary of Predicted PM2.5 Concentrations
PM2.5 BackgroundProject Only
Baseline Application PDC AAAQO*
99.9% 1-hr Concentration (µg/m3) Overall Maximum (MPOI) 17 70 191 191 264 80**
LSA Maximum 17 70 128 91 111 80**
Maximum at Sensitive Receptors 17 45 72 72 74 80**
2nd Highest 24-hr Concentration (µg/m3)
Overall Maximum (MPOI) 7.0 24 92 92 117 30
LSA Maximum 7.0 24 39 40 43 30
Maximum at Sensitive Receptors 7.0 11 26 27 32 30 *AEW 2011 ** AEW Guideline – not Objective
Parsons Creek Aggregates Project Supplemental Information Request Responses #2
Supplemental Information Request Responses #2 June 2012 Page 2-21
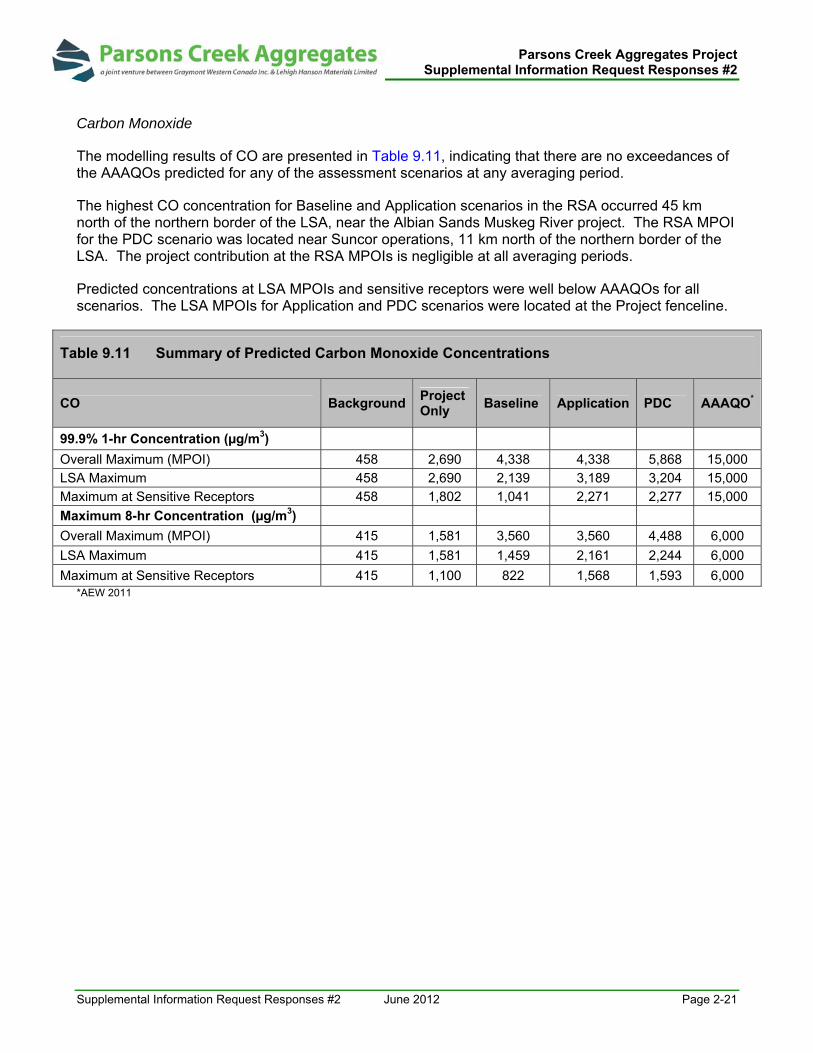
Carbon Monoxide
The modelling results of CO are presented in Table 9.11, indicating that there are no exceedances of the AAAQOs predicted for any of the assessment scenarios at any averaging period.
The highest CO concentration for Baseline and Application scenarios in the RSA occurred 45 km north of the northern border of the LSA, near the Albian Sands Muskeg River project. The RSA MPOI for the PDC scenario was located near Suncor operations, 11 km north of the northern border of the LSA. The project contribution at the RSA MPOIs is negligible at all averaging periods.
Predicted concentrations at LSA MPOIs and sensitive receptors were well below AAAQOs for all scenarios. The LSA MPOIs for Application and PDC scenarios were located at the Project fenceline.
Table 9.11 Summary of Predicted Carbon Monoxide Concentrations
CO BackgroundProject Only
Baseline Application PDC AAAQO*
99.9% 1-hr Concentration (µg/m3) Overall Maximum (MPOI) 458 2,690 4,338 4,338 5,868 15,000
LSA Maximum 458 2,690 2,139 3,189 3,204 15,000
Maximum at Sensitive Receptors 458 1,802 1,041 2,271 2,277 15,000
Maximum 8-hr Concentration (µg/m3)
Overall Maximum (MPOI) 415 1,581 3,560 3,560 4,488 6,000
LSA Maximum 415 1,581 1,459 2,161 2,244 6,000
Maximum at Sensitive Receptors 415 1,100 822 1,568 1,593 6,000 *AEW 2011

Parsons Creek Aggregates Project Supplemental Information Request Responses #2
Supplemental Information Request Responses #2 June 2012 Page 2-22
Summary
The CALMET meteorological and the CALPUFF dispersion models were used to assess the dispersion of SO2, NOx, CO and PM2.5 emissions associated with the PCA Limestone Quarry operations. Three scenarios (Baseline, Application and PDC) were modelled. Background concentrations from the Athabasca Valley air monitoring stations were added to predictions, resulting in a conservative assessment as all major source groups (industrial, communities and transportation) sources were modelled as part of the Baseline scenario. The same sources also contributed to background observations.
The Project emissions were obtained from the original PCA air quality assessment report (PCA 2010). Hourly emissions were used to model the Project emissions, for all averaging periods, further contributing to a conservative assessment. Regional emissions were obtained from the Dover Commercial Project EIA air quality assessment (Dover 2010).
The RSA was about 60 km by 110 km and includes the mining areas in the northern oil sands. The LSA was a 20 km by 20 km square centred approximately on the Project.
Air quality, with two exceptions, met AAAQOs at all locations in the RSA and LSA. The one exception was that 24-hour average PM2.5 concentrations were above the AAAQO at both RSA and LSA MPOIs in all emissions scenarios, where the Project influence was negligible to small. The other exception was the annual NO2 concentrations exceeded the AAAQO at the RSA MPOI for the Baseline, Application and PDC scenarios, where the project contribution is negligible.
References
Alberta Environment and Water (AEW). 2009. Air quality model guideline. Prepared by A. Idriss and F. Spurrell, Climate Change, Air and Land Policy Branch. Available at: http://environment.gov.ab.ca/info/library/8151.pdf. 44 pp.
Alberta Environment and Water (AEW). 2011. Alberta Ambient Air Quality Objectives and Guidelines Summary. http://environment.gov.ab.ca/info/library/5726.pdf
Dover Operating Corp. (Dover). 2010. Dover Commercial Project Environmental Impact Assessment (EIA) Report.
Parsons Creek Aggregates (PCA). 2010. Air Quality Assessment of Air Emissions Associated with Operations of the Proposed Parsons Creek Aggregates (PCA) Limestone Quarry Report.
Scire, J. and C. Escoffier-Czaja. 2004. CALPUFF Training Course, Canadian Prairie and Northern Section of the Air and Waste Management Association. 843 pp.
Scire, J.S., D.G. Strimaitis and R.J. Yamartino. 2000. A User’s Guide for the CALPUFF Model (Version 5.0). Concord, MA: Earth Technologies Inc..

Parsons Creek Aggregates Project Supplemental Information Request Responses #2
Supplemental Information Request Responses #2 June 2012 Page 2-23
Wilson, R.B. 1997. Letter to Jim Baumgartner of the Alaskan Department of Environmental Conservation. U.S. EPA. 2 pp.
Figures
Figure 9.1 Project plot plan and sensitive receptors
Figure 9.2 Predicted 99.9th percentile hourly NO2 concentrations – baseline scenario
Figure 9.3 Predicted 99.9th percentile hourly NO2 concentrations – application scenario
Figure 9.4 Predicted 99.9th percentile hourly NO2 concentrations – PDC scenario
Figure 9.5 Predicted annual average NO2 concentrations – baseline scenario
Figure 9.6 Predicted annual average NO2 concentrations – application scenario
Figure 9.7 Predicted annual average NO2 concentrations – PDC scenario
Figure 9.8 Predicted 2nd highest daily PM2.5 concentrations – baseline scenario
Figure 9.9 Predicted 2nd highest daily PM2.5 concentrations – application scenario
Figure 9.10 Predicted 2nd highest daily PM2.5 concentrations – PDC scenario
b. Provide references for the sources of emissions included.
Response:
Emissions associated with Parsons Creek existing operations and the proposed Project were provided in Sections 4.1 and 5.1 of the Parsons Creek air quality assessment. Emission factors for Parsons Creek emissions are listed in SIR 46. Emissions associated with the assessments contained in Jacques Whitford (2007) and Dover Opco (2010) are contained in air quality emissions appendices in the respective EIAs.
c. Update the modelling and results of any sources that were not considered in the original analysis.
Response:
See response to a.
Parsons Creek Aggregates Project Supplemental Information Request Responses #2
Supplemental Information Request Responses #2 June 2012 Page 2-24
10. SIR 35, Page 2-8 PCA assumes that Applications of three dimensional meteorological wind fields are more suitable to the assessment of emissions from elevated sources, which are influenced by wind patterns at higher elevations and therefore, evaluation of three dimensional wind fields for this study would not have been appropriate.
a. Provide a valid reference to support this assumption.
Response:
According to Alberta Environment’s air quality model guidelines (AEW 2009), for refined assessments, actual near-site data are to be used. The representativeness of the actual data depends on the proximity of the meteorological monitoring site to the activity, the complexity of the terrain, the exposure of the instruments, the time of data collection, and the data recording method. Data for refined modelling must be temporally and spatially representative of the site of the facility. Preferred datasets are:
A minimum of 1 year of site-specific meteorology.
The most recent 5 years of meteorological data, readily available from a nearby airport station, that has similar site surface characteristics must be utilized.
MM5 data for 2002-2006.
Thus, the need for a regional 3D data set is not a requirement according to AEW (2009), nor is it the preferred option. An assessment to determine whether meteorological data are adequately representative involves an examination of the surrounding terrain, surface characteristics, and the height of the source versus the height of the measurements.
For the Parsons Creek project, the wind measurements at the WBEA Athabasca Valley station (which data we assert are of comparable or higher quality than meteorological data collected at the Fort McMurray airport) are made in the same river valley as the Project and the valley is oriented in approximately the same direction. Valley depth and valley wall steepness are similar at both locations. Tree heights and valley bottom characteristics are similar at the two sites. Surface characteristics are similar at the two sites although the Athabasca Valley site is closer to urban development than the Project.
The wind measurement height at the Athabasca Valley station is 10 m. This height is comparable to the height of Project dust and exhaust-plumes from haul and quarry equipment. Thus, the use of Athabasca Valley data was consistent with the modelling approach adopted for this assessment.
Reference:
Alberta Environment (AEW). 2009. Air Quality Model Guideline. Prepared by A. Idriss and F. Spurrell, Climate Change, Air and Land Policy Branch. 43 pp.

Parsons Creek Aggregates Project Supplemental Information Request Responses #2
Supplemental Information Request Responses #2 June 2012 Page 2-25
11. SIR 42, Page 2-14 PCA does not directly answer SIR 42.
a. Provide a list of the monitoring data PCA will specifically collect as it relates to air quality, including component methodologies and frequencies.
Response:
PCA proposes to monitor the following:
Wind speed and direction continuously to support its dust management plan
PM2.5 continuously using laser/optical technology to support its dust management plan.
PCA expects the use of optical technology will allow it to locate monitoring in locations that do not require line power, providing greater flexibility as the quarrying proceeds.
12. SIR 43, Pages 2-14 and 2-15 Appendix A, Section 2.1, Page 2 As per Section 5.4 of the Terms of Reference, PCA is required to provide the following for the assessment of cumulative impacts of air emissions within the EIA study area:
Discuss baseline ambient air quality conditions. Review current emission sources and discuss changes as a result of anticipated future industrial development within the EIA Study Areas. Consider emission point sources as well as fugitive emissions. Identify components of the Project that will affect ambient air quality from a local and regional perspective by doing the following:
a. discuss appropriate air quality parameters such as oxides of nitrogen (NOx), visibility, and particulates (road dust, PM10 and PM2.5);
b. estimate ground-level concentrations via modeling of appropriate air quality parameters. Discuss any expected changes to particulate deposition patterns. Include a comparison of modeled concentrations to recent monitoring results, as appropriate;
c. identify the potential for reduced air quality (including odours and visibility) resulting from the Project and discuss any implications of the expected air quality for environmental protection and public health. Provide this information specifically for communities and sensitive receptors located close to the Project, as appropriate;
d. describe air quality impacts resulting from the Project, and their implications for other environmental resources, including vegetation resources, and water and soil quality;
e. for acid deposition modeling, provide deposition data predictions including magnitude and location of predicted maximum levels for all areas within the 0.25 keq/ha/yr and 0.17 keq/ha/yr Potential Acid Input (PAI) isopleth, including analysis of PAI deposition levels consistent with the CEMA Acid Deposition Management Framework;
f. complete modeling and present results in accordance with Alberta Environment's Air Quality Modeling Guidelines (March 2003);

Parsons Creek Aggregates Project Supplemental Information Request Responses #2
Supplemental Information Request Responses #2 June 2012 Page 2-26
g. describe how air quality impacts resulting from the Project will be mitigated and any monitoring programs to be implemented for assessing air quality or the effectiveness of mitigation measures;
h. discuss the use of ozone depleting substances;
i. describe meteorological conditions including wind speed, direction and inversions insofar as they affect dispersion and disposition; and
j. estimate the quantity released of any compounds regulated under the NPRI.
The project description indicates that the last phase of the project will be in closest proximity to Fort McMurray.
a. Provide an assessment of the cumulative impacts of air emissions for all stages of the project. Include all appropriate sources, including the new interchange proposed in Appendix A.
Response:
Production increases will be phased-in with maximum production of 2Mt/y expected following the tenth year of operation. Production is planned at the quarry for about 40 years. This will involve an annual average processing of about 0.9 and 1.4 106m3 of overburden and limestone respectively.
The project has been planned in three stages (1-3) each with three sub-stages (a, b, c). Production is planned to start at the northern end of the lease (stage 3D) and move to the southern end (stage 1C) nearest Fort McMurray. Production is expected to be ramped up to 2 Mt at the end of stage 3D. Prior to that time, emissions would be lower and would result in lower impacts.
Dispersion modelling was completed for stage 1C. This stage was modelled because it represented maximum production and was located nearest to Fort McMurray and a number of special health-risk receptors. Thus, it represented the Project stage most likely to impact the largest number of people and therefore represented the worst case scenario.
Modelling the worst case scenario, when project development is staged, is common practice in air quality. Recent approved mining and quarrying applications in the oil sands region of Alberta in which only the worst case scenario was modelled include the following:
Total North Mine
Fort Hills
Kearl Mine
Shell Pierre River and Jackpine Expansion
Specifically with respect to the geometry of the new interchange, this information was made available after the initial filing. Nonetheless, the 2007 planned development case considered the impact of a growth in traffic on Highway 63 including the segment near the project.
Finally, the response to SIR 9 above shows that original PCA predictions were consistent with those of recent applications, providing additional confidence in the original results.
Parsons Creek Aggregates Project Supplemental Information Request Responses #2
Supplemental Information Request Responses #2 June 2012 Page 2-27
References:
True North Energy. 2001. Fort Hills Oil Sands Project.
Imperial Oil Resources Ventures Ltd. 2005. Application for the Kearl Oilsands Project – Mine Development.
Shell Canada Energy. 2008. Applications for the approval of the Jackpine Mine Expansion and the Pierre River Mine – Update.
Total E&P Joslyn Ltd. 2010. Joslyn North Mine Project – Additional Information. Responses to JRP Additional Information Requests and Additional Information Project Update.
PCA states that Background concentration of PAI were not determined as part of this study.
b. Calculate PAI values associated with the baseline, application and cumulative effects scenarios according to Alberta Environment’s Alberta Acid Deposition Management Framework, February 2008, and present these data in both numerical and isopleth form.
Response:
According to Alberta Environment’s Alberta Acid Deposition Management Framework (February 2008), a project proponent should be required to complete regional acid deposition modelling if the proponent’s combined emissions of SO2, NOX, and NH3
are greater than 0.175 t/d of H+
equivalent.
According to Table 5.1-2 in the air quality section of the EIA, Project annual emissions of SO2 are 0.009 g/s (0.008 t/d) and NOX emissions are 3.05 g/s (0.26 t/d). Project emissions of NH3 are negligible.
Total Project H+ = 2*0.0008/64 + 1*0.26/46 = 0.0058 t/d H+
The H+ emissions are less than the threshold of 0.175 t/d. Therefore according to the Acid Deposition Management Framework, an acid deposition assessment is not required for the Project.
PAI was originally assessed because the 0.175 t/d of H+ was not a criterion when the project assessment first began. However, it is currently understood that projects of this size are too small to be considered for PAI modelling.
Reference:
AENV (Alberta Environment). 2008. Alberta Acid Deposition Management Framework. Air Policy Branch, Alberta Environment. Edmonton Alberta. Publication Number: ISBN: 978-0-7785-6725-7 (Printed Edition). 22 pp.
13. SIR 49, Page 2-30 PCA states that Background concentration of PAI were not determined as part of this study.
a. Calculated AIR values associated with the baseline, application and cumulative effects scenarios according to Alberta Environment’s Alberta Acid Deposition Management Framework, February 2008, and present these data in both numerical and isopleths form.

Parsons Creek Aggregates Project Supplemental Information Request Responses #2
Supplemental Information Request Responses #2 June 2012 Page 2-28
Response:
In the response to SIR 12, PCA identified that Project emissions of SO2 and NOX do not warrant the modelling of PAI. Total Project H+ emissions were 0.0058 t/d H+, less than the threshold of 0.175 t/d. Therefore according to the Acid Deposition Management Framework, an acid deposition assessment is not required for the Project.
PCA recognizes that acid deposition is of regional concern, and that while its emissions are not large enough to warrant modelling, it may be contributing to regional accumulation. An estimate of its regional contribution can be made by comparing Project emissions to regional emissions in SIR Table 9.4. This table demonstrates that the Project contribution to regional emissions of SO2 and NOX are less than 0.1 t/d (or 0.03% of the regional total), and therefore negligible.
14. SIR 51 d., Page 2-33 PCA states that The maximum predicted 24-h value predicted by Jacques in 2007 has already been shown in Table 6.1.1. It refers to the 98th percentile value. According to the Alberta Ambient Air Quality Objectives, Alberta ambient air quality objectives are issued by Alberta Environment, under Section 14 (1), the Environmental Protection and Enhancement Act, 1992 (EPEA). Based upon the available information, Alberta hereby adopts: From the Canada-wide Standards, an Alberta Ambient Air Quality Objective for fine particulate matter (PM2.5) of 30 μg m-3 as a 24-hour average concentration. Alberta Environment does not accept the 98th percentile values for particulate based on modelling. This is only valid for measured data.
a. Recalculate the PM2.5 baseline and application case scenarios, including all applicable sources, as per the Air Quality Modelling Guidelines and TOR for this project. Include the 100th percentile values of 24 hour averaged PM2.5 for baseline. If the results change the assessment, reassess PM2.5 impacts.
Response:
PCA has remodelled PM2.5 and presented the results in response to SIR 9.

Parsons Creek Aggregates Project
Supplemental Information Request Responses #2
Supplemental Information Request Responses #2 May 2012
FIGURES

#
#
#
#
#
#
#
#
#
#
#
#
#
#
#
#
#
#
#
#
#
Saprae Creek
Ath
abasc
a R
iver
!(
!(
Fort McKay
Ft. McMurray
tu63
tu69
N2
W
I
H
E
C
B
S9
S8
S7
S6
S5
S4
S3
S2
S1
N1
A2
A1
S11
S10
450000
450000
475000
475000
500000
500000
62750
00
62750
00
63000
00
63000
00
63250
00
63250
00
63
500
00
63
500
00
63750
00
63750
00
Legend
!( Community
¬ Sensitive Receptor
# Facility
RSA
LSA
Topography (masl)
High : 450
Low : 200
I
XY
XY
XY
XY
XY
XY
XY
XY
XY
XY
XY
XY
XY
XY
XY
XY
XY
XY
XY
XY
XY
XY
XY
XY
XY
XY
XY
XY
XY
XY
XY
XY
¬
¬
¬
¬
¬
¬
¬
¬
¬
¬
¬
¬
#
#
#
tu63
North Parsons Creek Process Area
Mine Pit Area
Parsons Creek LimestoneProcess Area
Mine Pit Areas
R9
R8
R7
R6
R5
R4
R3R2
R1
R12R11
R10
E
N2
N1
465000
465000
470000
470000
475000
475000
480000
48000062850
00
62850
00
62900
00
62900
00
62950
00
62950
00
63000
00
63000
00
6305
000
6305
000
RegionalStudy
Area
Fort McMurray
Sa
ska
t che
wa
n
Alb
erta
Calgary
Edmonton
�1
�2
Map
Do
cu
me
nt:
(k:\
Active P
roje
cts
20
05
\Pro
jects
05
-051
to
05
-100
\05
-05
1 G
raym
ont\
Air Q
ua
lity\F
ig 9
.1 P
roje
ct P
lot
Pla
n.m
xd
) 6/6
/20
12
9.1
Limestone Quarry Mining Project
JDC
JS
Mar 17/12
05D051
0 10 205
Kilometres�1
0 3 61.5
Kilometres�2
Project Area
XY XY XY Hauling Route
PROJECT:
DATE:
CHECKED:
DRAWN: FIGURE:
PROJECT:
TITLE:
Project Plot Plan
Label Receptor Name Label Source Name Label Source Name
R1 Sunset Salvage A1 Albian Sands Muskeg River Mine S4 Suncor MacKay River Project & Expansion
R2 Easy Span Bridge Rentals A2 Albian Sands Muskeg River Mine Expansion S5 Suncor Base Plant and Millennium
R3 Cabin B Birch Mountain Hammerstone S6 Suncor MD9
R4 Truck Staging Area C CNRL Horizon S7 Suncor Mines
R5 Northlands Forest Products E E-T Energy Poplar Creek In-Situ S8 Suncor Voyageur
R6 TaigaNova Eco-Industrial Park H Husky Sunrise Stage 1-3 S9 Syncrude Aurora North
R7 Wastewater Treatment Plant I Imperial Oil Kearl Lake S10 Syncrude Aurora South
R8 E-T Energy N1 Northland Forest Products S11 Syncrude Mildred Lake Upgrader
R9 Timberlea Residential Area N2 North Parsons Creek Sand and Gravel Operations W Williams Energy Fort McMurray Chemical Plant
R10 North Parsons Residential Area (Plateau) S1 Shell Jackpine Phase 1
R11 Particia McInnes AQ S2 Suncor Dover In-Situ Project
R12 Athabasca Valley AQ S3 Suncor Fort Hills Mining Project

#
#
#
#
#
#
#
#
#
#
#
#
#
#
#
#
#
#
#
#
#
Saprae Creek
Ath
abasc
a R
iver
!(
!(
Fort McKay
Ft. McMurray
tu63
tu69
N2
Maximum 276 µg/m3
100
150
150
150
100
150
25
0
150
150
200150
100
15
0200
100
100
200
W
I
H
E
C
B
S9
S8
S7
S6
S5
S4
S3
S2
S1
N1
A2
A1
S11
S10
450000
450000
475000
475000
500000
500000
62750
00
62750
00
63000
00
63000
00
63250
00
63250
00
63
500
00
63
500
00
63750
00
63750
00
Legend
!( Community
¬ Sensitive Receptor
# Facility
RSA
LSA
Topography (masl)
High : 450
Low : 200
I
¬
¬
¬
¬
¬
¬
¬
¬
¬
¬
¬
¬
#
#
#
tu63
Tp 89
Tp 90
R 8W4M
R 9R 10
XY
XY
XY
XY
XY
XY
Maximum 157 µg/m3
100
100
100
125
150
125
100
100100
100100
100
R9
R8
R7
R6
R5
R4
R3R2
R1
R12R11
R10
E
N2
N1
465000
465000
470000
470000
475000
475000
480000
480000
485000
485000
62850
00
62850
00
62
900
00
62
900
00
62950
00
62950
00
63000
00
63000
00
63050
00
63050
00
RegionalStudy
Area
Fort McMurray
Sa
ska
t che
wa
n
Alb
erta
Calgary
Edmonton
�1
�2
Map
Do
cu
me
nt:
(K
:\A
ctive
Pro
jects
200
5\P
roje
cts
05
-05
1 t
o 0
5-1
00\0
5-0
51
Gra
ym
on
t\A
ir Q
ua
lity\F
ig 4
.1 H
ourl
y N
O2
- B
aselin
e.m
xd
) 3/1
7/2
01
2
9.2
Limestone Quarry Mining Project
JDC
JS
Mar 17/12
05D051
0 10 205
Kilometres�1
0 3 61.5
Kilometres�2
Project Area
XY XY XY Hauling Route
Isopleth ContourPROJECT:
DATE:
CHECKED:
DRAWN: FIGURE:
PROJECT:
TITLE:
Predicted 99.9th Percentile 1-hour NO2 Concentrations (µg/m3) - Baseline
Label Receptor Name Label Source Name Label Source Name
R1 Sunset Salvage A1 Albian Sands Muskeg River Mine S4 Suncor MacKay River Project & Expansion
R2 Easy Span Bridge Rentals A2 Albian Sands Muskeg River Mine Expansion S5 Suncor Base Plant and Millennium
R3 Cabin B Birch Mountain Hammerstone S6 Suncor MD9
R4 Truck Staging Area C CNRL Horizon S7 Suncor Mines
R5 Northlands Forest Products E E-T Energy Poplar Creek In-Situ S8 Suncor Voyageur
R6 TaigaNova Eco-Industrial Park H Husky Sunrise Stage 1-3 S9 Syncrude Aurora North
R7 Wastewater Treatment Plant I Imperial Oil Kearl Lake S10 Syncrude Aurora South
R8 E-T Energy N1 Northland Forest Products S11 Syncrude Mildred Lake Upgrader
R9 Timberlea Residential Area N2 North Parsons Creek Sand and Gravel Operations W Williams Energy Fort McMurray Chemical Plant
R10 North Parsons Residential Area (Plateau) S1 Shell Jackpine Phase 1
R11 Particia McInnes AQ S2 Suncor Dover In-Situ Project
R12 Athabasca Valley AQ S3 Suncor Fort Hills Mining Project

#
#
#
#
#
#
#
#
#
#
#
#
#
#
#
#
#
#
#
#
#
Saprae Creek
Ath
abasc
a R
iver
!(
!(
Fort McKay
Ft. McMurray
tu63
tu69
Maximum 276 µg/m3
150
150
100
150
150
150
250
150 10
0
10015
0
200
200
200
100
150
100
100
W
P
I
H
E
C
B
S9
S8
S7
S6
S5
S4
S3
S2
S1
N1
A2
A1
S11
S10
450000
450000
475000
475000
500000
500000
62750
00
62750
00
63000
00
63000
00
63250
00
63250
00
63500
00
63500
00
6375
000
6375
000
Legend
!( Community
¬ Sensitive Receptor
# Facility
RSA
LSA
Topography (masl)
High : 450
Low : 200
I
¬
¬
¬
¬
¬
¬
¬
¬
¬
¬
¬
¬
#
#
#
XY
XY
XY
XY
XY
XY
XY
XY
XY
XY
XY
XY
XY
XY
XY
XY
XY
XY
XY
XY
XY
XY
XY
XY
tu63
Tp 89
Tp 90
R 8W4M
R 9R 10
Maximum 171 µg/m3
100
100
100
100
100
125
100
100
100
100
125
125
150
R9
R8
R7
R6
R5
R4
R3R2
R1
R12R11
R10
P
E
N1
465000
465000
470000
470000
475000
475000
480000
480000
485000
485000
62850
00
62850
00
62
900
00
62
900
00
62950
00
62950
00
63000
00
63000
00
63050
00
63050
00
RegionalStudy
Area
Fort McMurray
Sa
ska
t che
wa
n
Alb
erta
Calgary
Edmonton
�1
�2
Map
Do
cu
me
nt:
(K
:\A
ctive
Pro
jects
200
5\P
roje
cts
05
-05
1 t
o 0
5-1
00\0
5-0
51
Gra
ym
on
t\A
ir Q
ua
lity\F
ig 4
.2 H
ourl
y N
O2
-A
pp
lication
.mxd
) 3/1
7/2
01
2
9.3
Limestone Quarry Mining Project
JDC
JS
Mar 17/12
05D051
0 10 205
Kilometres�1
0 3 61.5
Kilometres�2
Project Area
XY XY XY Hauling Route
Isopleth Contour PROJECT:
DATE:
CHECKED:
DRAWN: FIGURE:
PROJECT:
TITLE:
Predicted 99.9th Percentile 1-hour NO2 Concentrations (µg/m3) - Application
Label Receptor Name Label Source Name Label Source Name
R1 Sunset Salvage A1 Albian Sands Muskeg River Mine S4 Suncor MacKay River Project & Expansion
R2 Easy Span Bridge Rentals A2 Albian Sands Muskeg River Mine Expansion S5 Suncor Base Plant and Millennium
R3 Cabin B Birch Mountain Hammerstone S6 Suncor MD9
R4 Truck Staging Area C CNRL Horizon S7 Suncor Mines
R5 Northlands Forest Products E E-T Energy Poplar Creek In-Situ S8 Suncor Voyageur
R6 TaigaNova Eco-Industrial Park H Husky Sunrise Stage 1-3 S9 Syncrude Aurora North
R7 Wastewater Treatment Plant I Imperial Oil Kearl Lake S10 Syncrude Aurora South
R8 E-T Energy N1 Northland Forest Products S11 Syncrude Mildred Lake Upgrader
R9 Timberlea Residential Area P Parsons Creek Limestone Quarry W Williams Energy Fort McMurray Chemical Plant
R10 North Parsons Residential Area (Plateau) S1 Shell Jackpine Phase 1
R11 Particia McInnes AQ S2 Suncor Dover In-Situ Project
R12 Athabasca Valley AQ S3 Suncor Fort Hills Mining Project

#
#
#
#
#
#
#
#
#
#
#
#
#
#
#
#
#
#
#
#
#
#
#
#
#
#
##
#
#
Saprae Creek
Ath
abasc
a R
iver
!(
!(
Fort McKay
Ft. McMurray
tu63
tu69
Maximum 281 µg/m3
150
100
150
150
150
150
20
0
150
150
200
100
150
100
100
200
100
150
U
T
W
P
I
H
E
C
B
C2
A3
S9
S8
S7
S6
S5
S4
S3
S2
S1
N1
A2
A1
S16S15
S14
S13
S12
S11
S10
450000
450000
475000
475000
500000
500000
62750
00
62750
00
63000
00
63000
00
63250
00
63250
00
63
500
00
63
500
00
63750
00
63750
00
Legend
!( Community
¬ Sensitive Receptor
# Facility
RSA
LSA
Topography (masl)
High : 450
Low : 200
I
¬
¬
¬
¬
¬
¬
¬
¬
¬
¬
¬
¬
#
#
#
XY
XY
XY
XY
XY
XY
XY
XY
XY
XY
XY
XY
XY
XY
XY
XY
XY
XY
XY
XY
XY
XY
XY
XY
tu63
Tp 89
Tp 90
R 8W4M
R 9R 10
Maximum 176 µg/m3
150
125
125125
125
100
100
100
100
100
100
125
R9
R8
R7
R6
R5
R4
R3R2
R1
R12R11
R10
P
E
N1
465000
465000
470000
470000
475000
475000
480000
480000
485000
485000
62850
00
62850
00
62
900
00
62
900
00
62950
00
62950
00
63000
00
63000
00
63050
00
63050
00
RegionalStudy
Area
Fort McMurray
Sa
ska
t che
wa
n
Alb
erta
Calgary
Edmonton
�1
�2
Map
Do
cu
me
nt:
(K
:\A
ctive
Pro
jects
200
5\P
roje
cts
05
-05
1 t
o 0
5-1
00\0
5-0
51
Gra
ym
on
t\A
ir Q
ua
lity\F
ig 4
.3 H
ourl
y N
O2
-P
DC
.mxd
)3/1
7/2
012
9.4
Limestone Quarry Mining Project
JDC
JS
Mar 17/12
05D051
0 10 205
Kilometres�1
0 3 61.5
Kilometres�2 Project Area
XY XY XY Hauling Route
Isopleth Contour
PROJECT:
DATE:
CHECKED:
DRAWN: FIGURE:
PROJECT:
TITLE:
Predicted 99.9th Percentile 1-hour NO2 Concentrations (µg/m3) - PDC
Label Receptor Name Label Source Name Label Source Name Label Source Name
R1 Sunset Salvage A1 Albian Sands Muskeg River Mine S12 Shell Jackpine Expansion S10 Syncrude Aurora South
R2 Easy Span Bridge Rentals A2 Albian Sands Muskeg River Mine Expansion S13 Shell Pierre River Mine S11 Syncrude Mildred Lake Upgrader
R3 Cabin A3 Alberta Oilsands Clearwater Project S2 Suncor Dover In-Situ Project S16 Syncrude Southwest Sand Storage Conversion
R4 Truck Staging Area B Birch Mountain Hammerstone S3 Suncor Fort Hills Mining Project T Total Joslyn North Mine
R5 Northlands Forest Products C1 CNRL Horizon S14 Suncor Lewis SAGD Project U UTS Equinox Oil Sands Mine
R6 TaigaNova Eco-Industrial Park C2 CNRL Horizon In-Situ Project S4 Suncor MacKay River Project & Expansion W Williams Energy Fort McMurray Chemical Plant
R7 Wastewater Treatment Plant E E-T Energy Poplar Creek In-Situ S5 Suncor Base Plant and Millennium
R8 E-T Energy H Husky Sunrise Stage 1-3 S6 Suncor MD9
R9 Timberlea Residential Area I Imperial Oil Kearl Lake S7 Suncor Mines
R10 North Parsons Residential Area (Plateau) N1 Northland Forest Products S8 Suncor Voyageur
R11 Particia McInnes AQ P Parsons Creek Limestone Quarry S15 Suncor Voyageur South
R12 Athabasca Valley AQ S1 Shell Jackpine Phase 1 S9 Syncrude Aurora North

#
#
#
#
#
#
#
#
#
#
#
#
#
#
#
#
#
#
#
#
#
Saprae Creek
Ath
abasc
a R
iver
!(
!(
Fort McKay
Ft. McMurray
tu63
tu69
N2
Maximum 55 µg/m3
20
30
30
30
20
45
30
30
4530
20
30
45
20
20
45
30
30
W
I
H
E
C
B
S9
S8
S7
S6
S5
S4
S3
S2
S1
N1
A2
A1
S11
S10
450000
450000
475000
475000
500000
500000
62750
00
62750
00
63000
00
63000
00
63250
00
63250
00
63
500
00
63
500
00
63750
00
63750
00
Legend
!( Community
¬ Sensitive Receptor
# Facility
RSA
LSA
Topography (masl)
High : 450
Low : 200
I
¬
¬
¬
¬
¬
¬
¬
¬
¬
¬
¬
¬
#
#
#
tu63
Tp 89
Tp 90
R 8W4M
R 9R 10
XY
XY
XY
XY
XY
XY
Maximum 29 µg/m3
20
22
22
20
20
20
22
25
20
22
25
25
22
R9
R8
R7
R6
R5
R4
R3R2
R1
R12R11
R10
E
N2
465000
465000
470000
470000
475000
475000
480000
480000
485000
485000
62850
00
62850
00
62
900
00
62
900
00
62950
00
62950
00
63000
00
63000
00
63050
00
63050
00
RegionalStudy
Area
Fort McMurray
Sa
ska
t che
wa
n
Alb
erta
Calgary
Edmonton
�1
�2
Map
Do
cu
me
nt:
(K
:\A
ctive
Pro
jects
200
5\P
roje
cts
05
-05
1 t
o 0
5-1
00\0
5-0
51
Gra
ym
on
t\A
ir Q
ua
lity\F
ig 4
.1 H
ourl
y N
O2
- B
aselin
e.m
xd
) 3/1
7/2
01
2
9.5
Limestone Quarry Mining Project
JDC
JS
Mar 17/12
05D051
0 10 205
Kilometres�1
0 3 61.5
Kilometres�2
Project Area
XY XY XY Hauling Route
Isopleth ContourPROJECT:
DATE:
CHECKED:
DRAWN: FIGURE:
PROJECT:
TITLE:
Predicted Maximum Annual Average NO2 Concentrations (µg/m3) - Baseline
Label Receptor Name Label Source Name Label Source Name
R1 Sunset Salvage A1 Albian Sands Muskeg River Mine S4 Suncor MacKay River Project & Expansion
R2 Easy Span Bridge Rentals A2 Albian Sands Muskeg River Mine Expansion S5 Suncor Base Plant and Millennium
R3 Cabin B Birch Mountain Hammerstone S6 Suncor MD9
R4 Truck Staging Area C CNRL Horizon S7 Suncor Mines
R5 Northlands Forest Products E E-T Energy Poplar Creek In-Situ S8 Suncor Voyageur
R6 TaigaNova Eco-Industrial Park H Husky Sunrise Stage 1-3 S9 Syncrude Aurora North
R7 Wastewater Treatment Plant I Imperial Oil Kearl Lake S10 Syncrude Aurora South
R8 E-T Energy N1 Northland Forest Products S11 Syncrude Mildred Lake Upgrader
R9 Timberlea Residential Area N2 North Parsons Creek Sand and Gravel Operations W Williams Energy Fort McMurray Chemical Plant
R10 North Parsons Residential Area (Plateau) S1 Shell Jackpine Phase 1
R11 Particia McInnes AQ S2 Suncor Dover In-Situ Project
R12 Athabasca Valley AQ S3 Suncor Fort Hills Mining Project

#
#
#
#
#
#
#
#
#
#
#
#
#
#
#
#
#
#
#
#
#
Saprae Creek
Ath
abasc
a R
iver
!(
!(
Fort McKay
Ft. McMurray
tu63
tu69
Maximum 55 µg/m3
30
30
20
30
30
30
45
20
30
45
45
30
20
30
20
45
30
W
P
I
H
E
C
B
S9
S8
S7
S6
S5
S4
S3
S2
S1
N1
A2
A1
S11
S10
450000
450000
475000
475000
500000
500000
62750
00
62750
00
63000
00
63000
00
63250
00
63250
00
63500
00
63500
00
6375
000
6375
000
Legend
!( Community
¬ Sensitive Receptor
# Facility
RSA
LSA
Topography (masl)
High : 450
Low : 200
I
¬
¬
¬
¬
¬
¬
¬
¬
¬
¬
¬
¬
#
#
#
XY
XY
XY
XY
XY
XY
XY
XY
XY
XY
XY
XY
XY
XY
XY
XY
XY
XY
XY
XY
XY
XY
XY
XY
tu63
Tp 89
Tp 90
R 8W4M
R 9R 10
Maximum 44 µg/m3
22
22
2220
25
20
20
25
22
22
22
20
20
22
25
22
R9
R8
R7
R6
R5
R4
R3R2
R1
R12R11
R10
P
E
N1
465000
465000
470000
470000
475000
475000
480000
480000
485000
485000
62850
00
62850
00
62
900
00
62
900
00
62950
00
62950
00
63000
00
63000
00
63050
00
63050
00
RegionalStudy
Area
Fort McMurray
Sa
ska
t che
wa
n
Alb
erta
Calgary
Edmonton
�1
�2
Map
Do
cu
me
nt:
(K
:\A
ctive
Pro
jects
200
5\P
roje
cts
05
-05
1 t
o 0
5-1
00\0
5-0
51
Gra
ym
on
t\A
ir Q
ua
lity\F
ig 4
.5 A
nn
ual A
ve
rage
NO
2 -
App
lication
.mxd)
3/1
7/2
012
9.6
Limestone Quarry Mining Project
JDC
JS
Mar 17/12
05D051
0 10 205
Kilometres�1
0 3 61.5
Kilometres�2
Project Area
XY XY XY Hauling Route
Isopleth Contour PROJECT:
DATE:
CHECKED:
DRAWN: FIGURE:
PROJECT:
TITLE:
Predicted Maximum Annual Average NO2 Concentrations (µg/m3) - Application
Label Receptor Name Label Source Name Label Source Name
R1 Sunset Salvage A1 Albian Sands Muskeg River Mine S4 Suncor MacKay River Project & Expansion
R2 Easy Span Bridge Rentals A2 Albian Sands Muskeg River Mine Expansion S5 Suncor Base Plant and Millennium
R3 Cabin B Birch Mountain Hammerstone S6 Suncor MD9
R4 Truck Staging Area C CNRL Horizon S7 Suncor Mines
R5 Northlands Forest Products E E-T Energy Poplar Creek In-Situ S8 Suncor Voyageur
R6 TaigaNova Eco-Industrial Park H Husky Sunrise Stage 1-3 S9 Syncrude Aurora North
R7 Wastewater Treatment Plant I Imperial Oil Kearl Lake S10 Syncrude Aurora South
R8 E-T Energy N1 Northland Forest Products S11 Syncrude Mildred Lake Upgrader
R9 Timberlea Residential Area P Parsons Creek Limestone Quarry W Williams Energy Fort McMurray Chemical Plant
R10 North Parsons Residential Area (Plateau) S1 Shell Jackpine Phase 1
R11 Particia McInnes AQ S2 Suncor Dover In-Situ Project
R12 Athabasca Valley AQ S3 Suncor Fort Hills Mining Project

#
#
#
#
#
#
#
#
#
#
#
#
#
#
#
#
#
#
#
#
#
#
#
#
#
#
##
#
#
Saprae Creek
Ath
abasc
a R
iver
!(
!(
Fort McKay
Ft. McMurray
tu63
tu69
Maximum 61 µg/m3
30
25
25
30
30
25
45
25
30
30
25
30
45
45
30
30
30
45
30
25
25
U
T
W
P
I
H
E
C
B
C2
A3
S9
S8
S7
S6
S5
S4
S3
S2
S1
N1
A2
A1
S16 S15
S14
S13
S12
S11
S10
450000
450000
475000
475000
500000
500000
62750
00
62750
00
63000
00
63000
00
63250
00
63250
00
63
500
00
63
500
00
63750
00
63750
00
Legend
!( Community
¬ Sensitive Receptor
# Facility
RSA
LSA
Topography (masl)
High : 450
Low : 200
I
¬
¬
¬
¬
¬
¬
¬
¬
¬
¬
¬
¬
#
#
#
XY
XY
XY
XY
XY
XY
XY
XY
XY
XY
XY
XY
XY
XY
XY
XY
XY
XY
XY
XY
XY
XY
XY
XY
tu63
Tp 89
Tp 90
R 8W4M
R 9R 10
Maximum 45 µg/m3
30
22
22
25
R3
25
25
25
25
25
22
22
22
25
22
25
R9
R8
R7
R6
R5
R4
R2
R1
R12R11
R10
P
E
N1
465000
465000
470000
470000
475000
475000
480000
480000
485000
485000
62850
00
62850
00
62
900
00
62
900
00
62950
00
62950
00
63000
00
63000
00
63050
00
63050
00
RegionalStudy
Area
Fort McMurray
Sa
ska
t che
wa
n
Alb
erta
Calgary
Edmonton
�1
�2
Map
Do
cu
me
nt:
(K
:\A
ctive
Pro
jects
200
5\P
roje
cts
05
-05
1 t
o 0
5-1
00\0
5-0
51
Gra
ym
on
t\A
ir Q
ua
lity\F
ig 4
.6 A
nn
ual A
ve
rage
NO
2 -
PD
C.m
xd)
3/1
7/2
012
9.7
Limestone Quarry Mining Project
JDC
JS
Mar 17/12
05D051
0 10 205
Kilometres�1
0 3 61.5
Kilometres�2 Project Area
XY XY XY Hauling Route
Isopleth Contour
PROJECT:
DATE:
CHECKED:
DRAWN: FIGURE:
PROJECT:
TITLE:
Label Receptor Name Label Source Name Label Source Name Label Source Name
R1 Sunset Salvage A1 Albian Sands Muskeg River Mine S12 Shell Jackpine Expansion S10 Syncrude Aurora South
R2 Easy Span Bridge Rentals A2 Albian Sands Muskeg River Mine Expansion S13 Shell Pierre River Mine S11 Syncrude Mildred Lake Upgrader
R3 Cabin A3 Alberta Oilsands Clearwater Project S2 Suncor Dover In-Situ Project S16 Syncrude Southwest Sand Storage Conversion
R4 Truck Staging Area B Birch Mountain Hammerstone S3 Suncor Fort Hills Mining Project T Total Joslyn North Mine
R5 Northlands Forest Products C1 CNRL Horizon S14 Suncor Lewis SAGD Project U UTS Equinox Oil Sands Mine
R6 TaigaNova Eco-Industrial Park C2 CNRL Horizon In-Situ Project S4 Suncor MacKay River Project & Expansion W Williams Energy Fort McMurray Chemical Plant
R7 Wastewater Treatment Plant E E-T Energy Poplar Creek In-Situ S5 Suncor Base Plant and Millennium
R8 E-T Energy H Husky Sunrise Stage 1-3 S6 Suncor MD9
R9 Timberlea Residential Area I Imperial Oil Kearl Lake S7 Suncor Mines
R10 North Parsons Residential Area (Plateau) N1 Northland Forest Products S8 Suncor Voyageur
R11 Particia McInnes AQ P Parsons Creek Limestone Quarry S15 Suncor Voyageur South
R12 Athabasca Valley AQ S1 Shell Jackpine Phase 1 S9 Syncrude Aurora North
Predicted Maximum Annual Average NO2 Concentrations (µg/m3) - PDC

#
#
#
#
#
#
#
#
#
#
#
#
#
#
#
#
#
#
#
#
#
Saprae Creek
Ath
abasc
a R
iver
!(
!(
Fort McKay
Ft. McMurray
tu63
tu69
N2
Maximum 92 µg/m3
20
30
30
20
30
20
40
40
60
60
40
20
20
30
30
30
30
40
30
30
40
30
20
20
W
I
H
E
C
B
S9
S8
S7
S6
S5
S4
S3
S2
S1
N1
A2
A1
S11
S10
450000
450000
475000
475000
500000
500000
62750
00
62750
00
63000
00
63000
00
63250
00
63250
00
63
500
00
63
500
00
63750
00
63750
00
Legend
!( Community
¬ Sensitive Receptor
# Facility
RSA
LSA
Topography (masl)
High : 450
Low : 200
I
¬
¬
¬
¬
¬
¬
¬
¬
¬
¬
¬
¬
#
#
#
tu63
Tp 89
Tp 90
R 8W4M
R 9R 10
XY
XY
XY
XY
XY
XY
Maximum 39 µg/m3
25
20
25
30
25
25 20
25
20
20
20
20
20
25
25
R9
R8
R7
R6
R5
R4
R3
R2
R1
R12R11
R10
E
N2
N1
465000
465000
470000
470000
475000
475000
480000
480000
485000
485000
62850
00
62850
00
62
900
00
62
900
00
62950
00
62950
00
63000
00
63000
00
63050
00
63050
00
RegionalStudy
Area
Fort McMurray
Sa
ska
t che
wa
n
Alb
erta
Calgary
Edmonton
�1
�2
Map
Do
cu
me
nt:
(K
:\A
ctive
Pro
jects
200
5\P
roje
cts
05
-05
1 t
o 0
5-1
00\0
5-0
51
Gra
ym
on
t\A
ir Q
ua
lity\F
ig 4
.7 2
4-h
ou
r P
M2
5 -
Baseline
.mxd
) 3/1
7/2
01
2
9.8
Limestone Quarry Mining Project
JDC
JS
Mar 17/12
05D051
0 10 205
Kilometres�1
0 3 61.5
Kilometres�2
Project Area
XY XY XY Hauling Route
Isopleth ContourPROJECT:
DATE:
CHECKED:
DRAWN: FIGURE:
PROJECT:
TITLE:
Predicted 2nd Highest 24-hour PM25 Concentrations (µg/m3) - Baseline
Label Receptor Name Label Source Name Label Source Name
R1 Sunset Salvage A1 Albian Sands Muskeg River Mine S4 Suncor MacKay River Project & Expansion
R2 Easy Span Bridge Rentals A2 Albian Sands Muskeg River Mine Expansion S5 Suncor Base Plant and Millennium
R3 Cabin B Birch Mountain Hammerstone S6 Suncor MD9
R4 Truck Staging Area C CNRL Horizon S7 Suncor Mines
R5 Northlands Forest Products E E-T Energy Poplar Creek In-Situ S8 Suncor Voyageur
R6 TaigaNova Eco-Industrial Park H Husky Sunrise Stage 1-3 S9 Syncrude Aurora North
R7 Wastewater Treatment Plant I Imperial Oil Kearl Lake S10 Syncrude Aurora South
R8 E-T Energy N1 Northland Forest Products S11 Syncrude Mildred Lake Upgrader
R9 Timberlea Residential Area N2 North Parsons Creek Sand and Gravel Operations W Williams Energy Fort McMurray Chemical Plant
R10 North Parsons Residential Area (Plateau) S1 Shell Jackpine Phase 1
R11 Particia McInnes AQ S2 Suncor Dover In-Situ Project
R12 Athabasca Valley AQ S3 Suncor Fort Hills Mining Project
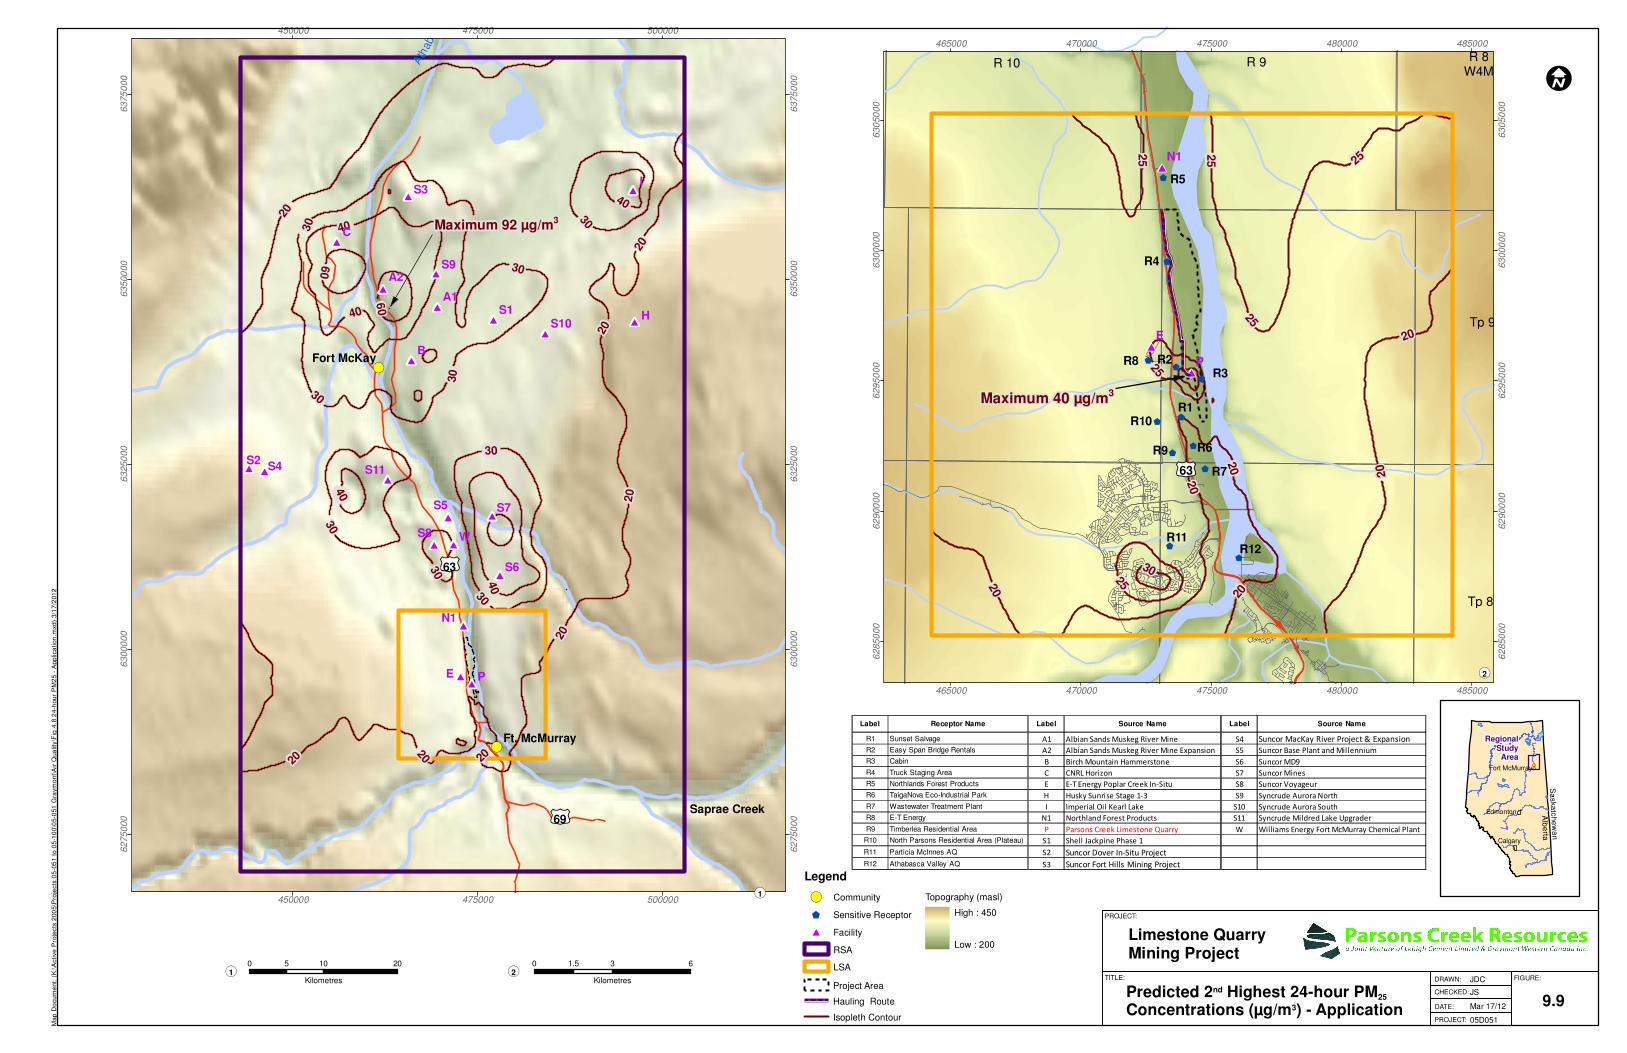
#
#
#
#
#
#
#
#
#
#
#
#
#
#
#
#
#
#
#
#
#
Saprae Creek
Ath
abasc
a R
iver
!(
!(
Fort McKay
Ft. McMurray
tu63
tu69
Maximum 92 µg/m3
30
30
20
30
30
30
60
20
30
40
40
30
20
30
20
60
40
20
20
20
20
30
40
40
W
P
I
H
E
C
B
S9
S8
S7
S6
S5
S4
S3
S2
S1
N1
A2
A1
S11
S10
450000
450000
475000
475000
500000
500000
62750
00
62750
00
63000
00
63000
00
63250
00
63250
00
63500
00
63500
00
6375
000
6375
000
Legend
!( Community
¬ Sensitive Receptor
# Facility
RSA
LSA
Topography (masl)
High : 450
Low : 200
I
¬
¬
¬
¬
¬
¬
¬
¬
¬
¬
¬
¬
#
#
#
XY
XY
XY
XY
XY
XY
XY
XY
XY
XY
XY
XY
XY
XY
XY
XY
XY
XY
XY
XY
XY
XY
XY
XY
tu63
Tp 89
Tp 90
R 8W4M
R 9R 10
Maximum 40 µg/m3
25
20
25
20
30
25
20
20
20
25
25
20
25
R9
R8
R7
R6
R5
R4
R3R2
R1
R12R11
R10
P
E
N1
465000
465000
470000
470000
475000
475000
480000
480000
485000
485000
62850
00
62850
00
62
900
00
62
900
00
62950
00
62950
00
63000
00
63000
00
63050
00
63050
00
RegionalStudy
Area
Fort McMurray
Sa
ska
t che
wa
n
Alb
erta
Calgary
Edmonton
�1
�2
Map
Do
cu
me
nt:
(K
:\A
ctive
Pro
jects
200
5\P
roje
cts
05
-05
1 t
o 0
5-1
00\0
5-0
51
Gra
ym
on
t\A
ir Q
ua
lity\F
ig 4
.8 2
4-h
ou
r P
M2
5 -
App
lica
tion
.mxd
) 3/1
7/2
01
2
9.9
Limestone Quarry Mining Project
JDC
JS
Mar 17/12
05D051
0 10 205
Kilometres�1
0 3 61.5
Kilometres�2
Project Area
XY XY XY Hauling Route
Isopleth Contour PROJECT:
DATE:
CHECKED:
DRAWN: FIGURE:
PROJECT:
TITLE:
Predicted 2nd Highest 24-hour PM25 Concentrations (µg/m3) - Application
Label Receptor Name Label Source Name Label Source Name
R1 Sunset Salvage A1 Albian Sands Muskeg River Mine S4 Suncor MacKay River Project & Expansion
R2 Easy Span Bridge Rentals A2 Albian Sands Muskeg River Mine Expansion S5 Suncor Base Plant and Millennium
R3 Cabin B Birch Mountain Hammerstone S6 Suncor MD9
R4 Truck Staging Area C CNRL Horizon S7 Suncor Mines
R5 Northlands Forest Products E E-T Energy Poplar Creek In-Situ S8 Suncor Voyageur
R6 TaigaNova Eco-Industrial Park H Husky Sunrise Stage 1-3 S9 Syncrude Aurora North
R7 Wastewater Treatment Plant I Imperial Oil Kearl Lake S10 Syncrude Aurora South
R8 E-T Energy N1 Northland Forest Products S11 Syncrude Mildred Lake Upgrader
R9 Timberlea Residential Area P Parsons Creek Limestone Quarry W Williams Energy Fort McMurray Chemical Plant
R10 North Parsons Residential Area (Plateau) S1 Shell Jackpine Phase 1
R11 Particia McInnes AQ S2 Suncor Dover In-Situ Project
R12 Athabasca Valley AQ S3 Suncor Fort Hills Mining Project

#
#
#
#
#
#
#
#
#
#
#
#
#
#
#
#
#
#
#
#
#
#
#
#
#
#
##
#
#
Saprae Creek
Ath
abasc
a R
iver
!(
!(
Fort McKay
Ft. McMurray
tu63
tu69
Maximum 117 µg/m3
30
40
30
30
25
25
25
40
25
30
30
60
40
30
40
30
60
40
30
25
25
25
2525
30
25
30
U
T
W
P
I
H
E
C
B
C2
A3
S9
S8
S7
S6
S5
S4
S3
S2
S1
N1
A2
A1
S16 S15
S14
S13
S12
S11
S10
450000
450000
475000
475000
500000
500000
62750
00
62750
00
63000
00
63000
00
63250
00
63250
00
63
500
00
63
500
00
63750
00
63750
00
Legend
!( Community
¬ Sensitive Receptor
# Facility
RSA
LSA
Topography (masl)
High : 450
Low : 200
I
¬
¬
¬
¬
¬
¬
¬
¬
¬
¬
¬
¬
#
#
#
XY
XY
XY
XY
XY
XY
XY
XY
XY
XY
XY
XY
XY
XY
XY
XY
XY
XY
XY
XY
XY
XY
XY
XY
tu63
Tp 89
Tp 90
R 8W4M
R 9R 10
Maximum 43 µg/m3
30
30
R3
25
30
25
25
25
25
25
25
25
30
30
R9
R8
R7
R6
R5
R4
R2
R1
R12R11
R10
P
E
N1
465000
465000
470000
470000
475000
475000
480000
480000
485000
485000
62850
00
62850
00
62
900
00
62
900
00
62950
00
62950
00
63000
00
63000
00
63050
00
63050
00
RegionalStudy
Area
Fort McMurray
Sa
ska
t che
wa
n
Alb
erta
Calgary
Edmonton
�1
�2
Map
Do
cu
me
nt:
(K
:\A
ctive
Pro
jects
200
5\P
roje
cts
05
-05
1 t
o 0
5-1
00\0
5-0
51
Gra
ym
on
t\A
ir Q
ua
lity\F
ig 4
.9 2
4-h
ou
r P
M2
5 -
PD
C.m
xd
) 3/1
7/2
01
2
9.10
Limestone Quarry Mining Project
JDC
JS
Mar 17/12
05D051
0 10 205
Kilometres�1
0 3 61.5
Kilometres�2 Project Area
XY XY XY Hauling Route
Isopleth Contour
PROJECT:
DATE:
CHECKED:
DRAWN: FIGURE:
PROJECT:
TITLE:
Label Receptor Name Label Source Name Label Source Name Label Source Name
R1 Sunset Salvage A1 Albian Sands Muskeg River Mine S12 Shell Jackpine Expansion S10 Syncrude Aurora South
R2 Easy Span Bridge Rentals A2 Albian Sands Muskeg River Mine Expansion S13 Shell Pierre River Mine S11 Syncrude Mildred Lake Upgrader
R3 Cabin A3 Alberta Oilsands Clearwater Project S2 Suncor Dover In-Situ Project S16 Syncrude Southwest Sand Storage Conversion
R4 Truck Staging Area B Birch Mountain Hammerstone S3 Suncor Fort Hills Mining Project T Total Joslyn North Mine
R5 Northlands Forest Products C1 CNRL Horizon S14 Suncor Lewis SAGD Project U UTS Equinox Oil Sands Mine
R6 TaigaNova Eco-Industrial Park C2 CNRL Horizon In-Situ Project S4 Suncor MacKay River Project & Expansion W Williams Energy Fort McMurray Chemical Plant
R7 Wastewater Treatment Plant E E-T Energy Poplar Creek In-Situ S5 Suncor Base Plant and Millennium
R8 E-T Energy H Husky Sunrise Stage 1-3 S6 Suncor MD9
R9 Timberlea Residential Area I Imperial Oil Kearl Lake S7 Suncor Mines
R10 North Parsons Residential Area (Plateau) N1 Northland Forest Products S8 Suncor Voyageur
R11 Particia McInnes AQ P Parsons Creek Limestone Quarry S15 Suncor Voyageur South
R12 Athabasca Valley AQ S1 Shell Jackpine Phase 1 S9 Syncrude Aurora North
Predicted 2nd Highest 24-hour PM25 Concentrations (µg/m3) - PDC