part 2: color, space, statistical graphicstmm/talks/tecs08/part2.handout.pdfpart 2: color, space,...
TRANSCRIPT
Part 2: Color, Space, Statistical GraphicsInformation Visualization Mini-Course
TECS Week 2008
Tamara Munzner
UBC Computer Science
7 January 2008
1 / 65
Mini-Course OutlineI Part 1: Monday morning
I IntroI Design StudiesI ModelsI Perception and Memory
I Part 2: Monday afternoonI ColorI Space, Layers, and OrderingI Statistical Graphics
I Part 3: Thursday afternoonI Multiples and InteractionI Navigation and ZoomingI Focus+Context
I Part 4: Friday morningI High Dimensional DataI Graphs and TreesI User Studies
2 / 65
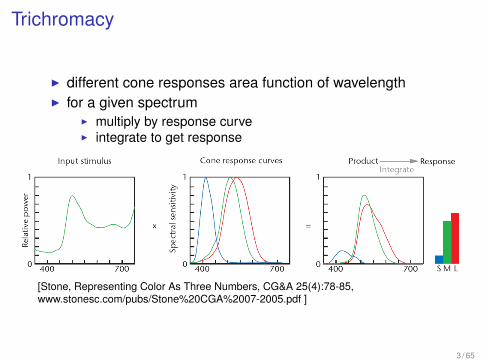
Trichromacy
I different cone responses area function of wavelengthI for a given spectrum
I multiply by response curveI integrate to get response
[Stone, Representing Color As Three Numbers, CG&A 25(4):78-85,www.stonesc.com/pubs/Stone%20CGA%2007-2005.pdf ]
3 / 65
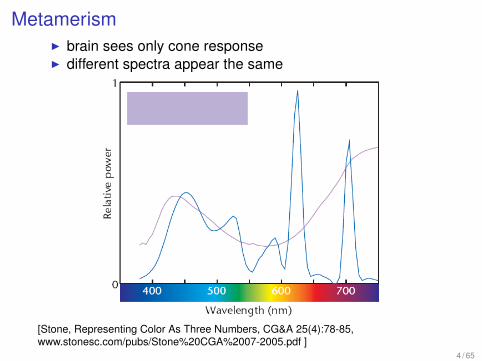
MetamerismI brain sees only cone responseI different spectra appear the same
[Stone, Representing Color As Three Numbers, CG&A 25(4):78-85,www.stonesc.com/pubs/Stone%20CGA%2007-2005.pdf ]
4 / 65

Color ConstancyI relative judgements
[courtesy of John McCann, from Stone 2001 SIGGRAPH course
graphics.stanford.edu/courses/cs448b-02-spring/04cdrom.pdf]5 / 65
Color ConstancyI relative judgements
[courtesy of John McCann, from Stone 2001 SIGGRAPH course
graphics.stanford.edu/courses/cs448b-02-spring/04cdrom.pdf]6 / 65

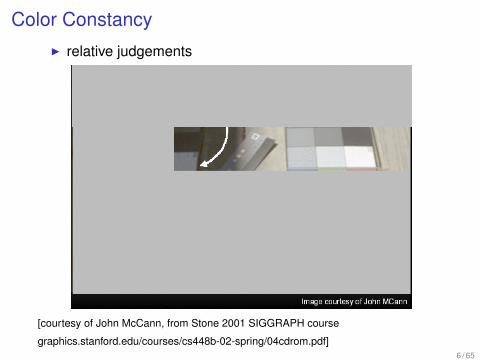
Color Constancy
I relative judgements
[courtesy of John McCann, from Stone 2001 SIGGRAPH coursegraphics.stanford.edu/courses/cs448b-02-spring/04cdrom.pdf]
7 / 65

Color Constancy
I relative judgements
[courtesy of John McCann, from Stone 2001 SIGGRAPH coursegraphics.stanford.edu/courses/cs448b-02-spring/04cdrom.pdf]
8 / 65
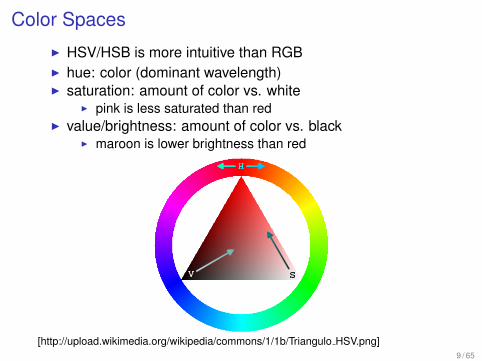
Color Spaces
I HSV/HSB is more intuitive than RGBI hue: color (dominant wavelength)I saturation: amount of color vs. white
I pink is less saturated than redI value/brightness: amount of color vs. black
I maroon is lower brightness than red
[http://upload.wikimedia.org/wikipedia/commons/1/1b/Triangulo HSV.png]9 / 65
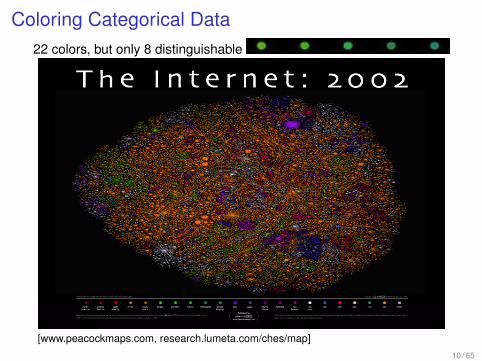
Coloring Categorical Data22 colors, but only 8 distinguishable
[www.peacockmaps.com, research.lumeta.com/ches/map]10 / 65

Coloring Categorical Data
I discrete small patches separated in spaceI limited distinguishability: around 8-14
I channel dynamic range: lowI choose bins explicitly for maximum mileage
I maximally discriminable colors from WareI maximal saturation for small areas
[Colin Ware, Information Visualization: Perception for Design. Morgan Kaufmann 1999.Figure 4.21]
11 / 65

Minimal Saturation For Large AreasI avoid saturated color in large areas
”excessively exuberant”
[Edward Tufte, Envisioning Information, p.82] [Colin Ware, Information Visualization:Perception for Design. Morgan Kaufmann 1999. Figure 4.20]
12 / 65
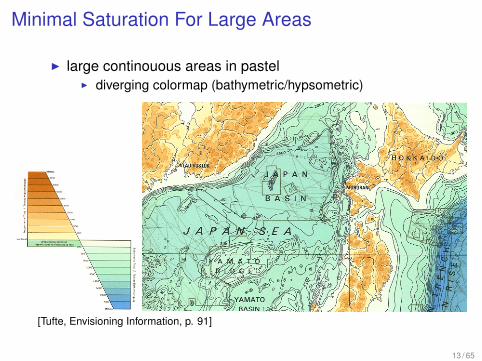
Minimal Saturation For Large Areas
I large continouous areas in pastelI diverging colormap (bathymetric/hypsometric)
[Tufte, Envisioning Information, p. 91]
13 / 65
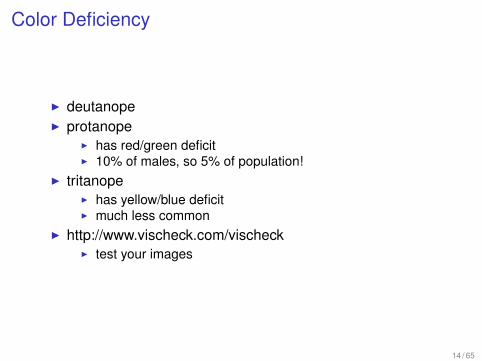
Color Deficiency
I deutanopeI protanope
I has red/green deficitI 10% of males, so 5% of population!
I tritanopeI has yellow/blue deficitI much less common
I http://www.vischeck.com/vischeckI test your images
14 / 65

Color Deficiency Examples: vischeck
original deuteranope protanope tritanope
[www.cs.ubc.ca/∼tmm/courses/cpsc533c-04-spr/a1/dmitry/533a1.html, citing GlobalAssessment of Organic Contaminants in Farmed Salmon, Hites et al, Science 2004303:226-229.]
15 / 65
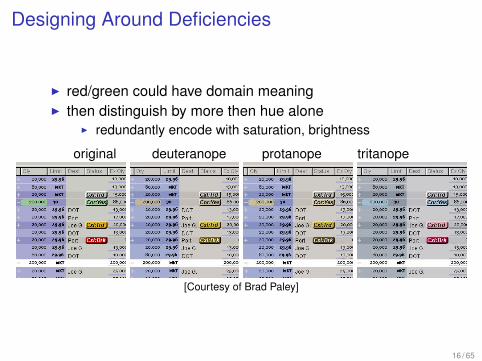
Designing Around Deficiencies
I red/green could have domain meaningI then distinguish by more then hue alone
I redundantly encode with saturation, brightness
original deuteranope protanope tritanope
[Courtesy of Brad Paley]
16 / 65
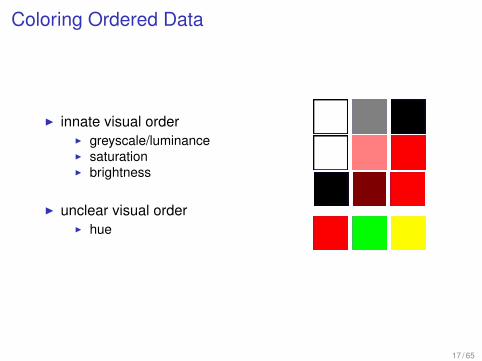
Coloring Ordered Data
I innate visual orderI greyscale/luminanceI saturationI brightness
I unclear visual orderI hue
17 / 65

Choosing Colormaps
I rainbow popular but tricky
[Rogowitz and Treinish, How NOT to Lie with Visualization,www.research.ibm.com/dx/proceedings/pravda/truevis.htm]
18 / 65

Rainbow Colormap Advantages
I low-frequency segmentationI the red part, the orange part, the green part, ...
[Rogowitz and Treinish, Why Should Engineers and Scientists Be Worried AboutColor? http://www.research.ibm.com/people/l/lloydt/color/color.HTM]
19 / 65

Rainbow Colormap Disadvantages
I segmentation artifactsI popular interpolation perceptually nonlinear!
I one solution: create perceptually linear colormapI but lose vibrancy
[Kindlmann, Reinhard, and Creem. Face-based Luminance Matching for PerceptualColormap Generation. Proc. Vis 02 www.cs.utah.edu/∼gk/lumFace]
20 / 65
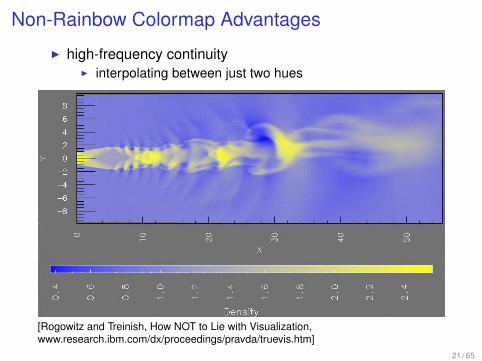
Non-Rainbow Colormap Advantages
I high-frequency continuityI interpolating between just two hues
[Rogowitz and Treinish, How NOT to Lie with Visualization,www.research.ibm.com/dx/proceedings/pravda/truevis.htm]
21 / 65

Segmented RainbowI explicit segmentation safer if need multiple bins
[Tory, Sprague, Wu, So, and Munzner. Spatialization Design: Comparing Points andLandscapes. IEEE TVCG 13(6):1262–1269, (Proc. InfoVis 07), 2007.webhome.cs.uvic.ca/∼mtory/publications/infovis2007.pdf]
22 / 65
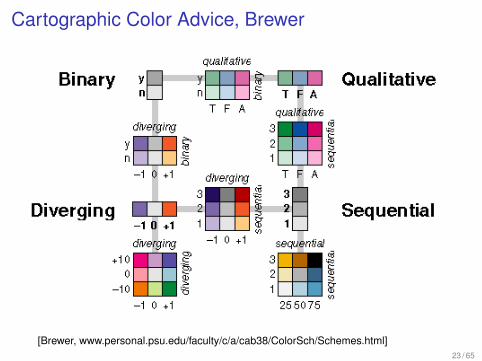
Cartographic Color Advice, Brewer
[Brewer, www.personal.psu.edu/faculty/c/a/cab38/ColorSch/Schemes.html]23 / 65

Color: Readings
Representing Colors as Three Numbers, Maureen Stone, IEEE CG&A25(4):78-85, Jul 2005.http://www.stonesc.com/pubs/Stone%20CGA%2007-2005.pdf
Information Visualization: Perception for Design. Chapter 4: Color. ColinWare. Morgan Kaufmann, 2004 (2nd edition).
Edward Tufte, Envisioning Information. Chapter 5: Color and Information.Graphics Press, 1990.
How Not to Lie with Visualization, Bernice E. Rogowitz and Lloyd A. Treinish,Computers In Physics 10(3) May/June 1996, pp 268-273.http://www.research.ibm.com/dx/proceedings/pravda/truevis.htm
Color Use Guidelines for Mapping and Visualization. Cindy Brewer.http://www.personal.psu.edu/faculty/c/a/cab38/ColorSch/Schemes.html
24 / 65
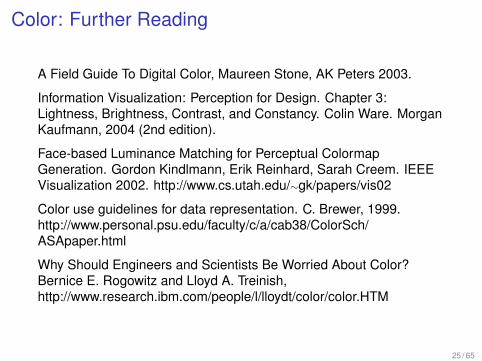
Color: Further Reading
A Field Guide To Digital Color, Maureen Stone, AK Peters 2003.
Information Visualization: Perception for Design. Chapter 3:Lightness, Brightness, Contrast, and Constancy. Colin Ware. MorganKaufmann, 2004 (2nd edition).
Face-based Luminance Matching for Perceptual ColormapGeneration. Gordon Kindlmann, Erik Reinhard, Sarah Creem. IEEEVisualization 2002. http://www.cs.utah.edu/∼gk/papers/vis02
Color use guidelines for data representation. C. Brewer, 1999.http://www.personal.psu.edu/faculty/c/a/cab38/ColorSch/ASApaper.html
Why Should Engineers and Scientists Be Worried About Color?Bernice E. Rogowitz and Lloyd A. Treinish,http://www.research.ibm.com/people/l/lloydt/color/color.HTM
25 / 65
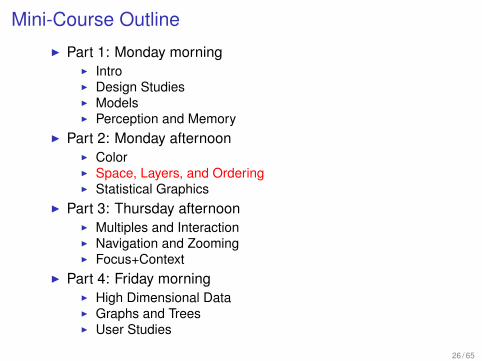
Mini-Course OutlineI Part 1: Monday morning
I IntroI Design StudiesI ModelsI Perception and Memory
I Part 2: Monday afternoonI ColorI Space, Layers, and OrderingI Statistical Graphics
I Part 3: Thursday afternoonI Multiples and InteractionI Navigation and ZoomingI Focus+Context
I Part 4: Friday morningI High Dimensional DataI Graphs and TreesI User Studies
26 / 65
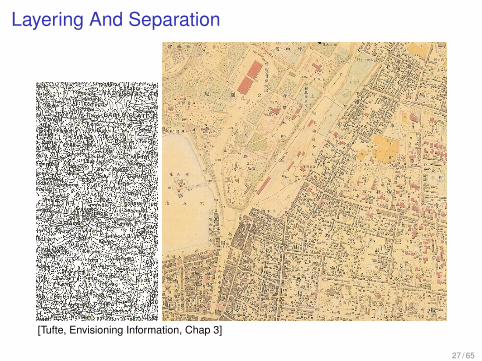
Layering And Separation
[Tufte, Envisioning Information, Chap 3]
27 / 65

Visual Clutter
I subtler background than foreground
[Tufte, Envisioning Information, Chap 3]
28 / 65
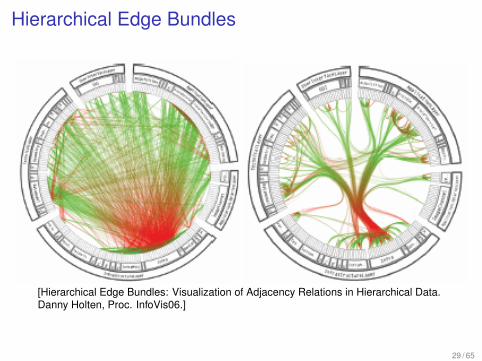
Hierarchical Edge Bundles
[Hierarchical Edge Bundles: Visualization of Adjacency Relations in Hierarchical Data.Danny Holten, Proc. InfoVis06.]
29 / 65
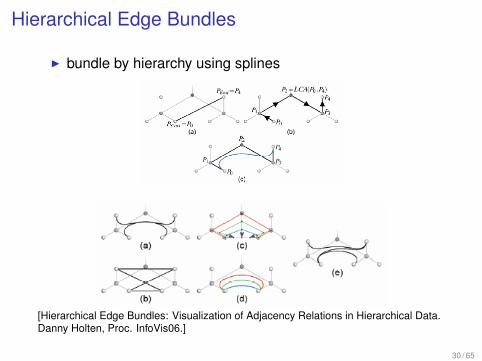
Hierarchical Edge Bundles
I bundle by hierarchy using splines
[Hierarchical Edge Bundles: Visualization of Adjacency Relations in Hierarchical Data.Danny Holten, Proc. InfoVis06.]
30 / 65
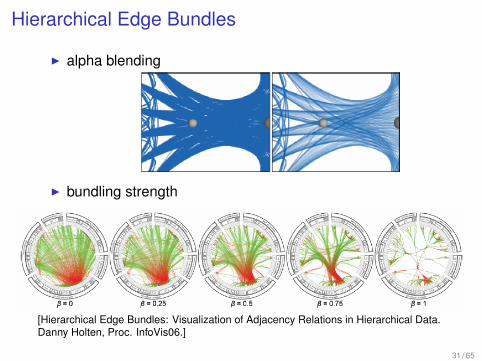
Hierarchical Edge Bundles
I alpha blending
I bundling strength
[Hierarchical Edge Bundles: Visualization of Adjacency Relations in Hierarchical Data.Danny Holten, Proc. InfoVis06.]
31 / 65

Hierarchical Edge Bundling
I (mostly) agnostic to layout
[Hierarchical Edge Bundles: Visualization of Adjacency Relations in Hierarchical Data.Danny Holten, Proc. InfoVis06.]
32 / 65
Critique
I flexible and general ideaI simple - after you see itI successful example of creating foreground layer
33 / 65
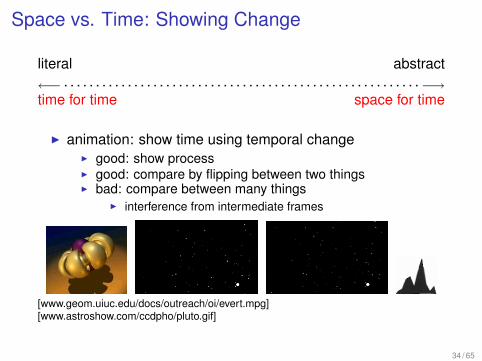
Space vs. Time: Showing Change
literal abstract←− . . . . . . . . . . . . . . . . . . . . . . . . . . . . . . . . . . . . . . . . . . . . . . . . . . . . . . . .−→time for time space for time
I animation: show time using temporal changeI good: show processI good: compare by flipping between two thingsI bad: compare between many things
I interference from intermediate frames
[www.geom.uiuc.edu/docs/outreach/oi/evert.mpg][www.astroshow.com/ccdpho/pluto.gif]
34 / 65
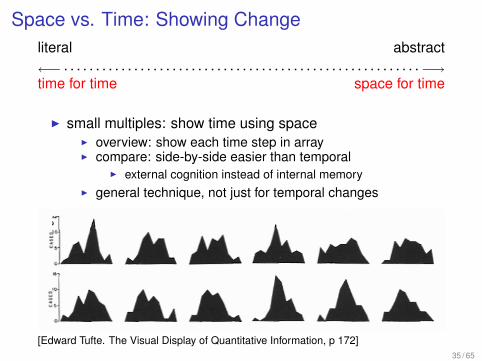
Space vs. Time: Showing Changeliteral abstract←− . . . . . . . . . . . . . . . . . . . . . . . . . . . . . . . . . . . . . . . . . . . . . . . . . . . . . . . .−→time for time space for time
I small multiples: show time using spaceI overview: show each time step in arrayI compare: side-by-side easier than temporal
I external cognition instead of internal memoryI general technique, not just for temporal changes
[Edward Tufte. The Visual Display of Quantitative Information, p 172]35 / 65
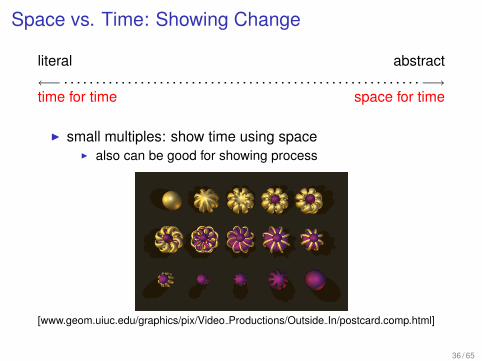
Space vs. Time: Showing Change
literal abstract←− . . . . . . . . . . . . . . . . . . . . . . . . . . . . . . . . . . . . . . . . . . . . . . . . . . . . . . . .−→time for time space for time
I small multiples: show time using spaceI also can be good for showing process
[www.geom.uiuc.edu/graphics/pix/Video Productions/Outside In/postcard.comp.html]
36 / 65

Animation vs. Small Multiples
I Tversky argument: intuition that animation helps is wrongI meta-review of previous studiesI often more info shown in animation view so not a fair
comparison
I carefully chosen segmentation into small multiples betterthan animation if equivalent information shown
[Animation: Can It Facilitate? Barbara Tversky, Julie Morrison,Mireille Betrancourt. International Journal of Human ComputerStudies 57:4, pp 247-262, 2002.]
37 / 65
Sorting and Ordering
I derived spaces for orderingI spatial position as strongest perceptual cueI finding the right order
I automaticallyI through exploration
38 / 65
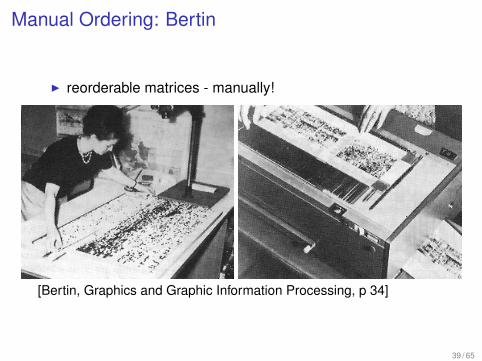
Manual Ordering: Bertin
I reorderable matrices - manually!
[Bertin, Graphics and Graphic Information Processing, p 34]
39 / 65
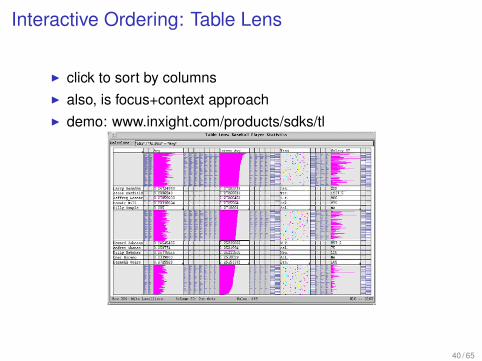
Interactive Ordering: Table Lens
I click to sort by columnsI also, is focus+context approachI demo: www.inxight.com/products/sdks/tl
40 / 65

Interactive Ordering: Rivet
I performance analysis of parallel systemI order: machine name vs. lock acquisition time
overview zoom reorder
[Bosch, Performance Analysis and Visualization of Parallel Systems UsingSimOS and Rivet: A Case Study, HPCA6, 2000.graphics.stanford.edu/papers/rivet argus]
41 / 65
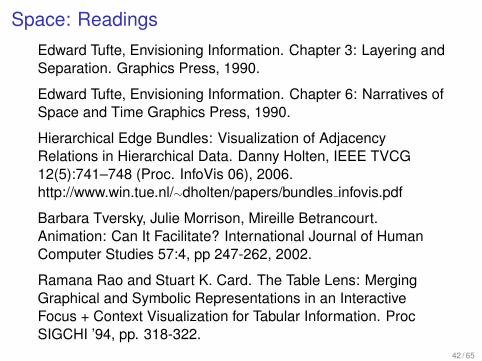
Space: ReadingsEdward Tufte, Envisioning Information. Chapter 3: Layering andSeparation. Graphics Press, 1990.
Edward Tufte, Envisioning Information. Chapter 6: Narratives ofSpace and Time Graphics Press, 1990.
Hierarchical Edge Bundles: Visualization of AdjacencyRelations in Hierarchical Data. Danny Holten, IEEE TVCG12(5):741–748 (Proc. InfoVis 06), 2006.http://www.win.tue.nl/∼dholten/papers/bundles infovis.pdf
Barbara Tversky, Julie Morrison, Mireille Betrancourt.Animation: Can It Facilitate? International Journal of HumanComputer Studies 57:4, pp 247-262, 2002.
Ramana Rao and Stuart K. Card. The Table Lens: MergingGraphical and Symbolic Representations in an InteractiveFocus + Context Visualization for Tabular Information. ProcSIGCHI ’94, pp. 318-322.
42 / 65
Mini-Course OutlineI Part 1: Monday morning
I IntroI Design StudiesI ModelsI Perception and Memory
I Part 2: Monday afternoonI ColorI Space, Layers, and OrderingI Statistical Graphics
I Part 3: Thursday afternoonI Multiples and InteractionI Navigation and ZoomingI Focus+Context
I Part 4: Friday morningI High Dimensional DataI Graphs and TreesI User Studies
43 / 65
Statistical Graphics
I long history for paper-based views of dataI springboard for infovis
I interacting with scatterplotsI interactive dynamic queriesI matrix of scatterplots, level of indirectionI linked views
I improving line charts
44 / 65

Scatterplots
I encode two input variables with spatial position
I show positive/negative/no correllation between variables
[http://upload.wikimedia.org/wikipedia/commons/0/0f/Oldfaithful3.png]
45 / 65
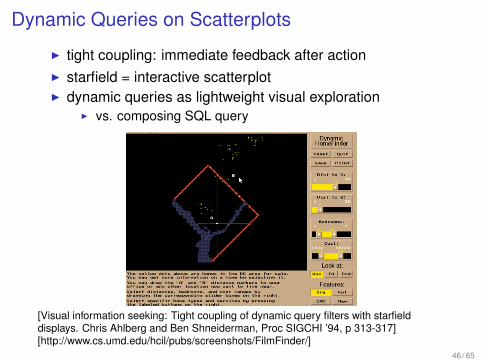
Dynamic Queries on Scatterplots
I tight coupling: immediate feedback after actionI starfield = interactive scatterplotI dynamic queries as lightweight visual exploration
I vs. composing SQL query
[Visual information seeking: Tight coupling of dynamic query filters with starfielddisplays. Chris Ahlberg and Ben Shneiderman, Proc SIGCHI ’94, p 313-317][http://www.cs.umd.edu/hcil/pubs/screenshots/FilmFinder/]
46 / 65
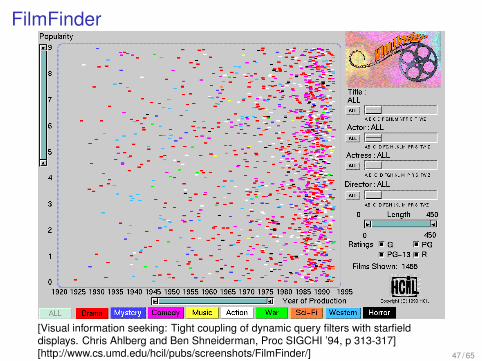
FilmFinder
[Visual information seeking: Tight coupling of dynamic query filters with starfielddisplays. Chris Ahlberg and Ben Shneiderman, Proc SIGCHI ’94, p 313-317][http://www.cs.umd.edu/hcil/pubs/screenshots/FilmFinder/] 47 / 65
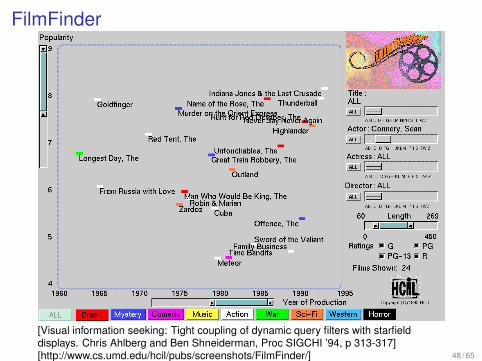
FilmFinder
[Visual information seeking: Tight coupling of dynamic query filters with starfielddisplays. Chris Ahlberg and Ben Shneiderman, Proc SIGCHI ’94, p 313-317][http://www.cs.umd.edu/hcil/pubs/screenshots/FilmFinder/] 48 / 65
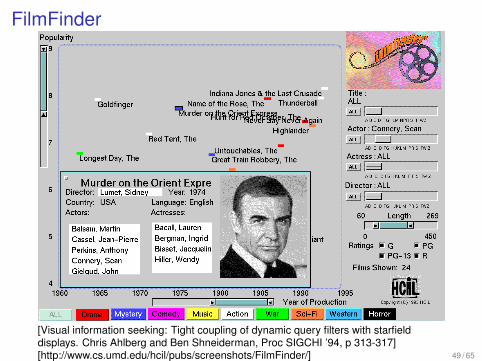
FilmFinder
[Visual information seeking: Tight coupling of dynamic query filters with starfielddisplays. Chris Ahlberg and Ben Shneiderman, Proc SIGCHI ’94, p 313-317][http://www.cs.umd.edu/hcil/pubs/screenshots/FilmFinder/] 49 / 65
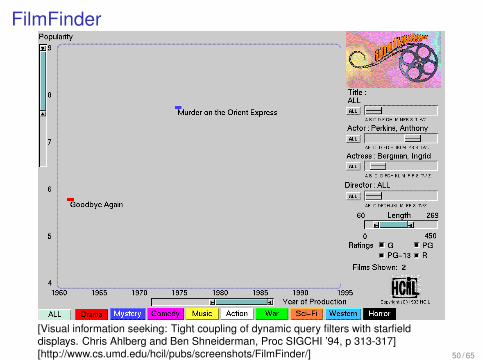
FilmFinder
[Visual information seeking: Tight coupling of dynamic query filters with starfielddisplays. Chris Ahlberg and Ben Shneiderman, Proc SIGCHI ’94, p 313-317][http://www.cs.umd.edu/hcil/pubs/screenshots/FilmFinder/] 50 / 65
Critique
I clear successesI fast, lightweight visual queriesI details on demandI easy to use for novices
I more arguable: alphaslidersI other techniques: data vis sliders, fisheye menus,
speed-dependent automatic zooming
51 / 65

SPLOM: Scatterplot Matrix
I show all pairwise variable combos side by side
I matrix size grows quadratically with variable count
[Graph-Theoretic Scagnostics. Wilkinson, Anand, and Grossman. Proc InfoVis 05.]
52 / 65
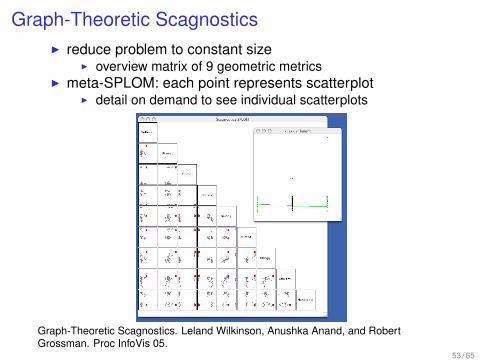
Graph-Theoretic ScagnosticsI reduce problem to constant size
I overview matrix of 9 geometric metricsI meta-SPLOM: each point represents scatterplot
I detail on demand to see individual scatterplots
Graph-Theoretic Scagnostics. Leland Wilkinson, Anushka Anand, and RobertGrossman. Proc InfoVis 05.
53 / 65

Measuring Scatterplots
I aspects and measuresI outliers: outlyingI shape: convex, skinny, stringy, straight
I computed with convex hull, alpha hull, min span tree
I trend: monotonicI density: skewed, clumpyI coherence: striated
[Graph-Theoretic Scagnostics. Wilkinson, Anand, and Grossman. Proc InfoVis 05.]
54 / 65
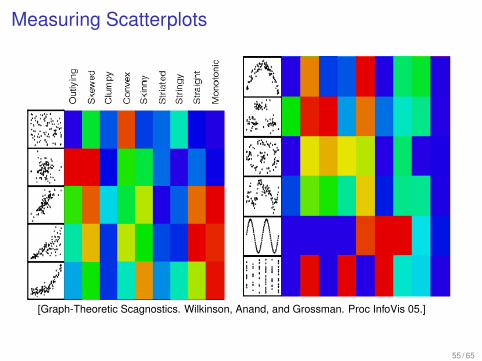
Measuring Scatterplots
[Graph-Theoretic Scagnostics. Wilkinson, Anand, and Grossman. Proc InfoVis 05.]
55 / 65
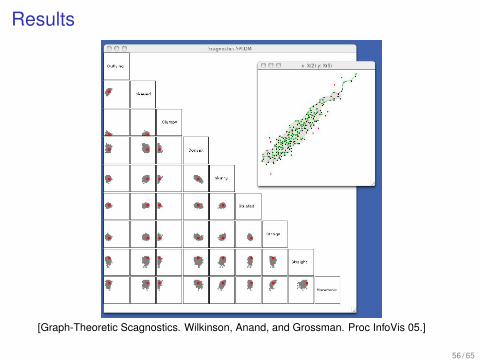
Results
[Graph-Theoretic Scagnostics. Wilkinson, Anand, and Grossman. Proc InfoVis 05.]
56 / 65

Results
[Graph-Theoretic Scagnostics. Wilkinson, Anand, and Grossman. Proc InfoVis 05.]
57 / 65
Critique
I very powerful and elegant methodI curse of dimensionality is hard problem
I abstraction level clearly appropriate for experts
58 / 65
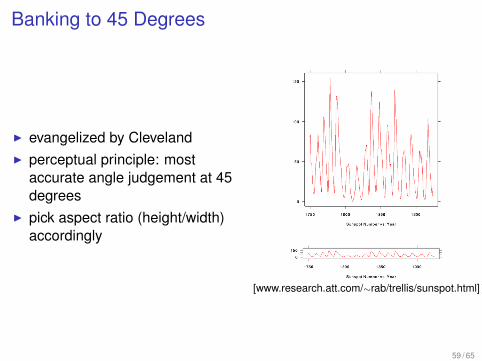
Banking to 45 Degrees
I evangelized by ClevelandI perceptual principle: most
accurate angle judgement at 45degrees
I pick aspect ratio (height/width)accordingly
[www.research.att.com/∼rab/trellis/sunspot.html]
59 / 65
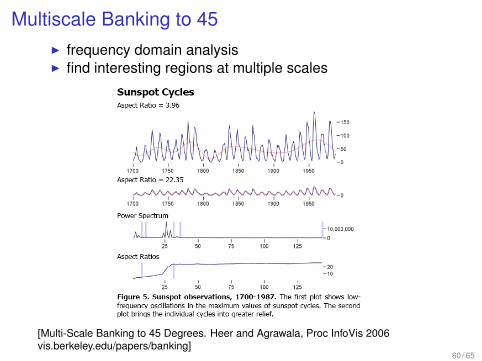
Multiscale Banking to 45I frequency domain analysisI find interesting regions at multiple scales
[Multi-Scale Banking to 45 Degrees. Heer and Agrawala, Proc InfoVis 2006vis.berkeley.edu/papers/banking]
60 / 65
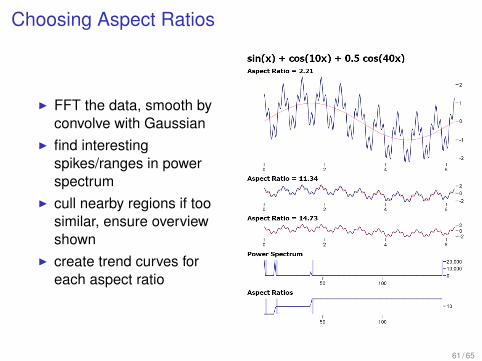
Choosing Aspect Ratios
I FFT the data, smooth byconvolve with Gaussian
I find interestingspikes/ranges in powerspectrum
I cull nearby regions if toosimilar, ensure overviewshown
I create trend curves foreach aspect ratio
61 / 65

Multiscale Banking to 45
[Multi-Scale Banking to 45 Degrees. Heer and Agrawala, Proc InfoVis 2006vis.berkeley.edu/papers/banking]
62 / 65
Critique
I very nice generalization of old ideaI does not require interactivity to reap benefits
63 / 65
Statistical Graphics: Readings
Visual information seeking: Tight coupling of dynamic query filterswith starfield displays. Chris Ahlberg and Ben Shneiderman, ProcSIGCHI ’94, pages 313-317
Graph-Theoretic Scagnostics. Leland Wilkinson, Anushka Anand,and Robert Grossman. Proc InfoVis 05
Multi-Scale Banking to 45 Degrees. Jeffrey Heer, Maneesh Agrawala.IEEE TVCG 12(5) (Proc. InfoVis 2006), Sep/Oct 2006, pages701-708.
64 / 65
SG: Further Readings
Metric-Based Network Exploration and Multiscale Scatterplot. YvesChiricota, Fabien Jourdan, Guy Melancon. Proc. InfoVis 04, pages135-142.
The Visual Design and Control of Trellis Display. R. A. Becker, W. S.Cleveland, and M. J. Shyu Journal of Computational and StatisticalGraphics, 5:123-155. (1996).
The Elements of Graphing Data. William S. Cleveland. Hobart Press1994.
65 / 65