part 3 real world applications: sumtime-mousam. dept. of computing science, university of aberdeen2...
TRANSCRIPT

Part 3Real World Applications:
SumTime-Mousam
Dept. of Computing Science, University of Aberdeen 2
In this lecture you learn
• SumTime-Mousam – Knowledge acquisition– Design
• Document planning• Microplanning• realization
– Evaluation• Post-edit• End-user
Dept. of Computing Science, University of Aberdeen 3
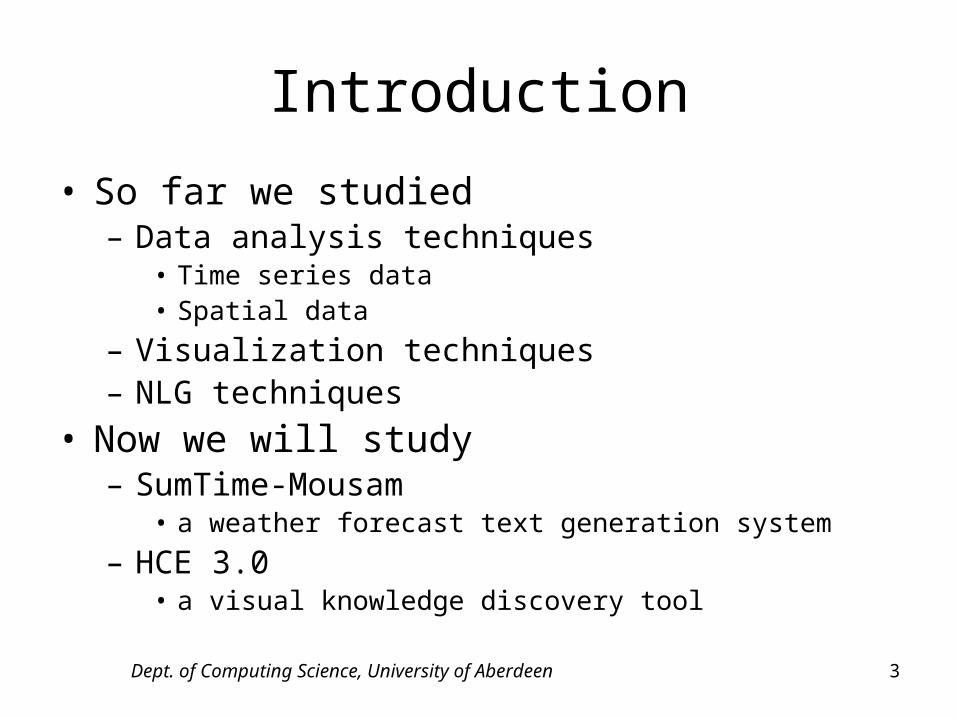
Introduction
• So far we studied– Data analysis techniques
• Time series data• Spatial data
– Visualization techniques– NLG techniques
• Now we will study– SumTime-Mousam
• a weather forecast text generation system
– HCE 3.0• a visual knowledge discovery tool
Dept. of Computing Science, University of Aberdeen 4
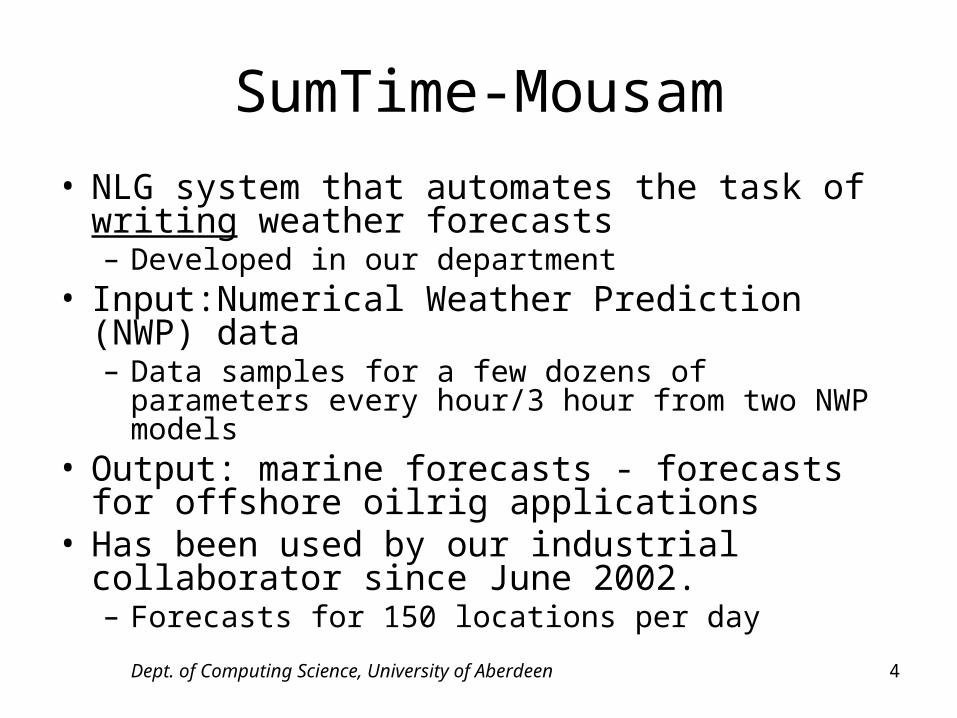
SumTime-Mousam
• NLG system that automates the task of writing weather forecasts– Developed in our department
• Input:Numerical Weather Prediction (NWP) data– Data samples for a few dozens of parameters
every hour/3 hour from two NWP models• Output: marine forecasts - forecasts for
offshore oilrig applications• Has been used by our industrial
collaborator since June 2002.– Forecasts for 150 locations per day
Dept. of Computing Science, University of Aberdeen 5
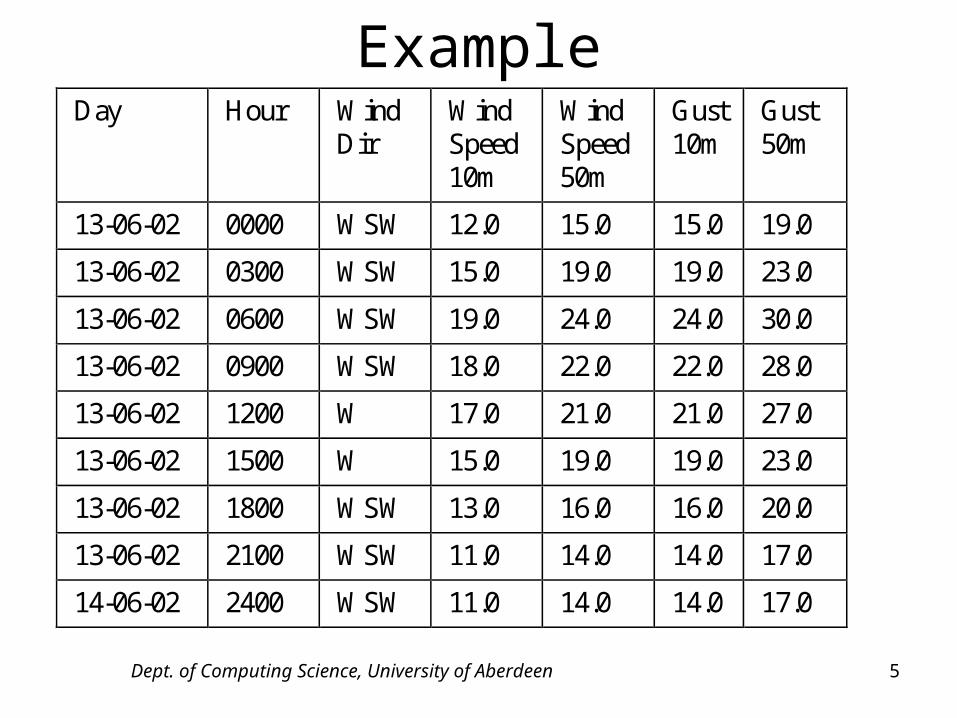
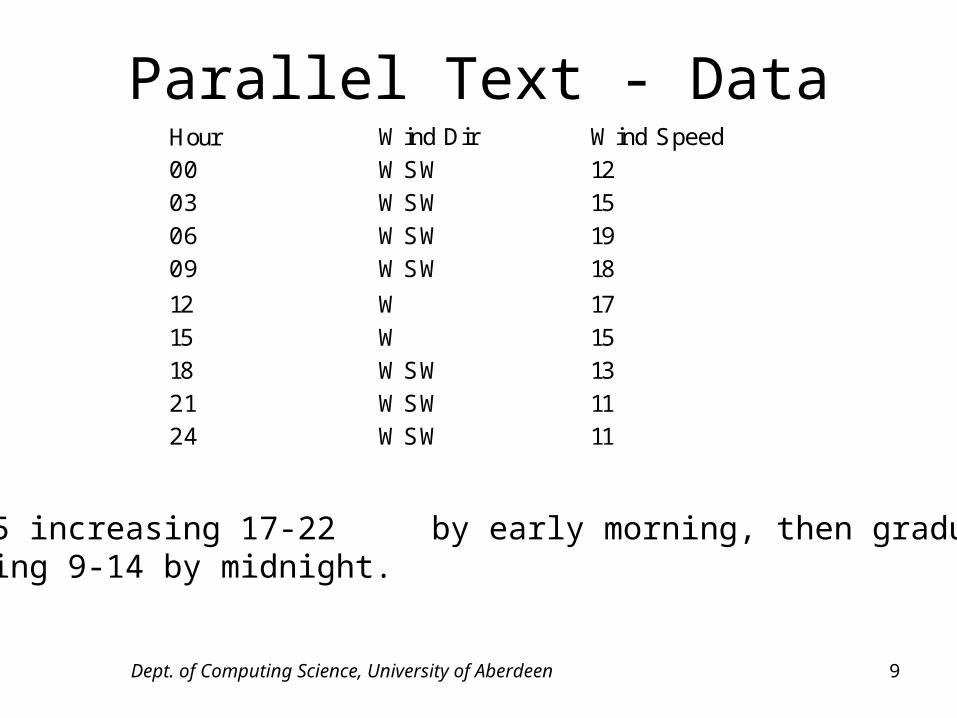
ExampleDay Hour Wind
DirWindSpeed10m
WindSpeed50m
Gust10m
Gust50m
13-06-02 0000 WSW 12.0 15.0 15.0 19.0
13-06-02 0300 WSW 15.0 19.0 19.0 23.0
13-06-02 0600 WSW 19.0 24.0 24.0 30.0
13-06-02 0900 WSW 18.0 22.0 22.0 28.0
13-06-02 1200 W 17.0 21.0 21.0 27.0
13-06-02 1500 W 15.0 19.0 19.0 23.0
13-06-02 1800 WSW 13.0 16.0 16.0 20.0
13-06-02 2100 WSW 11.0 14.0 14.0 17.0
14-06-02 2400 WSW 11.0 14.0 14.0 17.0
Dept. of Computing Science, University of Aberdeen 6
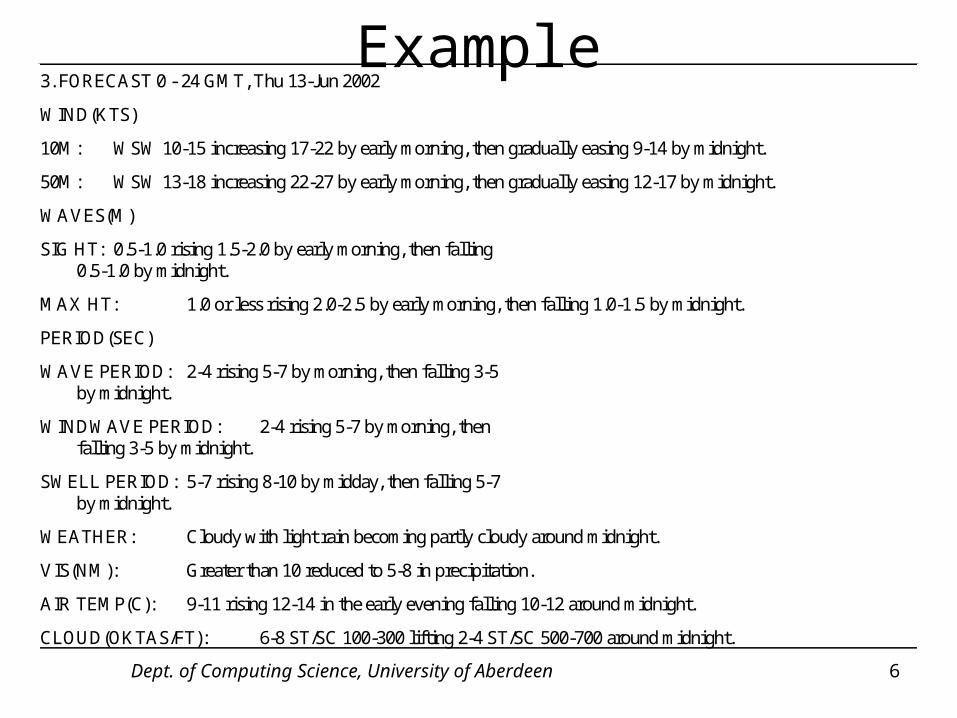
3. FORECAST 0 - 24 GMT, Thu 13-Jun 2002
WIND(KTS)
10M: WSW 10-15 increasing 17-22 by early morning, then gradually easing 9-14 by midnight.
50M: WSW 13-18 increasing 22-27 by early morning, then gradually easing 12-17 by midnight.
WAVES(M)
SIG HT: 0.5-1.0 rising 1.5-2.0 by early morning, then falling0.5-1.0 by midnight.
MAX HT: 1.0 or less rising 2.0-2.5 by early morning, then falling 1.0-1.5 by midnight.
PERIOD(SEC)
WAVE PERIOD: 2-4 rising 5-7 by morning, then falling 3-5by midnight.
WINDWAVE PERIOD: 2-4 rising 5-7 by morning, thenfalling 3-5 by midnight.
SWELL PERIOD: 5-7 rising 8-10 by midday, then falling 5-7by midnight.
WEATHER: Cloudy with light rain becoming partly cloudy around midnight.
VIS(NM): Greater than 10 reduced to 5-8 in precipitation.
AIR TEMP(C): 9-11 rising 12-14 in the early evening falling 10-12 around midnight.
CLOUD(OKTAS/FT): 6-8 ST/SC 100-300 lifting 2-4 ST/SC 500-700 around midnight.
Example
Dept. of Computing Science, University of Aberdeen 7
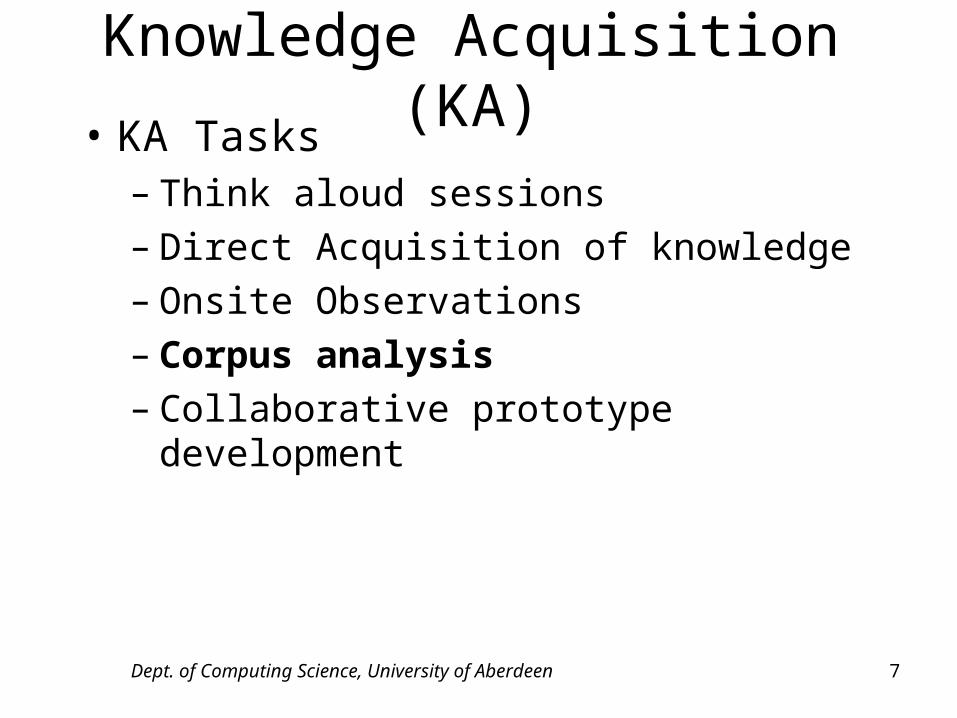
Knowledge Acquisition (KA)• KA Tasks
– Think aloud sessions– Direct Acquisition of knowledge– Onsite Observations– Corpus analysis– Collaborative prototype development
Dept. of Computing Science, University of Aberdeen 8
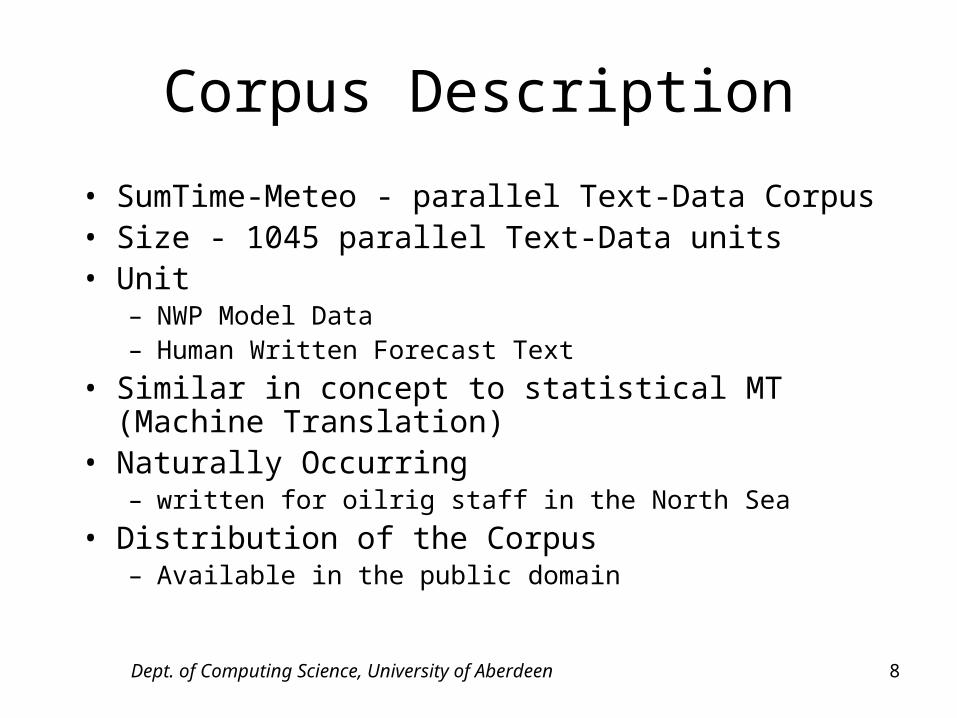
Corpus Description
• SumTime-Meteo - parallel Text-Data Corpus• Size - 1045 parallel Text-Data units• Unit
– NWP Model Data– Human Written Forecast Text
• Similar in concept to statistical MT (Machine Translation)
• Naturally Occurring– written for oilrig staff in the North Sea
• Distribution of the Corpus– Available in the public domain
Dept. of Computing Science, University of Aberdeen 9
Parallel Text - DataHour Wind Dir Wind Speed00 WSW 1203 WSW 1506 WSW 1909 WSW 18
12 W 1715 W 1518 WSW 1321 WSW 1124 WSW 11
WSW 10-15 increasing 17-22 by early morning, then gradually easing 9-14 by midnight.

Dept. of Computing Science, University of Aberdeen 10
Corpus Analyses
• Meanings of Time phrases– Meanings of time phrases in terms of
numerical data– required for lexical choice in
summarization
• No standard time phrase mappings exist
• Numerical time values not mentioned in forecasts
Dept. of Computing Science, University of Aberdeen 11
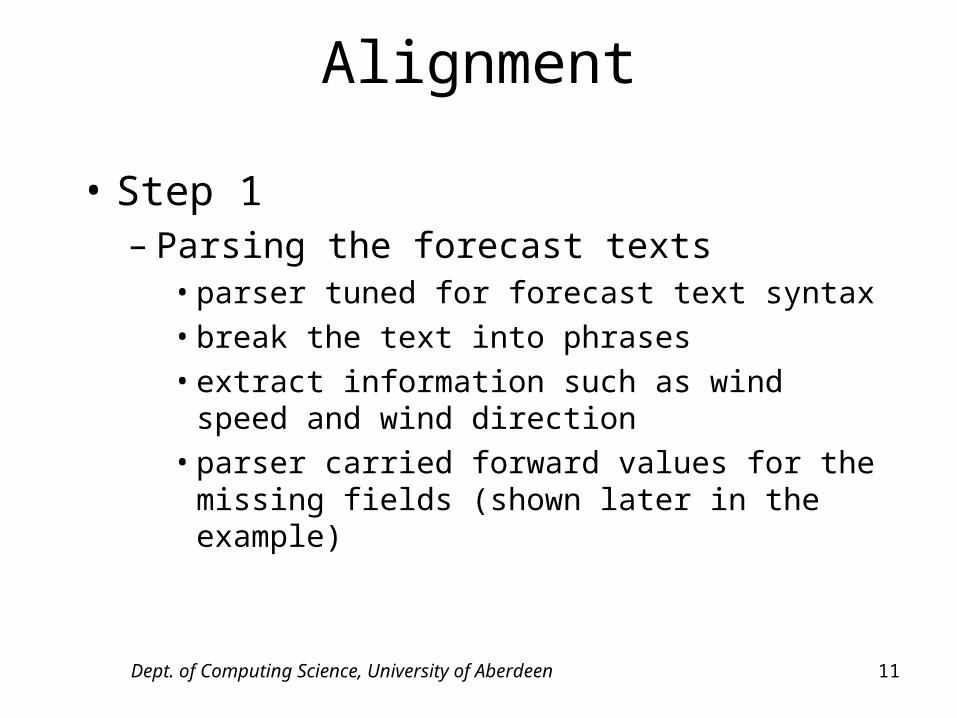
Alignment
• Step 1– Parsing the forecast texts
• parser tuned for forecast text syntax• break the text into phrases• extract information such as wind speed
and wind direction• parser carried forward values for the
missing fields (shown later in the example)

Dept. of Computing Science, University of Aberdeen 12
Example
InformationSr.No.
PhrasesSpeed Direction Time Phrase Change Verb
1 SSW 12-16 12-16 SSW None None2 BACKING ESE 16-20
IN THE MORNING,16-20 ESE IN THE
MORNINGBACKING
3 BACKING NE EARLYAFTERNOON
16-20 NE EARLYAFTERNOON
BACKING
4 THEN NNW 24-28LATE EVENING
24-28 NNW LATEEVENING
BACKING
SSW 12-16 BACKING ESE 16-20 IN THE MORNING, BACKING NE EARLY AFTERNOON THEN NNW 24-28 LATE EVENING
Dept. of Computing Science, University of Aberdeen 13
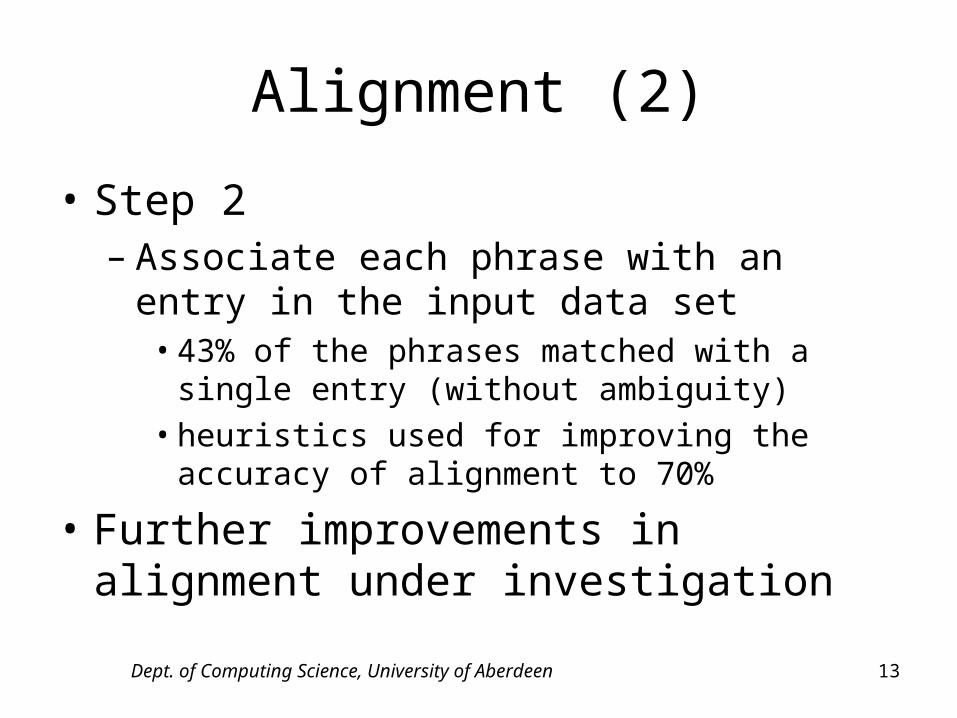
Alignment (2)
• Step 2– Associate each phrase with an entry in
the input data set• 43% of the phrases matched with a single
entry (without ambiguity)• heuristics used for improving the accuracy
of alignment to 70%
• Further improvements in alignment under investigation
Dept. of Computing Science, University of Aberdeen 14
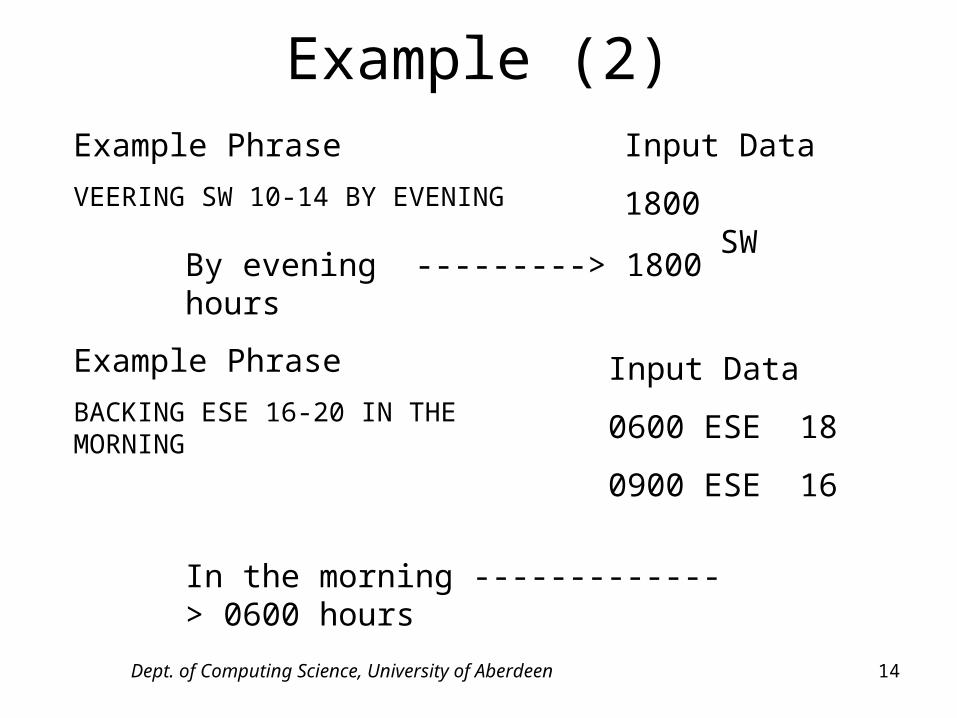
Example (2)Example Phrase
VEERING SW 10-14 BY EVENING
Input Data
1800 SW
By evening ---------> 1800 hours
Example Phrase
BACKING ESE 16-20 IN THE MORNING
Input Data
0600 ESE 18
0900 ESE 16
In the morning -------------> 0600 hours
Dept. of Computing Science, University of Aberdeen 15
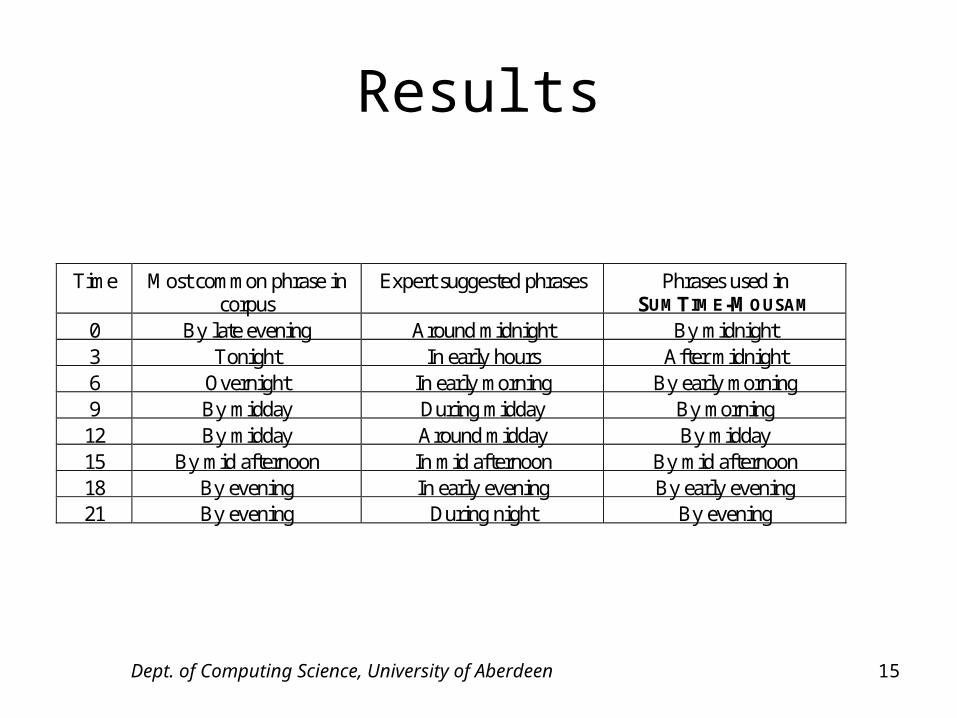
Results
Time Most common phrase incorpus
Expert suggested phrases Phrases used inSUMTIME-MOUSAM
0 By late evening Around midnight By midnight3 Tonight In early hours After midnight6 Overnight In early morning By early morning9 By midday During midday By morning12 By midday Around midday By midday15 By mid afternoon In mid afternoon By mid afternoon18 By evening In early evening By early evening21 By evening During night By evening
Dept. of Computing Science, University of Aberdeen 16
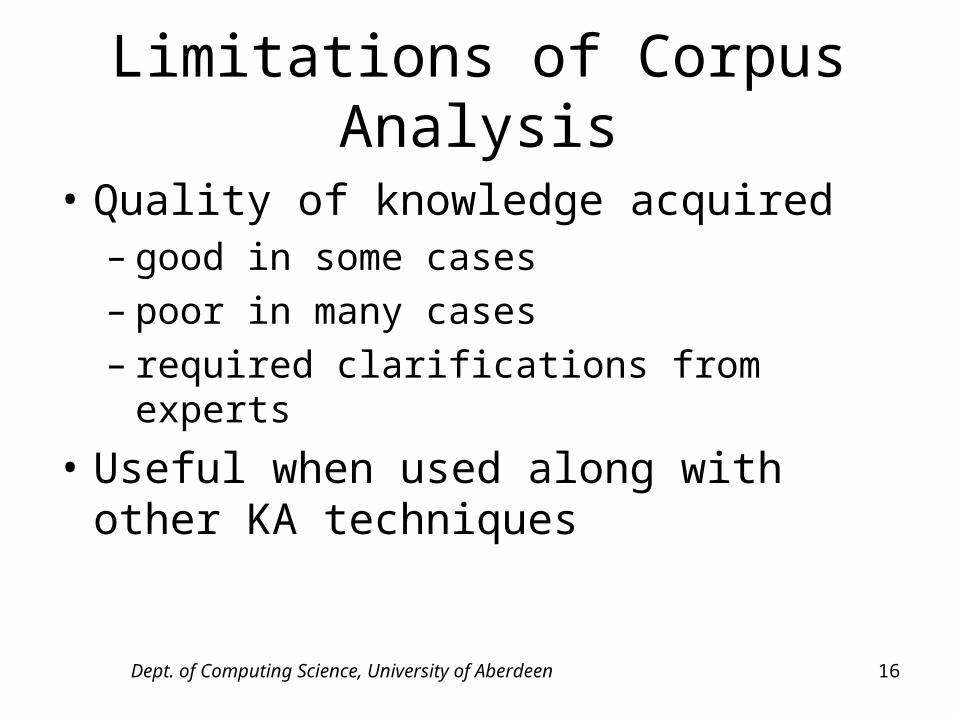
Limitations of Corpus Analysis
• Quality of knowledge acquired– good in some cases– poor in many cases– required clarifications from experts
• Useful when used along with other KA techniques
Dept. of Computing Science, University of Aberdeen 17
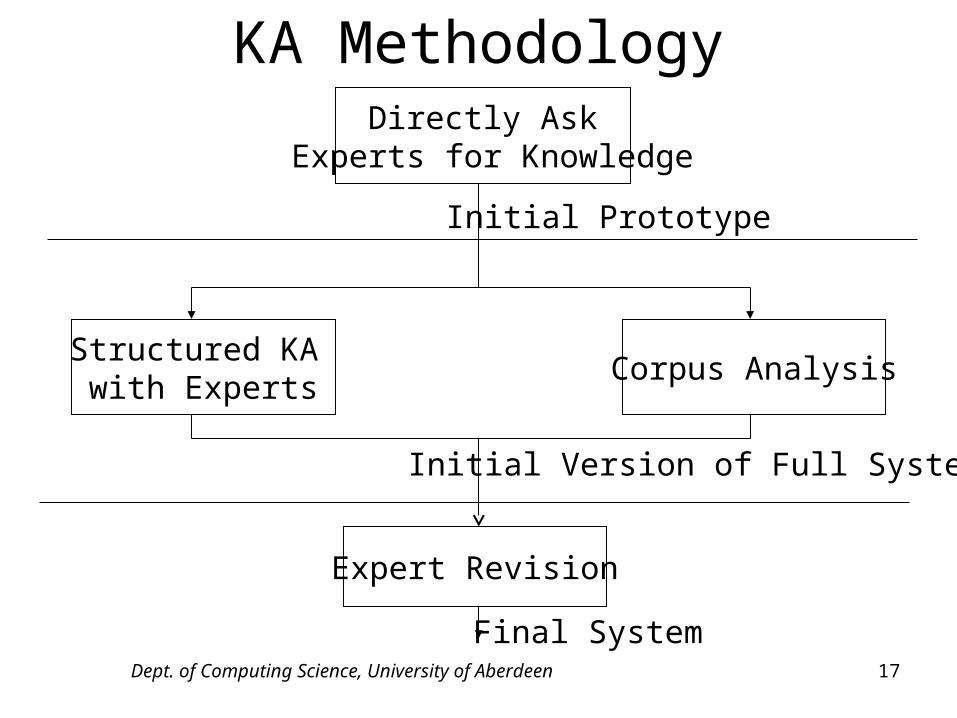
KA MethodologyDirectly Ask
Experts for Knowledge
Structured KA with Experts
Corpus Analysis
Expert Revision
Initial Prototype
Initial Version of Full System
Final System
Dept. of Computing Science, University of Aberdeen 18
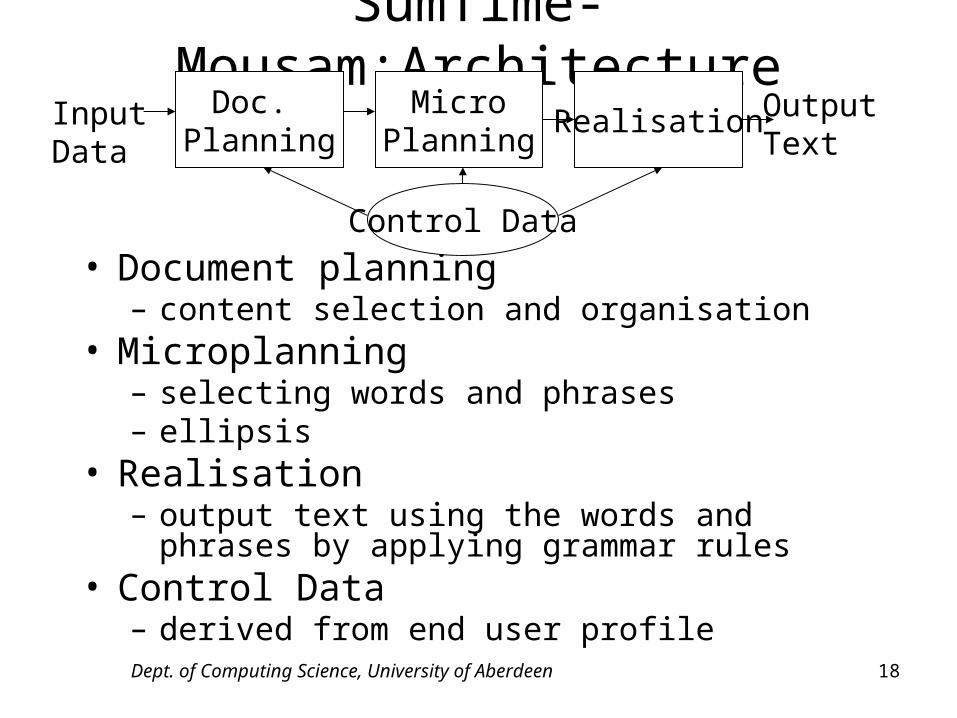
SumTime-Mousam:Architecture
• Document planning – content selection and organisation
• Microplanning– selecting words and phrases– ellipsis
• Realisation– output text using the words and phrases by
applying grammar rules• Control Data
– derived from end user profile
Doc. Planning
MicroPlanning
RealisationInputData
OutputText
Control Data
Dept. of Computing Science, University of Aberdeen 19
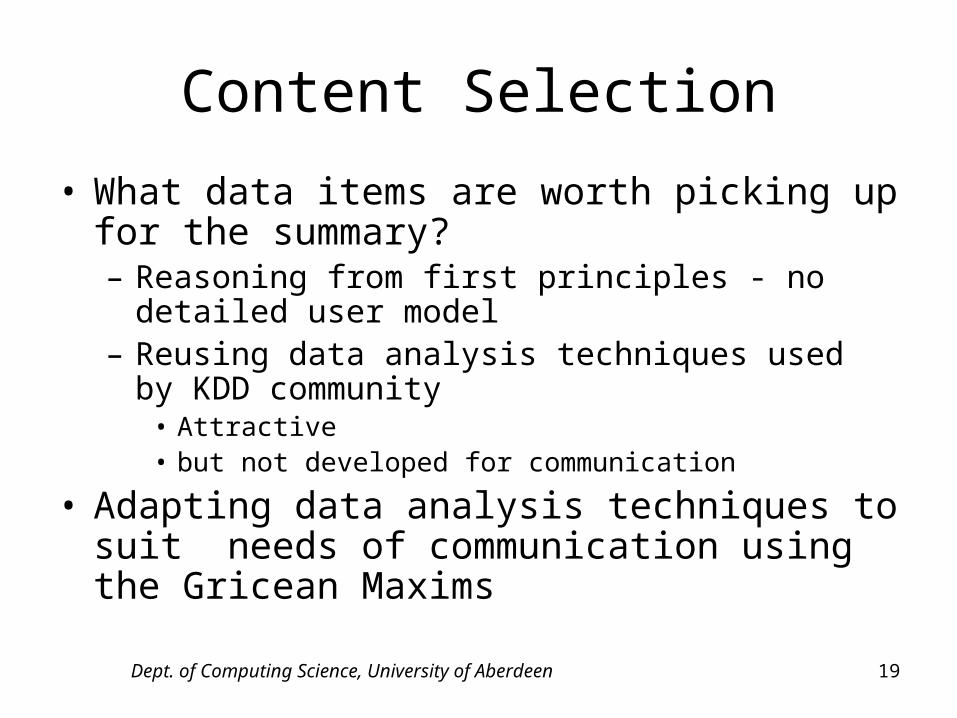
Content Selection
• What data items are worth picking up for the summary?– Reasoning from first principles - no detailed
user model– Reusing data analysis techniques used by KDD
community • Attractive • but not developed for communication
• Adapting data analysis techniques to suit needs of communication using the Gricean Maxims
Dept. of Computing Science, University of Aberdeen 20
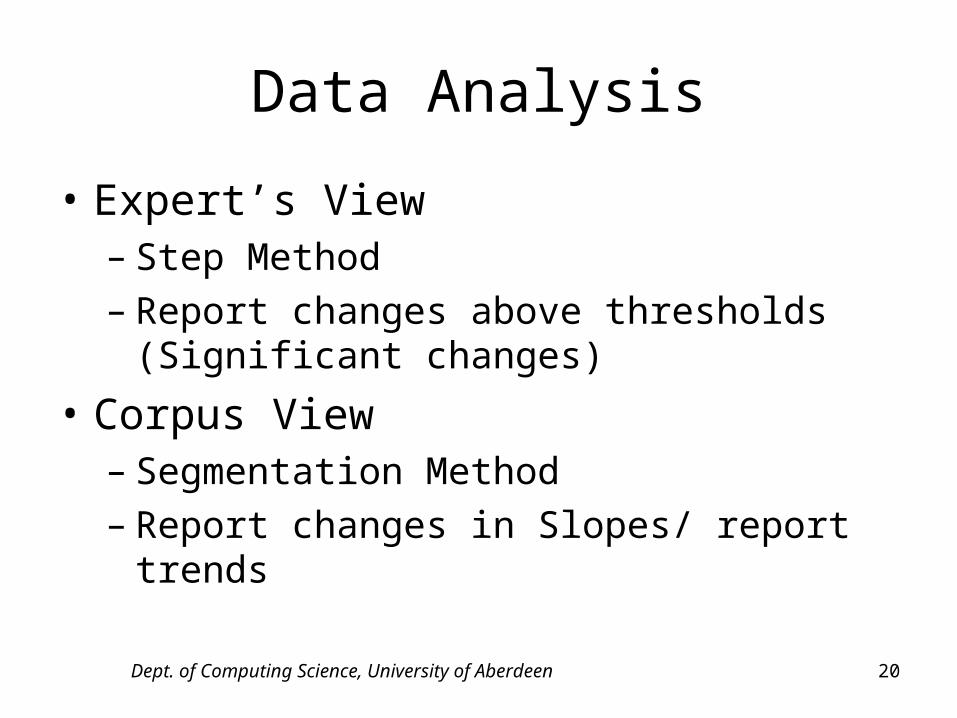
Data Analysis
• Expert’s View– Step Method– Report changes above thresholds
(Significant changes)
• Corpus View– Segmentation Method– Report changes in Slopes/ report trends
Dept. of Computing Science, University of Aberdeen 21
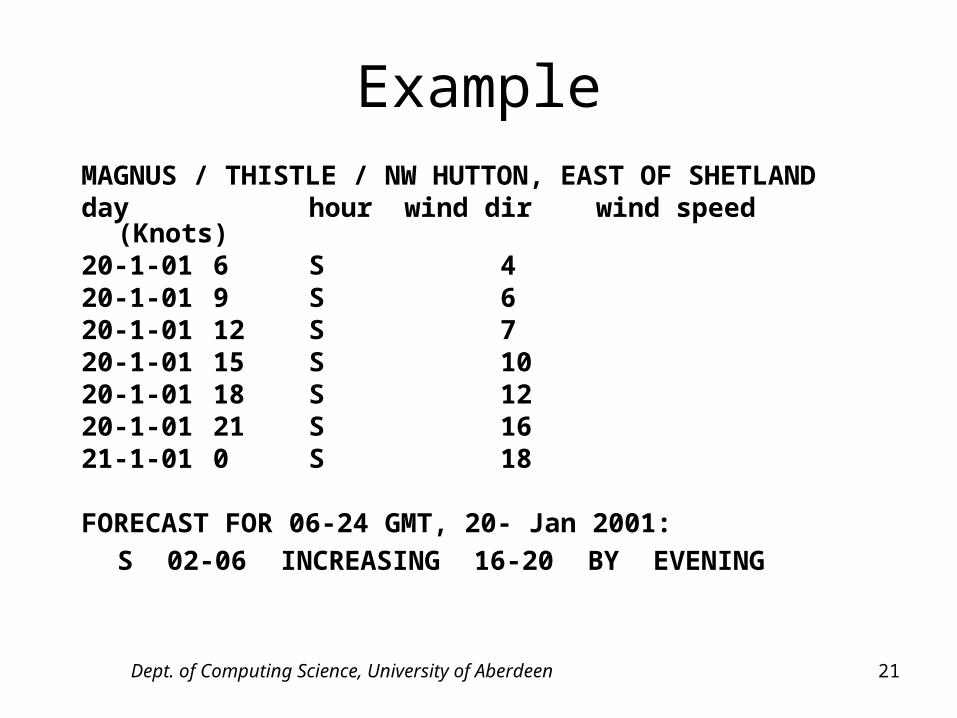
ExampleMAGNUS / THISTLE / NW HUTTON, EAST OF SHETLANDday hour wind dir wind speed
(Knots)20-1-01 6 S 420-1-01 9 S 620-1-01 12 S 720-1-01 15 S 1020-1-01 18 S 1220-1-01 21 S 1621-1-01 0 S 18
FORECAST FOR 06-24 GMT, 20- Jan 2001:S 02-06 INCREASING 16-20 BY EVENING
Dept. of Computing Science, University of Aberdeen 22
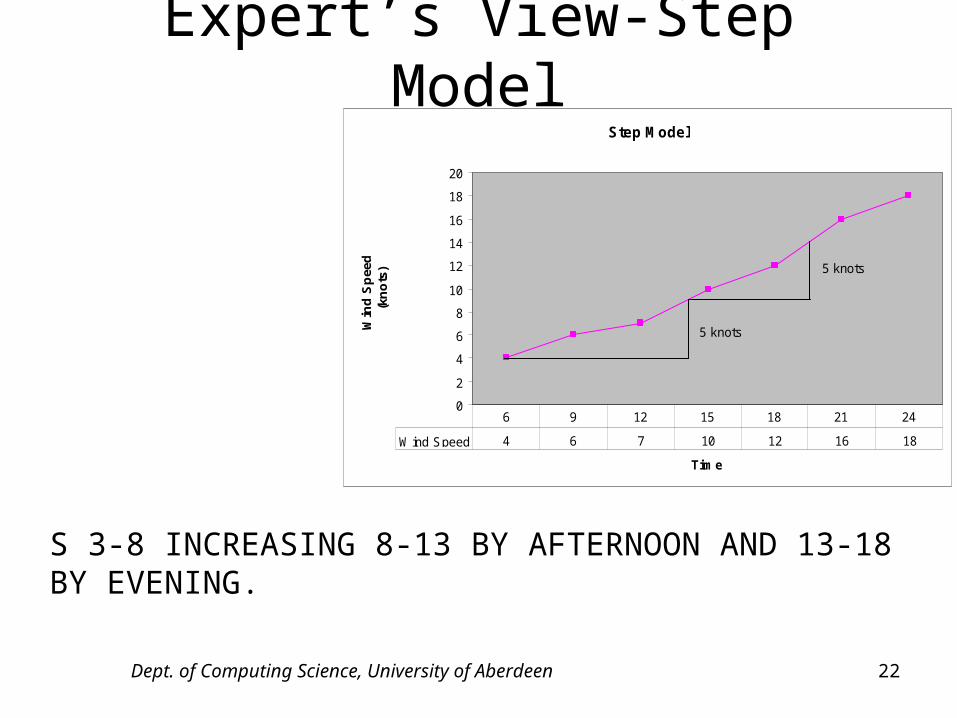
Expert’s View-Step ModelStep Model
0
2
4
6
8
10
12
14
16
18
20
Time
Win
d S
pee
d(k
no
ts)
Wind Speed 4 6 7 10 12 16 18
6 9 12 15 18 21 24
5 knots
5 knots
S 3-8 INCREASING 8-13 BY AFTERNOON AND 13-18 BY EVENING.
Dept. of Computing Science, University of Aberdeen 23
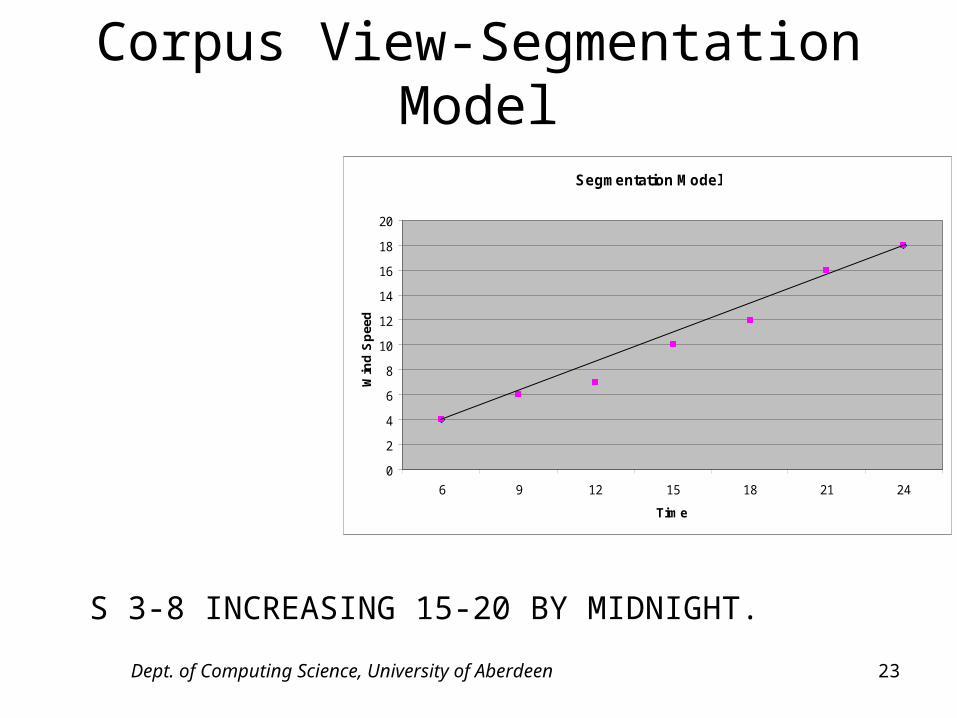
Corpus View-Segmentation Model
Segmentation Model
0
2
4
6
8
10
12
14
16
18
20
6 9 12 15 18 21 24
Time
Win
d S
pee
d
S 3-8 INCREASING 15-20 BY MIDNIGHT.

Dept. of Computing Science, University of Aberdeen 24
Gricean Maxims (Grice 1975)• Maxim of Quality: Try to make your
contribution one that is true. More specifically:– Do not say what you believe to be false.– Do not say that for which you lack adequate
evidence.
• Maxim of Quantity:– Make your contribution as informative as is required
(for the current purposes of the exchange).– Do not make your contribution more informative
than is required.
• Maxim of Relevance: Be relevant.• Maxim of Manner: Be perspicuous. More
specifically:– Avoid obscurity of expression. -Avoid ambiguity.– Be brief. -Be orderly.
Dept. of Computing Science, University of Aberdeen 25
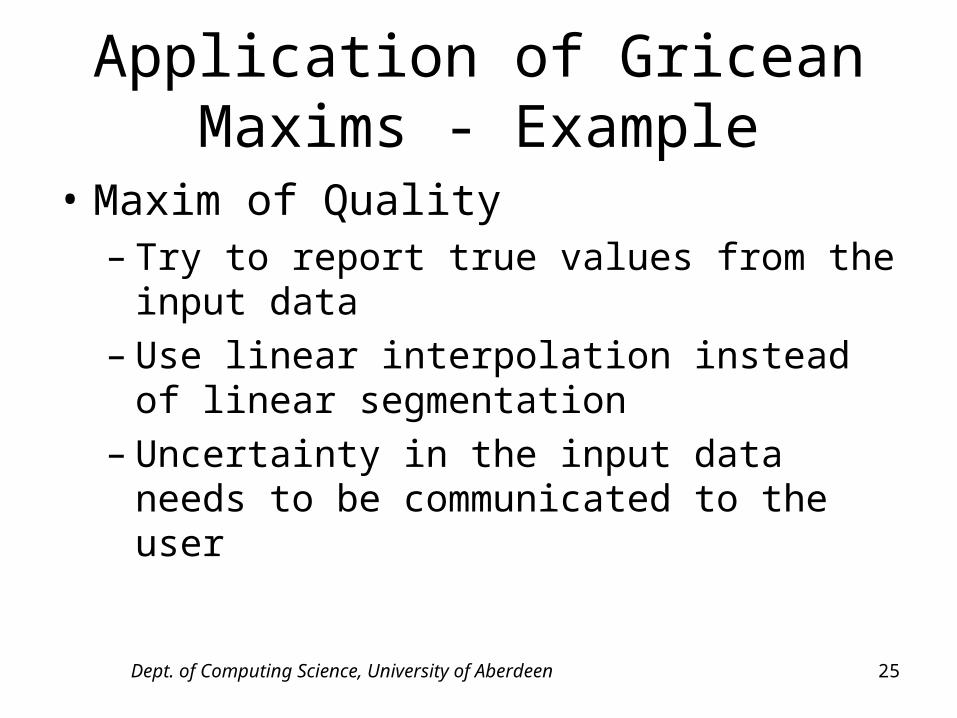
Application of Gricean Maxims - Example
• Maxim of Quality– Try to report true values from the input
data– Use linear interpolation instead of linear
segmentation– Uncertainty in the input data needs to
be communicated to the user
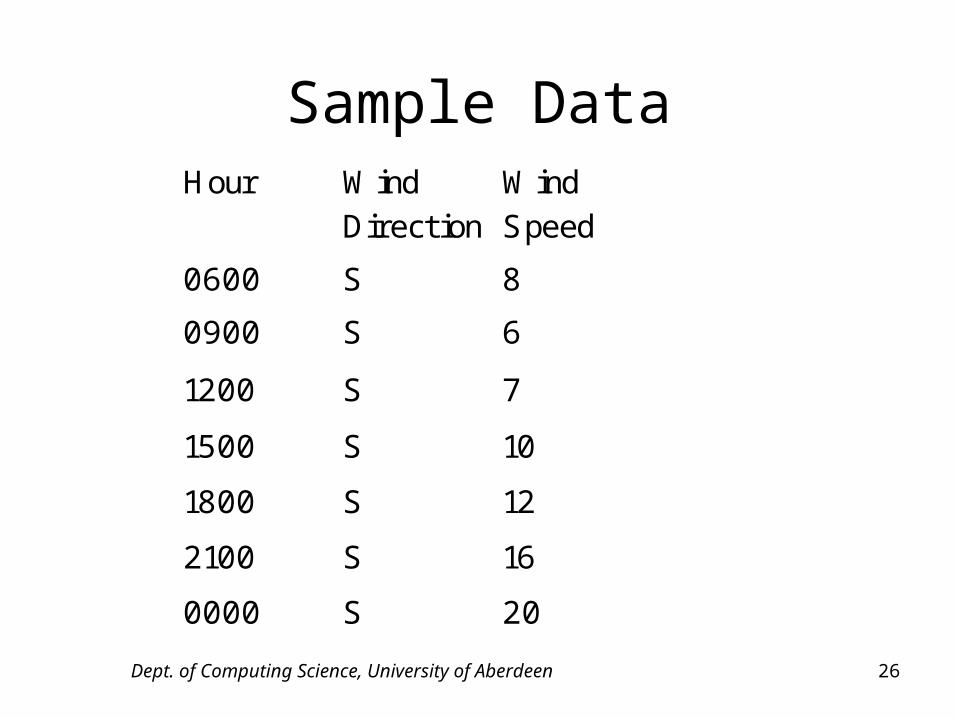
Dept. of Computing Science, University of Aberdeen 26
Sample DataHour Wind
DirectionWindSpeed
0600 S 8
0900 S 6
1200 S 7
1500 S 10
1800 S 12
2100 S 16
0000 S 20

Dept. of Computing Science, University of Aberdeen 27
Linear Regression Vs Linear Interpolation
Linear Regression
0
5
10
15
20
25
0 3 6 9 12 15 18 21 24 27
Time in Hours
Win
d S
pee
d i
n K
no
ts
Linear Interpolation
0
5
10
15
20
25
0 3 6 9 12 15 18 21 24 27
Time in HoursW
ind
Sp
eed
in
Kn
ots

Dept. of Computing Science, University of Aberdeen 28
Linear Regression Vs Linear Interpolation (2)
• Linear Regression– S 03-07 INCREASING 16-20 BY MIDNIGHT
• Linear Interpolation– S 06-10 INCREASING 18-22 BY MIDNIGHT
• Human Written Forecast– S 06-10 INCREASING 18-22 BY MIDNIGHT
• Although visually linear regression looks better forecasters do not use it.
• Uncertainty– Speed values are mentioned as ranges e.g. 06-
07 & 18-22
Dept. of Computing Science, University of Aberdeen 29
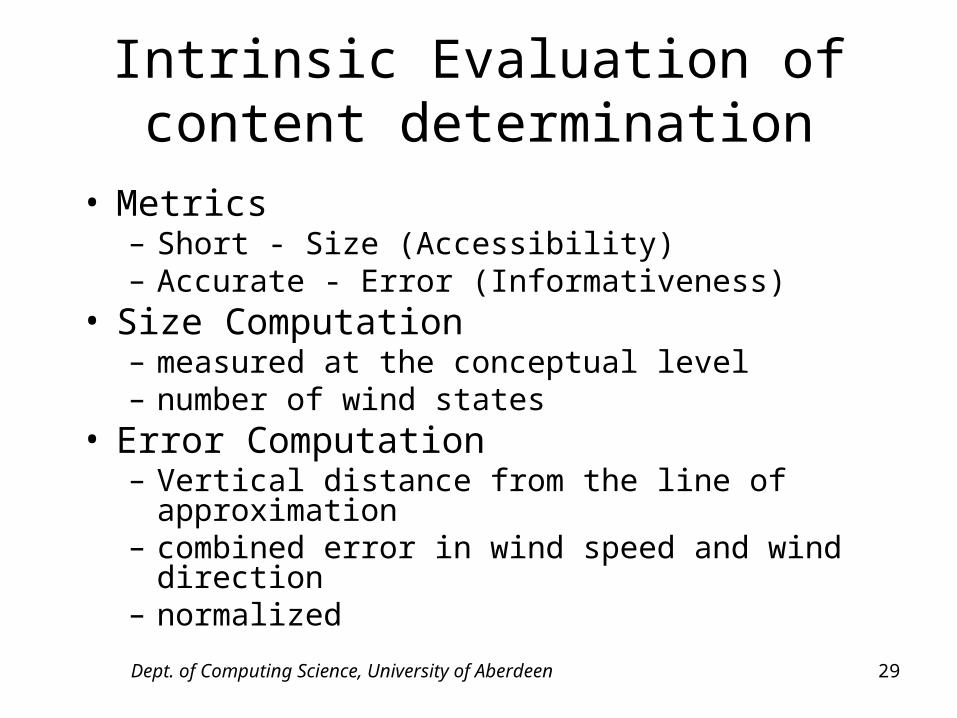
Intrinsic Evaluation of content determination
• Metrics– Short - Size (Accessibility)– Accurate - Error (Informativeness)
• Size Computation– measured at the conceptual level– number of wind states
• Error Computation– Vertical distance from the line of
approximation– combined error in wind speed and wind
direction – normalized
Dept. of Computing Science, University of Aberdeen 30
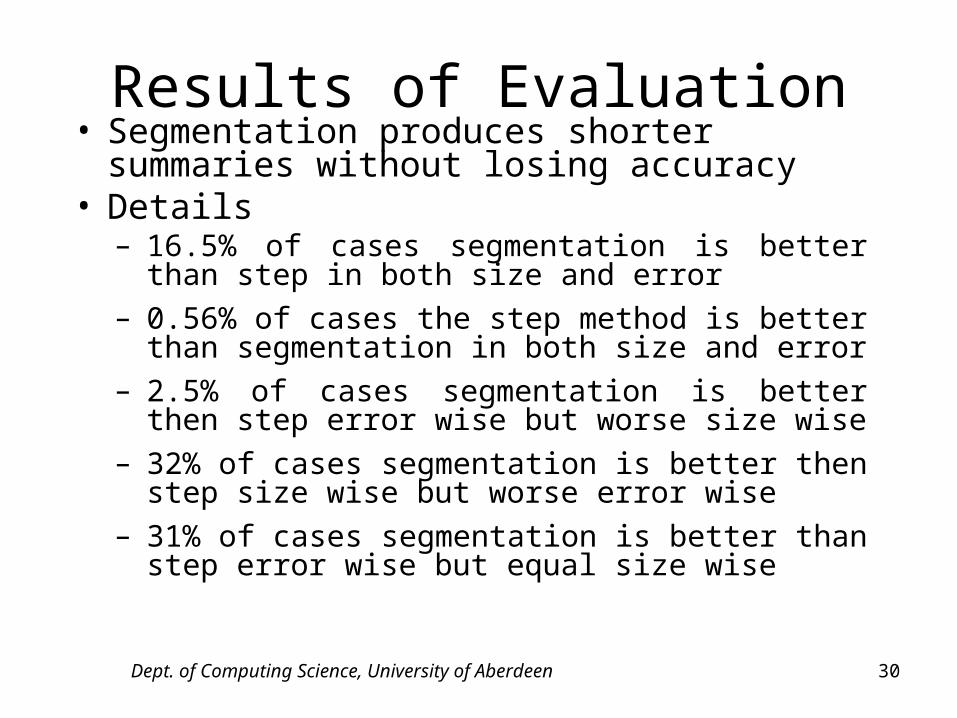
Results of Evaluation• Segmentation produces shorter
summaries without losing accuracy• Details
– 16.5% of cases segmentation is better than step in both size and error
– 0.56% of cases the step method is better than segmentation in both size and error
– 2.5% of cases segmentation is better then step error wise but worse size wise
– 32% of cases segmentation is better then step size wise but worse error wise
– 31% of cases segmentation is better than step error wise but equal size wise

Dept. of Computing Science, University of Aberdeen 31
Micro-planning & Realization
• Based on Parallel corpus analysis (described earlier) and
• Expert KA/Revision• Details in Papers at
– www.csd.abdn.ac.uk/research/sumtime/papers.html
Dept. of Computing Science, University of Aberdeen 32
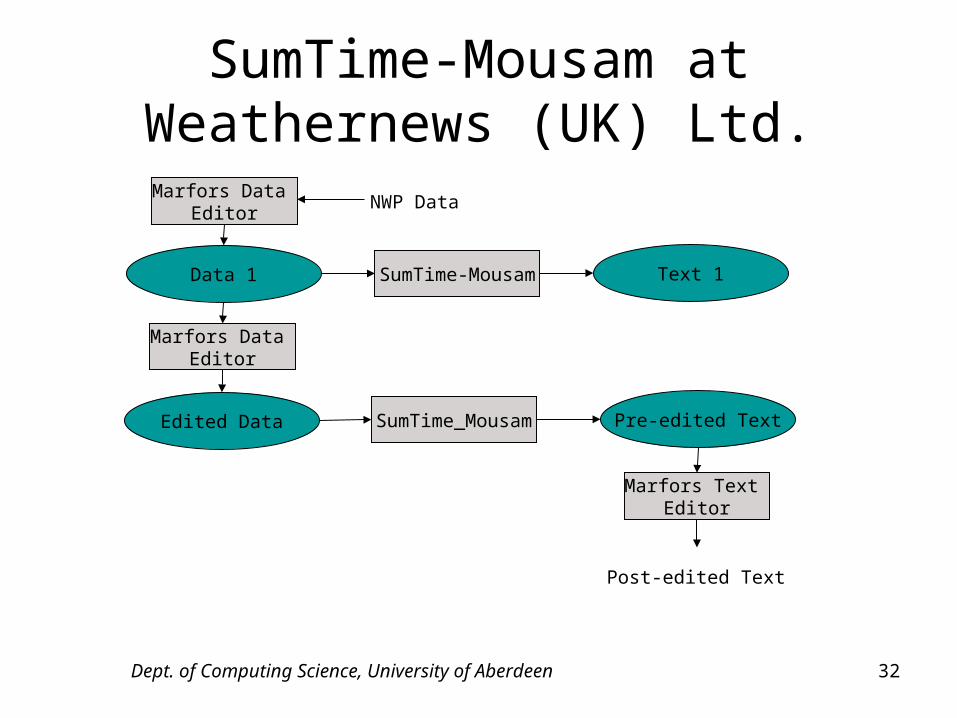
SumTime-Mousam at Weathernews (UK) Ltd.
SumTime-MousamData 1
Pre-edited TextEdited Data
Text 1
Marfors Data Editor
Marfors Data Editor
SumTime_Mousam
Marfors Text Editor
NWP Data
Post-edited Text
Dept. of Computing Science, University of Aberdeen 33
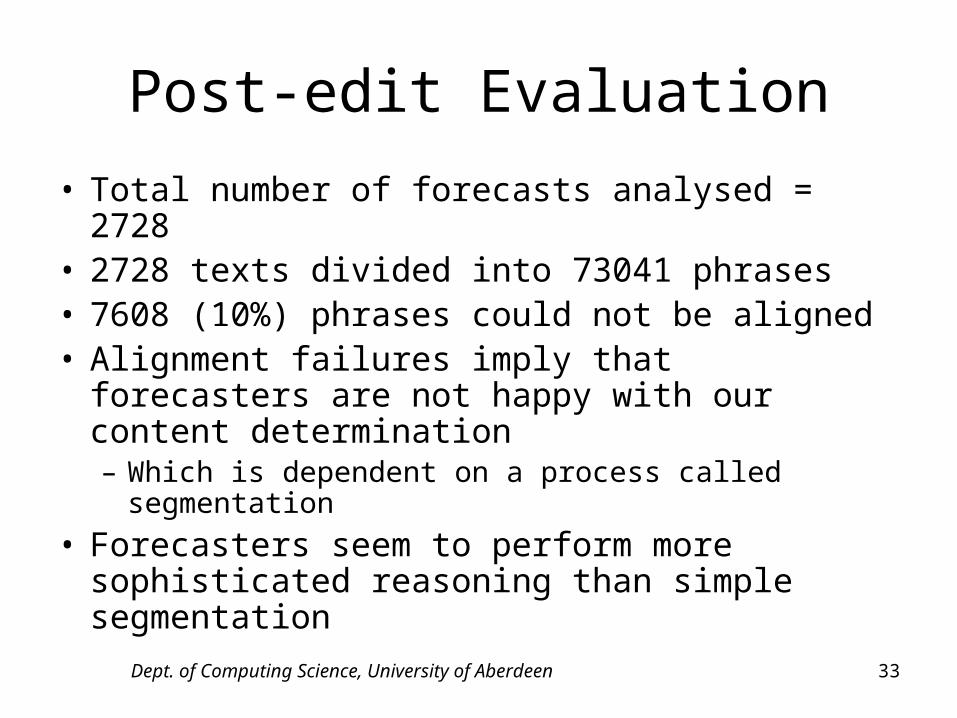
Post-edit Evaluation
• Total number of forecasts analysed = 2728• 2728 texts divided into 73041 phrases• 7608 (10%) phrases could not be aligned• Alignment failures imply that forecasters are
not happy with our content determination– Which is dependent on a process called
segmentation
• Forecasters seem to perform more sophisticated reasoning than simple segmentation
Dept. of Computing Science, University of Aberdeen 34
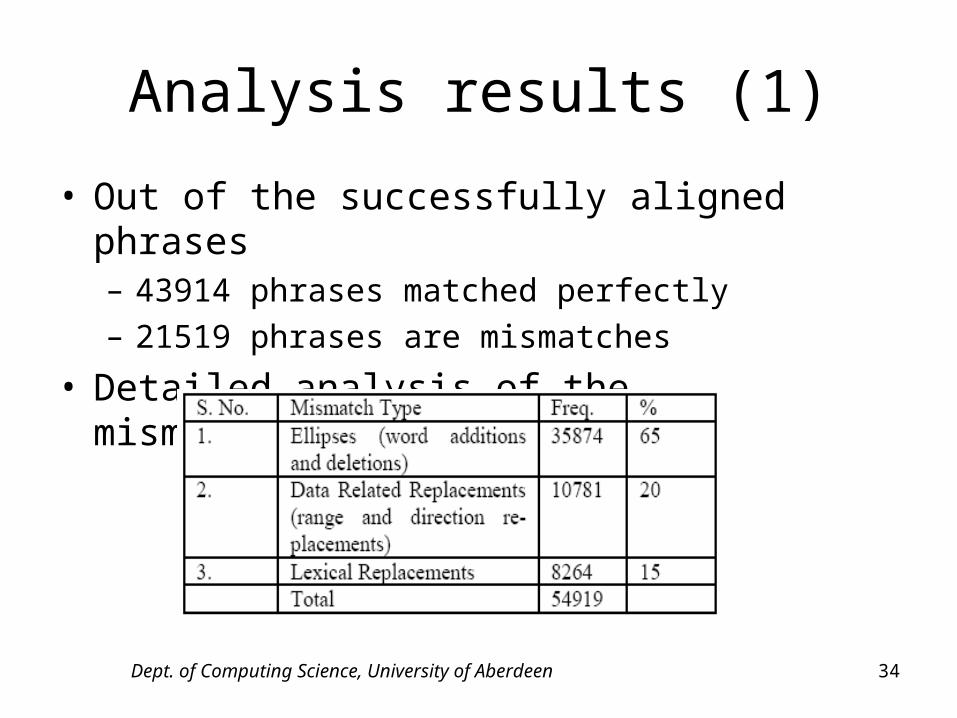
Analysis results (1)
• Out of the successfully aligned phrases– 43914 phrases matched perfectly– 21519 phrases are mismatches
• Detailed analysis of the mismatches

Dept. of Computing Science, University of Aberdeen 35
Analysis Results (2)
mismatches29%
perfect matches
61%
alignment failures
10% word additions & deletions,
65%
data replacements,
20%
lexical replacements,
15%
The pie chart shows the results of phrase level comparisons
The bar chart shows the detailedanalysis of the mismatched phrases
Dept. of Computing Science, University of Aberdeen 36
End-user Evaluation• 73 End-users (oil company staff supporting offshore oilrigs)
participated in this evaluation• used forecasts produced by the following three methods
– human written weather forecasts– SumTime-Mousam generated weather forecasts– SumTime-Mousam expressing Human select content
• Each participant completed a questionnaire that has two parts– Part 1
• forecast produced by one of the above three methods (anonymous)• Participant is required to answer comprehension questions based on the
forecast– Part 2
• showed any two forecasts from the above three methods (anonymous)• Participant specified his/her preference for one of the two forecasts
• The main result– end-users consider the SumTime-Mousam generated output
linguistically better than human written forecasts– Content of SumTime-Mousam is not as good as human selected
content
Dept. of Computing Science, University of Aberdeen 37
Conclusion
• SumTime-Mousam is the result of knowledge obtained from– several knowledge acquisition studies
• Expert based• Corpus based
– Several evaluation studies• Intrinsic evaluation• Post-edit evaluation• End-user evaluation
• The development of SumTime-Mousam went through many cycles
• Building novel technology requires iterative approach with multiple KA and evaluation studies