part 6 monitoring the food security situation … 6 .pdf · point 6 of the terms of reference of...
TRANSCRIPT

PART 6
MONITORING THE FOOD SECURITY SITUATION IN SADC


Part 6
1. Introduction Point 6 of the terms of reference of the Food Price Monitoring Committee is “To monitor the regional SADC food situation”. It was proposed to analyse the SADC food security situation by focusing on four products: maize, sorghum, pulses and wheat. However, due to the availability of data the following products were finally selected and are covered in this report: Maize, wheat and sorghum / millet. Data collection and analysis of the selected products was carried out for each of the SADC countries (excluding Democratic Republic of the Congo and Seychelles) involved three time frames: trends for the last 3 years, the current situation and future estimates. The report will cover the following sections: - The SADC region: An introduction. - Trends and the current food supply situation within each of the SADC countries individually. - The SADC region: Summary of current food supply situation. - Overview of information sources on the SADC region’s food situation. - Conclusion. - References. The report contains all information available up to October 2003. The following abbreviations were used in the report: - SADC: Southern African Development Community - DRC: Democratic Republic of the Congo - SADC REWU: Southern African Development Community; Regional Early Warning Unit - SADC FANR: Southern African Development Community; Food, Agriculture and Natural
Resources Development Unit - SADC GIEWS: Southern African Development Community; FAO Global Information and
Early Warning System on food and agriculture - WFP: World Food Programme - FEWSNET: Famine Early Warning Systems Network 2. The SADC region: An introduction There are 13 countries within the SADC region: Angola, Botswana, Lesotho, Malawi, Mauritius, Mozambique, Namibia, Seychelles, South Africa, Swaziland, Tanzania, Zambia and Zimbabwe. Where possible the study focused on all the SADC countries. However, in certain cases it was problematic to find data for the Democratic Republic of the Congo and the Seychelles. Table 1 displays the important food crops in SADC countries in terms of calorie intake information adopted from information supplied by SADC FANR (The Southern African Development Community; Food, Agriculture and Natural Resources Development Unit). No information was available for Seychelles, DRC and Mauritius.
346

SADC food security situation Table 1: Important food crops in terms of calorie intake information Country: Food crops of major importance: Other relevant food crops:
ANGOLA Cassava Maize Wheat Rice Sorghum/Millet
BOTSWANA Maize Sorghum/ Millet Wheat Rice
LESOTHO Maize Wheat Sorghum/ Millet
MALAWI Maize Cassava Rice Wheat Sorghum/ Millet
MOZAMBIQUE Cassava Maize Rice Sorghum/ Millet Wheat
NAMIBIA Maize Wheat Sorghum/ Millet
SOUTH AFRICA Maize Wheat Rice SWAZILAND Maize Wheat Rice
TANZANIA Maize Cassava Rice Sorghum/ Millet Wheat Pulses Bananas Sweet potatoes
ZAMBIA Maize Wheat Sorghum/ Millet
ZIMBABWE Maize Wheat Sorghum/ Millet
(Source: SADC FANR) From this table the most important food crops in terms of the calorie intake information seem to be maize, wheat, sorghum/millet and cassava. Based on the above analyses, the original calorie intake information by SADC FANR and information availability on countries experiencing current food crisis situations, the following crops were selected for the individual countries: Table 2: Crops selected for analysis with respect to the various countries Country: Crops selected for analysis: Angola: Maize, Wheat Botswana: Maize, Sorghum/Millet, Wheat Lesotho: Maize, Wheat Malawi: Maize Mauritius: Maize, wheat Mozambique: Maize Namibia: Maize, Sorghum / Millet South Africa: Maize, Wheat Swaziland: Maize, Wheat Tanzania: Maize Zambia: Maize Zimbabwe: Maize
347

Part 6 3. Trends and current food supply situation within each of the SADC countries
individually The situation in each SADC country is discussed using the following format, subject to the availability of data: • General information on the specific country. • Time series graphs of total supply, total demand and per capita demand for the major food
crops in the country. • The food situation in the specific country based on various sources. The discussions are based mainly on data from two sources: • SADC REWU. • FAO, GIEWS. The discrepancies in the data obtained from SADC REWU and the FAO can attributed to • Different methodologies. • Differences in the time periods for which the data was estimated. 3.1 Angola 3.1.1 General information • Angola is generally seen as a food deficit country where civil disturbances have disrupted
food production and distribution. • The average actual per capita consumption is far below nutritional requirements. • The population growth rate is 2.7% per annum. • Marketing year: July - June. • Major domestic food crops: Cassava, maize. • Share of staple foods in total calorie intake:
o Cereals 35% (maize 27%, wheat 4%; rice 2%; sorghum/millet 2%) o Cassava 29%
(Source: SADC FANR)
348
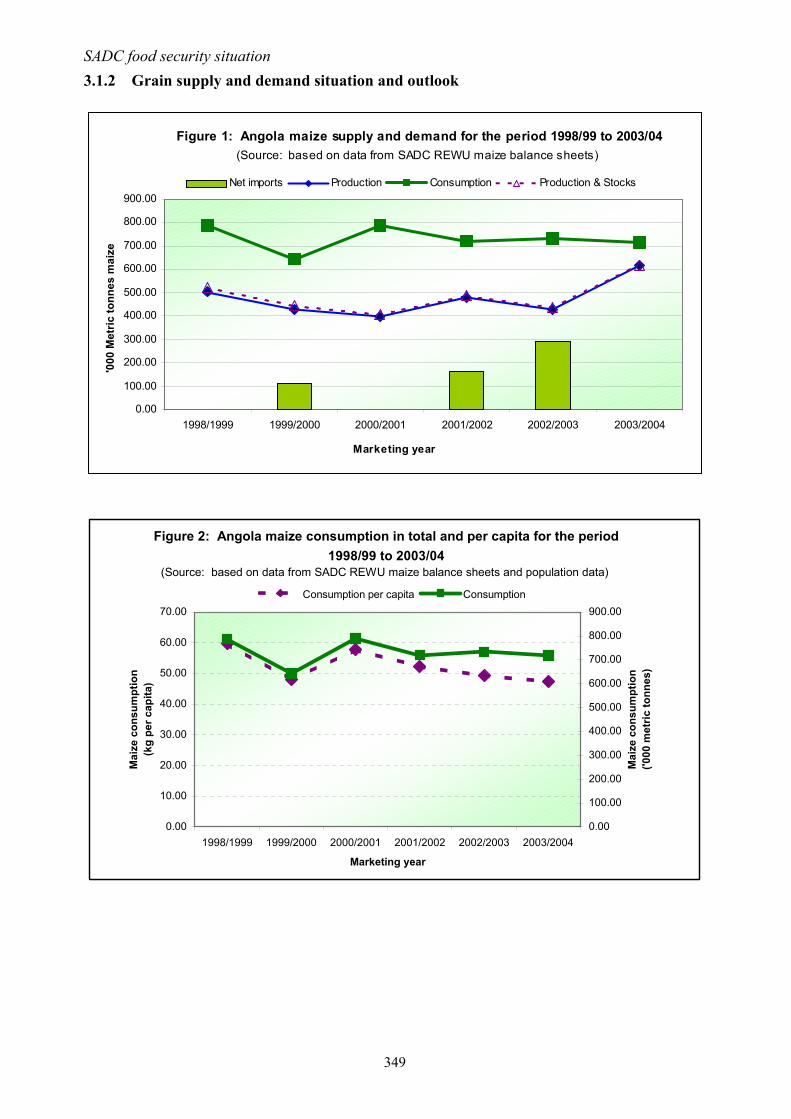
SADC food security situation 3.1.2 Grain supply and demand situation and outlook
Figure 1: Angola maize supply and demand for the period 1998/99 to 2003/04(Source: based on data from SADC REWU maize balance sheets)
0.00
100.00
200.00
300.00
400.00
500.00
600.00
700.00
800.00
900.00
1998/1999 1999/2000 2000/2001 2001/2002 2002/2003 2003/2004
Marketing year
'000
Met
ric to
nnes
mai
ze
Net imports Production Consumption Production & Stocks
Figure 2: Angola maize consumption in total and per capita for the period 1998/99 to 2003/04
(Source: based on data from SADC REWU maize balance sheets and population data)
0.00
10.00
20.00
30.00
40.00
50.00
60.00
70.00
1998/1999 1999/2000 2000/2001 2001/2002 2002/2003 2003/2004
Marketing year
Mai
ze c
onsu
mpt
ion
(kg
per c
apita
)
0.00
100.00
200.00
300.00
400.00
500.00
600.00
700.00
800.00
900.00
Mai
ze c
onsu
mpt
ion
('000
met
ric to
nnes
)
Consumption per capita Consumption
349

Part 6
Figure 3: Angola wheat supply and demand for the period 1998/99 to 2003/04(Source: based on data from SADC REWU maize balance sheets and population data)
0.00
50.00
100.00
150.00
200.00
250.00
300.00
1998/1999 1999/2000 2000/2001 2001/2002 2002/2003 2003/2004
Marketing year
Mai
ze c
onsu
mpt
ion
(kg
per c
apita
)
0.00
100.00
200.00
300.00
400.00
500.00
600.00
700.00
800.00
900.00
Mai
ze c
onsu
mpt
ion
('000
met
ric to
nnes
)
Net imports Production Consumption Production & Stocks Consumption per capita Consumption
Figure 4: Angola wheat consumption in total and per capita for the period 1998/99 to 2003/04(Source: based on data from SADC REWU maize balance sheets and population data)
0.00
5.00
10.00
15.00
20.00
25.00
1998/1999 1999/2000 2000/2001 2001/2002 2002/2003 2003/2004
Marketing year
Whe
at c
onsu
mpt
ion
per
capi
ta
(kg
per c
apita
)
0.00
50.00
100.00
150.00
200.00
250.00
300.00
Whe
at c
onsu
mpt
ion
(100
0 m
t)
Consumption per capita Consumption
350

SADC food security situation
Figure 5: Angola estimated cereal import requirements - 2001/02, 2002/03, 2003/04
(Source: FAO GIEWS)
0
100
200
300
400
500
600
2001/02Commercialpurchases
2001/02 Food aid 2002/03Commercialpurchases
2002/03 Food aid 2003/04Commercialpurchases
2003/04 Food aid
Cer
eal q
uant
ity ('
000
tonn
es)
Angola is currently facing a food emergency, mainly due to returnees (internally displaced persons (IDPs)) (FAO, GIEWS, 2003a, 2003c, 2003d). The country is classified by FAO, GIEWS (2003a) as having a two fold food emergency based generally on adverse prospects for the current crops and / or uncovered shortfalls and being affected or threatened by successive poor crops or food shortages. According to FAO, GIEWS (2003a, 2003b) an above average 2003 maize crop is expected in Angola, due to several reasons: • Higher plantings following the termination of the civil war in April 2002. Since then an
estimated 1.8 million IDPs and an estimated 130 000 Angolan refugees have returned to their areas of origin where they have cultivated the land.
• Improved yields due to: o Timely distribution of agricultural inputs by the Government. o Timely distribution of agricultural inputs by the international community. o A good rain season.
The 2002/03 maize crop was 23% above the 2001/02 harvest of 670 000 tonnes (FAO, GIEWS, 2003d). The 2003 cereal crops are currently being harvested in Angola. According to FAO, GIEWS (2003e) the coarse grain output on Angola for the 2002/03 season was 549 000 tonnes, which is 18% higher than in 2001/02. However, emergency food assistance is still needed in the country (FAO, GIEWS, 2003b). In the current season the total food aid requirements amount to 161 000 tonnes of cereals and 17800 tonnes of pulses, while in 2003/04 an estimated 1.41 million people will be in need of food assistance (FAO, GIEWS, 2003d). According to the FAO, GIEWS (2003a) the estimated food aid allocated imports (committed or shipped) for 2002/03 is 228 000 tonnes, which is 34.4% higher than the actual food aid imports during 2001/02, while the estimated commercial purchases for 2002/03 is 439 100 tonnes (9.4% higher than the actual commercial purchases imports for 2001/02). The most recent cereal estimations according to the SADC REWU Balance Sheets are:
351
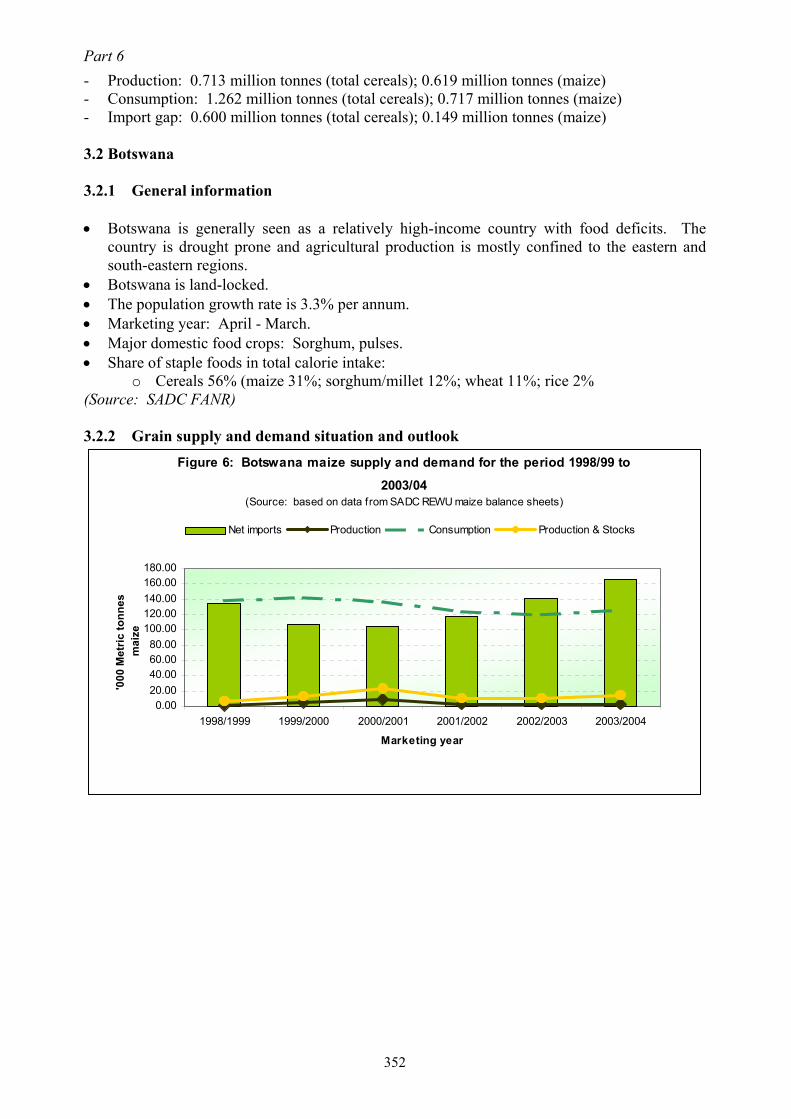
Part 6 - Production: 0.713 million tonnes (total cereals); 0.619 million tonnes (maize) - Consumption: 1.262 million tonnes (total cereals); 0.717 million tonnes (maize) - Import gap: 0.600 million tonnes (total cereals); 0.149 million tonnes (maize) 3.2 Botswana 3.2.1 General information • Botswana is generally seen as a relatively high-income country with food deficits. The
country is drought prone and agricultural production is mostly confined to the eastern and south-eastern regions.
• Botswana is land-locked. • The population growth rate is 3.3% per annum. • Marketing year: April - March. • Major domestic food crops: Sorghum, pulses. • Share of staple foods in total calorie intake:
o Cereals 56% (maize 31%; sorghum/millet 12%; wheat 11%; rice 2% (Source: SADC FANR) 3.2.2 Grain supply and demand situation and outlook
Figure 6: Botswana maize supply and demand for the period 1998/99 to 2003/04
(Source: based on data from SADC REWU maize balance sheets)
0.0020.0040.0060.0080.00
100.00120.00140.00160.00180.00
1998/1999 1999/2000 2000/2001 2001/2002 2002/2003 2003/2004
Net imports Production Consumption Production & Stocks
'000
Met
ric to
nnes
m
aize
Marketing year
352

SADC food security situation
Figure 7: Botswana maize consumption in total and per capita for the period 1998/99 to 2003/04
(Source: based on data from SADC REWU maize balance sheets and population data)
0.00
20.00
40.00
60.00
80.00
100.00
1998/1999 1999/2000 2000/2001 2001/2002 2002/2003 2003/2004105.00110.00115.00120.00125.00130.00135.00140.00145.00
Consumption per capita Consumption
Mai
ze c
onsu
mpt
ion
('000
met
ric to
nnes
)
Mai
ze c
onsu
mpt
ion
(kg
per c
apita
)
Marketing year
Figure 8: Botswana sorghum and millet supply and demand for the period 1998/99 to 2003/04
(Source: based on data from SADC REWU sorghum & millet balance sheets)
0.00
10.00
20.00
30.00
40.00
50.00
60.00
70.00
80.00
90.00
1998/1999 1999/2000 2000/2001 2001/2002 2002/2003 2003/2004
Marketing year
'000
met
ric to
nnes
sor
ghum
& m
illet
Net imports Production Consumption Production & Stocks
353

Part 6
Figure 9: Botswana sorghum and millet consumption in total and per capita for the period 1998/99 to 2003/04
(Source: based on data from SADC REWU sorghum & millet balance sheets and population data)
0.00
10.00
20.00
30.00
40.00
50.00
60.00
1998/1999 1999/2000 2000/2001 2001/2002 2002/2003 2003/2004
Marketing year
Sorg
hum
& m
illet
co
nsum
ptio
n (k
g pe
r cap
ita)
0.00
10.00
20.00
30.00
40.00
50.00
60.00
70.00
80.00
90.00
Sorg
hum
& m
illet
co
nsum
ptio
n ('0
00 m
etric
tonn
es)
Consumption per capita Consumption
Figure 11: Botswana wheat consumption in total and per capita for the period 1998/99 to 2003/04
(Source: based on data from SADC REWU w heat balance sheets and population data)
0.00
10.00
20.00
30.00
40.00
50.00
60.00
1998/ 1999 1999/ 2000 2000/ 2001 2001/ 2002 2002/ 2003 2003/ 20040.0010.0020.0030.0040.0050.0060.0070.0080.0090.00100.00
Consumption per capita Consumption
Whe
at c
onsu
mpt
ion
(kg
per c
apita
)
Marketing year Whe
at c
onsu
mpt
ion
('000
met
ric to
nnes
)
Botswana experienced a reduction in the production of cereal crops (mainly sorghum) from the previous 2001/ 2002 season (FAO, GIEWS, 2003a). This can be attributed to late and below average rains that led to reduced plantings and yields. According SADC REWU data, the 2002/03 gross sorghum harvest is estimated at 22 510 metric tonnes. Maize production fell by 9.5% to a level of 2 200 metric tonnes in the 2002/03 marketing year (SADC REWU, 2003). Table 3 displays the most recent cereal estimations according to the SADC REWU Balance Sheets.
354

SADC food security situation Table 3: Most recent cereal estimations for Botswana (millions of metric tonnes) Crop: Production: Consumption: Total imports: Import gap: Maize 0.002 0.125 0.165 0Sorghum / Millet 0.030 0.065 0.050 0Wheat 0 0.086 0.082 0.003(Source: Most recent SADC REWU Balance Sheets) It is evident from the graphs and Table 3 above that Botswana is a net commercial importer of cereals for its consumption requirements. The food supply situation in Botswana remains stable. The Botswana government is distributing food aid in the areas, which were affected by poor harvests (FAO, GIEWS, 2003d). 3.3 Lesotho 3.3.1 General information • Lesotho is generally seen as a food deficit, land-locked country with mountainous terrain.
The economy is heavily dependant on remittances from mine workers in South Africa. • The population growth rate is 2.6% per annum. • Marketing year: April - March. • Major domestic food crops: Maize, sorghum and wheat. • Share of staple foods in total calorie intake:
o Cereals 75% (maize 49%; wheat 17%; sorghum 9%). (Source: SADC FANR) 3.3.2 Grain supply and demand situation and outlook
Figure 12: Lesotho maize supply and demand for the period 1998/99 to 2003/04
(Source: based on data from SADC REWU maize balance sheets)
0.00
50.00
100.00
150.00
200.00
250.00
300.00
1998/1999 1999/2000 2000/2001 2001/2002 2002/2003 2003/2004
Marketing year
'000
Met
ric to
nnes
mai
ze
Net imports Production Consumption Production & Stocks
355

Part 6
Figure 13: Lesotho maize consumption in total and per capita for the period
1998/99 to 2003/04(Source: based on data from SADC REWU maize balance sheets and population data)
106.00108.00110.00
112.00114.00116.00118.00120.00
122.00124.00126.00
1998/1999 1999/2000 2000/2001 2001/2002 2002/2003 2003/2004
Marketing year
Mai
ze c
onsu
mpt
ion
(kg
per c
apita
)
215.00220.00225.00
230.00235.00240.00245.00250.00
255.00260.00265.00
Mai
ze c
onsu
mpt
ion
('000
met
ric to
nnes
)
Consumption per capita Consumption
Figure 14: Lesotho wheat supply and demand for the period 1998/99 to 2003/04
(Source: based on data from SADC REWU w heat balance sheets)
0.00
20.00
40.00
60.00
80.00
100.00
120.00
1998/1999 1999/2000 2000/2001 2001/2002 2002/2003 2003/2004
Marketing year
'000
met
ric to
nnes
whe
at
Net imports Production Consumption Production & Stocks
356

SADC food security situation
Figure 15: Lesotho wheat consumption in total and per capita for the
period 1998/99 to 2003/04(Source: based on data from SADC REWU maize wheat sheets and population data)
0.00
10.00
20.00
30.00
40.00
50.00
60.00
1998/1999 1999/2000 2000/2001 2001/2002 2002/2003 2003/2004
Marketing year
Whe
at c
onsu
mpt
ion
(kg
per c
apita
)
85.00
90.00
95.00
100.00
105.00
110.00
115.00
Whe
at c
onsu
mpt
ion
('000
m
etric
tonn
es)
Consumption per capita Consumption
Figure 16: Lesotho estimated cereal import requirements - 2001/02, 2002/03, 2003/04
(Source: FAO GIEWS 2003d)
0
50
100
150
200
250
2001/02Commercialpurchases
2001/02 Foodaid
2002/03Commercialpurchases
2002/03 Foodaid
2003/04Commercialpurchases
2003/04 Foodaid
Cer
eal q
uant
ity ('
000
tonn
es)
Lesotho is currently facing a food emergency, mainly due to adverse weather in certain parts of the country and the effects of HIV / AIDS (FAO, GIEWS, 2003a, 2003b, 2003d). The country is classified by FAO, GIEWS (2003a) as having a food emergency as a result of adverse prospects for current crops and / or uncovered shortfalls. A Crop and Food Supply Assessment was conducted by FAO and WFP during April and May 2003 (FAO, WFP, 2003a). The Mission forecasted the following with respect to the 2002/03 marketing year (FAO, WFP, 2003a, 2003d):
357

Part 6 • Total cereal production: 89 100 tonnes (66% higher than the 53 800 tonnes which were
estimated by the FAO/WFP Mission during the 2001/02 marketing year, but still below average).
• Production estimates for the various cereals: o Maize 61 400 tonnes. o Wheat 24 300 tonnes. o Sorghum 3 400 tonnes.
The Mission forecast the following with respect to the 2003/04 marketing year (FAO, WFP, 2003a): • Domestic cereal supply: 118 200 tonnes. • National consumption requirements: 438 900 tonnes. • Cereal import requirements: 320 700 tonnes. • Commercial imports: 288 700 tonnes. • Food aid needs: 32 000 tonnes for 270 000 people suffering due to
o Localized crop failure. o The effects of HIV/AIDS.
According to the Mission (FAO, WFP, 2003a) it is anticipated that cereal shortages will be limited at a national level, due to: • The improved (though still lower than normal) 2002/03-cereal harvest. • Improved commercial import capacity. According to the estimations of SADC REWU the following is projected for the 2002/03 marketing year: • Gross maize harvest: 81 710 tonnes (20.4% lower than 2001/02). • Gross domestic maize requirements: 256 850 tonnes (0.7% higher than 2001/02). • Gross sorghum harvest: 24 650 tonnes (35.6% lower than 2001/02). • Gross domestic sorghum requirements: 43 130 tonnes (0.8% higher than 2001/02). • Gross wheat harvest: 15 000 tonnes (16.7% lower than 2001/02). • Gross domestic wheat requirements: 95 700 tonnes (15.1% lower than 2001/02). Table 4 displays the most recent cereal estimations according to the SADC REWU Balance Sheets. Table 4: Most recent cereal estimations for Lesotho (millions of metric tonnes) Crop: Production: Consumption: Total imports: Import gap: Total cereals 0.094 0.395 0.232 0.035Maize 0.075 0.262 0.153 0.015Wheat 0.012 0.100 0.079 0(Source: Most recent SADC REWU Balance Sheets)
358

SADC food security situation 3.4 Malawi 3.4.1 General information • Malawi is generally seen as a potentially self-sufficient country. • The country was a maize exporter in past years but experienced serious deficits in recent
years. • The population growth rate is 3.7% per annum. • Marketing year: April - March. • Major domestic food crops: Maize, pulses, roots, tubers, rice. • Share of staple foods in total calorie intake:
o Cereals 67% (maize 61%; rice 2%; wheat 2%, sorghum/millet 2%); o Cassava 2%
(Source: SADC FANR) 3.4.2 Grain supply and demand situation and outlook
Figure 17: Malawi maize supply and demand for the period 1998/99 to 2003/04
(Source: based on data from SADC REWU maize balance sheets)
-500.00
0.00
500.00
1000.00
1500.00
2000.00
2500.00
3000.00
1998/1999 1999/2000 2000/2001 2001/2002 2002/2003 2003/2004
Marketing year
'000
met
ric to
nnes
mai
ze
Net imports Production Consumption Production & Stocks
359

Part 6
Figure 18: Malawi maize consumption in total and per capita for the period
1998/99 to 2003/04(Source: based on data from SADC REWU maize balance sheets and population data)
135.00
140.00
145.00
150.00
155.00
160.00
165.00
170.00
1998/1999 1999/2000 2000/2001 2001/2002 2002/2003 2003/2004
Marketing year
Mai
ze c
onsu
mpt
ion
(kg
per c
apita
)
0.00
500.00
1000.00
1500.00
2000.00
2500.00
Mai
ze c
onsu
mpt
ion
('000
met
ric to
nnes
)
Consumption per capita Consumption
Figure 19: Malawi estimated cereal import requirements - 2001/02, 2002/03, 2003/04
(Source: FAO GIEWS)
050
100150200250300350400450500
2001/02Commercialpurchases
2001/02 Foodaid
2002/03Commercialpurchases
2002/03 Foodaid
2003/04Commercialpurchases
2003/04 Foodaid
Cer
eal q
uant
ity ('
000
tonn
es)
In general Malawi has a satisfactory food supply situation, mainly due to (FAO, GIEWS, 2003d): - Increased 2003 cereal production. - High levels of maize carry-over stocks. - The lower maize price contributing towards better food access. However, according to FAO GIEWS (2003a, 2003b, 2003c, 2003d) certain areas in Malawi are in need of food aid mainly due to: • Localized drought and consequent crop failures.
360
SADC food security situation • Floods. • The impact of HIV / AIDS. • The destitute. A Crop and Food Supply Assessment was conducted by FAO and WFP during April 2003 (FAO, WFP, 2003a). The most important aspects of the Mission report will be discussed. The Mission forecast the following with respect to the 2002/03 marketing year (FAO, WFP, 2003b): • Maize production for the 2002/03 marketing year was estimated at a level of 1.9 million
tonnes (22% higher than the final harvest estimate for 2001/02). This could mainly be attributed to:
o Increased rainfall o Increased use of improved seed and fertilizers
• Crop failures were experienced in certain areas, leading to the following estimated food assistance needs:
o 400 000 people in the 2003/04 marketing year. o Estimated cereal food aid requirements of 30 600 tonnes.
Due to the reported existence of high maize stock levels in Malawi, it was recommended that the food aid cereal should be bought locally. The Mission forecast the following with respect to the 2003/04 marketing year (FAO, WFP, 2003b): • Available cereal: 2 319 000 tonnes. • Consumption requirements: 2 413 000 tonnes. • Shortage: 94 000 tonnes. • An adequate food supply is expected, mainly due to:
o High levels of carryover stocks and other types of crops o High (but unrecorded) quantities of maize and rice, which are informally imported
from neighbouring countries. The most recent cereal estimations according to the SADC REWU Balance Sheets are given in Table 5. Table 5: Most recent cereal estimations for Malawi (millions of metric tonnes) Crop: Production: Consumption: Total imports: Import gap: Total cereals 2.1 2.4 0.027 0.111Maize 2.0 2.2 0.027 0.073(Source: Most recent SADC REWU Balance Sheets) 3.5 Mauritius 3.5.1 General information • The population growth rate was 1.0% per annum in 2001. • Marketing year: January - December. • Major domestic food crops: Wheat, rice, maize.
361

Part 6 • Share of staple foods in total calorie intake:
o Cereals 48% o Pulses 4% o Roots and tubers 1%
(Sources: SADC FANR & The World Bank, World Development Indicators database, April 2003) 3.5.2 Grain supply and demand situation and outlook
Figure 20: Mauritius maize supply and demand for the period 1998/99 to 2003/04
(Source: based on data from SADC REWU maize balance sheets)
0.00
5.00
10.00
15.00
20.00
25.00
30.00
35.00
40.00
45.00
1998/1999 1999/2000 2000/2001 2001/2002 2002/2003 2003/2004
Marketing year
'000
met
ric to
nnes
mai
ze
Net imports Production Consumption Production & Stocks
Figure 21: Mauritius maize consumption in total and per capita for the period 1998/99 to 2003/04
(Source: based on data from SADC REWU maize balance sheets and population data)
38.20
38.30
38.40
38.50
38.60
38.70
38.80
38.90
39.00
39.10
1998/1999 1999/2000 2000/2001 2001/2002 2002/2003 2003/20040.00
5.00
10.00
15.00
20.00
25.00
30.00
35.00
40.00Net imports Consumption
Mai
ze c
onsu
mpt
ion
(kg
per c
apita
)
Marketing Year
Mai
ze c
onsu
mpt
ion
('000
met
ric to
nnes
)
362
SADC food security situation
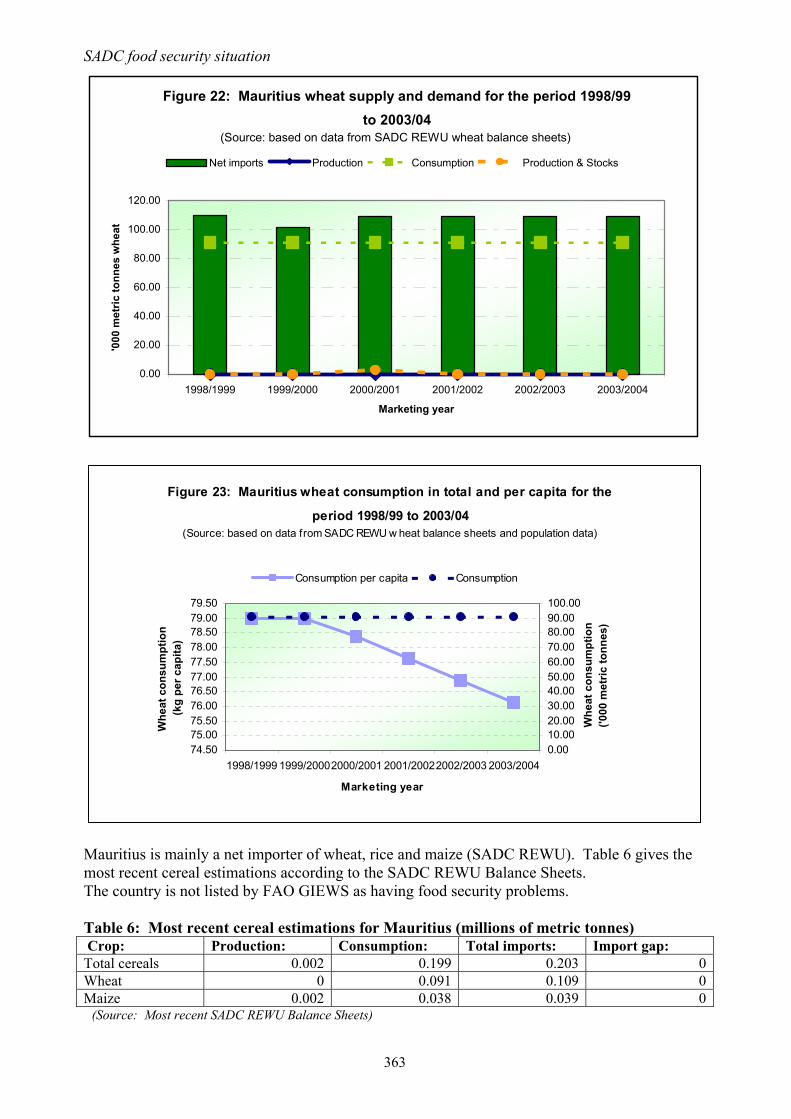
Figure 22: Mauritius wheat supply and demand for the period 1998/99 to 2003/04
(Source: based on data from SADC REWU wheat balance sheets)
0.00
20.00
40.00
60.00
80.00
100.00
120.00
1998/1999 1999/2000 2000/2001 2001/2002 2002/2003 2003/2004
Marketing year
'000
met
ric to
nnes
whe
at
Net imports Production Consumption Production & Stocks
Figure 23: Mauritius wheat consumption in total and per capita for the
period 1998/99 to 2003/04(Source: based on data from SADC REWU w heat balance sheets and population data)
74.5075.0075.5076.0076.5077.0077.5078.0078.5079.0079.50
1998/1999 1999/20002000/2001 2001/20022002/2003 2003/2004
Marketing year
Whe
at c
onsu
mpt
ion
(kg
per c
apita
)
0.0010.0020.0030.0040.0050.0060.0070.0080.0090.00100.00
Whe
at c
onsu
mpt
ion
('000
met
ric to
nnes
)
Consumption per capita Consumption
Mauritius is mainly a net importer of wheat, rice and maize (SADC REWU). Table 6 gives the most recent cereal estimations according to the SADC REWU Balance Sheets. The country is not listed by FAO GIEWS as having food security problems. Table 6: Most recent cereal estimations for Mauritius (millions of metric tonnes) Crop: Production: Consumption: Total imports: Import gap: Total cereals 0.002 0.199 0.203 0Wheat 0 0.091 0.109 0Maize 0.002 0.038 0.039 0 (Source: Most recent SADC REWU Balance Sheets)
363
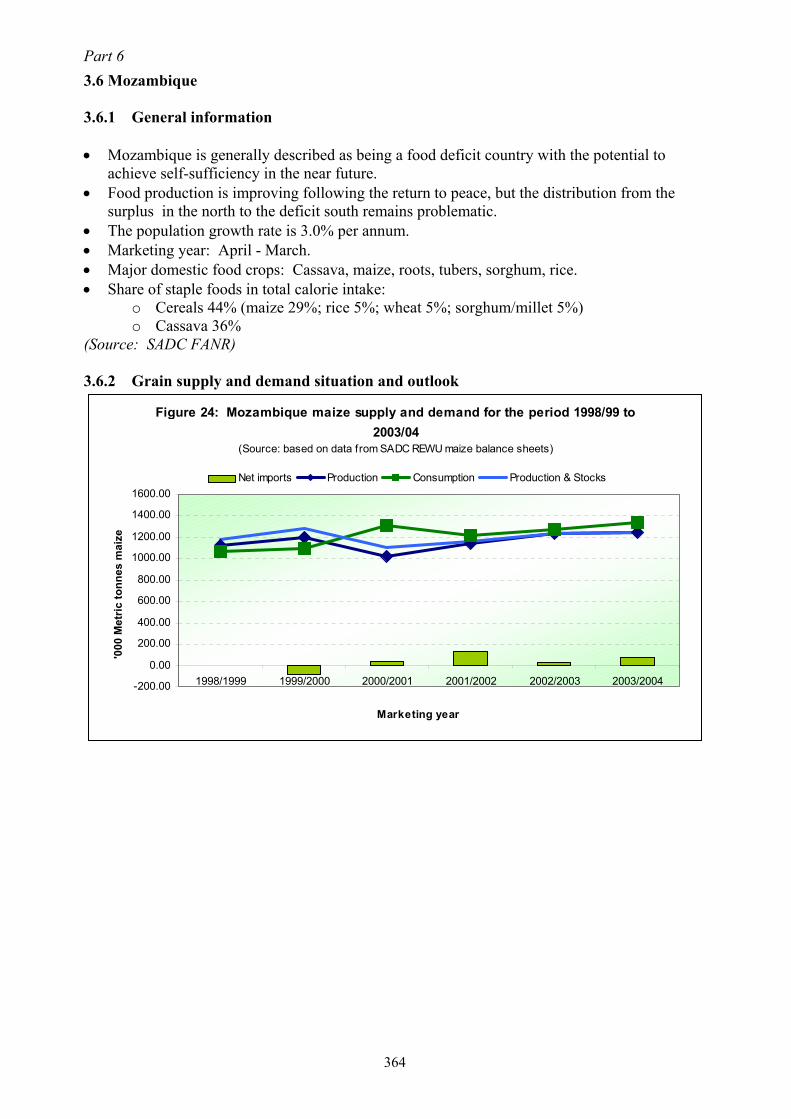
Part 6 3.6 Mozambique 3.6.1 General information • Mozambique is generally described as being a food deficit country with the potential to
achieve self-sufficiency in the near future. • Food production is improving following the return to peace, but the distribution from the
surplus in the north to the deficit south remains problematic. • The population growth rate is 3.0% per annum. • Marketing year: April - March. • Major domestic food crops: Cassava, maize, roots, tubers, sorghum, rice. • Share of staple foods in total calorie intake:
o Cereals 44% (maize 29%; rice 5%; wheat 5%; sorghum/millet 5%) o Cassava 36%
(Source: SADC FANR) 3.6.2 Grain supply and demand situation and outlook
Figure 24: Mozambique maize supply and demand for the period 1998/99 to 2003/04
(Source: based on data from SADC REWU maize balance sheets)
-200.00
0.00
200.00
400.00
600.00
800.00
1000.00
1200.00
1400.00
1600.00
1998/1999 1999/2000 2000/2001 2001/2002 2002/2003 2003/2004
Marketing year
'000
Met
ric to
nnes
mai
ze
Net imports Production Consumption Production & Stocks
364

SADC food security situation
Figure 25: Mozambique maize consumption in total and per capita for the period 1998/99 to 2003/04
(Source: based on data from SADC REWU maize balance sheets and population data)
0.00
200.00
400.00
600.00
800.00
1000.00
1200.00
1400.00
1600.00
1998/1999 1999/2000 2000/2001 2001/2002 2002/2003 2003/2004
Marketing year
Mai
ze c
onsu
mpt
ion
(kg
per c
apita
)
0.00
10.00
20.00
30.00
40.00
50.00
60.00
70.00
80.00
Mai
ze c
onsu
mpt
ion
('000
met
ric to
nnes
)
Consumption Consumption per capita
Figure 26: Mozambique estimated cereal import requirements - 2001/02, 2002/03, 2003/04
(Source: FAO GIEWS )
0
100
200
300
400
500
600
700
2001/02Commercialpurchases
2001/02 Food aid 2002/03Commercialpurchases
2002/03 Food aid 2003/04Commercialpurchases
2003/04 Food aid
Cer
eal q
uant
ity ('
000
tonn
es)
Mozambique is currently facing a food emergency, mainly due to drought in southern parts of the country and floods (FAO, GIEWS, 2003a, 2003c, 2003d). The country is classified by FAO, GIEWS (2003a) as having a food as a result of unfavourable prospects for current crops and / or uncovered shortfalls. At the national level, Mozambique has an acceptable food situation. However, the combination of the drought in southern Mozambique and the prevalence of HIV / AIDS, has led to the need for food assistance (FAO, GIEWS, 2003a, 2003b, 2003c). According to FAO, GIEWS (2003a) an estimated 950 000 people in Southern Mozambique are going to need emergency food aid in 365

Part 6 2003/04. Maize production in the main northern and central agricultural regions is expected to be above average and will consequently lead to increase maize production for the third successive year and harvesting of a bumper crop (FAO, GIEWS, 2003a, 2003b; FAO, WFP, 2003c). A major problem in Mozambique is that even though surplus production exists in the northern parts of the country, it cannot be easily transported to the southern region due to poor road and railway infrastructure (FAO / WFP, CFSAM, 2003). Rice production for the 2002/03 season is estimated at 180 000 tonnes, which is an improvement on the 2001/02 season (FAO, GIEWS, 2003b). A Crop and Food Supply Assessment was conducted by FAO and WFP during April and May 2003 (FAO, WFP, 2003c). The Mission forecast the following with respect to the 2002/03 marketing year (FAO, WFP, 2003c): • Total cereal production: 1.8 million tonnes (2.5% higher than 2001/02). • An estimated 156 000 tonnes of food aid required for an estimated 949 000 drought affected
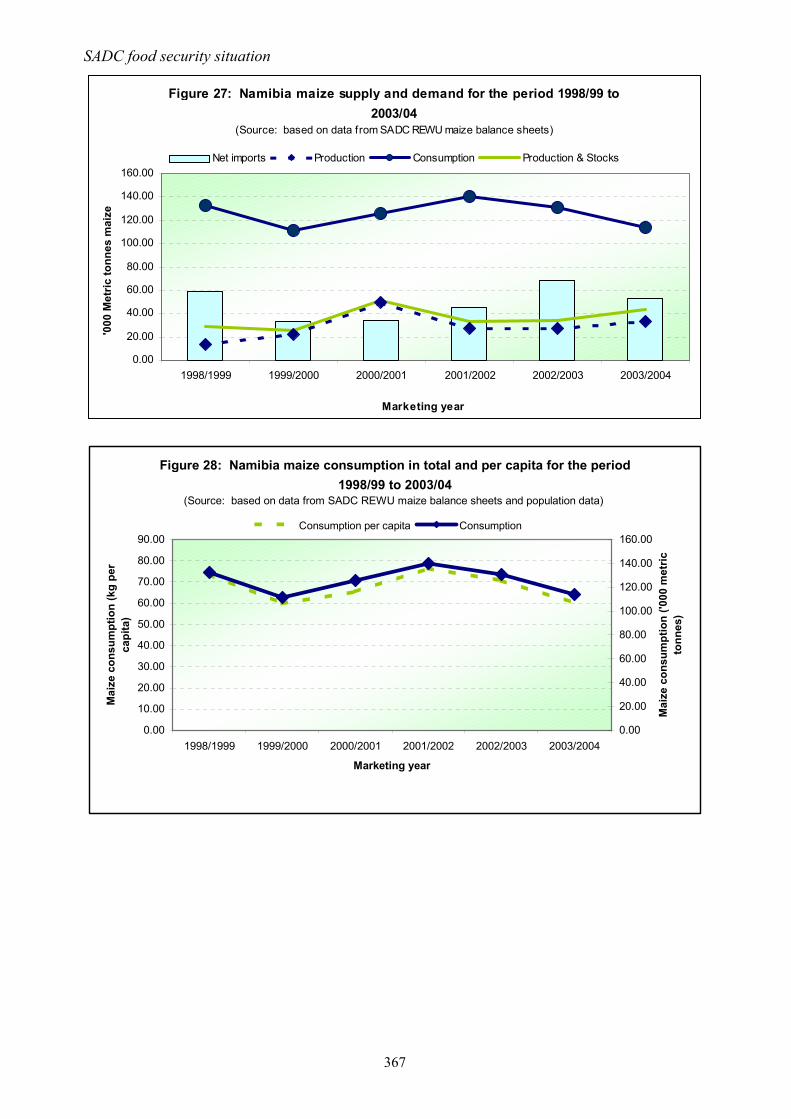
and vulnerable people in the country (especially in some central regions and the south). • Procurement of the food aid (mostly) from sources outside the country. The most recent cereal estimations according to the SADC REWU Balance Sheets are given in Table 7. Table 7: Most recent cereal estimations for Mozambique (millions of metric tonnes) Crop: Production: Consumption: Total imports: Import gap: Total cereals 1.735 2.358 0.686 0Maize 1.250 1.335 0.141 0(Source: Most recent SADC REWU Balance Sheets) 3.7 Namibia 3.7.1 General information • Namibia is generally described as an arid or semi-arid, food deficit country with cereal
production mainly in the northern parts of the country. • The population growth rate is 2.6% per annum. • Marketing year: May - April. • Major domestic food crops: Millet, maize and wheat. • Share of staple foods in total calorie intake:
o Cereals 60% (maize 23%; millet 24%, wheat 13%) (Source: SADC FANR) 3.7.2 Grain supply and demand situation and outlook
366
SADC food security situation
Figure 27: Namibia maize supply and demand for the period 1998/99 to 2003/04
(Source: based on data from SADC REWU maize balance sheets)
0.00
20.00
40.00
60.00
80.00
100.00
120.00
140.00
160.00
1998/1999 1999/2000 2000/2001 2001/2002 2002/2003 2003/2004
Marketing year
'000
Met
ric to
nnes
mai
ze
Net imports Production Consumption Production & Stocks
Figure 28: Namibia maize consumption in total and per capita for the period 1998/99 to 2003/04
(Source: based on data from SADC REWU maize balance sheets and population data)
0.00
10.00
20.00
30.00
40.00
50.00
60.00
70.00
80.00
90.00
1998/1999 1999/2000 2000/2001 2001/2002 2002/2003 2003/2004
Marketing year
Mai
ze c
onsu
mpt
ion
(kg
per
capi
ta)
0.00
20.00
40.00
60.00
80.00
100.00
120.00
140.00
160.00
Mai
ze c
onsu
mpt
ion
('000
met
ric
tonn
es)
Consumption per capita Consumption
367

Part 6
Figure 30: Namibia millet consumption in total and per capita for the period 1998/99 to 2003/04(Source: based on data from SADC REWU sorghum & millet balance sheets and population data)
0.00
5.00
10.00
15.00
20.00
25.00
30.00
35.00
40.00
45.00
1998/1999 1999/2000 2000/2001 2001/2002 2002/2003 2003/2004Marketing year
Sorg
hum
& m
illet
con
sum
ptio
n (k
g pe
r cap
ita)
0.00
10.00
20.00
30.00
40.00
50.00
60.00
70.00
80.00
90.00
Sorg
hum
& m
illet
con
sum
ptio
n ('0
00 m
etric
tonn
es)
Consumption per capita Consumption
Figure 29: Namibia millet supply and demand for the period 1998/99 to 2003/04
(Source: based on data from SADC REWU sorghum & millet balance sheets)
0.00
20.00
40.00
60.00
80.00
100.00
120.00
1998/1999 1999/2000 2000/2001 2001/2002 2002/2003 2003/2004
Marketing year
'000
met
ric to
nnes
sor
ghum
&
mill
et
Production Consumption Production & Stocks Net imports
The harvest of the 2002/03 cereal crop has been completed in Namibia. Severe dry weather in the Caprivi region lead to reduced harvests (FAO, GIEWS, 2003d). According to the official estimates the following is expected for the 2002/03 marketing year (FAO, GIEWS, 2003d, 2003e): • Total cereal production: 102 000 tonnes (38% higher than for the 2001/02 season and above
average). • Sorghum & millet production: 77 600 tonnes.
368

SADC food security situation • Maize production: 31 800 tonnes. • Wheat production: 9 500 tonnes. • Total cereal import requirement will decline to 108 000 tonnes (will be covered by
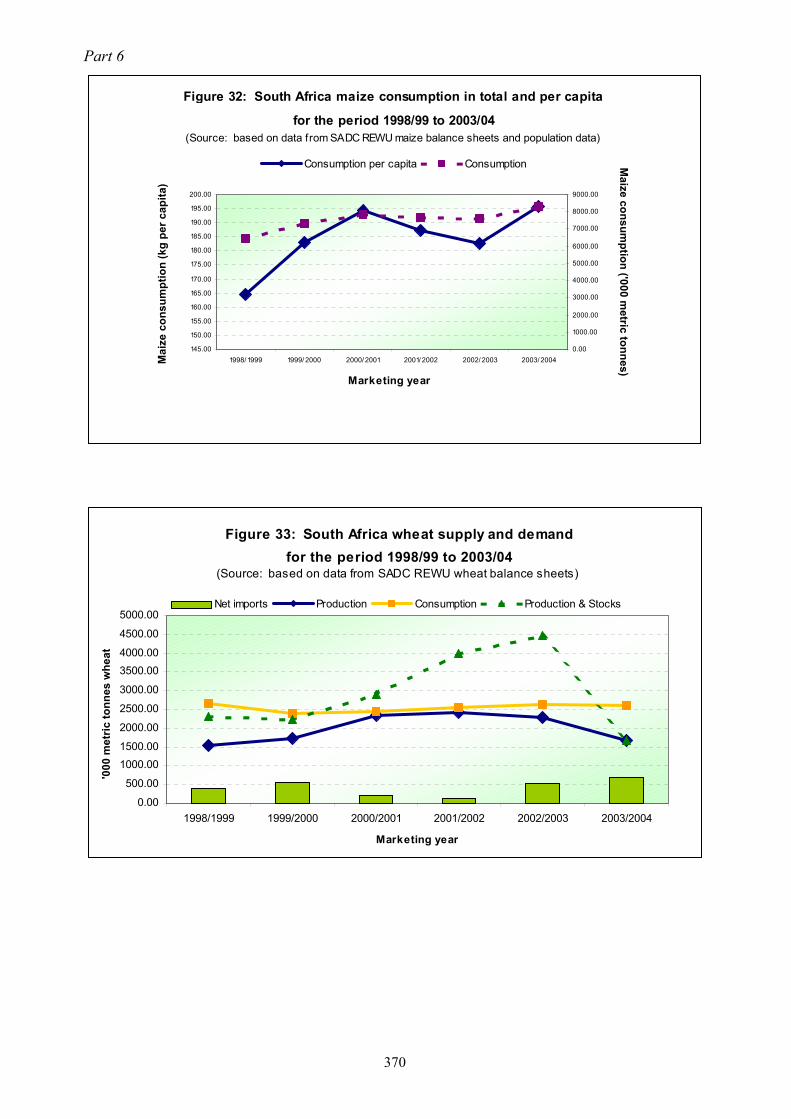
commercial imports). It is anticipated that the national food supply situation will be satisfactory during 2003/04. The most recent cereal estimations according to the SADC REWU Balance Sheets are given in Table 8. Table 8: Most recent cereal estimations for Namibia (millions of metric tonnes) Crop: Production: Consumption: Total imports: Import gap: Total cereals 0.101 0.257 0.104 0.036Maize 0.033 0.114 0.054 0.032Sorghum / Millet 0.059 0.078 0 0(Source: Most recent SADC REWU Balance Sheets) 3.8 South Africa 3.8.1 General information • South Africa is generally seen as a net food exporter (especially with respect to maize) and a
wheat importer. • The country is generally susceptible to severe periodic droughts. • Marketing year: May – April. • Major domestic food crops: Maize, Wheat. • Share of staple foods in total calorie intake:
o Cereals 54% (coarse grains 65%; wheat 31%; rice 4% (Source: SADC FANR) 3.8.2 Grain supply and demand situation and outlook
Figure 31: South Africa maize supply and demand for the period 1998/99 to 2003/04
(Source: based on data from SADC REWU maize balance sheets)
-5000.00
0.00
5000.00
10000.00
15000.00
20000.00
1998/1999 1999/2000 2000/2001 2001/2002 2002/2003 2003/2004
Marketing year
'000
Met
ric to
nnes
mai
ze
Net imports Production Consumption Production & Stocks
369
Part 6
Figure 32: South Africa maize consumption in total and per capita
for the period 1998/99 to 2003/04(Source: based on data from SADC REWU maize balance sheets and population data)
145.00
150.00
155.00
160.00
165.00
170.00
175.00
180.00
185.00
190.00
195.00
200.00
1998/ 1999 1999/ 2000 2000/ 2001 2001/ 2002 2002/ 2003 2003/ 20040.00
1000.00
2000.00
3000.00
4000.00
5000.00
6000.00
7000.00
8000.00
9000.00
Consumption per capita ConsumptionM
aize
con
sum
ptio
n (k
g pe
r cap
ita)
Marketing year
Maize consum
ption ('000 metric tonnes)
Figure 33: South Africa wheat supply and demand for the period 1998/99 to 2003/04
(Source: based on data from SADC REWU wheat balance sheets)
0.00
500.00
1000.001500.00
2000.00
2500.00
3000.00
3500.004000.00
4500.00
5000.00
1998/1999 1999/2000 2000/2001 2001/2002 2002/2003 2003/2004
Marketing year
'000
met
ric to
nnes
whe
at
Net imports Production Consumption Production & Stocks
370

SADC food security situation
Figure 34: South Africa wheat consumption in total and per capita
for the period 1998/99 to 2003/04(Source: based on data from SADC REWU w heat balance sheets and population data)
56.00
58.00
60.00
62.00
64.00
66.00
68.00
1998/1999 1999/2000 2000/2001 2001/2002 2002/2003 2003/2004
Marketing year
Kg
whe
at p
er c
apita
2250.00
2300.00
2350.00
2400.00
2450.00
2500.00
2550.00
2600.00
2650.00
2700.00
Whe
at c
onsu
mpt
ion
('000
met
ric to
nnes
)
Consumption per capita Consumption
FAO, GIEWS (2003e) reported in September 2003 that the coarse grain production in South Africa has declined by 8% to a level of 9.7 millions tonnes in the 2002/03 season. The decline can be attributed to drought in certain production areas. It is expected that export availability will remain at the 2001/02 levels, with increased levels of white maize production and decreased levels of yellow maize production (FAO, GIEWS, 2003a, 2003d). South Africa’s wheat production accounts for over 80% of the sub-region’s aggregate production (FAO, GIEWS, 2003e). Planting intentions of the 2003/04 wheat crop in June 2003 indicated a decline of 11% in the planted area (to 841 000 hectares) due to lower prices (FAO, GIEWS, 2003a). According to the first official production estimates, reported in September 2003 by FAO, GIEWS (2003e), the expected 2003/04 wheat harvest is 1.6 million tonnes (34%lower than previous year and below average). The most recent cereal estimations according to the SADC REWU Balance Sheets are given in Table 9. Table 9: Most recent cereal estimations for South Africa (millions of metric tonnes) Crop: Production: Consumption: Total imports: Import gap: Total cereals 11.655 11.150 0.980 0Maize 9.714 8.309 0.100 0Wheat 1.685 2.601 0.805 0(Source: Most recent SADC REWU Balance Sheets)
371

Part 6 3.9 Swaziland 3.9.1 General information • Swaziland is generally seen as a food deficit country but has achieved near self-sufficiency in
recent years. • The country is land-locked. • The population growth rate is 3.2% per annum. • Marketing year: May - April. • Major domestic food crops: Maize. • Share of staple foods in total calorie intake:
o Cereals 75% (maize 64%; wheat 10%; rice 1%). (Source: SADC FANR) 3.9.2 Grain supply and demand situation and outlook
Figure 35: Swaziland maize supply and demand for the period 1998/99 to 2003/04
(Source: based on data from SADC REWU maize balance sheets)
0.00
20.00
40.00
60.00
80.00
100.00
120.00
140.00
160.00
180.00
1998/1999 1999/2000 2000/2001 2001/2002 2002/2003 2003/2004Marketing year
'000
Met
ric to
nnes
mai
ze
Net imports Production Consumption Production & Stocks
372

SADC food security situation
Figure 36: Swaziland maize consumption in total and per capita for the period 1998/99 to 2003/04
(Source: based on data from SADC REWU maize balance sheets and population data)
0.00
20.00
40.00
60.00
80.00
100.00
120.00
140.00
160.00
1998/1999 1999/2000 2000/2001 2001/2002 2002/2003 2003/2004
Marketing year
Mai
ze c
onsu
mpt
ion
(kg
per c
apita
)
0.00
20.00
40.00
60.00
80.00
100.00
120.00
140.00
160.00
180.00
Mai
ze c
onsu
mpt
ion
('000
met
ric to
nnes
)
Consumption per capita Consumption
Figure 37: Swaziland wheat supply and demand for the period 1998/99 to 2003/04
(Source: based on data from SADC REWU wheat balance sheets)
0.00
5.00
10.00
15.00
20.00
25.00
30.00
35.00
40.00
45.00
50.00
1998/1999 1999/2000 2000/2001 2001/2002 2002/2003 2003/2004
Marketing year
'000
met
ric to
nnes
whe
at
Net imports Production Consumption Production & Stocks
373

Part 6
Figure 38: Swaziland wheat consumption in total and per capita for the period 1998/99 to 2003/04
(Source: based on data from SADC REWU w heat balance sheets and population data)
0.005.00
10.0015.0020.0025.00
30.0035.0040.0045.0050.00
1998/1999 1999/2000 2000/2001 2001/2002 2002/2003 2003/2004
Marketing year
Kg
whe
at p
er c
apita
0.005.0010.0015.0020.0025.00
30.0035.0040.0045.0050.00
Whe
at c
onsu
mpt
ion
('000
met
ric to
nnes
)
Consumption per capita Consumption
Figure 39: Swaziland estimated cereal import requirements - 2001/02, 2002/03, 2003/04 (Source: FAO GIEWS)
0102030405060708090
100
2001/02Commercialpurchases
2001/02 Foodaid
2002/03Commercialpurchases
2002/03 Foodaid
2003/04Commercialpurchases
2003/04 Foodaid
Cer
eal q
uant
ity ('
000
tonn
es)
2001/02 Commercial purchases 2001/02 Food aid 2002/03 Commercial purchases2002/03 Food aid 2003/04 Commercial purchases 2003/04 Food aid
Swaziland is facing a food emergency, mainly due to drought in parts of the country and also due to the effects of HIV / AIDS in the country (FAO, GIEWS, 2003a, 2003b, 2003c, 2003d). A Crop and Food Supply Assessment was conducted by FAO and WFP during May 2003. The Mission forecast the following with respect to the 2002/03 marketing year (FAO, WFP, 2003d): • Maize production: 73 000 tonnes (6% higher than for the 2001/02 season, but 30% below
the five year average for the country).
374

SADC food security situation • Due to the improvement in maize production and improved commercial import capacity, no
cereal shortages were anticipated at the national level in Swaziland. • It was estimated that 132 250 people in Swaziland required food assistance immediately (157
750 people by December 2003 and 217 000 people during the period January to March 2004).
• An estimated 24 300 tonnes of food aid was required (to be fully met by the current Government and WFP stocks and pipeline).
No cereal shortages were foreseen in 2003/04 due to improved commercial import capacity and the lower maize prices in South Africa (FAO, GIEWS, 2003d). The most recent cereal estimations according to the SADC REWU Balance Sheets are given in Table 10. Table 10: Most recent cereal estimations for Swaziland (millions of metric tonnes) Crop: Production: Consumption: Total imports: Import gap: Total cereals 0.063 0.204 0.085 0.063Maize 0.063 0.144 0.033 0.053Wheat 0 0.044 0.042 0.004(Source: Most recent SADC REWU Balance Sheets) 3.10 Tanzania 3.10.1 General information • Tanzania is generally seen as a marginally self-sufficient country with maize and rice
surpluses in some years and internal food distribution problems. • The population growth rate is 2.8% per annum. • Marketing year: June - May. • Major domestic food crops: Maize, roots, tubers, sorghum, pulses, plantains, rice. • Share of staple foods in total calorie intake:
o Cereals 38% (maize 26%; sorghum/millet 6%; rice 5%; wheat 1%) o Cassava 25% o Pulses 5% o Bananas 2% o Sweet potato 2%
(Source: SADC FANR) 3.10.2 Grain supply and demand situation and outlook
375

Part 6
Figure 40: Tanzania maize supply and demand for the period 1998/99 to
2003/04(Source: based on data from SADC REWU maize balance sheets)
-500.000.00
500.001000.001500.002000.002500.003000.003500.00
1998/1999 1999/2000 2000/2001 2001/2002 2002/2003 2003/2004
Marketing year
'000
Met
ric to
nnes
mai
zeNet imports Production Consumption Production & Stocks
Figure 41: Tanzania maize consumption in total and per capita for the period 1998/99 to 2003/04
(Source: based on data from SADC REWU maize balance sheets and population data)
0.00
20.00
40.00
60.00
80.00
100.00
120.00
1998/1999 1999/2000 2000/2001 2001/2002 2002/2003 2003/2004
Marketing year
Mai
ze c
onsu
mpt
ion
(kg
per
capi
ta)
2500.00
2600.00
2700.00
2800.00
2900.00
3000.00
3100.00
3200.00
3300.00
Mai
ze c
onsu
mpt
ion
('000
met
ric to
nnes
)
Consumption per capita Consumption
376

SADC food security situation
Figure 42: Tanzania estimated cereal import requirements - 2001/02,
2002/03, 2003/04 (Source: FAO GIEWS)
0
50
100
150
200
250
300
350
400
450
2001/02Commercialpurchases
2001/02 Foodaid
2002/03Commercialpurchases
2002/03 Foodaid
2003/04Commercialpurchases
2003/04 Foodaid
Cer
eal q
uant
ity ('
000
tonn
es)
According to FAO, GIEWS (2003a, 2003c, 2003d) Tanzania is facing a food emergency and unfavourable prospects for current crops mainly due to: • Prolonged drought in many parts of the country, especially the central, southern and eastern
regions (leading to a predicted 10% decline in food crop production in 2002/03, compared with the 2001/02 marketing year).
• Refugees. According to FAO, GIEWS (2003e) the forecast harvest for the 2003 main coarse grain crop season is 3.9 million tonnes, which represents a 10% decline from 2002. The decline can mainly be attributed to drought. The food deficit in the 2003/04 marketing year is predicted as 77 489 tonnes. An estimated 1.9 million people will need food assistance between October 2003 and March 2004. The most recent cereal estimations according to the SADC REWU Balance Sheets are given in Table 11. There is also an anticipated seed deficit of 3200 tonnes of seed with respect to the next planting season (FAO, GIEWS, 2003d). The national overall food situation in Tanzania is relatively stable. Table 11: Most recent cereal estimations for Tanzania (millions of metric tonnes) Crop: Production: Consumption: Total imports: Import gap: Total cereals 2.526 3.085 0.190 0.079Maize 3.837 5.096 0.581 0(Source: Most recent SADC REWU Balance Sheets)
377
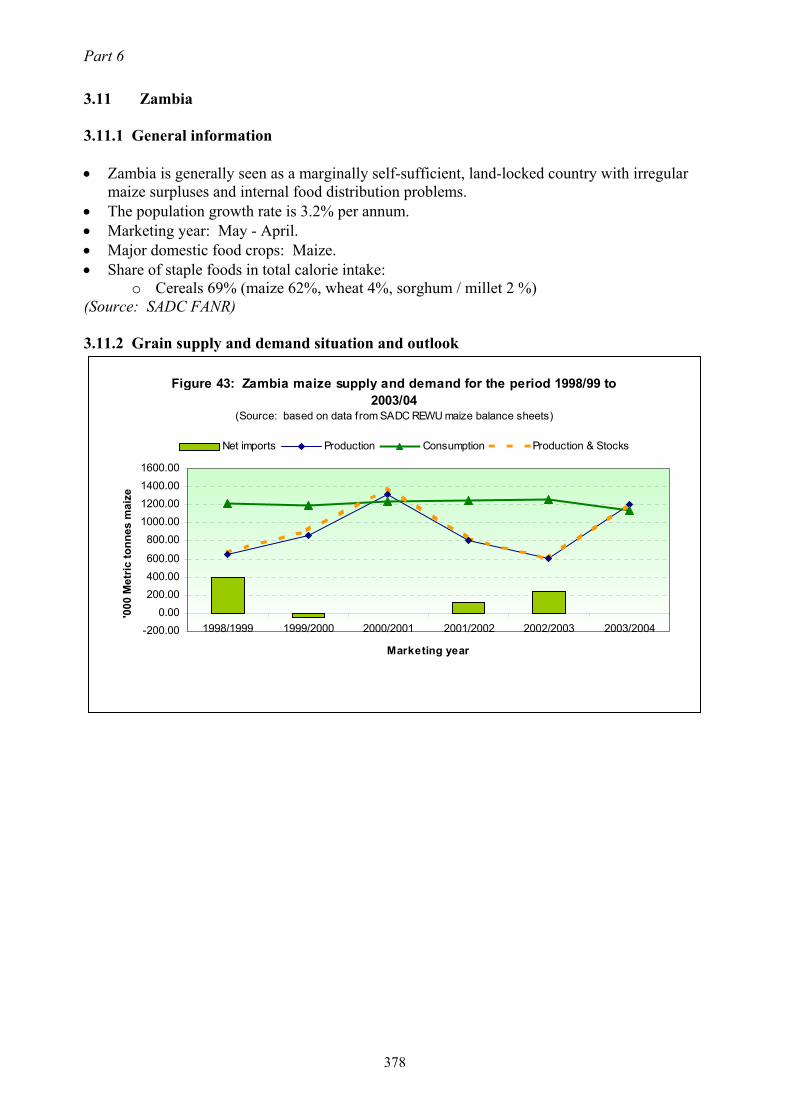
Part 6 3.11 Zambia 3.11.1 General information • Zambia is generally seen as a marginally self-sufficient, land-locked country with irregular
maize surpluses and internal food distribution problems. • The population growth rate is 3.2% per annum. • Marketing year: May - April. • Major domestic food crops: Maize. • Share of staple foods in total calorie intake:
o Cereals 69% (maize 62%, wheat 4%, sorghum / millet 2 %) (Source: SADC FANR) 3.11.2 Grain supply and demand situation and outlook
Figure 43: Zambia maize supply and demand for the period 1998/99 to 2003/04
(Source: based on data from SADC REWU maize balance sheets)
-200.000.00
200.00400.00600.00
800.001000.001200.001400.001600.00
1998/1999 1999/2000 2000/2001 2001/2002 2002/2003 2003/2004
Marketing year
'000
Met
ric to
nnes
mai
ze
Net imports Production Consumption Production & Stocks
378
SADC food security situation
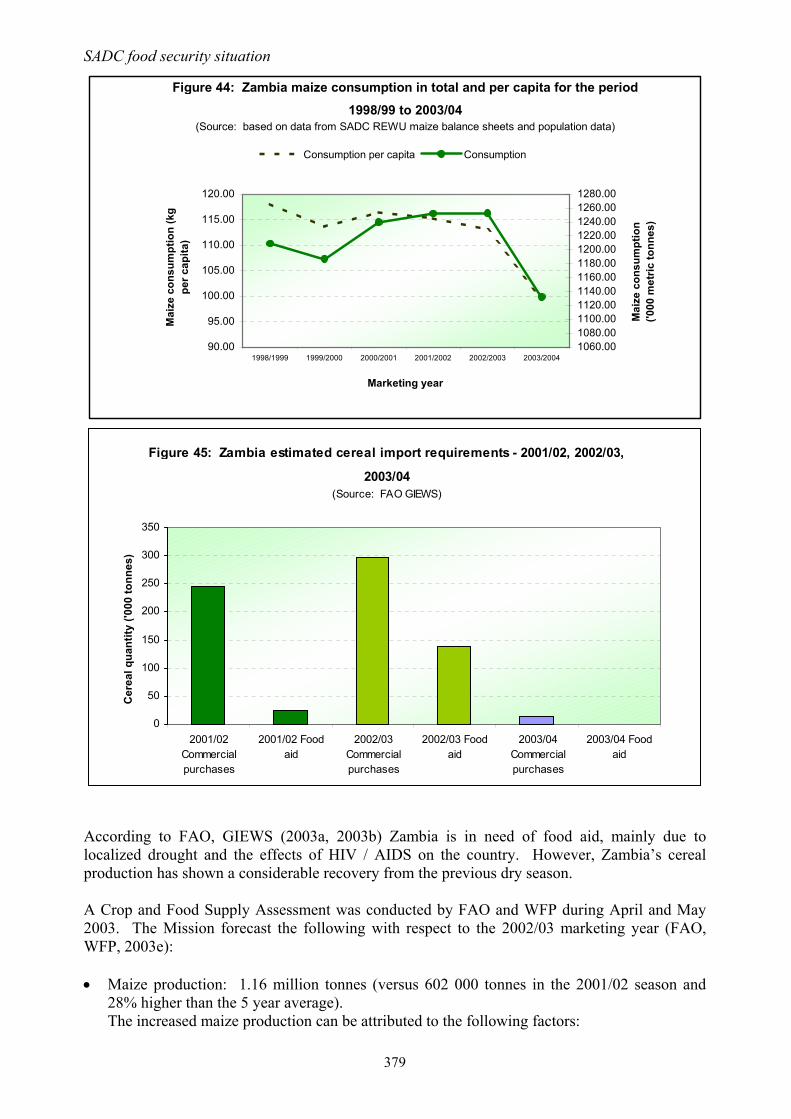
Figure 44: Zambia maize consumption in total and per capita for the period 1998/99 to 2003/04
(Source: based on data from SADC REWU maize balance sheets and population data)
90.00
95.00
100.00
105.00
110.00
115.00
120.00
1998/1999 1999/2000 2000/2001 2001/2002 2002/2003 2003/2004
Marketing year
Mai
ze c
onsu
mpt
ion
(kg
per c
apita
)
1060.001080.001100.001120.001140.001160.001180.001200.001220.001240.001260.001280.00
Mai
ze c
onsu
mpt
ion
('000
met
ric to
nnes
)
Consumption per capita Consumption
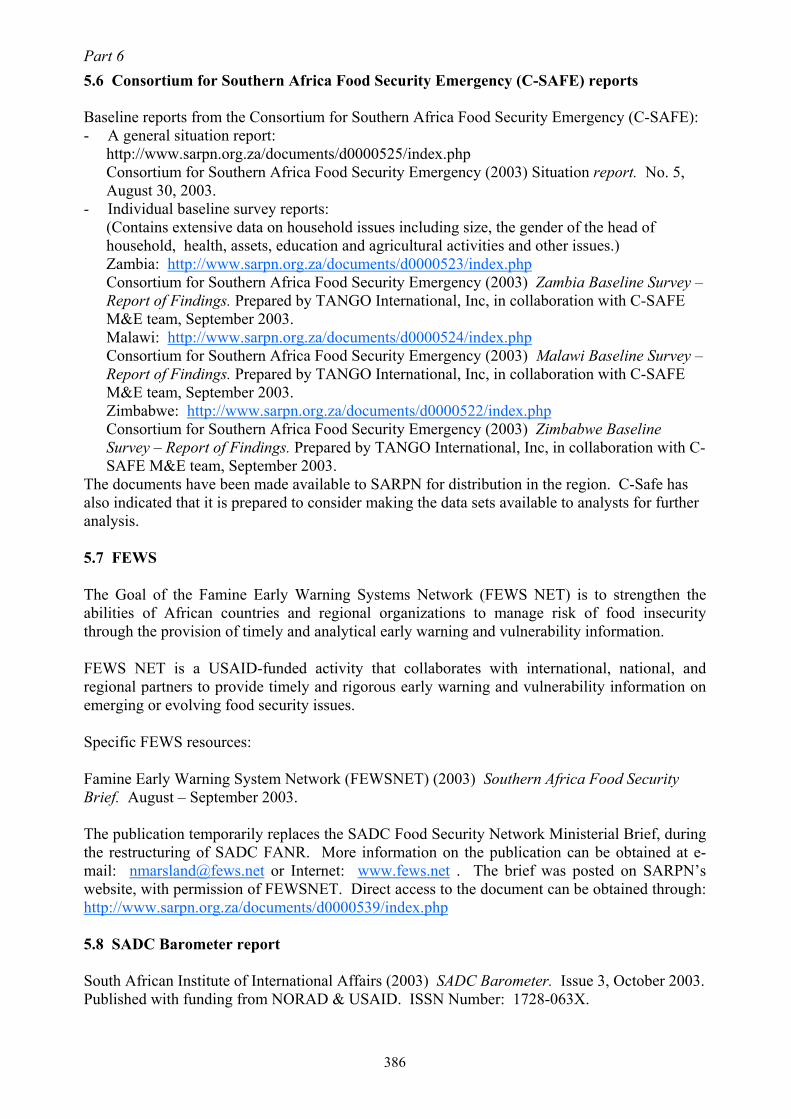
Figure 45: Zambia estimated cereal import requirements - 2001/02, 2002/03,
2003/04 (Source: FAO GIEWS)
0
50
100
150
200
250
300
350
2001/02Commercialpurchases
2001/02 Foodaid
2002/03Commercialpurchases
2002/03 Foodaid
2003/04Commercialpurchases
2003/04 Foodaid
Cer
eal q
uant
ity ('
000
tonn
es)
According to FAO, GIEWS (2003a, 2003b) Zambia is in need of food aid, mainly due to localized drought and the effects of HIV / AIDS on the country. However, Zambia’s cereal production has shown a considerable recovery from the previous dry season. A Crop and Food Supply Assessment was conducted by FAO and WFP during April and May 2003. The Mission forecast the following with respect to the 2002/03 marketing year (FAO, WFP, 2003e): • Maize production: 1.16 million tonnes (versus 602 000 tonnes in the 2001/02 season and
28% higher than the 5 year average). The increased maize production can be attributed to the following factors:
379

Part 6 o Improved rainfall. o Proper fertilizer distribution programme by the Government. o Seed provision by NGOs and Government.
• Satisfactory production of other crops such as cassava and sweet potatoes were observed. • Total cereal production: 1.32 million tonnes (80% higher than the previous season). According to FAO, GIEWS (2003e) the coarse grain output was 1.2 million tonnes in the 2002/03 marketing year, which is an 85% increase from the previous year. Targeted food assistance will be needed in areas of reduced harvest during 2003/04 (FAO, GIEWS, 2003d). The most recent cereal estimations according to the SADC REWU Balance Sheets are given in Table 12. Table 12: Most recent cereal estimations for Zambia (millions of metric tonnes) Crop: Production: Consumption: Total imports: Import gap: Total cereals 1.406 1.346 0.009 0Maize 1.207 1.132 0 0(Source: Most recent SADC REWU Balance Sheets) 3.12 Zimbabwe 3.12.1 General information • The population growth rate is 2.9% per annum. • Marketing year: April - March. • Major domestic food crops: Maize, wheat, millet, sorghum. • Share of staple foods in total calorie intake:
o Cereals 62% (maize 47%, wheat 8%, sorghum/millet 7%) (Source: SADC FANR) 3.12.2 Grain supply and demand situation and outlook
380
Figure 46: Zimbabwe maize supply and demand for the period 1998/99 to 2003/04
(Source: based on data from SADC REWU maize balance sheets)
0.00
500.00
1000.00
1500.00
2000.00
2500.00
3000.00
1998/1999 1999/2000 2000/2001 2001/2002 2002/2003 2003/2004
Marketing year
'000
Met
ric to
nnes
mai
ze
Net imports Production Consumption Production & Stocks

SADC food security situation
Figure 47: Zimbabwe maize consumption in total and per capita for the period 1998/99 to 2003/04
(Source: based on data from SADC REWU sorghum & millet balance sheets and population data)
135.00
140.00
145.00
150.00
155.00
160.00
165.00
170.00
175.00
1998/1999 1999/2000 2000/2001 2001/2002 2002/2003 2003/20041600.00
1650.00
1700.00
1750.00
1800.00
1850.00
1900.00
1950.00
2000.00
2050.00
2100.00
Consumption per capita Consumption
Marketing year
According to FAO, GIEWS (2003a, 2003d) Zimbabwe is facing an acute food emergency, mainly due to prolonged drought and ongoing economic disruption. An estimated 5.5 million people will be in need of emergency food assistance during the 2003/04 marketing year (FAO, GIEWS, 2003a, 2003b). A Crop and Food Supply Assessment was conducted by FAO and WFP during April and May 2003. The Mission forecast the following (FAO, WFP, 2003f): • 2003/04 Total cereal output for consumption: 980 000 tonnes (41% higher than 2002/03
season, 51% lower than 2000/01). • 2003/04 Maize production (803 000 million tonnes (61% higher than 2002/03, but 46%
lower than in 2000/01)). • 2003/04 Cereal import requirement: 1.3 million tonnes (including maize: 980 000 tonnes). • Anticipated commercial cereal import: 377 000 tonnes.
o 370 000 tonnes maize. o 298 000 tonnes wheat. o 9 000 tonnes rice.
• Maize deficit to be met by emergency food aid: 610 000 tonnes (since the country is experiencing an acute shortage of foreign exchange).
o 140 000 tonnes are in the pipeline. o 470 000 tonnes to be covered by additional pledges.
The most important reasons for the much lower than normal production of cereals in 2002/03 are: • Irregular rainfall. • Inadequate availability of seed and fertilizer. • Newly settled farmers not being able to utilize all the land due to lack of adequate capital and
inputs, or collateral to procure capital and inputs. According to FAO, GIEWS (2003e) the Zimbabwe wheat production is forecast at 90 000 tonnes, which is a reduction of 44% from the 2002 season. Following the land reform programme, the large-scale commercial sector in Zimbabwe only produces about one tenth of its
381

Part 6 output in the 1990s. In late May 2003 the Zimbabwe government raised the maize meal price four-fold. This will mean even worse access to the available food supplies for the most vulnerable population in the country (FAO, GIEWS, 2003d). The most recent cereal estimations according to the SADC REWU Balance Sheets are given in Table 13. Table 13: Most recent cereal estimations for Zimbabwe (millions of metric tonnes) Crop: Production: Consumption: Total imports: Import gap: Total cereals 1.185 2.272 0.573 0.699Maize 0.945 1.764 0.492 0.626(Source: Most recent SADC REWU Balance Sheets) 4. The SADC region: Summary of current food supply situation The purpose of this section is to provide an overview of the current food supply situation in the SADC region as a whole. Figures 49 and 50 display the maize and wheat supply and demand for the SADC region (excluding South Africa) for the period 1998/99 to 2003/04.
Figure 48: SADC (excluding South Africa) maize supply and demand for the period 1998/99 to 2003/04
(Source: based on data from SADC REWU maize balance sheets)
0.00
2000.00
4000.00
6000.00
8000.00
10000.00
12000.00
1998/1999 1999/2000 2000/2001 2001/2002 2002/2003 2003/2004
Marketing year
'000
Met
ric to
nnes
mai
ze
Total imports (SADC excl SA) Production (SADC excl SA)
Consumption (SADC excl SA) Production & Stocks (SADC excl SA)
382

SADC food security situation
Figure 49: SADC (excluding South Africa) wheat supply and demand for the period 1998/99 to 2003/04
(Source: based on data from SADC REWU w heat balance sheets)
0.00200.00400.00600.00800.00
1000.001200.001400.001600.001800.00
1998
/1999
1999
/2000
2000
/2001
2001
/2002
2002
/2003
2003
/2004
Marketing year
'000
met
ric to
nnes
whe
at
Total imports (SADC excl SA) Production (SADC excl SA)
Consumption (SADC excl SA) Production & Stocks (SADC excl SA)
After a serious food crisis during the recent past the food supply situation in southern Africa has eased due to the new harvest, even though the harvest is still below average (FAO, GIEWS, 2003a, 2003b). Production in most SADC countries has recovered from the reduced harvests of the previous two years. Despite a delay in the start of the rains and localized dry spells in the first part of the season, abundant rain has fallen since mid-February (FAO, GIEWS, 2003c). Southern Africa’s aggregate 2003/04 cereal import requirement is estimated at 3.8 million tonnes (below the 2002/03 level). Commercial imports are estimated at 3.5 million tonnes, leaving a food aid requirement of 0.3 million tonnes (latest SADC REWU cereal balance sheets). According to FEWSNET (2003) (based on SADC FANR information) the unfilled cereal import gap in Zimbabwe was more than 700 000 metric tonnes at 31 August 2003 with Angola and Tanzania also facing substantial uncovered import gaps of 550 000 MT and 360 000 MT respectively. According to the latest estimates by the FAO reported in FAO, GIEWS (2003e) (September 2003), the estimated aggregate SADC 2002/03 coarse grain output is estimated as 16.5 million tonnes (5% higher than 2002 and above average). Maize production is estimated as 15.3 million tonnes (5% increase from previous year) mainly due to favourable weather conditions. The harvest outcome at national level was varied. Maize prices have declined considerably in several countries in the sub-region, improving access to food for poorer and vulnerable segments of the population (FAO, GIEWS, 2003a). Table 14 displays the maize import requirements for the SADC countries (excluding DRC) with and without desired stock replenishment.
383

Part 6 Table 14: Maize import requirements for SADC countries (excluding DRC) with and without desired stock replenishment for the 2002/03 and 2003/04 production seasons.
Import requirements / Exportable surplus With no stock replenishment With desired stock replenishment
Country* 2003/04 2002/03 2003/04 2002/03 Angola -98,000 -297,000 -148,000 -347,000Botswana -115,000 -110,000 -127,000 -130,000Lesotho -167,000 -163,000 -177,000 -173,000Malawi 50,000 -672,000 -50,000 -732,000Mozambique -59,000 -22,300 -59,000 -22,300Namibia -74,000 -97,100 -84,000 -107,100RSA 2,105,000 1,890,600 1,074,000 984,600Swaziland -81,000 -75,800 -84,000 -78,800Tanzania -335,000 -162,000 -485,000 -312,200Zambia 175,000 -624,000 119,000 -639,000Zimbabwe -790,000 -1,479,100 -1,040,000 -1,979,000TOTAL: 611,000 -1,810,900 1,060,000 -3,535,800(Source: SADC FANR as reported by FEWSNET Southern African Food Security Brief, August – September 2003) (* No data was available for Mauritius, Seychelles and DRC) It is evident from Table 14 that a maize surplus of 611 000 MT is expected in the 2003/04 season (compared with the 1.8 million MT deficit of 2002/03). When the desired stock replenishment is taken into account, the SADC region maize deficit comes to 1.1 million MT (compared with the 3.5 million MT deficit of 2002/03). The improved situation can be attributed to decreased shortfalls in countries such as Angola, Zambia and Zimbabwe. Increased import requirements were observed in Tanzania, Mozambique, Lesotho, Botswana and Swaziland. The 2003/04 SADC regional import requirements will be below the 1998/99 to 2002/03 average level (FEWSNET, 2003). According to the latest SADC REWU maize balance sheets, the predictions for the 2003/04 maize season are: - Production (gross harvest): 18.4 million tonnes. - Consumption (gross domestic requirements): 19.2 million tonnes. - Total commercial imports: 1.2 million tonnes. - Total food aid imports: 0.2 million tonnes. According to early and more recent information, the overall prospects for the 2003 wheat crop (to be harvested October / November) is unfavourable, mainly due to the reduction in the area of wheat planted (FAO, GIEWS, 2003b, 2003e). The FAO’s estimate of the SADC production of wheat in 2002 indicates an average output of 2.5 million tonnes (FAO, GIEWS, 2003b). According to the latest SADC REWU wheat balance sheets, the predictions for the 2003/04 wheat season are: - Production (gross harvest): 2.1 million tonnes. - Consumption (gross domestic requirements): 4.2 million tonnes. - Total commercial imports: 1.7 million tonnes. - Total food aid imports: 77 000 tonnes.
384

SADC food security situation 5. Overview of information sources on the SADC region and food security 5.1 Data information sources SADC REWU Cereal Balance sheets obtained from Phumzile Mdladla at FANR SADC. E-mail address: [email protected] . Rona Beukes, ASD: Food Security Statistics, Directorate Agricultural Statistics, National Department of Agriculture, Tel: +27-12-319 6154, Fax: +27-12-319 6267, E-mail: [email protected] . 5.2 FAO, GIEWS publications - Foodcrops and shortages. - Food outlook. - Food supply situation and crop prospects in Sub-Saharan Africa. Available at: http://www.fao.org/giews/english/giewse.htm 5.3 FAO & WFP publications Special reports on various countries experiencing food supply problems. Available at: http://www.fao.org/giews/english/giewse.htm 5.4 SADC Barometer SADC Barometer is a new quarterly analysis by the South African Institute of International Affairs, which focuses on key issues and trends affecting the Southern African Development Community. It is part of a two-year NORAD-funded project to monitor progress toward regional integration and development. Obtained from: Sanusha Naidu (Ms) Research Specialist Integrated Rural and Regional Development HSRC Durban South Africa 083 637 0903 (mobile) Fax No. 27 (0)31 273 1403 http://www.hsrc.ac.za http://www.sarpn.org.za 5.5 USAID Occasional papers Haddad, L & Frankenberger, T. (2003) Integrating relief and development to accelerate reductions in food insecurity in shock-prone areas. Occasional Paper No. 2, June 2003, USAID Office of Food for Peace. It can be accessed directly at: http://www.sarpn.org.za/documents/d0000519/index.php
385
Part 6 5.6 Consortium for Southern Africa Food Security Emergency (C-SAFE) reports Baseline reports from the Consortium for Southern Africa Food Security Emergency (C-SAFE): - A general situation report:
http://www.sarpn.org.za/documents/d0000525/index.php Consortium for Southern Africa Food Security Emergency (2003) Situation report. No. 5, August 30, 2003.
- Individual baseline survey reports: (Contains extensive data on household issues including size, the gender of the head of household, health, assets, education and agricultural activities and other issues.) Zambia: http://www.sarpn.org.za/documents/d0000523/index.php Consortium for Southern Africa Food Security Emergency (2003) Zambia Baseline Survey – Report of Findings. Prepared by TANGO International, Inc, in collaboration with C-SAFE M&E team, September 2003. Malawi: http://www.sarpn.org.za/documents/d0000524/index.php Consortium for Southern Africa Food Security Emergency (2003) Malawi Baseline Survey – Report of Findings. Prepared by TANGO International, Inc, in collaboration with C-SAFE M&E team, September 2003. Zimbabwe: http://www.sarpn.org.za/documents/d0000522/index.php Consortium for Southern Africa Food Security Emergency (2003) Zimbabwe Baseline Survey – Report of Findings. Prepared by TANGO International, Inc, in collaboration with C-SAFE M&E team, September 2003.
The documents have been made available to SARPN for distribution in the region. C-Safe has also indicated that it is prepared to consider making the data sets available to analysts for further analysis. 5.7 FEWS
The Goal of the Famine Early Warning Systems Network (FEWS NET) is to strengthen the abilities of African countries and regional organizations to manage risk of food insecurity through the provision of timely and analytical early warning and vulnerability information.
FEWS NET is a USAID-funded activity that collaborates with international, national, and regional partners to provide timely and rigorous early warning and vulnerability information on emerging or evolving food security issues.
Specific FEWS resources:
Famine Early Warning System Network (FEWSNET) (2003) Southern Africa Food Security Brief. August – September 2003. The publication temporarily replaces the SADC Food Security Network Ministerial Brief, during the restructuring of SADC FANR. More information on the publication can be obtained at e-mail: [email protected] or Internet: www.fews.net . The brief was posted on SARPN’s website, with permission of FEWSNET. Direct access to the document can be obtained through: http://www.sarpn.org.za/documents/d0000539/index.php 5.8 SADC Barometer report South African Institute of International Affairs (2003) SADC Barometer. Issue 3, October 2003. Published with funding from NORAD & USAID. ISSN Number: 1728-063X.
386

SADC food security situation Quarterly publication available at: www.wits.ac.za/saiia . Direct subscriptions, comments and suggestions with respect to the publication can be addressed to [email protected] . 5.9 FIVIMS Food Insecurity and Vulnerability Information and Mapping Systems ( FIVIMS) are networks of national information systems that assemble, analyse and disseminate data on food insecurity and vulnerability. Information available at: http://www.fivims.net 6. Conclusion After a serious food crisis in the recent past the food supply situation in southern Africa has eased due to the new harvest. The total SADC regional cereal production during the 2002/03 seasons was 4% above the 1997/98 to 2001/02 average level. Regional maize production was approximately 10% higher than during 2001/02, while the regional production of wheat, sorghum and millet decreased somewhat from 2001/02. Prevailing drought conditions in many regions within the SADC region is a cause of concern. A maize surplus of 611 000 MT is expected in the 2003/04 season (compared with the 1.8million MT deficit of 2002/03) with no stock replenishment is taken into account. When the desired stock replenishment is taken into account, the SADC region maize deficit comes to 1.1 million MT (compared with the 3.5 million MT deficit of 2002/03). The improved situation can be attributed to decreased shortfalls in countries such as Angola, Zambia and Zimbabwe. Increased import requirements were observed in Tanzania, Mozambique, Lesotho, Botswana and Swaziland. The 2003/04 SADC regional import requirements were below the 1998/99 to 2002/03 average levels. According to the latest SADC REWU cereal balance sheets, the 2003/04 cereal predictions are: - Production (gross harvest): 22.934 million tonnes. - Consumption (gross domestic requirements): 27.269 million tonnes. - Total commercial imports: 3.477 million tonnes. - Total food aid imports: 0.334 million tonnes. According to the latest SADC REWU maize balance sheets, the predictions for the 2003/04 maize season (compared with the 2002/03 season) are: - Production (gross harvest): 18.4 million tonnes (increase from 16.265 million tonnes in
2002/03) - Consumption (gross domestic requirements): 19.2 million tonnes (increase from 18.864
million tonnes in 2002/03). - Total commercial imports: 1.2 million tonnes. (decrease from 2.579 million tonnes in
2002/03). - Total food aid imports: 0.2 million tonnes. (decrease from 0.856 million tonnes in 2002/03). Within the countries of the SADC region there are various levels of food emergencies. The countries with no food emergencies are Mauritius, Namibia and South Africa. The countries with some food supply problems are Botswana, Malawi and Zambia. The countries with serious food supply problems are Angola, Lesotho, Mozambique, Swaziland, Tanzania and Zimbabwe.
387

Part 6 In the report comprehensive list of resources were discussed where information were and could be obtained on the SADC food situation. It is important that this report should be updated regularly to carefully monitor the SADC food supply and demand situation. It is important to note that an enormous amount of information is available on the subject. It could be suggested that coordination with other institutions working on SADC food security could prove to be valuable in the future. References FAMINE EARLY WARNING SYSTEM NETWORK (FEWSNET) (2003) Southern Africa Food Security Brief. August – September 2003. FOOD AND AGRICULTURE ORGANIZATION OF THE UNITED NATIONS (FAO), GLOBAL INFORMATION AND EARLY WARNING SYSTEM ON FOOD AND AGRICULTURE (GIEWS). (2003a). Foodcrops and Shortages. No. 2, June 2003. Available at: http://www.fao.org/giews/english/giewse.htm FOOD AND AGRICULTURE ORGANIZATION OF THE UNITED NATIONS (FAO), GLOBAL INFORMATION AND EARLY WARNING SYSTEM ON FOOD AND AGRICULTURE (GIEWS). (2003b). Foodcrops and Shortages. No. 3, August 2003. Available at: http://www.fao.org/giews/english/giewse.htm FOOD AND AGRICULTURE ORGANIZATION OF THE UNITED NATIONS (FAO), GLOBAL INFORMATION AND EARLY WARNING SYSTEM ON FOOD AND AGRICULTURE (GIEWS). (2003c). Food Outlook. No. 3, June 2003. Available at: http://www.fao.org/giews/english/giewse.htm FOOD AND AGRICULTURE ORGANIZATION OF THE UNITED NATIONS (FAO), GLOBAL INFORMATION AND EARLY WARNING SYSTEM ON FOOD AND AGRICULTURE (GIEWS). (2003d). Food supply situation and crop prospects in Sub-Saharan Africa. No. 1, May 2003. Available at: http://www.fao.org/giews/english/giewse.htm FOOD AND AGRICULTURE ORGANIZATION OF THE UNITED NATIONS (FAO), GLOBAL INFORMATION AND EARLY WARNING SYSTEM ON FOOD AND AGRICULTURE (GIEWS). (2003e). Food Outlook. No. 4, September 2003. Available at: http://www.fao.org/giews/english/giewse.htm FOOD AND AGRICULTURE ORGANIZATION OF THE UNITED NATIONS (FAO) & WORLD FOOD PROGRAMME (WFP). (2003). Special report – FAO / WFP crop and food supply assessment mission to Lesotho 10 June 2003. Available at: http://www.fao.org/giews/english/giewse.htm FOOD AND AGRICULTURE ORGANIZATION OF THE UNITED NATIONS (FAO) & WORLD FOOD PROGRAMME (WFP). (2003). Special report – FAO / WFP crop and food supply assessment mission to Malawi 9 June 2003. Available at: http://www.fao.org/giews/english/giewse.htm FOOD AND AGRICULTURE ORGANIZATION OF THE UNITED NATIONS (FAO) & WORLD FOOD PROGRAMME (WFP). (2003). Special report – FAO / WFP crop and food supply assessment mission to Mozambique 200 June 2003.
388
SADC food security situation Available at: http://www.fao.org/giews/english/giewse.htm FOOD AND AGRICULTURE ORGANIZATION OF THE UNITED NATIONS (FAO) & WORLD FOOD PROGRAMME (WFP). (2003). Special report – FAO / WFP crop and food supply assessment mission to Swaziland 9 June 2003. Available at: http://www.fao.org/giews/english/giewse.htm FOOD AND AGRICULTURE ORGANIZATION OF THE UNITED NATIONS (FAO) & WORLD FOOD PROGRAMME (WFP). (2003). Special report – FAO / WFP crop and food supply assessment mission to Zambia 10 June 2003. Available at: http://www.fao.org/giews/english/giewse.htm FOOD AND AGRICULTURE ORGANIZATION OF THE UNITED NATIONS (FAO) & WORLD FOOD PROGRAMME (WFP). (2003). Special report – FAO / WFP crop and food supply assessment mission to Zimbabwe 19 June 2003. Available at: http://www.fao.org/giews/english/giewse.htm SADC FANR, http://www.sadc-fanr.org.zw SADC REWU Balance sheets was received from Phumzile Mdladla at FANR SADC [email protected] THE WORLD BANK (2003) World Development Indicators Database. April 2003. http://www.worldbank.org
389