part 7 preliminary hydrological evaluation resultopen_jicareport.jica.go.jp/pdf/12037636_04.pdf ·...
TRANSCRIPT

Part 7 Preliminary Hydrological Evaluation Result

Final Report (Supporting_MP) Part 7 Preliminary Hydrological Evaluation Results
JICA Project for the Master Plan Study of 7-1 August, 2011 Hydropower Development in Indonesia
PART 7 PRELIMINARY HYDROLOGICAL EVALUATION RESULTS
7.1 RUNOFF DATA
7.1.1 COLLECTED DATA IN HPPS2
There is difficulty for collecting long-term runoff data. In the former study as HPPS2, stations which had relatively long term runoff records were selected as the Key Stream Gauges. The runoff data of the key stream gauges was supplemented with supplemental stream gauges. 43 key stream gauges were selected in whole Indonesia. The data source is listed below.
Research Institute for Water Resources Development under Ministry of Public Works (Pusat Penelitian dan Pengembangan Sumber Daya Air: PUSAIR, formerly DPMA): PUSAIR is in charge for data collection and data processing of runoff data in whole Indonesia, which is located in Bandung.
PLN-LMK Observation Network: It is the observation network of rainfall, runoff and water level which was constructed by PLN, which is one of the counter parts of this study. PLN-LITBANG which is the research center of PLN is in charge of data collection and compilation.
Project Reports: The runoff data collected from PUSAIR and PLN-LITBANG did not cover whole Indonesia. Existing hydrology reports on various hydropower and water resources development projects were collected to supplement the monthly runoff records especially in Kalimantan, Sulawesi and Irian Jaya where available runoff data were scarce and limited.
7.1.2 DATA COLLECTION
Runoff data of the key stream gauges which is recorded after HPPS2 is collected from PUSAIR and PLN-LITBANG in this study.
31 stations of the 43 key stream gauges have station ID of PUSAIR. Daily runoff records at 27 stations of 31 are collected.
5 stations of the 43 key stream gauges have station ID of PLN. Daily runoff records at 2 stations of 5 and daily water level records at 2 stations of 5 are collected. Data collection and

Final Report (Supporting_MP) Part 7 Preliminary Hydrological Evaluation Results
JICA Project for the Master Plan Study of 7-2 August, 2011 Hydropower Development in Indonesia
compilation in PLN does not work effectively in recent years, after the responsibility of observation transferred to local branch of PLN from head office in 1993. It works only in West Java province and West Sumatra province. The list of station is shown in Table 1 and data availability is presented in Figure 1. The runoff data is attached in Appendix.
9 stations of the 43 key stream gauges were collected from project reports in HPPS2. Additional data at these stations cannot be collected and only data at surrounding stations is collected with cooperation of PLN-LITBANG. The list of station is shown in Table 1 and data availability is presented in Figure 1. The runoff data is attached in Appendix.
7.1.3 DATA AVAILABILITY OF HYDROLOGICAL DATA
There are forty three of the key stream gauges in whole Indonesia. Runoff data at 29 stations of 43 are collected in this study. The list of key stream gauges is shown in Table 2 and data availability is presented in Figure 2.
7.2 RAINFALL DATA
7.2.1 COLLECTED DATA IN HPPS2
In HPPS2, rainfall data were collected in/around basins of 20 stations of the 43 key stream gauges, and the basin mean rainfall was calculated with arithmetic mean. There were scarce rainfall data in/around the other 23 stations.
7.2.2 DATA AVAILABILITY OF HYDROLOGICAL DATA
Additional rainfall data in/around basins of key stream gauges which is recorded after HPPS2 is collected from BMKG. Besides, rainfall data stored in Hydro-Inventory Database (HIDB) constructed in HPPS2 is collected. The list of stations is shown in Table 3 and Table 4. The data is attached in Appendix.
7.3 LOWFLOW ANALYSIS
7.3.1 GENERAL APPROACH
In HPPS2, monthly runoff records at the key stream gauges were supplemented by monthly runoff records at surrounding stations, and then the data was extended to 30 years with Synthetic Flow Analysis. Non-dimensional runoff data was calculated from the extended runoff data. In each project scheme, a duration curve or a storage-draft curve could be

Final Report (Supporting_MP) Part 7 Preliminary Hydrological Evaluation Results
JICA Project for the Master Plan Study of 7-3 August, 2011 Hydropower Development in Indonesia
estimated from non-dimensional runoff data with a catchment area and a basin mean rainfall.
In this study, lowflow of the key stream gauges is estimated with calculating the change of rate of runoff or rainfall from HPPS2 to the present.
7.3.2 RUNOFF ESTIMATION
1) Monthly Mean Runoff Calculation
Monthly mean runoff is calculated in the following procedure, because the collected data in this study is on daily basis.
If there is only less than 15 daily runoff data in a month, then the monthly runoff is decided as missing. If there is more than 16 daily runoff data in a month, then the monthly runoff is calculated with averaging daily runoff records in the month. The list of calculated monthly runoff data is listed in Table 5 to Table 47.
2) Difference between lowflow in HPPS2 and additional lowflow in this study
The difference between lowflow in HPPS2 and additional lowflow in this study is estimated in the following equation.
)()(
AH
AAHHNN
NQNQQ +∗+∗=
1−=HQ
QRc
where, Q : Calculated runoff (m3/s) HQ : Annual mean runoff estimated in HPPS2 (m3/s) AQ : Annual mean runoff of collected runoff data in this study (m3/s) HN : Number of data in HPPS2 AN : Number of data collected in this study
Rc : Rate of change
The result is listed in Table 48.
7.3.3 RAINFALL ESTIMATION
In the previous chapter, lowflow at 23 station of the 43 key stream gauges are estimated, however there is no runoff data at the other 20 stations. Then there are rainfall records at 7 stations of 20 stations, and lowflow were estimated with rainfall records.
Basin mean rainfalls are estimated with the following two methods in HPPS2.

Final Report (Supporting_MP) Part 7 Preliminary Hydrological Evaluation Results
JICA Project for the Master Plan Study of 7-4 August, 2011 Hydropower Development in Indonesia
A basin mean rainfall is estimated with arithmetic mean method, if there are rainfall gauging stations in/around the basin.
A basin mean rainfall is estimated with Isohyetal map, if there is no rainfall gauging station in/around the basin.
The changing rates of basin mean rainfalls at the key stream gauges are calculated here, where the basin mean rainfall is estimated with arithmetic mean method. The equation is shown in below.
)()(
iAiH
iAiAiHiHi NN
NRNRR +∗+∗=
1−=iH
ii R
RRc
n
RcRc
n
ii∑
=
where, iR : Calculated rainfall at station “i” (mm) iHR : Annual rainfall in HPPS2 at station “i” (mm) iAR : Annual rainfall calculated from collected data in this study
at station “i” (mm) iHN : Number of data in HPPS2 at station “i” iAN : Number of data collected in this study at station “i” iRc : Rate of change at station “i”
Rc : Rate of change n : Number of stations
The results are presented in Table 49 to Table 56.
7.3.4 LOWFLOW ANALYSIS
The results of lowflow analysis are shown in Table 57. The lowflow analysis with rainfall records is given by the following equation.
)1( +×= RcQQ H
where, Q : Calculated runoff (m3/s) HQ : Annual mean runoff estimated in HPPS2 (m3/s)
Rc : Rate of change

Final Report (Supporting_MP) Part 7 Preliminary Hydrological Evaluation Results
JICA Project for the Master Plan Study of 7-5 August, 2011 Hydropower Development in Indonesia
7.4 FOLLOW UP OF WATER LEVEL GAUGES PROPOSED IN HPPS2
Installation of new water level gauges at 21 basins was proposed in HPPS2.
The result of proposal is confirmed in this study with cooperation of PLN-LITBANG. It is found that four gauges are operated presently. The list of basins is shown in below.
River Basin Basin No. Island Major Scheme
PresentStatus
A. Padang Guci 113 Sumatera Padang Guci-2 -Bt. Indrapura 141 Sumatera Air Batang-1 &2 -Bt. Airtuik 147 Sumatera Tumpatih-1, Air Tuik -Bt. Anai 155 Sumatera Anai-1 -A. Kolang 183 Sumatera Raisan-1 -S. Sembakung 003 Kalimantan Sembakung-3 -S. Sesayap 004 Kalimantan Sesayap-4, 11, 12, 15, & 20 -S. Karana 100 Sulawesi Karana-1 & 2 -S. Lariang 106 Sulawesi Lariang-6, 7, 8, & 9 activeS. Tuuga 013 Irian Jaya Jawee-2, 3 &4 , Endere-1 & 2 -S. Omba 015 Irian Jaya Titinima-3 -S. Mareder 020 Irian Jaya Mareder activeS. Mutri 026 Irian Jaya Muturi-1 -S. Kladuk 032 Irian Jaya Kladuk-1 & 2 -S. Waryori 036 Irian Jaya Waryori-4 -S. Ransiki 037 Irian Jaya Gita/ Ransiki-1 -S. Wapoga 043 Irian Jaya Derewo-6 & 7 -S. Caraulun 012 Timor Be Lulic-1 -W. Mala 002 Seram Mala-1 & 2 activeW. Tala 012 Seram Tala activePulau Taliabu 013 Taliabu, Maruku Wei Miha -

Final Report (Supporting_MP) Part 7 Preliminary Hydrological Evaluation Results
JICA Project for the Master Plan Study of 7-6 August, 2011 Hydropower Development in Indonesia
7.5 PREDICTION OF CLIMATE CHANGE
The fourth assessment report (AR4) of the Intergovernmental Panel on Climate Change (IPCC) has been published in 2007. AR4 prediction about rainfall and runoff is listed below.
Heavy precipitation events frequency increases over most areas ‘very likely’.
Area affected by drought increase ‘likely’.
Focusing runoff in Indonesia, it has been predicted that annual mean runoff slightly increase as following figure.
Source: IPCC AR4 SYR Figure3.5

Final Report (Supporting_MP) Part 7 Preliminary Hydrological Evaluation Results
JICA Project for the Master Plan Study of 7-7 August, 2011 Hydropower Development in Indonesia
Table 1 List of Collected Data from PLN-LITBANG
No.
Sta
tion N
ame
Riv
er
Bas
inP
rovi
nce
Gau
ge ID
by
HP
PS2
Gau
ge ID
by
DP
MA
Gau
ge ID
by
PLN
-LM
KSupp
lem
ente
dby
the P
roje
ctSta
tion N
ame
Riv
er
Wat
er
Leve
lR
unoff
Com
ment
A. Sum
atra
16
Desp
eta
hA
. M
usi
Ben
gkul
u01-
074
-01
-02
-01-
074
-17
xD
espe
tah
Musi
Ava
ilabl
eA
vaila
ble
Obs
erv
el W
ater
Leve
l m
ay b
ein
flue
nced
by w
ater
leve
l of
PLTA
Musi
.B
. Kal
iman
tan
17
Sila
t da
msi
teS. Kap
uas
W. Kal
iman
tan
--
-x
--
--
-18
Kela
i-2 d
amsi
teS. B
erau
E. Kal
iman
tan
--
-x
Lesa
n D
ayak
Kela
iA
vaila
ble
Not
Ava
ilabl
eLong
Lan
uk
Kela
iA
vaila
ble
Ava
ilabl
eC
. Sula
wesi
21
Tula
bolo
S. B
one
N. Sula
wesi
04-
003
-01
-01
-04-
003
-01
--
--
-22
Tin
cep
S. M
unte
N. Sula
wesi
04-
127
-01
-01
-04-
127
-01
Tin
cep
Munt
eA
vaila
ble
Not
Ava
ilabl
e23
Pal
iliS. P
alu
C. Sula
wesi
04-
112
-02-02
04-11
2-00-
01
04-
112
-01
xP
alili
Gum
basa
Not
Ava
ilabl
eA
vaila
ble
27
Bak
aru
S. Sad
ang
S. Sula
wesi
04-
093
-03
-01
04-09
3-00-
14
-Tom
bo-B
akar
uM
amas
aA
vaila
ble
Ava
ilabl
eD
PM
A s
tation B
akar
u w
asre
plac
ed b
y Tom
bo-B
akar
u.
D. Jaw
a29
Cib
uni-
3 d
amsi
teC
ibuni
W. Jaw
a-
--
xTan
ggeung
Cib
uni
Ava
ilabl
eA
vaila
ble
Pam
adan
gan
Cib
uni
Ava
ilabl
eA
vaila
ble
34
Kau
lon
K. B
rant
asE. Jaw
a02-
057
-01
-08
02-05
7-03-
05
--
--
--
E. Iria
n J
aya
36
PLTM
Werb
aS. W
erb
aIria
n J
aya
--
-x
--
--
-37
PLTA
War
sam
son
S. W
arsa
mso
nIria
n J
aya
--
-x
Mal
anu
War
sam
son
Ava
ilabl
eN
ot
Ava
ilabl
e38
PLTA
Genye
mS. Serm
oIria
n J
aya
--
-x
--
--
-F. B
ali
39
Bua
ngg
aTk.
Ayu
ng
Bal
i07-
022
-01
-01
07-02
1-00-
03
07-
016
-01
xB
uan
gga
Ayu
ng
Ava
ilabl
eN
ot
Ava
ilabl
eH
. H
alm
ahera
41
PLTM
Ira
A. Ira
Mal
uku
--
-x
Igab
ola
Ira
Ava
ilabl
eN
ot
Ava
ilabl
eP
LTM
Ira
sta
tion w
as r
epl
aced
by
Igab
ola
.I.
Ser
am
42
PLTA
Isa
l-2
Wai
Isa
lM
aluku
--
-x
Lele
Sirat
aIs
alA
vaila
ble
Not
Ava
ilabl
eP
LTA
Isa
l-2 s
tation w
as r
epl
aced
by L
ele
Sirat
a.J. Tim
or
43
PLTA
Ira
Lal
aro
Ira
Siq
uiro
E. Tim
or
--
-x
--
--
-
Key
Str
eam
Gau
ges
on H
PP
S2
Res
ult fro
m P
LN
-P
uslit
bang

Final Report (Supporting_MP) Part 7 Preliminary Hydrological Evaluation Results
JICA Project for the Master Plan Study of 7-8 August, 2011 Hydropower Development in Indonesia
Table 2 List of Key Stream Gauges
Key Stream Gauges on HPPS2
No. Station NameGauge ID
by HPPS2Gauge ID by DPMA
Gauge ID by PLN
River Basin ProvinceSupplement ofMissing Data
Availablity Source
A. Sumatera1 Lhok Nibong 01-027-01-01 01-027-00-02 - Kr. Jambu Aye D.I. Aceh Surrouding Stations Available PUSAIR2 Stabat 01-040-01-01 01-040-00-01 - S. Wampu N. Sumatera Surrouding Stations Available PUSAIR3 Lb. Sipelanduk 01-055-03-02 01-056-00-01 - Bt. Pane N. Sumatera Surrouding Stations Available PUSAIR4 Lb. Bendahara 01-058-02-01 01-058-00-02 - S. Rokan Riau Surrouding Stations Available PUSAIR5 Tj. Ampalu 01-066-04-01 01-066-00-04 - Bt. Indragiri W. Sumatera Surrouding Stations Available PUSAIR6 Sungai Dareh 01-071-01-01 01-071-00-01 - Bt. Hari W. Sumatera Surrouding Stations Available PUSAIR7 Muara Inum 01-071-02-01 01-071-00-08 - Bt. Hari Jambi Surrouding Stations Available PUSAIR8 Martapura 01-074-01-01 01-074-00-44 - A. Musi S. Sumatera Project Report Available PUSAIR9 Banjarmasin 01-077-02-07 01-077-00-09 - W. TI. Bawang Lampung Surrouding Stations Available PUSAIR
10 Kunyir 01-080-01-04 01-080-00-07 - W. Sekampung Lampung Surrouding Stations Available PUSAIR11 Kp. Darang 01-001-01-01 01-001-00-03 - Kr. Aceh D.I. Aceh Surrouding Stations Available PUSAIR12 Tui Kareng 01-205-01-01 01-205-00-01 - Kr. Teunom D.I. Aceh Surrouding Stations Available PUSAIR13 Hp. Baru 01-178-01-01 01-178-00-02 - Bt. Toru N. Sumatera Surrouding Stations Available PUSAIR14 Air Batu 01-141-01-01 01-141-00-01 - Bt. Indrapura W. Sumatera Surrouding Stations Available PUSAIR15 Air Gadang 01-165-01-01 01-165-00-02 - Bt. Pasaman W. Sumatera Surrouding Stations Available PUSAIR16 Despetah 01-074-01-02 - 01-074-17 A. Musi Bengkulu Project Report Available PLN-LITBANG
B. Kalimantan17 Silat damsite - - - S. Kapuas W. Kalimantan Project Report Not Available -18 Kelai-2 damsite - - - S. Berau E. Kalimantan Project Report Not Available -19 Sei Langsat 03-026-01-01 03-026-00-01 - S. Martapura S. Kalimantan Project Report Available PUSAIR20 Panaan 03-027-07-02 03-026-00-45 - S. Barito C. Kalimantan Project Report Available PUSAIR
C. Sulawesi21 Tulabolo 04-003-01-01 - 04-003-01 S. Bone N. Sulawesi Surrouding Stations Not Available -22 Tincep 04-127-01-01 - 04-127-01 S. Munte N. Sulawesi Surrouding Stations Not Available -23 Palili 04-112-02-02 04-112-00-01 04-112-01 S. Palu C. Sulawesi Project Report Available PLN-LITBANG24 Gillirang 04-072-01-01 04-072-00-01 - S. Gillirang S. Sulawesi Project Report Available PUSAIR25 Bila 04-073-03-01 04-073-00-04 - S. Cenranae S. Sulawesi Project Report Available PUSAIR26 Likupande 04-083-01-01 04-083-00-01 - Jene Klara S. Sulawesi Surrouding Stations Available PUSAIR27 Bakaru 04-093-03-01 04-093-00-14 - S. Sadang S. Sulawesi Surrouding Stations Not Available -
D. Jawa28 Kebon Randu 02-107-06-01 02-107-02-05 - Cimandiri W. Jawa Surrouding Stations Available PUSAIR29 Cibuni-3 damsite - - - Cibuni W. Jawa Project Report Not Available -30 Rangkasbitong 02-006-01-02 02-006-03-02 - Ciujung W. Jawa Project Report Available PUSAIR31 Leuwi Goong 02-026-01-06 02-026-02-01 - Cimanuk W. Jawa Surrouding Stations Available PUSAIR32 Krangan-2 02-082-01-06 02-082-01-02 - K. Progo C. Jawa Surrouding Stations Available PUSAIR33 Banyumas 02-090-01-03 02-090-06-01 - K. Serayu C. Jawa Surrouding Stations Available PUSAIR34 Kaulon 02-057-01-08 02-057-03-05 - K. Brantas E. Jawa Surrouding Stations Not Available -35 Wonorejo 02-074-01-01 02-074-02-06 - K. Bondoyudo E. Jawa Surrouding Stations Available PUSAIR
E. Irian Jaya36 PLTM Werba - - - S. Werba Irian Jaya Project Report Not Available -37 PLTA Warsamson - - - S. Warsamson Irian Jaya Project Report Not Available -38 PLTA Genyem - - - S. Sermo Irian Jaya Project Report Not Available -
F. Bali39 Buangga 07-022-01-01 07-021-00-03 07-016-01 Tk. Ayung Bali Project Report Not Available -
G. Lombok
40 Santong 08-005-01-01 08-005-00-01 - K. SidutanW. NusaTenggara
Project Report Available PUSAIR
H. Halmahera41 PLTM Ira - - - A. Ira Maluku Project Report Not Available -
I. Seram42 PLTA Isal-2 - - - Wai Isal Maluku Project Report Not Available -
J. Timor43 PLTA Ira Lalaro - - - Ira Siquiro E. Timor Project Report Not Available -
Follow up in 2010

Final Report (Supporting_MP) Part 7 Preliminary Hydrological Evaluation Results
JICA Project for the Master Plan Study of 7-9 August, 2011 Hydropower Development in Indonesia
Table 3 List of Rainfall Stations in/around Key Stream Gauges (1/2)
Region
No. Station Name Gauge ID byHPPS2 River Basin River C.A.
(km2) No. Station Name Gauge IDby BMG Availability Source
A. Sumatera 2 Stabat 01-040-01-01 S. Langkat S. Wampu 3,870 1 Selesai Available BMKG2 Kabanjahe3 Polonia 127I Available BMKG4 Bukit Lawang 133C Available BMKG5 Batan Serangan6 Bungara7 Marike 132D8 Padang Brahrang9 Turangi
10 Blang Kahan 129D Available BMKG11 Rambutan 140F Available BMKG12 Tanjung Kelling 133B
6 Sungai Dareh 01-071-01-01 Bt .Hari Bt .Hari 4,452 13 Muarah Labuh 2914 Surian 38B Available BMKG15 Sukarami 27A16 Sitiung 36B Available BMKG17 Pulau Punjung 49G18 Lubuk Gadang 3019 Huberta 28C Available BMKG
12 Tui Kareng 01-205-01-01 Kr. Teunom Kr. Teunom 2,403 20 Geumpang 104b Available BMKG21 Tangse 104a Available BMKG22 Blangpidie 97c Available BMKG23 Meulaboh 102
13 Hapesong Baru 01-178-01-02 Bt. Toru Bt. Toru 2,773 24 Batang Toru 8025 Tarutung 8426 Hutaraya 84C Available BMKG27 Sibolga 0210428 Baligi 86B Available BMKG29 Simangunban
B. Kalimantan 19 Sei Langsat 03-026-01-01 S. Martapura S. Riam Kiw 1,420 30 Lumpangi Kiri(Riam Kiwa damsite) 31 Rantau 306
32 Lampinit33 Tatakan34 Atayo 308D Available BMKG35 Ulin 308I Available BMKG, HIDB36 Lawa-Lawa 308K Available BMKG, HIDB37 Binuang 307B Available BMKG, HIDB38 Pengaron 307 Available HIDB
20 Panaan 03-027-07-02 S. Barito S. Tabalong 1,333 39 Hayap 29940 Tanjung 30141 Batu Mandi 303A42 Barabai 30543 Negara 305B Available BMKG44 Rantau 306
C. Sulawesi 22 Tincep 04-127-01-01 S. Munte S. Munte 54 45 Tondano 336 Available HIDB46 Tomohon 33847 Noongan 339A Available HIDB48 Tanawangko 341 Available HIDB
23 Palili 04-112-02-02 S. Palu S. Lindu 593 49 Donggala 363 Available HIDB50 Parigi 365 Available HIDB51 Poso 385 Available BMKG52 Lembasida 363G53 Una-Una 36654 Bila 399G Available BMKG
24 Gillirang 04-072-01-01 S. Gillirang S. Gillirang 230 55 Sakkoli 403D Available BMKG56 Barukku 399C Available BMKG57 Siwa 400B Available BMKG58 Panekei 400H59 Paria 404B Available BMKG
25 Bila 04-073-03-01 S. Cenranae S. Bila-Hilir 379 60 Enrekang 40061 Baraka 400F Available BMKG62 Barukku 399C Available BMKG63 Bila 399G Available BMKG64 Paria 404B Available BMKG65 Paneki 400H Available BMKG66 T. Tedong 403D
Rainfall Stations in/around Key Stream Gauges in HPPS2 (Monthly)Key Steam Gauge Rainfall Station
Follow up in 2010(monthly)

Final Report (Supporting_MP) Part 7 Preliminary Hydrological Evaluation Results
JICA Project for the Master Plan Study of 7-10 August, 2011 Hydropower Development in Indonesia
Table 4 List of Rainfall Stations in/around Key Stream Gauges (2/2)
Region
No. Station Name Gauge ID byHPPS2 River Basin River C.A.
(km2) No. Station Name Gauge IDby BMG Availability Source
D. Jawa 28 Kebon Randu 02-107-06-01 Cimandiri Cicatih 486 67 Sukabumi 5768 Cikidang 1069 Tjipetir70 Sukamaju 1271 Cikembang 4572 Cibunar 36 Available BMKG73 Ubrug 45A Available BMKG74 Ciburayut 61
29 Cibuni-3 damsite - Cibuni Cibuni 1,124 75 Cimenteng 54C76 Sukanegara 9877 Pagelaran 109A Available BMKG78 Citambur 12979 Cibuni 133 Available HIDB80 Dinewati 6581 Agrabintana 114A Available BMKG, HIDB
30 Rangkasbitung 02-006-01-02 Ciujung Ciujung 1,383 82 Cilaki 43B Available BMKG83 B. Irigasi 44A Available BMKG84 Rangkasbitung 3785 Cikadu 37B Available BMKG86 Cimarga 37E Available BMKG87 Cisalak 37F88 Peudeuy 38A89 W. Guning 26C90 Padeglang 26
31 Leuwi Goong 02-026-01-06 Cimanuk Cimanuk 760 91 Pamegatan 213A Available BMKG92 K. Pawitan 205C Available BMKG93 Toragong 205B Available BMKG94 Sumedang 194 Available BMKG95 Ujungjaya 19396 Panjalu 223
32 Krangan -2 02-082-01-06 K. Progo K. Progo 423 97 Badran 8798 Plered 8899 Temanngung 86 Available BMKG
100 Seneng 80101 Pakis 98A Available BMKG102 Kebraman 79103 K. Angkrik 75
33 Banyumas 02-090-01-03 K. Serayu K. Serayu 2,632 104 B. Raden 25105 B. Sari 26106 T. Gering 26A Available BMKG107 Klampok 36B Available BMKG108 Adipala 44109 Rumput 46C110 K. Gesing 60
34 Kaulon 02-057-01-08 K. Brantas K. Brantas 2,620 111 Semen 153 Available HIDB112 Wlingi 164 Available HIDB113 Batu 7 Available BMKG, HIDB114 Singosari 51 Available HIDB115 Doko 165 Available HIDB116 Dampit 28 Available BMKG117 Kepanjen 39 Available HIDB
35 Wonorejo 02-074-01-01 K. Bondoyudo K. Bondoyu 314 118 Ranukiakah 180119 Widodoren 24120 Candipura 188121 G. Sawur 188B Available BMKG122 S. Jambe 209E123 Watu Urip 20
I. Seram 42 PLTA Isal-2 dams- Wai Isal Wai Isal 242 124 Manusela 485A Available HIDB125 Wahai 486 Available HIDB126 Riring 487C Available BMKG
J. Timor 43 PLTA Ira Lalaro d- Ira Siquiro Ira Siquiro 406 127 Tutuala 690C Available HIDB128 Los Palos 690B Available HIDB
Legend: BMKG (Badan Meteorologi Klimatologi dan Geofisika), HIDB (Hidro-Inventory Database in HPPS2)
Rainfall Stations in/around Key Stream Gauges in HPPS2 (Monthly) Follow up in 2010(monthly)Key Steam Gauge Rainfall Station

Final Report (Supporting_MP) Part 7 Preliminary Hydrological Evaluation Results
JICA Project for the Master Plan Study of 7-11 August, 2011 Hydropower Development in Indonesia
Table 5 Supplemented Monthly Runoff and Collected Monthly Runoff Records (1/43)
No: 1 River Basin: Kr. Jambu AyeStation Name: Lhok Nibong River: Kr. Jambu AyeStation ID by HPPS2: 01-027-01-01 Catchment Area (km2): 4,583
Supplemented Monthly Runoff in HPPS2 Unit:m3/s
Year Jan Feb Mar Apr May Jun Jul Aug Sep Oct Nov Dec Ave
1972 79.1 91.7 45.0 122.0 181.7 127.5 46.1 49.4 158.5 223.3 381.2 321.5 152.31973 218.3 78.4 92.2 122.2 210.7 251.2 101.2 109.7 156.8 203.5 261.1 297.3 175.21974 232.1 174.0 136.8 152.9 222.1 145.6 124.1 129.2 134.9 126.8 198.7 112.4 157.51975 113.9 70.4 103.1 179.1 158.0 79.0 128.0 64.2 132.1 167.3 236.2 352.9 148.71976 184.0 102.9 144.1 145.3 182.4 108.5 78.2 67.8 74.4 106.6 324.8 275.0 149.51977 192.8 128.5 63.7 69.1 162.8 92.4 102.7 118.2 151.4 348.9 353.5 509.1 191.11978 251.7 153.6 124.6 152.6 212.9 140.0 108.5 109.7 156.8 178.6 281.0 306.9 181.41979 104.0 69.2 57.0 137.7 176.7 140.7 98.3 76.3 138.4 143.4 323.0 148.7 134.51980 61.1 71.0 156.0 76.4 140.0 104.0 107.0 123.0 80.6 149.0 281.0 319.0 139.01981 318.0 113.0 121.0 114.0 382.0 155.0 98.2 74.7 135.0 174.0 187.0 226.0 174.81982 61.9 65.6 71.1 252.0 268.0 88.7 58.7 71.8 86.4 150.0 228.0 209.0 134.31983 198.0 50.5 80.8 56.8 148.0 109.0 128.0 88.8 157.6 195.2 181.7 236.7 135.91984 272.0 278.0 222.0 128.0 241.0 164.0 113.0 78.3 73.2 142.0 153.0 311.0 181.31985 132.0 125.0 152.0 102.0 221.0 84.3 55.9 75.9 95.5 227.0 253.0 280.0 150.31986 323.0 108.0 70.6 157.0 129.0 117.0 54.8 47.7 79.6 153.0 193.0 329.0 146.81987 181.7 164.3 155.2 272.2 187.8 189.8 185.8 183.7 172.9 375.7 308.4 305.3 223.61988 412.0 136.0 90.0 200.0 164.0 152.0 69.7 179.0 195.0 111.0 151.0 233.0 174.41989 103.0 72.0 108.0 98.3 206.0 62.8 87.9 113.0 123.0 70.1 93.4 163.0 108.41990 - - - - - - - - - - - - -1991 159.0 103.0 110.0 142.0 205.0 155.0 98.7 181.0 313.0 342.0 256.0 414.0 206.61992 361.0 383.0 281.0 238.0 332.0 259.0 150.0 190.0 239.0 301.0 363.0 354.0 287.61993 198.0 239.0 232.0 287.0 352.0 287.0 295.0 180.0 438.0 436.0 529.0 578.0 337.6
Ave 197.9 132.2 124.6 152.6 213.5 143.5 109.0 110.1 156.8 205.9 263.7 299.1 175.7
Num 21
Collected Monthly Runoff Unit:m3/s
Year Jan Feb Mar Apr May Jun Jul Aug Sep Oct Nov Dec Ave
1994 400.5 417.3 279.8 431.4 384.6 174.1 146.2 84.6 165.6 282.7 391.6 189.0 278.91995 163.0 150.8 237.4 313.1 206.1 118.5 105.5 193.8 173.8 235.6 571.7 270.6 228.31996 262.6 349.4 83.1 184.5 235.8 182.4 128.6 138.6 153.0 182.2 274.8 421.1 216.31997 70.7 70.7 190.0 175.3 69.2 - - - - - - - -
Ave 224.2 247.1 197.6 276.1 223.9 158.3 126.7 139.0 164.1 233.5 412.7 293.6 241.2
Num 3

Final Report (Supporting_MP) Part 7 Preliminary Hydrological Evaluation Results
JICA Project for the Master Plan Study of 7-12 August, 2011 Hydropower Development in Indonesia
Table 6 Supplemented Monthly Runoff and Collected Monthly Runoff Records (2/43)
No: 2 River Basin: S. WampuStation Name: Stabat River: S. WampuStation ID by HPPS2: 01-040-01-01 Catchment Area (km2): 3,870
Supplemented Monthly Runoff in HPPS2 Unit:m3/s
Year Jan Feb Mar Apr May Jun Jul Aug Sep Oct Nov Dec Ave
1972 114.1 126.1 118.0 116.9 127.9 121.7 113.9 112.1 118.9 131.9 128.4 141.1 122.61973 158.0 129.6 123.5 126.1 135.2 133.5 118.5 133.3 116.2 125.8 123.8 135.2 129.91974 225.0 267.6 192.2 193.9 195.1 181.2 184.9 187.3 267.2 246.3 254.5 197.6 216.11975 181.6 186.5 134.9 189.4 161.5 162.2 144.6 110.8 216.1 149.3 220.7 441.5 191.61976 264.5 225.2 136.9 195.4 181.6 145.1 162.9 149.4 151.3 210.2 390.4 369.7 215.21977 248.9 166.0 212.0 135.9 126.2 112.9 108.5 117.1 173.4 349.3 391.6 291.1 202.71978 207.4 155.9 163.3 163.6 151.2 141.9 152.2 93.1 161.1 304.5 386.2 306.3 198.91979 201.6 160.4 116.7 119.9 118.8 159.6 187.2 128.6 153.5 232.8 356.2 300.2 186.31980 153.2 135.6 219.5 152.3 178.0 150.3 116.6 257.0 220.9 191.9 382.6 400.4 213.21981 234.0 175.0 147.7 167.0 322.2 138.4 68.8 63.0 174.0 156.0 230.9 228.8 175.51982 143.0 167.7 188.7 329.0 277.0 197.0 133.0 92.3 117.7 260.3 339.2 332.0 214.71983 300.0 145.0 188.0 113.0 158.0 152.0 140.0 119.0 194.0 313.0 300.0 313.0 202.91984 253.0 268.0 270.0 188.7 315.0 158.0 150.0 129.0 103.0 159.0 174.0 228.0 199.61985 199.4 145.7 231.0 188.0 226.0 110.6 135.4 145.8 149.0 212.0 334.0 367.0 203.71986 262.0 234.3 179.0 204.0 140.0 128.0 125.5 108.4 207.0 404.0 351.0 305.0 220.71987 212.0 146.1 214.0 195.0 320.3 146.9 135.4 137.4 190.7 351.0 408.0 346.3 233.61988 266.0 178.0 186.5 179.0 209.3 146.9 135.4 231.4 284.6 253.3 327.6 325.2 226.91989 311.0 147.0 233.0 194.0 339.0 155.0 211.0 198.0 255.0 379.0 363.0 306.0 257.61990 211.0 165.0 151.0 156.0 237.0 188.0 128.0 201.0 153.0 269.0 240.0 271.0 197.51991 164.0 154.0 170.0 174.0 207.0 167.0 117.0 105.0 175.0 251.0 271.0 299.0 187.81992 201.0 140.0 134.0 136.0 117.0 101.4 87.4 126.0 121.0 377.0 409.0 517.0 205.61993 301.0 175.0 211.0 243.0 327.0 151.0 214.0 142.0 161.0 281.0 390.0 231.0 235.6
Ave 218.7 172.4 178.2 175.5 207.7 147.7 139.5 140.3 175.6 254.9 307.8 302.4 201.7
Num 22
Collected Monthly Runoff Unit:m3/s
Year Jan Feb Mar Apr May Jun Jul Aug Sep Oct Nov Dec Ave
1994 198.2 282.5 222.3 287.9 299.1 250.8 144.3 128.3 222.8 228.9 335.1 233.3 236.11995 227.3 177.1 173.2 215.1 218.0 173.7 167.6 314.7 437.7 314.0 348.5 196.6 246.91996 112.7 196.6 78.5 89.8 113.0 103.4 61.6 66.5 134.5 102.8 126.8 315.4 125.11997 212.0 168.3 251.0 180.3 133.5 125.5 106.7 86.0 122.4 363.2 395.1 240.3 198.71998 147.2 90.9 85.0 52.8 51.6 64.1 99.7 138.8 100.9 154.8 203.9 178.9 114.11999 - - - - - - - - - - - - -2000 - - - - - - - - - - - - -2001 - - - - - - - - - - - - -2002 - - - - - - - - - - - - -2003 - - - - - - - - - - - - -2004 - - - - - - - - - - - - -2005 298.9 165.3 170.9 192.4 246.8 188.4 202.3 224.7 246.2 - - 419.3 -2006 - - - - - - - - - - - - -2007 340.6 - 151.9 171.9 341.1 183.8 218.7 306.6 393.7 321.7 389.2 419.2 -2008 93.7 71.9 352.6 544.2 552.1 507.1 508.4 420.5 555.5 842.9 * * -
Ave 203.8 164.7 185.7 216.8 244.4 199.6 188.7 210.8 276.7 332.6 299.8 286.2 184.2
Num 5
Note: Maximum runoff in 2008 Nov. and Dec are much higher than others and judged as unreliable value.

Final Report (Supporting_MP) Part 7 Preliminary Hydrological Evaluation Results
JICA Project for the Master Plan Study of 7-13 August, 2011 Hydropower Development in Indonesia
Table 7 Supplemented Monthly Runoff and Collected Monthly Runoff Records (3/43)
No: 3 River Basin: Bt. BarumunStation Name: Lubuk Sipelanduk River: Bt. PaneStation ID by HPPS2: 01-055-03-02 Catchment Area (km2): 828
Supplemented Monthly Runoff in HPPS2 Unit:m3/s
Year Jan Feb Mar Apr May Jun Jul Aug Sep Oct Nov Dec Ave
1972 - - - - - - - - - - - - -1973 47.7 27.0 36.2 51.9 53.5 53.9 14.7 13.6 38.2 25.2 23.9 35.3 35.11974 32.6 38.0 29.5 45.6 30.0 19.1 14.5 9.0 22.8 22.0 13.2 38.0 26.21975 37.8 47.7 33.8 30.2 15.9 11.3 15.7 9.5 17.5 9.4 13.6 31.1 22.81976 27.4 28.7 38.6 47.5 19.2 20.9 10.1 12.5 7.5 25.3 42.0 45.7 27.11977 54.0 43.8 33.1 31.3 34.7 21.6 13.0 10.4 14.7 40.5 84.1 49.4 35.91978 31.1 50.0 50.3 46.0 33.0 14.9 10.7 7.2 7.1 16.1 46.4 43.7 29.71979 37.6 28.7 26.8 19.3 14.7 15.1 10.7 7.3 25.6 20.9 45.0 45.6 24.81980 40.1 15.9 41.0 37.1 34.6 23.0 10.3 16.0 12.7 17.7 21.2 17.8 24.01981 26.0 31.4 38.2 36.2 55.9 41.5 13.2 13.1 27.1 17.1 16.1 19.5 27.91982 15.3 25.6 51.8 74.9 52.1 16.9 10.8 7.3 8.9 25.5 40.6 35.6 30.41983 32.2 20.6 21.0 19.8 25.0 13.0 8.9 8.3 18.5 43.2 27.2 48.0 23.81984 43.5 50.8 47.3 38.2 43.1 22.0 19.9 13.9 41.0 7.2 29.9 34.0 32.61985 41.6 31.7 34.3 42.7 18.2 7.9 6.5 6.9 10.0 16.1 39.5 42.1 24.81986 44.2 29.9 66.3 54.6 32.3 24.2 12.7 12.9 14.6 15.0 16.7 29.4 29.41987 30.1 28.4 28.9 30.0 17.1 14.8 8.7 19.4 17.6 22.4 37.4 43.3 24.81988 - - - - - - - - - - - - -1989 13.9 21.5 28.9 37.1 22.3 11.1 10.2 15.9 14.6 44.5 76.0 44.5 28.41990 36.9 49.1 30.4 32.4 30.3 11.1 19.3 9.9 14.4 36.2 38.2 75.7 32.01991 30.8 24.0 39.3 42.7 47.4 29.4 17.7 17.5 17.9 19.3 36.2 102.2 35.41992 41.2 21.5 15.5 30.4 23.7 3.2 5.6 7.6 11.3 11.9 63.1 53.8 24.11993 37.9 26.2 34.4 35.5 41.4 33.1 33.7 18.9 12.8 12.8 38.3 30.8 29.7
Ave 35.1 32.0 36.3 39.2 32.2 20.4 13.3 11.9 17.8 22.4 37.4 43.3 28.4
Num 20
Collected Monthly Runoff Unit:m3/s
Year Jan Feb Mar Apr May Jun Jul Aug Sep Oct Nov Dec Ave
- - - - - - - - - - - - - -- - - - - - - - - - - - - -- - - - - - - - - - - - - -- - - - - - - - - - - - - -
Ave - - - - - - - - - - - - -
Num 0

Final Report (Supporting_MP) Part 7 Preliminary Hydrological Evaluation Results
JICA Project for the Master Plan Study of 7-14 August, 2011 Hydropower Development in Indonesia
Table 8 Supplemented Monthly Runoff and Collected Monthly Runoff Records (4/43)
No: 4 River Basin: S. RokanStation Name: Lubuk Bendahara River: S. Rokan KiriStation ID by HPPS2: 01-058-02-01 Catchment Area (km2): 3,325
Supplemented Monthly Runoff in HPPS2 Unit:m3/s
Year Jan Feb Mar Apr May Jun Jul Aug Sep Oct Nov Dec Ave
1974 167.8 145.5 167.6 174.4 152.6 142.7 114.1 109.6 160.7 123.3 120.9 177.6 146.41975 134.0 131.6 135.6 168.5 121.3 109.3 132.5 109.6 159.3 116.4 93.0 101.0 126.01976 87.4 48.6 94.9 139.7 82.9 104.2 59.7 84.6 64.1 149.9 225.6 247.9 115.81977 164.5 177.8 117.8 151.1 138.6 86.8 73.1 60.2 57.3 109.3 303.0 228.9 139.01978 151.5 243.8 253.3 226.5 178.2 88.1 83.9 55.3 62.7 107.9 185.7 172.0 150.71979 204.5 130.6 97.3 139.2 107.8 139.8 66.4 54.4 108.8 69.0 288.6 222.8 135.81980 121.6 78.1 166.7 162.1 169.7 110.8 65.6 77.7 74.6 110.4 157.5 147.6 120.21981 152.4 110.3 143.8 178.8 181.7 124.4 67.2 43.6 89.5 134.1 91.0 103.7 118.41982 120.6 137.1 190.6 368.0 190.6 110.0 60.5 53.5 62.4 136.8 199.6 264.4 157.81983 229.0 96.5 94.9 94.5 134.0 123.0 98.1 71.5 167.6 126.3 72.5 171.2 123.31984 147.0 250.4 216.9 282.7 177.7 140.6 106.2 85.9 84.7 71.6 279.3 196.3 169.91985 141.7 134.8 132.6 152.2 161.5 125.7 123.3 127.0 157.2 153.0 178.0 158.0 145.41986 311.0 108.0 259.0 206.0 128.0 104.0 55.3 44.0 65.3 151.0 135.0 302.0 155.71987 120.7 110.6 130.7 144.8 161.1 122.0 115.3 152.2 152.4 187.2 148.7 146.3 141.01988 248.0 246.0 296.0 183.0 159.0 85.1 98.2 157.0 257.0 107.0 105.0 161.0 175.21989 137.6 118.1 134.3 123.3 126.3 110.3 106.9 121.1 145.2 156.3 181.1 140.7 133.41990 184.0 242.0 110.0 103.0 140.0 53.2 72.7 44.9 68.0 125.0 163.0 248.0 129.51991 - - - - - - - - - - - - -1992 194.0 151.0 188.0 166.0 134.0 82.3 84.6 56.3 77.5 82.2 238.0 218.0 139.31993 170.0 104.0 254.0 149.0 254.0 104.0 101.0 63.2 115.0 169.0 257.0 236.0 164.7
Ave 167.8 145.5 167.6 174.4 152.6 108.7 88.7 82.7 112.1 125.6 180.1 191.8 141.5
Num 19
Collected Monthly Runoff Unit:m3/s
Year Jan Feb Mar Apr May Jun Jul Aug Sep Oct Nov Dec Ave
1995 253.2 217.1 207.2 215.4 185.5 101.7 80.9 168.5 123.3 141.8 - - -1996 149.0 169.3 127.2 191.8 106.2 115.5 89.3 85.2 94.8 114.0 112.0 116.0 122.51997 92.2 47.5 66.3 146.2 122.8 62.0 74.4 31.4 29.3 50.3 148.7 209.9 90.11998 227.1 150.8 109.8 202.5 129.1 36.0 71.6 155.6 152.6 82.6 88.3 136.7 128.61999 275.4 142.0 113.2 53.0 69.5 63.0 64.5 65.7 120.0 227.2 142.3 134.4 122.52000 - - - - - - - - - - - - -2001 - - - - - - - - - - - - -2002 - - - - - - - - - - - - -2003 - - - - - - - - - - - - -2004 - - - - - - - - - - - - -2005 - - - - - - - - - - - - -2006 - - - - - - - - - - - - -2007 236.0 145.8 107.1 161.2 162.0 155.2 83.5 48.0 94.6 153.1 82.6 205.4 136.22008 106.8 77.2 246.0 187.8 66.6 71.6 - - - 188.4 108.5 150.6 -
Ave 191.4 135.6 139.5 165.4 120.2 86.4 77.4 92.4 102.4 136.8 113.7 158.8 120.0
Num 5

Final Report (Supporting_MP) Part 7 Preliminary Hydrological Evaluation Results
JICA Project for the Master Plan Study of 7-15 August, 2011 Hydropower Development in Indonesia
Table 9 Supplemented Monthly Runoff and Collected Monthly Runoff Records (5/43)
No: 5 River Basin: Bt. IndragiriStation Name: Tj. Ampalu River: Bt. OmbilinStation ID by HPPS2: 01-066-04-01 Catchment Area (km2): 2,215
Supplemented Monthly Runoff in HPPS2 Unit:m3/s
Year Jan Feb Mar Apr May Jun Jul Aug Sep Oct Nov Dec Ave
1975 94.3 122.6 36.8 76.0 48.0 35.4 46.8 47.9 64.2 39.7 40.0 30.0 56.81976 45.3 34.5 59.4 128.5 65.8 33.0 35.9 38.4 39.4 85.4 117.5 115.9 66.61977 122.1 109.1 95.2 128.9 129.2 64.6 31.2 28.9 21.9 30.3 137.9 152.7 87.71978 145.8 115.0 268.3 144.1 113.5 52.5 26.9 36.8 34.5 75.2 120.5 186.1 109.91979 118.4 730.5 106.6 134.4 77.3 71.7 40.7 30.4 46.7 52.1 177.5 169.2 146.31980 100.7 37.2 91.6 25.2 36.3 32.2 40.4 48.0 32.1 35.4 102.7 98.3 56.71981 87.3 69.1 85.4 106.6 97.3 63.2 34.4 32.8 36.7 48.2 32.9 87.4 65.11982 112.5 81.6 102.3 162.0 104.2 80.7 28.3 18.0 14.7 15.8 76.4 145.6 78.51983 153.2 64.3 116.0 105.8 92.0 44.4 35.6 46.9 46.0 44.3 41.7 72.3 71.91984 94.4 71.8 82.6 121.1 72.9 90.8 39.7 20.5 21.2 25.9 132.4 86.0 71.61985 88.8 93.1 81.9 56.8 57.3 25.5 17.7 14.4 23.8 38.0 66.6 43.6 50.61986 149.0 44.6 184.9 104.6 80.8 62.5 40.7 13.9 50.8 56.1 111.1 60.9 80.01987 101.0 78.8 91.0 86.3 12.9 40.4 19.2 18.8 21.2 68.8 73.8 63.6 56.31988 92.3 80.3 143.0 120.0 99.7 39.1 37.4 28.5 28.8 93.3 89.1 117.0 80.71989 92.2 96.9 49.3 47.2 33.7 18.4 22.0 22.8 38.1 92.8 97.8 133.0 62.01990 129.0 147.0 125.0 120.0 99.6 37.1 45.2 42.2 70.7 156.0 136.0 249.0 113.11991 - - - - - - - - - - - - -1992 51.1 119.6 120.7 94.0 60.9 38.2 75.2 37.8 19.5 19.0 63.6 123.6 68.61993 35.5 114.0 104.2 98.1 68.7 68.7 57.5 33.1 36.1 62.5 141.2 63.7 73.6
Ave 100.7 122.8 108.0 103.3 75.0 49.9 37.5 31.1 35.9 57.7 97.7 111.0 77.6
Num 18
Collected Monthly Runoff Unit:m3/s
Year Jan Feb Mar Apr May Jun Jul Aug Sep Oct Nov Dec Ave
1995 135.1 167.4 101.0 97.7 128.5 64.0 48.8 55.9 67.4 75.4 36.8 100.9 89.91996 75.6 96.3 121.8 114.3 37.0 40.3 42.3 33.9 45.5 54.7 47.4 38.3 62.31997 - - - - - - - - - - - - -1998 85.7 66.0 53.4 33.5 51.7 58.6 53.8 101.3 106.8 50.2 26.9 36.7 60.41999 67.9 57.5 65.6 26.6 61.0 11.4 7.2 6.2 42.3 79.5 42.4 74.8 45.22000 62.6 9.4 11.6 11.2 8.3 8.2 5.5 44.8 37.9 24.4 70.3 59.5 29.52001 * * * * * * * * * * * * -2002 - - - - - - - - - - - - -2003 - - - - - - - - - - - - -2004 * * * * * * * * * * * * -2005 * * * * * * * * * * * * -2006 * * * * * * * * * * * * -2007 * * * * * * * * * * * * -2008 * * * * * * * * * * * * -
Ave 85.4 79.3 70.7 56.7 57.3 36.5 31.5 48.4 60.0 56.9 44.8 62.0 57.5
Num 5
Note: Maximum Runoff and baseflow after 2001 become smaller than befor, and judged as unreliable value.

Final Report (Supporting_MP) Part 7 Preliminary Hydrological Evaluation Results
JICA Project for the Master Plan Study of 7-16 August, 2011 Hydropower Development in Indonesia
Table 10 Supplemented Monthly Runoff and Collected Monthly Runoff Records (6/43)
No: 6 River Basin: Bt. HariStation Name: Sungai Dareh River: Bt. HariStation ID by HPPS2: 01-071-01-01 Catchment Area (km2): 4,452
Supplemented Monthly Runoff in HPPS2 Unit:m3/s
Year Jan Feb Mar Apr May Jun Jul Aug Sep Oct Nov Dec Ave
1975 382.7 284.2 182.0 332.8 212.8 158.7 207.6 212.5 282.1 177.0 178.4 135.4 228.91976 201.0 155.0 261.5 558.3 289.1 148.4 160.9 171.4 176.0 373.1 511.0 504.2 292.51977 531.0 474.8 415.2 559.8 561.4 284.0 221.4 209.1 149.2 152.7 462.1 593.2 384.51978 484.5 311.8 708.1 493.4 385.0 174.5 141.5 106.1 138.6 240.5 395.9 702.1 356.81979 428.2 161.7 342.7 482.4 355.7 414.3 250.4 170.3 207.2 265.8 770.9 535.4 365.41980 438.8 219.5 399.9 138.1 162.5 145.1 145.5 134.5 146.4 273.5 385.5 254.5 237.01981 219.3 210.0 507.2 629.9 374.6 212.0 198.0 210.9 314.9 400.4 277.9 349.5 325.41982 401.0 309.6 340.3 535.0 403.1 364.8 182.4 115.6 85.9 115.9 238.2 633.3 310.41983 797.7 388.1 422.1 507.8 416.7 238.8 228.1 225.7 250.5 235.7 215.4 342.0 355.71984 586.0 294.6 355.8 451.6 475.0 335.6 270.0 162.9 176.2 193.4 401.8 208.1 325.91985 363.5 481.8 333.8 286.5 303.9 151.7 132.6 147.0 232.3 234.6 428.6 227.8 277.01986 429.2 243.0 496.9 299.9 265.9 240.7 194.0 174.7 194.0 247.2 263.5 355.0 283.71987 384.0 327.7 358.7 346.7 160.4 230.2 176.4 175.4 181.5 302.3 315.0 289.1 270.61988 599.6 245.3 430.6 355.5 298.5 249.5 245.3 284.1 351.3 298.5 302.3 411.0 339.31989 373.2 278.0 293.9 294.3 271.9 223.9 194.9 189.8 236.0 319.1 321.4 442.3 286.61990 302.7 338.7 278.5 286.4 272.4 197.7 183.7 185.1 205.2 328.9 251.9 240.7 256.01991 - - - - - - - - - - - - -1992 445.0 363.0 475.0 424.0 407.0 339.0 298.0 202.0 181.0 259.0 506.0 510.0 367.41993 440.0 274.0 299.0 262.0 486.0 238.0 218.0 155.0 260.0 307.0 494.0 417.0 320.8
Ave 433.7 297.8 383.4 402.5 339.0 241.5 202.7 179.6 209.3 262.5 373.3 397.3 310.2
Num 18
Collected Monthly Runoff Unit:m3/s
Year Jan Feb Mar Apr May Jun Jul Aug Sep Oct Nov Dec Ave
1995 408.7 692.9 507.0 561.2 619.1 321.2 215.5 183.4 173.8 314.4 387.1 240.4 385.41996 266.1 546.9 428.4 621.7 331.5 266.8 351.3 416.1 342.9 392.7 233.0 229.2 368.91997 200.1 94.0 151.2 312.4 279.9 112.3 83.2 66.9 56.5 45.9 95.6 175.3 139.41998 376.8 239.9 220.2 259.7 194.5 133.4 100.0 188.4 299.0 252.4 157.0 146.5 214.01999 * * * * * * * * * * * * -2000 * * * * * * * * * * * * -2001 256.5 188.1 96.2 246.2 259.7 165.5 82.5 83.2 107.4 118.2 153.6 183.0 161.72002 - - - - - - - - - - - - -2003 - - - - - - - - - - - - -2004 269.8 231.7 168.1 423.6 236.9 97.1 135.9 68.7 73.5 204.6 372.5 296.0 214.92005 - - - - - - - - - - - - -2006 - - - - - - - - - - - - -2007 - - - - - - - - - - - - -2008 * * * * * 102.0 80.6 219.4 67.8 185.8 129.2 108.2 -
Ave 296.4 332.2 261.8 404.1 320.3 171.2 149.9 175.2 160.1 216.3 218.3 196.9 247.4
Num 6
Note: Hydrographs in 1999, 2000, and 2008 have irregular shapes and are judge as unreliable value.

Final Report (Supporting_MP) Part 7 Preliminary Hydrological Evaluation Results
JICA Project for the Master Plan Study of 7-17 August, 2011 Hydropower Development in Indonesia
Table 11 Supplemented Monthly Runoff and Collected Monthly Runoff Records (7/43)
No: 7 River Basin: Bt. HariStation Name: Muara Inum River: Bt. TembesiStation ID by HPPS2: 01-071-02-01 Catchment Area (km2): 1,455
Supplemented Monthly Runoff in HPPS2 Unit:m3/s
Year Jan Feb Mar Apr May Jun Jul Aug Sep Oct Nov Dec Ave
1973 132.0 157.1 160.1 225.1 135.0 188.2 75.8 77.9 82.7 122.2 105.4 87.4 129.11974 42.9 94.6 89.6 177.9 136.8 77.4 81.1 64.5 136.2 99.0 83.2 109.0 99.41975 96.3 129.8 96.5 171.7 88.2 41.9 60.3 67.4 129.7 63.0 79.1 45.8 89.11976 61.5 60.5 93.9 189.1 75.0 36.2 30.9 49.3 38.2 158.4 137.6 157.0 90.61977 177.0 155.9 171.6 171.0 167.3 99.7 71.3 47.2 38.1 33.8 91.9 54.2 106.61978 143.9 153.3 215.0 121.6 127.6 49.0 42.6 47.3 81.8 95.0 102.6 130.6 109.21979 261.4 192.0 111.3 128.5 91.8 92.9 85.5 73.3 112.2 85.6 163.8 143.5 128.51980 89.2 91.7 100.5 300.1 127.9 114.7 98.4 72.8 98.1 74.8 72.4 99.2 111.71981 69.2 127.9 183.3 154.5 97.3 80.0 91.1 70.3 113.1 91.7 89.4 88.6 104.71982 - - - - - - - - - - - - -1983 184.2 128.9 73.8 91.3 71.9 72.4 127.0 58.4 100.0 100.3 95.6 103.9 100.61984 105.2 64.8 169.8 152.5 176.8 139.5 92.5 69.7 146.1 83.7 148.4 98.3 120.61985 132.7 157.5 161.5 101.2 85.0 73.6 47.5 39.1 77.0 92.9 170.9 87.5 102.21986 109.2 71.7 180.5 123.6 96.5 72.4 60.9 55.6 98.1 163.6 128.8 97.6 104.91987 84.5 69.0 82.2 91.8 115.0 76.7 71.8 62.9 57.3 68.7 93.4 87.4 80.01988 - - - - - - - - - - - - -1989 - - - - - - - - - - - - -1990 161.0 102.0 116.0 138.0 124.0 81.6 117.0 43.2 66.3 94.2 129.0 205.0 114.81991 - - - - - - - - - - - - -1992 219.0 190.0 133.0 152.0 79.7 68.8 86.2 47.3 73.9 94.8 202.0 446.0 149.41993 110.0 86.1 94.8 123.0 85.0 63.7 56.9 53.2 58.6 127.0 99.5 93.9 87.6
Ave 128.2 119.6 131.4 153.7 110.6 84.0 76.3 58.8 88.7 97.0 117.2 125.6 107.6
Num 17
Collected Monthly Runoff Unit:m3/s
Year Jan Feb Mar Apr May Jun Jul Aug Sep Oct Nov Dec Ave
2006 201.8 127.8 114.8 115.6 125.5 116.6 105.3 - - - - - -
Ave 201.8 127.8 114.8 115.6 125.5 116.6 105.3 #DIV/0! #DIV/0! #DIV/0! #DIV/0! #DIV/0! #DIV/0!
Num 0

Final Report (Supporting_MP) Part 7 Preliminary Hydrological Evaluation Results
JICA Project for the Master Plan Study of 7-18 August, 2011 Hydropower Development in Indonesia
Table 12 Supplemented Monthly Runoff and Collected Monthly Runoff Records (8/43)
No: 8 River Basin: A. MusiStation Name: Martapura River: A. KomeringStation ID by HPPS2: 01-074-01-01 Catchment Area (km2): 4,260
Supplemented Monthly Runoff in HPPS2 Unit:m3/s
Year Jan Feb Mar Apr May Jun Jul Aug Sep Oct Nov Dec Ave
1960 351.9 215.5 265.7 272.7 182.8 102.1 91.5 213.9 69.0 89.9 228.5 398.9 206.91961 200.8 385.3 342.7 323.8 281.7 165.8 104.4 63.9 49.1 45.5 82.6 32.4 173.21962 209.4 295.7 441.4 313.8 225.5 156.4 168.7 145.3 111.4 162.7 185.3 285.3 225.11963 209.0 265.9 336.5 284.1 236.4 100.0 52.3 53.6 51.9 54.2 36.5 101.4 148.51964 288.5 288.2 282.5 373.5 119.7 97.4 80.5 79.1 47.6 86.2 100.7 249.1 174.41965 279.7 249.5 222.7 262.0 221.5 141.1 88.4 192.1 57.0 61.5 67.9 202.9 170.51966 196.8 119.7 319.5 123.7 294.3 211.0 131.9 139.9 103.5 56.4 239.7 255.6 182.71967 253.2 220.8 174.1 295.9 410.3 97.5 96.4 38.1 26.7 27.4 131.0 266.7 169.81968 283.2 164.7 286.7 336.3 244.3 194.6 178.8 228.6 157.4 159.0 147.8 306.0 224.01969 339.6 293.4 358.5 415.8 241.9 204.0 258.8 133.7 135.8 120.1 198.5 293.5 249.51970 334.9 282.5 448.6 317.2 294.4 215.5 124.7 176.9 151.0 129.8 207.8 199.5 240.21971 295.6 156.4 196.8 392.9 221.9 135.9 89.0 87.2 90.4 188.2 263.1 288.9 200.51972 333.1 318.8 312.3 410.3 449.1 196.7 83.0 61.1 48.2 31.9 63.9 188.0 208.01973 242.1 299.2 238.8 314.0 290.8 215.2 102.9 121.8 281.4 223.2 227.4 225.6 231.91974 105.0 66.3 111.2 280.1 155.8 49.0 84.5 165.9 250.7 294.8 240.4 232.4 169.71975 261.4 379.7 184.3 297.1 204.5 168.2 226.9 223.4 231.8 232.9 304.3 200.0 242.91976 308.8 290.1 372.3 437.8 288.4 181.6 144.6 161.4 141.4 372.4 359.6 380.9 286.61977 321.2 379.1 292.2 477.2 301.1 286.7 94.0 185.7 216.0 133.7 175.8 371.3 269.51978 348.7 313.3 498.7 334.7 402.0 196.4 248.0 119.2 151.1 324.5 324.8 424.2 307.11979 247.2 280.7 282.8 400.3 297.1 187.8 151.5 148.5 144.0 196.4 238.1 156.9 227.61980 314.4 205.0 330.3 402.9 164.3 132.1 171.8 263.2 168.6 222.9 604.0 442.2 285.11981 395.9 317.0 481.5 405.2 277.6 186.3 214.0 129.6 274.5 275.9 188.8 303.6 287.51982 397.7 604.8 343.3 293.8 226.8 169.3 184.9 79.2 59.4 83.2 67.7 249.1 229.91983 466.4 215.5 230.7 278.3 345.6 130.6 144.4 112.3 51.0 215.2 185.2 381.8 229.81984 225.0 281.1 546.0 417.9 243.6 183.9 167.3 238.5 208.3 190.4 306.5 388.3 283.1
Ave 288.4 275.5 316.0 338.5 264.9 164.2 139.3 142.5 131.1 159.1 207.0 273.0 225.0
Num 25
Collected Monthly Runoff Unit:m3/s
Year Jan Feb Mar Apr May Jun Jul Aug Sep Oct Nov Dec Ave
1998 102.9 140.5 211.0 205.3 178.6 132.8 85.8 110.6 94.6 111.5 113.3 83.7 130.91999 411.8 311.0 172.5 308.2 317.7 159.4 133.4 92.7 85.3 132.6 373.9 330.1 235.7
Ave 257.4 225.7 191.8 256.8 248.1 146.1 109.6 101.7 89.9 122.0 243.6 206.9 183.3
Num 2
Final Report (Supporting_MP) Part 7 Preliminary Hydrological Evaluation Results
JICA Project for the Master Plan Study of 7-19 August, 2011 Hydropower Development in Indonesia
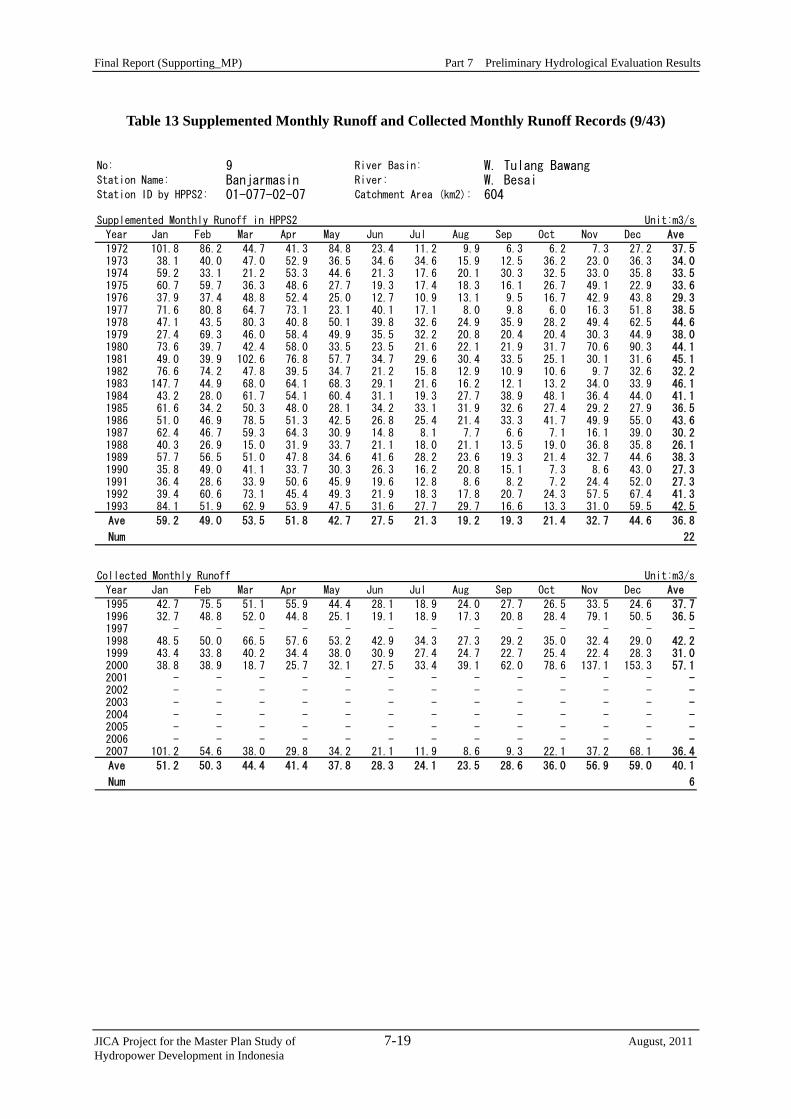
Table 13 Supplemented Monthly Runoff and Collected Monthly Runoff Records (9/43)
No: 9 River Basin: W. Tulang BawangStation Name: Banjarmasin River: W. BesaiStation ID by HPPS2: 01-077-02-07 Catchment Area (km2): 604
Supplemented Monthly Runoff in HPPS2 Unit:m3/s
Year Jan Feb Mar Apr May Jun Jul Aug Sep Oct Nov Dec Ave
1972 101.8 86.2 44.7 41.3 84.8 23.4 11.2 9.9 6.3 6.2 7.3 27.2 37.51973 38.1 40.0 47.0 52.9 36.5 34.6 34.6 15.9 12.5 36.2 23.0 36.3 34.01974 59.2 33.1 21.2 53.3 44.6 21.3 17.6 20.1 30.3 32.5 33.0 35.8 33.51975 60.7 59.7 36.3 48.6 27.7 19.3 17.4 18.3 16.1 26.7 49.1 22.9 33.61976 37.9 37.4 48.8 52.4 25.0 12.7 10.9 13.1 9.5 16.7 42.9 43.8 29.31977 71.6 80.8 64.7 73.1 23.1 40.1 17.1 8.0 9.8 6.0 16.3 51.8 38.51978 47.1 43.5 80.3 40.8 50.1 39.8 32.6 24.9 35.9 28.2 49.4 62.5 44.61979 27.4 69.3 46.0 58.4 49.9 35.5 32.2 20.8 20.4 20.4 30.3 44.9 38.01980 73.6 39.7 42.4 58.0 33.5 23.5 21.6 22.1 21.9 31.7 70.6 90.3 44.11981 49.0 39.9 102.6 76.8 57.7 34.7 29.6 30.4 33.5 25.1 30.1 31.6 45.11982 76.6 74.2 47.8 39.5 34.7 21.2 15.8 12.9 10.9 10.6 9.7 32.6 32.21983 147.7 44.9 68.0 64.1 68.3 29.1 21.6 16.2 12.1 13.2 34.0 33.9 46.11984 43.2 28.0 61.7 54.1 60.4 31.1 19.3 27.7 38.9 48.1 36.4 44.0 41.11985 61.6 34.2 50.3 48.0 28.1 34.2 33.1 31.9 32.6 27.4 29.2 27.9 36.51986 51.0 46.9 78.5 51.3 42.5 26.8 25.4 21.4 33.3 41.7 49.9 55.0 43.61987 62.4 46.7 59.3 64.3 30.9 14.8 8.1 7.7 6.6 7.1 16.1 39.0 30.21988 40.3 26.9 15.0 31.9 33.7 21.1 18.0 21.1 13.5 19.0 36.8 35.8 26.11989 57.7 56.5 51.0 47.8 34.6 41.6 28.2 23.6 19.3 21.4 32.7 44.6 38.31990 35.8 49.0 41.1 33.7 30.3 26.3 16.2 20.8 15.1 7.3 8.6 43.0 27.31991 36.4 28.6 33.9 50.6 45.9 19.6 12.8 8.6 8.2 7.2 24.4 52.0 27.31992 39.4 60.6 73.1 45.4 49.3 21.9 18.3 17.8 20.7 24.3 57.5 67.4 41.31993 84.1 51.9 62.9 53.9 47.5 31.6 27.7 29.7 16.6 13.3 31.0 59.5 42.5
Ave 59.2 49.0 53.5 51.8 42.7 27.5 21.3 19.2 19.3 21.4 32.7 44.6 36.8
Num 22
Collected Monthly Runoff Unit:m3/s
Year Jan Feb Mar Apr May Jun Jul Aug Sep Oct Nov Dec Ave
1995 42.7 75.5 51.1 55.9 44.4 28.1 18.9 24.0 27.7 26.5 33.5 24.6 37.71996 32.7 48.8 52.0 44.8 25.1 19.1 18.9 17.3 20.8 28.4 79.1 50.5 36.51997 - - - - - - - - - - - - -1998 48.5 50.0 66.5 57.6 53.2 42.9 34.3 27.3 29.2 35.0 32.4 29.0 42.21999 43.4 33.8 40.2 34.4 38.0 30.9 27.4 24.7 22.7 25.4 22.4 28.3 31.02000 38.8 38.9 18.7 25.7 32.1 27.5 33.4 39.1 62.0 78.6 137.1 153.3 57.12001 - - - - - - - - - - - - -2002 - - - - - - - - - - - - -2003 - - - - - - - - - - - - -2004 - - - - - - - - - - - - -2005 - - - - - - - - - - - - -2006 - - - - - - - - - - - - -2007 101.2 54.6 38.0 29.8 34.2 21.1 11.9 8.6 9.3 22.1 37.2 68.1 36.4
Ave 51.2 50.3 44.4 41.4 37.8 28.3 24.1 23.5 28.6 36.0 56.9 59.0 40.1
Num 6
Final Report (Supporting_MP) Part 7 Preliminary Hydrological Evaluation Results
JICA Project for the Master Plan Study of 7-20 August, 2011 Hydropower Development in Indonesia
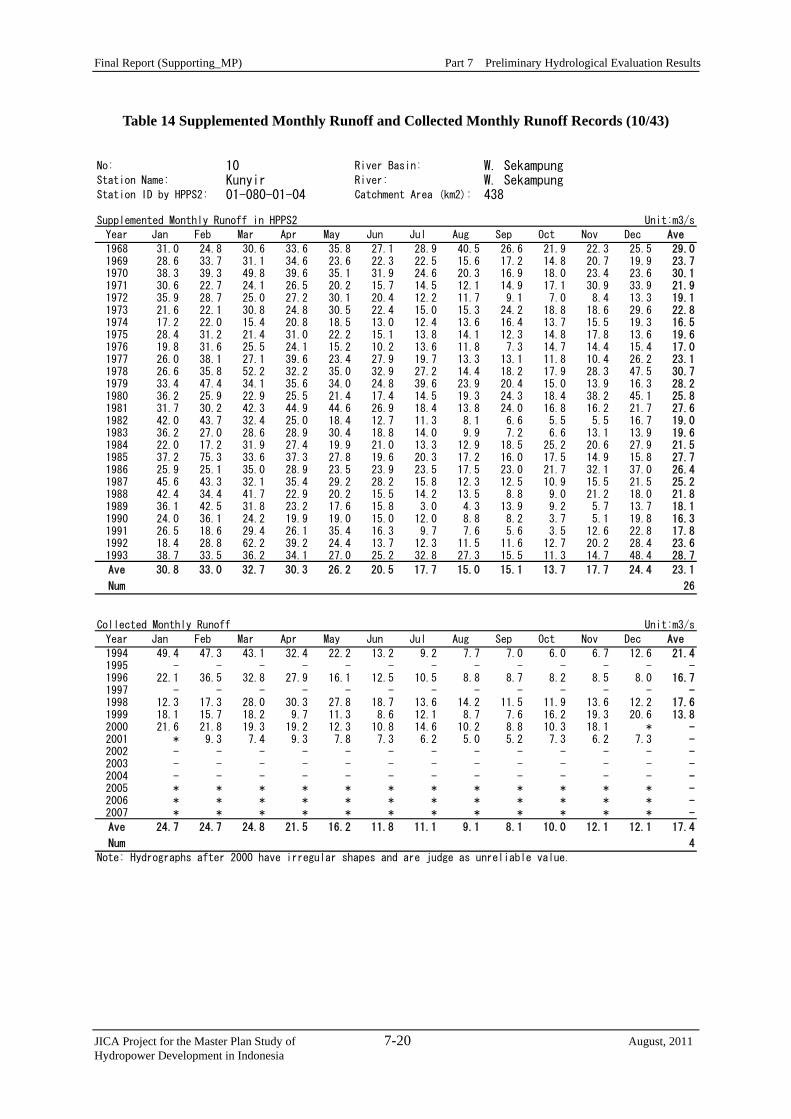
Table 14 Supplemented Monthly Runoff and Collected Monthly Runoff Records (10/43)
No: 10 River Basin: W. SekampungStation Name: Kunyir River: W. SekampungStation ID by HPPS2: 01-080-01-04 Catchment Area (km2): 438
Supplemented Monthly Runoff in HPPS2 Unit:m3/s
Year Jan Feb Mar Apr May Jun Jul Aug Sep Oct Nov Dec Ave
1968 31.0 24.8 30.6 33.6 35.8 27.1 28.9 40.5 26.6 21.9 22.3 25.5 29.01969 28.6 33.7 31.1 34.6 23.6 22.3 22.5 15.6 17.2 14.8 20.7 19.9 23.71970 38.3 39.3 49.8 39.6 35.1 31.9 24.6 20.3 16.9 18.0 23.4 23.6 30.11971 30.6 22.7 24.1 26.5 20.2 15.7 14.5 12.1 14.9 17.1 30.9 33.9 21.91972 35.9 28.7 25.0 27.2 30.1 20.4 12.2 11.7 9.1 7.0 8.4 13.3 19.11973 21.6 22.1 30.8 24.8 30.5 22.4 15.0 15.3 24.2 18.8 18.6 29.6 22.81974 17.2 22.0 15.4 20.8 18.5 13.0 12.4 13.6 16.4 13.7 15.5 19.3 16.51975 28.4 31.2 21.4 31.0 22.2 15.1 13.8 14.1 12.3 14.8 17.8 13.6 19.61976 19.8 31.6 25.5 24.1 15.2 10.2 13.6 11.8 7.3 14.7 14.4 15.4 17.01977 26.0 38.1 27.1 39.6 23.4 27.9 19.7 13.3 13.1 11.8 10.4 26.2 23.11978 26.6 35.8 52.2 32.2 35.0 32.9 27.2 14.4 18.2 17.9 28.3 47.5 30.71979 33.4 47.4 34.1 35.6 34.0 24.8 39.6 23.9 20.4 15.0 13.9 16.3 28.21980 36.2 25.9 22.9 25.5 21.4 17.4 14.5 19.3 24.3 18.4 38.2 45.1 25.81981 31.7 30.2 42.3 44.9 44.6 26.9 18.4 13.8 24.0 16.8 16.2 21.7 27.61982 42.0 43.7 32.4 25.0 18.4 12.7 11.3 8.1 6.6 5.5 5.5 16.7 19.01983 36.2 27.0 28.6 28.9 30.4 18.8 14.0 9.9 7.2 6.6 13.1 13.9 19.61984 22.0 17.2 31.9 27.4 19.9 21.0 13.3 12.9 18.5 25.2 20.6 27.9 21.51985 37.2 75.3 33.6 37.3 27.8 19.6 20.3 17.2 16.0 17.5 14.9 15.8 27.71986 25.9 25.1 35.0 28.9 23.5 23.9 23.5 17.5 23.0 21.7 32.1 37.0 26.41987 45.6 43.3 32.1 35.4 29.2 28.2 15.8 12.3 12.5 10.9 15.5 21.5 25.21988 42.4 34.4 41.7 22.9 20.2 15.5 14.2 13.5 8.8 9.0 21.2 18.0 21.81989 36.1 42.5 31.8 23.2 17.6 15.8 3.0 4.3 13.9 9.2 5.7 13.7 18.11990 24.0 36.1 24.2 19.9 19.0 15.0 12.0 8.8 8.2 3.7 5.1 19.8 16.31991 26.5 18.6 29.4 26.1 35.4 16.3 9.7 7.6 5.6 3.5 12.6 22.8 17.81992 18.4 28.8 62.2 39.2 24.4 13.7 12.3 11.5 11.6 12.7 20.2 28.4 23.61993 38.7 33.5 36.2 34.1 27.0 25.2 32.8 27.3 15.5 11.3 14.7 48.4 28.7
Ave 30.8 33.0 32.7 30.3 26.2 20.5 17.7 15.0 15.1 13.7 17.7 24.4 23.1
Num 26
Collected Monthly Runoff Unit:m3/s
Year Jan Feb Mar Apr May Jun Jul Aug Sep Oct Nov Dec Ave
1994 49.4 47.3 43.1 32.4 22.2 13.2 9.2 7.7 7.0 6.0 6.7 12.6 21.41995 - - - - - - - - - - - - -1996 22.1 36.5 32.8 27.9 16.1 12.5 10.5 8.8 8.7 8.2 8.5 8.0 16.71997 - - - - - - - - - - - - -1998 12.3 17.3 28.0 30.3 27.8 18.7 13.6 14.2 11.5 11.9 13.6 12.2 17.61999 18.1 15.7 18.2 9.7 11.3 8.6 12.1 8.7 7.6 16.2 19.3 20.6 13.82000 21.6 21.8 19.3 19.2 12.3 10.8 14.6 10.2 8.8 10.3 18.1 * -2001 * 9.3 7.4 9.3 7.8 7.3 6.2 5.0 5.2 7.3 6.2 7.3 -2002 - - - - - - - - - - - - -2003 - - - - - - - - - - - - -2004 - - - - - - - - - - - - -2005 * * * * * * * * * * * * -2006 * * * * * * * * * * * * -2007 * * * * * * * * * * * * -
Ave 24.7 24.7 24.8 21.5 16.2 11.8 11.1 9.1 8.1 10.0 12.1 12.1 17.4
Num 4
Note: Hydrographs after 2000 have irregular shapes and are judge as unreliable value.

Final Report (Supporting_MP) Part 7 Preliminary Hydrological Evaluation Results
JICA Project for the Master Plan Study of 7-21 August, 2011 Hydropower Development in Indonesia
Table 15 Supplemented Monthly Runoff and Collected Monthly Runoff Records (11/43)
No: 11 River Basin: Kr. AcehStation Name: Kp. Darang River: Kr. AcehStation ID by HPPS2: 01-001-01-01 Catchment Area (km2): 1,081
Supplemented Monthly Runoff in HPPS2 Unit:m3/s
Year Jan Feb Mar Apr May Jun Jul Aug Sep Oct Nov Dec Ave
1977 40.9 33.5 23.9 28.5 35.2 18.8 9.5 8.1 12.0 45.2 85.1 73.1 34.51978 55.8 41.1 48.5 72.6 87.2 18.8 17.4 13.0 18.8 33.9 47.1 54.2 42.41979 22.1 22.6 20.9 25.2 25.7 34.0 29.4 21.6 36.0 21.4 37.7 33.9 27.51980 23.1 19.3 37.8 47.2 38.0 30.9 15.0 8.1 23.0 63.1 52.5 75.0 36.11981 37.0 27.9 24.0 44.3 67.3 22.4 9.9 13.0 36.7 33.8 23.6 15.1 29.61982 12.1 16.8 35.2 54.1 40.9 31.1 13.7 10.0 9.4 28.4 101.0 48.2 33.41983 37.4 35.1 50.3 32.1 64.6 37.3 14.3 10.7 23.9 31.5 33.4 135.7 42.21984 58.3 58.6 65.3 44.2 29.1 16.0 18.8 6.1 5.9 5.8 12.5 50.6 30.91985 28.0 60.1 47.4 46.5 47.3 17.5 8.4 7.2 7.2 24.2 48.4 43.7 32.21986 49.7 19.0 32.3 53.2 70.7 28.1 13.1 11.5 22.4 23.4 29.0 60.1 34.41987 29.9 28.6 44.4 41.8 80.2 37.0 17.2 24.5 20.4 62.8 79.6 76.2 45.21988 35.3 52.9 14.2 31.6 48.3 23.9 15.0 13.0 18.8 33.9 47.1 54.2 32.41989 21.6 19.6 45.0 39.6 22.9 15.3 27.4 17.1 26.9 32.7 32.3 22.7 26.91990 - - - - - - - - - - - - -1991 33.5 22.6 31.9 38.8 38.5 22.5 15.7 17.8 15.1 43.9 49.0 33.2 30.21992 33.5 16.9 18.0 31.4 33.2 21.0 18.3 19.0 19.5 20.1 22.5 28.8 23.51993 24.9 29.7 34.3 35.0 31.0 17.7 16.9 15.2 21.5 27.7 47.2 41.2 28.5
Ave 33.9 31.5 35.8 41.6 47.5 24.5 16.2 13.5 19.8 33.2 46.8 52.9 33.1
Num 16
Collected Monthly Runoff Unit:m3/s
Year Jan Feb Mar Apr May Jun Jul Aug Sep Oct Nov Dec Ave
1994 17.7 37.1 27.5 23.2 18.1 14.0 12.3 15.5 12.9 51.2 55.0 26.7 25.91995 31.4 32.5 67.3 46.5 55.9 28.8 20.2 27.7 25.3 24.9 26.9 30.7 34.91996 27.1 45.1 29.4 59.7 32.8 38.2 48.1 22.0 19.4 11.1 18.4 39.9 32.61997 - - - - - - - - - - - - -1998 - - - - - - - - - - - - -1999 - - - - - - - - - - - - -2000 - - - - - - - - - - - - -2001 - - - - - - - - - - - - -2002 - - - - - - - - - - - - -2003 - - - - - - - - - - - - -2004 - - - - - - - - - - - - -2005 - - - - - - - - - - - - -2006 - - - - - - - - - - - - -2007 - - - - - - - - - - - - -2008 * * * * * * * * * * * * -
Ave 25.4 38.2 41.4 43.1 35.6 27.0 26.9 21.7 19.2 29.1 33.4 32.4 31.1
Num 3
Note: Hydrograph in 2008 has irregular shape and is judge as unreliable value.

Final Report (Supporting_MP) Part 7 Preliminary Hydrological Evaluation Results
JICA Project for the Master Plan Study of 7-22 August, 2011 Hydropower Development in Indonesia
Table 16 Supplemented Monthly Runoff and Collected Monthly Runoff Records (12/43)
No: 12 River Basin: Kr. TeunomStation Name: Tui Kareng River: Kr. TeunomStation ID by HPPS2: 01-205-01-01 Catchment Area (km2): 2,403
Supplemented Monthly Runoff in HPPS2 Unit:m3/s
Year Jan Feb Mar Apr May Jun Jul Aug Sep Oct Nov Dec Ave
1982 71.8 117.8 125.9 81.2 254.3 125.4 160.4 73.2 117.2 182.3 361.9 229.4 158.41983 113.5 80.9 215.0 115.7 332.5 122.1 97.1 94.7 230.4 198.3 209.3 258.0 172.31984 271.5 203.8 250.9 255.7 186.0 137.3 131.6 76.6 89.7 390.6 175.0 162.1 194.21985 151.0 174.0 261.0 211.0 238.0 130.0 71.8 79.7 88.8 205.0 266.0 238.0 176.21986 137.0 71.6 198.0 386.0 402.0 206.0 87.6 107.0 222.0 230.0 228.0 194.0 205.81987 377.9 89.5 173.0 185.0 173.0 102.0 72.2 353.0 128.0 244.0 225.0 378.0 208.41988 237.0 316.0 214.0 168.0 383.0 90.3 71.9 103.0 222.0 139.0 202.0 195.0 195.11989 134.0 118.0 318.0 275.0 144.0 84.1 179.0 98.4 175.0 218.0 218.0 142.0 175.31990 - - - - - - - - - - - - -1991 227.0 142.0 215.0 269.0 267.0 141.0 87.6 104.0 82.6 309.0 350.0 225.0 201.61992 227.0 97.6 107.0 202.0 219.0 120.0 110.0 114.0 119.0 122.0 140.0 190.0 147.31993 160.0 197.0 234.0 239.0 208.0 103.0 96.4 83.6 133.0 182.0 335.0 288.0 188.3
Ave 191.6 146.2 210.2 217.1 255.2 123.7 106.0 117.0 146.2 220.0 246.4 227.2 183.9
Num 11
Collected Monthly Runoff Unit:m3/s
Year Jan Feb Mar Apr May Jun Jul Aug Sep Oct Nov Dec Ave
1994 222.5 332.3 309.7 347.2 234.1 148.4 72.6 119.5 93.2 321.3 395.6 275.2 239.31995 149.2 102.1 330.9 308.2 262.9 169.2 271.4 220.3 192.7 194.9 292.9 210.2 225.41996 111.0 245.1 149.1 213.1 158.6 185.6 128.8 88.1 127.9 260.0 209.5 204.2 173.4
Ave 160.9 226.5 263.2 289.5 218.5 167.7 157.6 142.6 137.9 258.7 299.3 229.9 212.7
Num 3

Final Report (Supporting_MP) Part 7 Preliminary Hydrological Evaluation Results
JICA Project for the Master Plan Study of 7-23 August, 2011 Hydropower Development in Indonesia
Table 17 Supplemented Monthly Runoff and Collected Monthly Runoff Records (13/43)
No: 13 River Basin: Bt. ToruStation Name: Hapesong Baru River: Bt. ToruStation ID by HPPS2: 01-178-01-01 Catchment Area (km2): 2,773
Supplemented Monthly Runoff in HPPS2 Unit:m3/s
Year Jan Feb Mar Apr May Jun Jul Aug Sep Oct Nov Dec Ave
1972 114.1 119.5 114.1 163.8 169.2 136.3 102.7 114.1 144.7 151.6 218.8 157.7 142.21973 167.4 126.6 144.7 175.6 178.8 179.6 102.4 100.2 148.7 123.1 120.5 143.0 142.61974 137.6 148.3 131.5 163.2 132.5 111.1 102.0 91.2 118.3 116.8 99.4 148.3 125.01975 147.9 167.4 140.0 132.9 104.8 95.7 104.4 92.2 107.9 92.0 100.2 98.0 115.31976 127.4 130.0 149.5 167.0 111.3 114.6 93.3 98.1 88.2 123.3 156.2 163.4 126.81977 179.8 159.7 149.6 169.6 148.9 132.0 93.2 84.3 117.3 179.6 249.3 197.5 155.11978 97.1 162.8 151.3 187.2 165.5 98.6 84.5 71.0 79.0 132.2 200.0 155.7 132.11979 147.5 130.0 126.2 111.5 102.4 103.2 94.5 87.8 123.9 114.6 162.1 163.2 122.21980 150.0 97.3 134.8 135.1 118.6 123.3 64.5 76.4 101.0 106.1 168.5 171.9 120.61981 151.3 151.3 105.4 158.7 201.6 141.2 93.9 93.2 130.7 125.3 114.8 120.6 132.31982 102.9 143.0 193.7 219.1 188.2 97.9 80.3 84.9 113.5 120.8 151.4 141.2 136.41983 134.4 110.9 111.7 109.2 119.8 99.1 82.8 81.1 137.3 127.7 99.1 175.7 115.71984 159.1 164.0 163.0 189.0 142.0 106.0 108.0 100.8 109.0 119.0 186.8 166.0 142.71985 138.0 131.0 149.2 167.0 144.0 77.5 68.5 87.1 95.5 109.0 157.0 180.0 125.31986 162.0 97.5 144.0 186.0 144.0 102.0 83.2 65.0 95.2 106.0 133.0 107.0 118.71987 132.7 129.4 130.4 132.5 107.1 102.6 90.5 111.7 101.9 106.5 156.9 160.8 121.91988 - - - - - - - - - - - - -1989 89.5 110.0 130.0 152.0 112.0 81.9 79.4 94.8 91.5 172.0 257.0 172.0 128.51990 137.0 85.0 110.0 118.0 133.0 71.7 86.5 88.6 91.6 114.0 137.0 193.0 113.81991 131.5 117.9 148.8 155.5 165.2 128.7 105.1 104.7 105.5 108.4 142.5 276.0 140.81992 163.0 110.0 93.8 134.0 116.0 60.7 67.0 72.5 82.6 84.1 222.0 197.0 116.91993 121.6 95.9 103.0 158.4 189.8 98.6 124.6 95.9 127.7 114.5 198.9 163.1 132.7
Ave 137.7 128.0 134.5 156.5 142.6 107.7 91.0 90.3 110.0 121.3 163.4 164.3 128.9
Num 21
Collected Monthly Runoff Unit:m3/s
Year Jan Feb Mar Apr May Jun Jul Aug Sep Oct Nov Dec Ave
1994 * * * * * * * * * * * * -1995 * * * * * * * * * * * * -1996 90.8 112.7 95.0 138.1 62.2 75.8 75.9 81.6 37.4 81.8 55.8 83.5 82.61997 71.3 59.1 97.6 61.9 62.8 50.0 48.1 39.7 34.7 47.0 74.8 57.3 58.71998 67.5 36.5 44.0 33.0 41.8 32.8 34.5 123.3 131.1 61.8 117.2 170.5 74.51999 - - - - - - - - - - - - -2000 - - - - - - - - - - - - -2001 - - - - - - - - - - - - -2002 - - - - - - - - - - - - -2003 - - - - - - - - - - - - -2004 98.4 100.8 78.3 117.9 79.5 83.8 86.7 99.5 75.8 125.1 177.6 172.3 108.02005 - - - - - - - - - - - - -2007 87.4 30.6 52.5 88.2 46.8 49.8 56.1 - - 108.4 48.3 73.3 -2008 221.7 117.2 133.3 173.7 100.3 127.1 45.0 55.5 61.1 - - - -
Ave 106.2 76.2 83.4 102.1 65.6 69.9 57.7 79.9 68.0 84.8 94.8 111.4 80.9
Num 4
Note: Maximum and average runoff in 1994 and 1995 are much lower than others and judged as unreliable value.

Final Report (Supporting_MP) Part 7 Preliminary Hydrological Evaluation Results
JICA Project for the Master Plan Study of 7-24 August, 2011 Hydropower Development in Indonesia
Table 18 Supplemented Monthly Runoff and Collected Monthly Runoff Records (14/43)
No: 14 River Basin: Bt. IndrapuraStation Name: Air Batu River: Bt. IndrapuraStation ID by HPPS2: 01-141-01-01 Catchment Area (km2): 468
Supplemented Monthly Runoff in HPPS2 Unit:m3/s
Year Jan Feb Mar Apr May Jun Jul Aug Sep Oct Nov Dec Ave
1973 33.2 26.1 26.2 56.4 39.1 33.9 18.9 43.1 18.2 27.2 32.2 28.6 31.91974 15.5 18.0 10.2 39.0 41.3 22.8 30.0 18.2 41.3 43.1 30.4 42.5 29.41975 24.3 33.0 26.6 26.3 27.9 22.4 15.7 15.4 16.7 14.3 30.6 10.9 22.01976 18.1 15.3 20.4 27.9 35.2 23.4 18.3 17.1 20.0 43.3 45.9 40.0 27.11977 40.4 32.1 31.3 41.5 46.3 22.4 15.7 15.4 16.7 14.3 30.6 10.9 26.51978 38.2 22.7 46.2 40.3 35.6 21.0 26.5 21.4 29.0 32.9 38.4 58.8 34.31979 40.4 41.1 32.0 40.3 28.7 28.0 35.7 23.9 36.3 30.6 62.6 32.2 36.01980 28.7 20.4 28.6 48.1 38.8 37.4 19.3 18.9 21.8 30.3 45.6 35.9 31.21981 30.7 36.2 43.7 41.0 42.1 24.1 21.7 13.9 33.9 53.6 28.8 33.5 33.61982 37.3 66.9 60.1 55.6 58.4 36.4 19.4 13.8 13.6 24.6 38.7 73.3 41.51983 57.4 37.0 45.8 50.9 39.8 23.4 18.2 17.6 30.8 34.7 33.4 53.3 36.91984 39.9 21.5 45.3 39.5 38.4 26.2 19.4 25.7 37.5 27.0 34.1 31.7 32.21985 44.2 47.7 30.8 21.3 34.7 18.1 13.7 20.5 30.3 28.8 36.9 23.9 29.21986 27.2 10.5 35.5 30.6 25.7 13.5 16.3 11.9 10.4 25.1 23.2 30.7 21.71987 51.0 20.8 18.1 24.3 25.6 9.3 8.1 4.9 6.7 27.5 26.2 23.7 20.51988 60.9 35.4 12.7 16.4 8.8 7.5 7.6 13.2 20.7 16.2 56.7 17.5 22.81989 36.7 28.3 29.7 29.8 27.8 23.5 21.0 20.5 24.6 32.8 26.0 25.0 27.11990 30.5 33.7 28.4 29.1 27.8 21.2 20.0 20.1 28.7 32.8 26.0 25.0 26.91991 - - - - - - - - - - - - -1992 49.3 46.9 37.1 36.9 33.2 30.4 15.0 35.3 37.9 42.7 42.3 57.5 38.71993 83.4 46.2 64.3 72.5 77.3 38.8 41.1 43.2 42.9 48.0 52.1 61.4 55.9
Ave 39.4 32.0 33.7 38.4 36.6 24.2 20.1 20.7 25.9 31.5 37.0 35.8 31.3
Num 20
Collected Monthly Runoff Unit:m3/s
Year Jan Feb Mar Apr May Jun Jul Aug Sep Oct Nov Dec Ave
1995 58.4 50.9 32.9 43.2 72.8 37.8 44.5 35.7 56.2 60.2 58.3 63.1 51.11996 51.3 48.7 45.4 53.0 38.3 43.3 33.7 39.3 33.2 54.3 42.5 60.6 45.31997 50.1 35.1 16.4 40.1 63.5 36.1 35.7 30.3 30.8 28.9 29.1 29.0 35.41998 41.3 43.9 47.1 44.8 42.1 28.3 24.3 32.7 44.5 40.6 38.2 48.2 39.71999 54.2 47.4 69.1 29.4 30.0 29.0 30.9 27.9 38.1 43.2 67.0 39.5 42.12000 51.1 33.3 21.2 30.8 26.9 24.8 29.2 30.8 33.4 32.3 69.5 53.3 36.42001 * * * * * * * * * * * * -2002 - - - - - - - - - - - - -2003 - - - - - - - - - - - - -2004 - - - - - - - - - - - - -2005 - - - - - - - - - - - - -2006 - - - - - - - - - - - - -2007 - - - - - - - - - - - - -2008 * * * * * * * * * * * * -
Ave 51.0 43.2 38.7 40.2 45.6 33.2 33.1 32.8 39.4 43.2 50.8 48.9 41.7
Num 6
Note: Hydrographs after 2001 have irregular shape and are judge as unreliable value.

Final Report (Supporting_MP) Part 7 Preliminary Hydrological Evaluation Results
JICA Project for the Master Plan Study of 7-25 August, 2011 Hydropower Development in Indonesia
Table 19 Supplemented Monthly Runoff and Collected Monthly Runoff Records (15/43)
No: 15 River Basin: Bt. PasamanStation Name: Air Gadang River: Bt. PasamanStation ID by HPPS2: 01-165-01-01 Catchment Area (km2): 1,339
Supplemented Monthly Runoff in HPPS2 Unit:m3/s
Year Jan Feb Mar Apr May Jun Jul Aug Sep Oct Nov Dec Ave
1973 106.8 92.0 114.1 188.4 144.2 108.5 75.4 128.5 143.4 128.5 111.9 131.1 122.71974 63.1 78.4 72.8 117.9 113.6 82.2 58.0 88.6 182.5 126.8 166.3 4.0 96.21975 90.3 57.0 93.0 154.9 74.9 70.3 91.7 69.5 167.6 79.8 120.0 168.1 103.11976 125.0 76.8 116.0 159.3 76.7 110.1 111.0 106.1 89.9 273.2 301.6 138.3 140.31977 130.2 130.0 100.1 107.6 92.5 90.4 63.0 83.4 126.4 167.5 292.9 128.7 126.11978 108.7 121.3 163.2 207.1 163.4 130.6 120.7 84.2 80.0 154.0 213.5 121.9 139.11979 93.5 72.3 81.1 140.6 88.3 117.0 106.2 93.4 231.4 155.0 300.4 174.1 137.81980 78.0 52.0 136.0 212.8 239.8 107.9 72.0 78.6 76.6 216.0 165.0 212.0 137.21981 116.0 112.0 58.7 114.0 175.2 85.5 86.7 50.4 175.0 210.4 118.1 51.2 112.81982 44.9 98.9 62.3 154.4 152.1 70.7 60.2 57.9 85.9 118.3 143.4 130.5 98.31983 76.4 36.6 97.0 149.1 169.4 113.5 85.6 95.1 128.0 142.8 121.6 169.4 115.41984 70.3 84.9 116.0 280.2 149.6 94.6 112.3 83.8 142.8 157.6 179.3 154.3 135.51985 113.6 135.7 146.8 141.3 137.4 88.6 92.8 100.0 128.9 114.5 162.5 121.7 123.71986 63.5 47.2 143.0 192.0 120.1 93.7 85.6 88.0 163.0 180.0 182.0 75.2 119.41987 67.3 93.7 145.5 177.4 188.9 103.0 100.0 141.3 147.6 224.1 182.2 131.1 141.81988 143.8 140.4 143.0 153.6 146.4 110.2 125.5 91.2 136.7 155.7 183.2 151.5 140.11989 85.2 108.5 108.1 118.3 107.7 63.9 98.3 126.4 191.0 192.3 248.4 126.8 131.21990 86.0 73.3 85.2 131.1 165.1 123.4 173.1 150.6 167.2 150.0 206.2 127.2 136.51991 - - - - - - - - - - - - -1992 49.0 43.5 68.0 83.6 98.2 92.5 70.1 59.6 94.7 90.4 121.0 98.1 80.71993 94.1 63.0 136.0 84.1 89.7 67.7 59.8 46.5 75.5 77.7 125.0 137.0 88.0
Ave 90.3 85.9 109.3 153.4 134.7 96.2 92.4 91.2 136.7 155.7 182.2 127.6 121.3
Num 20
Collected Monthly Runoff Unit:m3/s
Year Jan Feb Mar Apr May Jun Jul Aug Sep Oct Nov Dec Ave
1996 106.5 85.4 133.7 171.3 74.3 113.5 108.1 157.2 78.0 132.0 139.2 90.0 115.81997 64.9 45.7 56.0 68.4 84.5 65.2 77.1 59.4 67.4 58.1 197.9 67.6 76.01998 94.5 84.2 73.4 79.3 68.4 70.9 74.8 140.9 93.3 107.7 123.3 142.2 96.11999 - - - - - - - - - - - - -2000 72.7 51.1 57.5 81.3 71.2 109.8 108.9 144.2 125.7 111.4 171.7 126.0 102.62001 106.1 113.0 97.2 128.7 112.5 95.4 90.3 89.7 136.1 120.3 121.3 109.0 110.0
Ave 88.9 75.9 83.6 105.8 82.2 91.0 91.9 118.3 100.1 105.9 150.7 107.0 100.1
Num 5

Final Report (Supporting_MP) Part 7 Preliminary Hydrological Evaluation Results
JICA Project for the Master Plan Study of 7-26 August, 2011 Hydropower Development in Indonesia
Table 20 Supplemented Monthly Runoff and Collected Monthly Runoff Records (16/43)
No: 16 River Basin: A. MusiStation Name: Despetah River: A. MusiStation ID by HPPS2: 01-074-01-02 Catchment Area (km2): 627
Supplemented Monthly Runoff in HPPS2 Unit:m3/s
Year Jan Feb Mar Apr May Jun Jul Aug Sep Oct Nov Dec Ave
1974 33.8 48.3 31.3 37.3 47.1 31.7 26.4 23.3 49.7 44.7 55.9 69.7 41.61975 65.5 59.6 48.3 62.7 47.6 24.6 33.5 29.7 32.2 32.9 39.8 36.7 42.71976 62.5 52.7 75.0 68.0 44.0 26.7 26.3 26.1 25.4 70.2 56.6 54.2 49.01977 99.4 79.1 63.5 48.7 45.2 43.0 34.4 27.2 26.3 18.3 34.9 67.7 49.01978 53.0 43.0 61.4 45.7 66.4 32.5 30.6 24.5 30.0 54.7 59.6 88.7 49.21979 89.2 56.8 52.7 56.8 44.9 35.7 30.1 33.7 42.7 40.7 62.3 57.4 50.21980 63.4 43.8 67.9 77.7 47.8 36.2 28.6 34.8 39.2 48.7 82.5 76.0 53.91981 52.5 66.3 54.7 67.8 56.4 33.7 37.9 28.3 42.5 60.7 45.9 33.4 48.31982 53.7 68.0 61.4 54.9 43.1 32.9 20.4 18.5 16.3 15.6 14.8 36.0 36.31983 67.4 38.7 34.1 39.5 38.4 33.7 25.1 20.9 21.5 29.8 48.6 46.8 37.01984 62.9 39.9 77.1 78.4 75.0 44.4 38.0 31.8 38.2 48.5 38.0 48.0 51.71985 43.4 45.9 53.9 39.7 38.6 27.2 30.4 26.1 27.6 25.8 45.6 38.7 36.91986 37.6 43.8 68.0 66.2 32.9 27.0 26.1 27.0 39.3 55.4 50.4 50.3 43.71987 83.8 58.2 49.9 66.5 77.9 37.9 24.9 19.7 19.9 28.3 48.4 58.2 47.81988 77.4 54.2 50.4 50.7 37.8 30.0 22.9 25.0 40.7 36.4 63.5 65.4 46.21989 84.8 70.6 48.2 58.8 39.8 31.0 21.5 20.0 31.3 45.3 66.7 73.5 49.31990 58.9 41.7 39.3 42.8 44.5 29.3 33.0 27.1 33.6 28.5 47.1 68.8 41.21991 92.5 73.4 58.6 46.8 28.3 18.0 14.9 26.7 14.2 13.0 28.2 61.9 39.7
Ave 65.6 54.7 55.3 56.0 47.5 32.0 28.0 26.1 31.7 38.7 49.4 57.3 45.2
Num 18
Collected Monthly Runoff Unit:m3/s
Year Jan Feb Mar Apr May Jun Jul Aug Sep Oct Nov Dec Ave
- - - - - - - - - - - - - -- - - - - - - - - - - - - -- - - - - - - - - - - - - -- - - - - - - - - - - - - -
Ave - - - - - - - - - - - - -
Num 0

Final Report (Supporting_MP) Part 7 Preliminary Hydrological Evaluation Results
JICA Project for the Master Plan Study of 7-27 August, 2011 Hydropower Development in Indonesia
Table 21 Supplemented Monthly Runoff and Collected Monthly Runoff Records (17/43)
No: 17 River Basin: S. KapuasStation Name: Silat damsite River: S. SilatStation ID by HPPS2: - Catchment Area (km2): 1,312
Supplemented Monthly Runoff in HPPS2 Unit:m3/s
Year Jan Feb Mar Apr May Jun Jul Aug Sep Oct Nov Dec Ave
1979 60.3 84.7 32.9 105.2 131.0 78.0 85.4 26.0 121.7 34.8 124.4 107.1 82.61980 129.8 80.0 82.7 135.1 80.0 59.4 20.3 48.1 35.7 90.6 116.3 84.1 80.21981 55.3 39.7 59.9 53.8 85.9 34.1 35.0 14.4 101.5 11.8 103.4 83.2 56.51982 108.4 71.6 74.8 102.4 97.7 60.5 13.4 7.2 9.5 23.3 51.4 72.4 57.71983 190.9 78.0 15.9 37.4 42.7 41.2 58.6 47.6 72.8 44.6 104.1 129.5 71.91984 165.5 78.3 19.5 87.8 60.3 34.9 99.1 30.0 172.0 79.9 82.9 95.1 83.81985 91.0 47.4 73.5 157.3 135.0 60.7 17.8 22.1 62.2 35.2 67.7 112.8 73.61986 98.6 72.7 59.7 60.6 83.1 45.5 10.3 41.4 103.6 89.0 113.3 83.4 71.81987 122.5 86.8 12.2 46.4 107.8 56.2 26.7 22.4 19.3 56.6 93.9 62.9 59.51988 402.8 89.7 82.5 92.3 61.2 52.2 33.5 8.3 46.9 105.5 151.2 103.3 102.51989 66.8 53.4 94.9 65.1 58.6 70.1 26.6 29.3 128.7 37.0 92.1 84.8 67.31990 59.5 78.0 49.9 121.8 99.4 41.4 37.2 41.6 28.2 35.1 128.8 101.0 68.51991 88.8 81.9 18.0 74.1 68.5 27.2 147.5 39.8 204.7 56.4 76.7 100.2 82.01992 114.0 45.6 73.6 154.0 141.1 57.9 19.2 11.1 97.4 31.6 61.8 110.6 76.51993 91.4 93.2 45.6 54.7 76.8 46.4 13.4 21.6 137.5 92.3 105.0 80.5 71.5
Ave 123.0 72.1 53.0 89.9 88.6 51.0 42.9 27.4 89.4 54.9 98.2 94.1 73.7
Num 15
Collected Monthly Runoff Unit:m3/s
Year Jan Feb Mar Apr May Jun Jul Aug Sep Oct Nov Dec Ave
- - - - - - - - - - - - - -- - - - - - - - - - - - - -- - - - - - - - - - - - - -- - - - - - - - - - - - - -
Ave - - - - - - - - - - - - -
Num 0
Final Report (Supporting_MP) Part 7 Preliminary Hydrological Evaluation Results
JICA Project for the Master Plan Study of 7-28 August, 2011 Hydropower Development in Indonesia
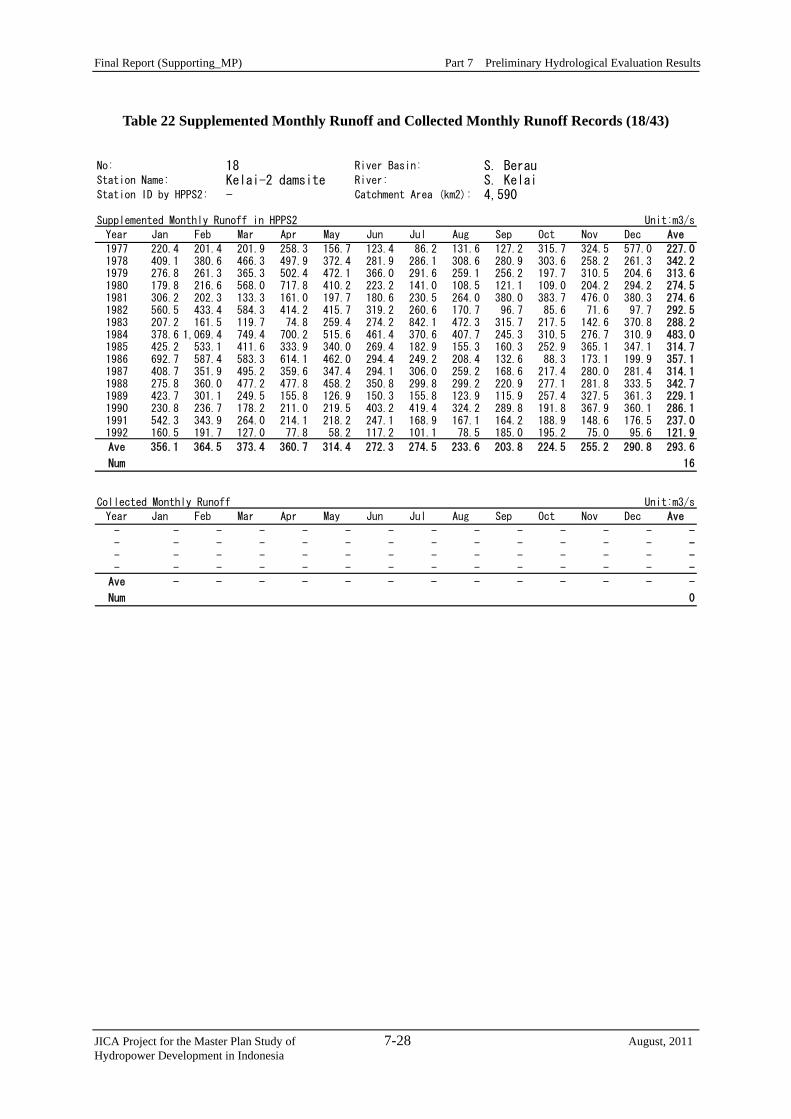
Table 22 Supplemented Monthly Runoff and Collected Monthly Runoff Records (18/43)
No: 18 River Basin: S. BerauStation Name: Kelai-2 damsite River: S. KelaiStation ID by HPPS2: - Catchment Area (km2): 4,590
Supplemented Monthly Runoff in HPPS2 Unit:m3/s
Year Jan Feb Mar Apr May Jun Jul Aug Sep Oct Nov Dec Ave
1977 220.4 201.4 201.9 258.3 156.7 123.4 86.2 131.6 127.2 315.7 324.5 577.0 227.01978 409.1 380.6 466.3 497.9 372.4 281.9 286.1 308.6 280.9 303.6 258.2 261.3 342.21979 276.8 261.3 365.3 502.4 472.1 366.0 291.6 259.1 256.2 197.7 310.5 204.6 313.61980 179.8 216.6 568.0 717.8 410.2 223.2 141.0 108.5 121.1 109.0 204.2 294.2 274.51981 306.2 202.3 133.3 161.0 197.7 180.6 230.5 264.0 380.0 383.7 476.0 380.3 274.61982 560.5 433.4 584.3 414.2 415.7 319.2 260.6 170.7 96.7 85.6 71.6 97.7 292.51983 207.2 161.5 119.7 74.8 259.4 274.2 842.1 472.3 315.7 217.5 142.6 370.8 288.21984 378.6 1,069.4 749.4 700.2 515.6 461.4 370.6 407.7 245.3 310.5 276.7 310.9 483.01985 425.2 533.1 411.6 333.9 340.0 269.4 182.9 155.3 160.3 252.9 365.1 347.1 314.71986 692.7 587.4 583.3 614.1 462.0 294.4 249.2 208.4 132.6 88.3 173.1 199.9 357.11987 408.7 351.9 495.2 359.6 347.4 294.1 306.0 259.2 168.6 217.4 280.0 281.4 314.11988 275.8 360.0 477.2 477.8 458.2 350.8 299.8 299.2 220.9 277.1 281.8 333.5 342.71989 423.7 301.1 249.5 155.8 126.9 150.3 155.8 123.9 115.9 257.4 327.5 361.3 229.11990 230.8 236.7 178.2 211.0 219.5 403.2 419.4 324.2 289.8 191.8 367.9 360.1 286.11991 542.3 343.9 264.0 214.1 218.2 247.1 168.9 167.1 164.2 188.9 148.6 176.5 237.01992 160.5 191.7 127.0 77.8 58.2 117.2 101.1 78.5 185.0 195.2 75.0 95.6 121.9
Ave 356.1 364.5 373.4 360.7 314.4 272.3 274.5 233.6 203.8 224.5 255.2 290.8 293.6
Num 16
Collected Monthly Runoff Unit:m3/s
Year Jan Feb Mar Apr May Jun Jul Aug Sep Oct Nov Dec Ave
- - - - - - - - - - - - - -- - - - - - - - - - - - - -- - - - - - - - - - - - - -- - - - - - - - - - - - - -
Ave - - - - - - - - - - - - -
Num 0

Final Report (Supporting_MP) Part 7 Preliminary Hydrological Evaluation Results
JICA Project for the Master Plan Study of 7-29 August, 2011 Hydropower Development in Indonesia
Table 23 Supplemented Monthly Runoff and Collected Monthly Runoff Records (19/43)
No: 19 River Basin: S. MartapuraStation Name: Sei Langsat (Riam Kiwa damsite) River: S. Riam KiwaStation ID by HPPS2: 03-026-01-01 Catchment Area (km2): 1,420
Supplemented Monthly Runoff in HPPS2 Unit:m3/s
Year Jan Feb Mar Apr May Jun Jul Aug Sep Oct Nov Dec Ave
1965 73.6 62.0 87.3 77.2 138.0 21.6 14.7 6.3 1.9 2.2 11.4 41.9 44.81966 55.6 119.4 90.2 90.6 80.9 46.4 31.6 30.5 28.8 19.0 30.5 150.6 64.51967 59.2 81.3 66.9 102.8 111.1 125.9 119.1 28.7 14.3 12.1 30.7 55.8 67.31968 131.1 86.5 148.6 150.8 91.3 62.7 64.9 101.9 45.2 21.8 43.2 70.4 84.91969 80.1 118.3 129.2 149.6 69.1 57.1 27.9 36.6 15.4 7.2 10.5 48.6 62.51970 72.1 121.4 123.2 89.8 90.7 83.0 88.7 49.0 35.4 38.2 49.4 126.8 80.61971 110.7 74.1 77.8 60.8 29.2 25.8 14.0 39.2 110.2 64.6 118.3 108.3 69.41972 95.5 88.9 126.9 128.5 91.8 33.0 32.2 4.9 5.0 2.3 5.8 23.9 53.21973 72.9 113.6 105.1 161.4 151.0 73.0 72.6 57.8 57.5 19.0 65.3 74.3 85.31974 34.8 138.9 84.7 53.6 23.8 9.1 34.1 4.2 42.2 38.8 74.4 87.7 52.21975 103.0 77.7 135.6 65.8 47.7 30.1 38.9 32.2 55.8 41.0 58.9 96.6 65.31976 128.2 69.9 63.4 39.0 15.6 12.4 6.0 2.7 2.4 8.1 32.6 74.9 37.91977 98.0 109.4 162.9 104.8 58.6 44.2 15.2 9.3 5.0 3.2 6.2 20.3 53.11978 58.8 73.0 124.5 75.5 80.3 40.4 26.7 21.0 21.8 24.4 26.8 79.6 54.41979 115.1 122.0 70.5 145.5 51.7 56.9 20.6 12.0 10.7 5.3 19.4 61.7 57.61980 107.5 65.7 60.5 123.1 62.9 70.0 21.0 9.7 5.6 12.1 24.4 82.9 53.81981 80.2 62.7 94.3 105.9 90.0 23.1 41.2 12.5 8.5 10.5 34.7 91.8 54.61982 149.0 115.5 115.0 90.4 53.9 28.9 8.5 3.4 0.4 1.3 5.2 21.5 49.41983 60.5 40.8 27.3 27.8 80.2 37.4 23.3 8.1 5.2 6.2 69.4 74.2 38.41984 84.9 89.0 150.0 135.5 134.5 86.3 57.6 18.2 25.2 12.7 22.2 100.2 76.4
Ave 88.5 91.5 102.2 98.9 77.6 48.4 37.9 24.4 24.8 17.5 37.0 74.6 60.3
Num 20
Collected Monthly Runoff Unit:m3/s
Year Jan Feb Mar Apr May Jun Jul Aug Sep Oct Nov Dec Ave
1997 - - - - - - - - - 8.0 25.8 18.1 -
Ave #DIV/0! #DIV/0! #DIV/0! #DIV/0! #DIV/0! #DIV/0! #DIV/0! #DIV/0! #DIV/0! 8.0 25.8 18.1 #DIV/0!
Num 0

Final Report (Supporting_MP) Part 7 Preliminary Hydrological Evaluation Results
JICA Project for the Master Plan Study of 7-30 August, 2011 Hydropower Development in Indonesia
Table 24 Supplemented Monthly Runoff and Collected Monthly Runoff Records (20/43)
No: 20 River Basin: S. BaritoStation Name: Panaan River: S. Tabalong KiwaStation ID by HPPS2: 03-027-07-02 Catchment Area (km2): 1,333
Supplemented Monthly Runoff in HPPS2 Unit:m3/s
Year Jan Feb Mar Apr May Jun Jul Aug Sep Oct Nov Dec Ave
1961 85.4 63.4 71.2 47.0 34.9 28.5 28.1 19.2 20.6 23.5 22.5 57.0 41.81962 73.0 70.2 72.6 62.8 49.5 34.5 28.0 28.1 27.8 27.3 40.4 70.5 48.71963 59.3 52.1 50.8 43.3 34.4 27.1 25.7 23.9 22.1 19.1 24.6 42.1 35.41964 58.7 57.8 59.6 51.6 40.0 29.5 28.2 26.6 24.8 22.7 31.0 56.1 40.61965 85.6 60.5 42.8 38.3 29.5 20.3 15.7 14.6 16.2 23.6 21.6 111.5 40.01966 81.6 66.7 65.6 56.0 43.7 31.0 24.4 24.6 24.2 23.4 33.8 61.2 44.71967 56.3 50.6 49.8 42.5 33.2 25.9 24.5 22.8 21.0 18.1 23.7 42.0 34.21968 77.1 79.4 83.9 73.4 57.2 38.0 30.6 24.5 20.4 24.5 46.2 83.1 53.21969 70.2 61.0 60.5 51.9 40.5 30.3 28.8 27.1 25.2 22.9 30.5 54.8 42.01970 79.4 78.6 82.4 71.8 56.4 37.7 30.8 24.7 26.2 28.3 47.6 81.3 53.81971 98.2 85.4 62.3 64.9 31.5 23.9 19.1 22.5 22.7 22.5 44.2 35.6 44.41972 38.5 36.2 35.5 30.8 26.3 24.2 21.7 18.9 16.7 19.1 20.7 29.0 26.51973 60.3 65.0 69.2 59.7 46.8 31.5 25.3 25.5 25.3 24.9 38.4 68.8 45.11974 65.5 59.0 59.4 50.8 39.4 29.3 27.9 26.2 24.3 22.1 30.0 54.4 40.71975 83.4 93.6 107.1 97.9 96.1 51.4 99.7 68.5 66.9 86.8 117.0 135.2 92.01976 105.0 104.9 127.1 100.3 45.1 39.3 52.7 42.3 40.2 35.9 83.3 84.6 71.71977 82.2 97.7 54.8 50.3 59.8 60.3 37.9 33.0 32.7 28.0 32.3 50.7 51.61978 76.8 77.0 80.1 70.1 55.6 38.6 32.1 32.1 31.6 31.3 46.9 77.8 54.21979 71.4 63.9 63.8 55.1 43.4 33.0 31.5 29.7 27.8 25.4 33.1 57.4 44.61980 58.7 54.2 53.9 46.2 36.4 28.6 27.0 25.4 23.6 20.7 26.6 46.3 37.31981 54.8 52.4 52.8 45.4 35.3 27.3 25.9 24.2 22.5 19.8 25.8 46.3 36.01982 59.7 57.7 59.2 51.1 39.5 29.2 27.8 26.3 24.5 22.3 30.5 55.5 40.31983 74.5 72.8 75.5 65.6 51.5 34.6 28.3 28.6 28.1 27.9 43.4 74.6 50.51984 74.6 68.2 69.5 59.5 47.3 33.4 26.7 26.8 26.4 25.6 36.9 65.6 46.71985 54.2 47.1 45.5 38.2 31.7 29.2 26.3 23.3 20.9 23.7 26.4 39.9 33.91986 59.8 60.0 62.3 53.7 42.2 30.2 23.6 23.7 23.5 22.4 32.3 59.2 41.11987 63.4 58.8 59.7 51.4 39.8 29.4 28.0 26.5 24.6 22.4 30.6 55.6 40.8
Ave 70.7 66.5 65.8 56.7 43.9 32.5 30.6 27.4 26.3 26.5 37.8 62.8 45.6
Num 27
Collected Monthly Runoff Unit:m3/s
Year Jan Feb Mar Apr May Jun Jul Aug Sep Oct Nov Dec Ave
1991 32.8 19.7 13.3 23.6 23.7 6.8 2.8 1.1 0.3 0.7 23.1 59.1 17.31992 - - - - - - - - - - - - -1993 68.1 82.5 121.4 36.3 15.7 22.7 10.1 1.7 8.6 13.1 37.3 31.8 37.41994 - - - - - - - - - - - - -1995 26.7 40.7 56.1 172.1 53.6 67.2 34.4 1.0 2.7 12.1 14.3 27.0 42.31996 51.4 77.2 34.8 74.2 16.2 - 14.8 9.8 23.5 32.5 24.5 20.0 -1997 22.7 11.1 5.7 8.5 8.3 5.0 3.7 2.5 1.1 1.6 4.5 23.2 8.21998 29.7 10.1 6.6 8.1 14.5 30.4 15.4 15.5 15.2 33.9 67.8 70.1 26.4
Ave 38.6 40.2 39.6 53.8 22.0 26.4 13.6 5.3 8.6 15.6 28.6 38.5 26.3
Num 5

Final Report (Supporting_MP) Part 7 Preliminary Hydrological Evaluation Results
JICA Project for the Master Plan Study of 7-31 August, 2011 Hydropower Development in Indonesia
Table 25 Supplemented Monthly Runoff and Collected Monthly Runoff Records (21/43)
No: 21 River Basin: S. BoneStation Name: Tulabolo River: S. BoneStation ID by HPPS2: 04-003-01-01 Catchment Area (km2): 1,150
Supplemented Monthly Runoff in HPPS2 Unit:m3/s
Year Jan Feb Mar Apr May Jun Jul Aug Sep Oct Nov Dec Ave
1985 55.8 78.8 49.3 54.7 66.7 65.4 38.1 65.4 53.6 53.6 86.1 65.4 61.11986 64.2 54.7 53.6 58.1 55.8 53.6 51.4 39.5 35.1 36.8 46.2 37.7 48.91987 40.4 41.3 31.0 38.6 54.7 33.4 22.4 21.7 16.9 27.2 50.3 31.4 34.11988 54.7 59.3 84.6 76.0 133.1 107.0 125.3 107.0 103.6 70.6 62.9 44.2 85.71989 80.2 92.2 83.1 92.2 55.8 255.3 74.6 59.3 73.2 73.2 64.2 49.3 87.71990 76.0 57.8 53.8 62.1 77.5 95.8 60.7 54.6 50.3 60.5 51.4 39.5 61.71991 74.6 57.0 46.2 86.1 71.9 74.6 46.2 41.3 31.0 28.7 37.7 62.9 54.91992 48.2 39.5 35.9 34.2 73.2 81.6 66.7 48.2 38.6 41.3 50.3 64.1 51.81993 43.2 39.5 46.5 56.5 108.9 95.5 60.7 54.6 50.3 49.0 56.1 49.3 59.2
Ave 59.7 57.8 53.8 62.1 77.5 95.8 60.7 54.6 50.3 49.0 56.1 49.3 60.6
Num 9
Collected Monthly Runoff Unit:m3/s
Year Jan Feb Mar Apr May Jun Jul Aug Sep Oct Nov Dec Ave
- - - - - - - - - - - - - -- - - - - - - - - - - - - -- - - - - - - - - - - - - -- - - - - - - - - - - - - -
Ave - - - - - - - - - - - - -
Num 0
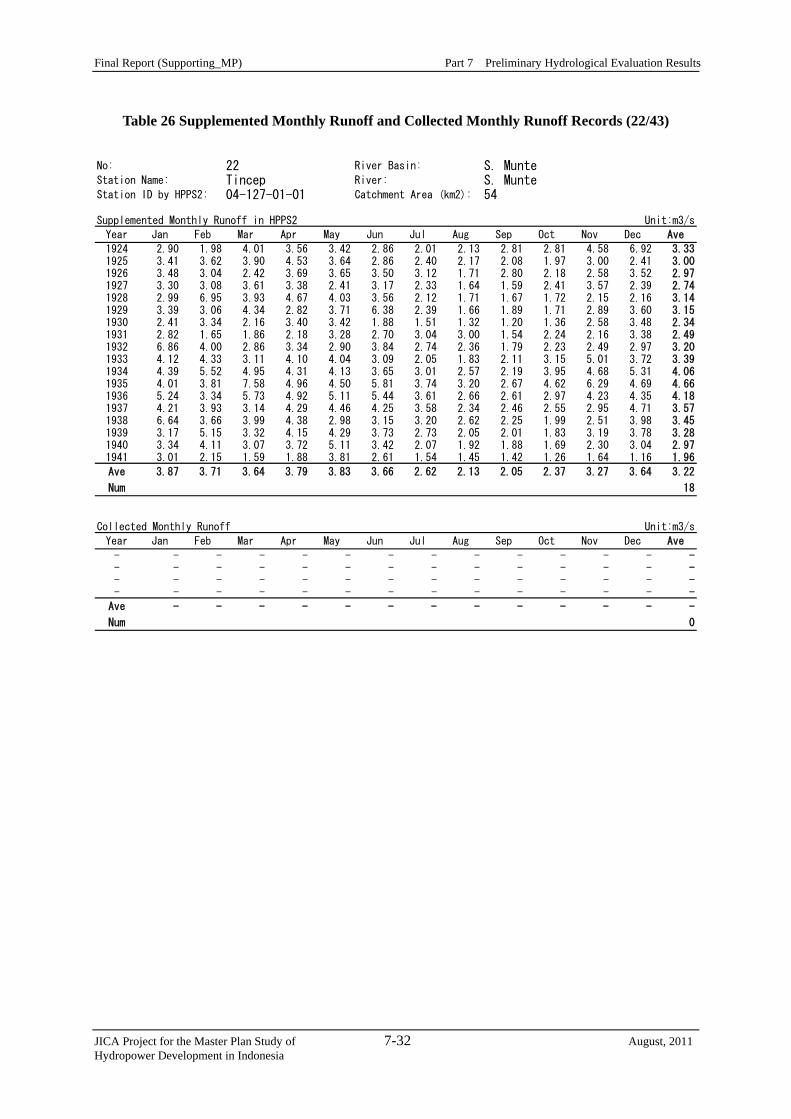
Final Report (Supporting_MP) Part 7 Preliminary Hydrological Evaluation Results
JICA Project for the Master Plan Study of 7-32 August, 2011 Hydropower Development in Indonesia
Table 26 Supplemented Monthly Runoff and Collected Monthly Runoff Records (22/43)
No: 22 River Basin: S. MunteStation Name: Tincep River: S. MunteStation ID by HPPS2: 04-127-01-01 Catchment Area (km2): 54
Supplemented Monthly Runoff in HPPS2 Unit:m3/s
Year Jan Feb Mar Apr May Jun Jul Aug Sep Oct Nov Dec Ave
1924 2.90 1.98 4.01 3.56 3.42 2.86 2.01 2.13 2.81 2.81 4.58 6.92 3.331925 3.41 3.62 3.90 4.53 3.64 2.86 2.40 2.17 2.08 1.97 3.00 2.41 3.001926 3.48 3.04 2.42 3.69 3.65 3.50 3.12 1.71 2.80 2.18 2.58 3.52 2.971927 3.30 3.08 3.61 3.38 2.41 3.17 2.33 1.64 1.59 2.41 3.57 2.39 2.741928 2.99 6.95 3.93 4.67 4.03 3.56 2.12 1.71 1.67 1.72 2.15 2.16 3.141929 3.39 3.06 4.34 2.82 3.71 6.38 2.39 1.66 1.89 1.71 2.89 3.60 3.151930 2.41 3.34 2.16 3.40 3.42 1.88 1.51 1.32 1.20 1.36 2.58 3.48 2.341931 2.82 1.65 1.86 2.18 3.28 2.70 3.04 3.00 1.54 2.24 2.16 3.38 2.491932 6.86 4.00 2.86 3.34 2.90 3.84 2.74 2.36 1.79 2.23 2.49 2.97 3.201933 4.12 4.33 3.11 4.10 4.04 3.09 2.05 1.83 2.11 3.15 5.01 3.72 3.391934 4.39 5.52 4.95 4.31 4.13 3.65 3.01 2.57 2.19 3.95 4.68 5.31 4.061935 4.01 3.81 7.58 4.96 4.50 5.81 3.74 3.20 2.67 4.62 6.29 4.69 4.661936 5.24 3.34 5.73 4.92 5.11 5.44 3.61 2.66 2.61 2.97 4.23 4.35 4.181937 4.21 3.93 3.14 4.29 4.46 4.25 3.58 2.34 2.46 2.55 2.95 4.71 3.571938 6.64 3.66 3.99 4.38 2.98 3.15 3.20 2.62 2.25 1.99 2.51 3.98 3.451939 3.17 5.15 3.32 4.15 4.29 3.73 2.73 2.05 2.01 1.83 3.19 3.78 3.281940 3.34 4.11 3.07 3.72 5.11 3.42 2.07 1.92 1.88 1.69 2.30 3.04 2.971941 3.01 2.15 1.59 1.88 3.81 2.61 1.54 1.45 1.42 1.26 1.64 1.16 1.96
Ave 3.87 3.71 3.64 3.79 3.83 3.66 2.62 2.13 2.05 2.37 3.27 3.64 3.22
Num 18
Collected Monthly Runoff Unit:m3/s
Year Jan Feb Mar Apr May Jun Jul Aug Sep Oct Nov Dec Ave
- - - - - - - - - - - - - -- - - - - - - - - - - - - -- - - - - - - - - - - - - -- - - - - - - - - - - - - -
Ave - - - - - - - - - - - - -
Num 0

Final Report (Supporting_MP) Part 7 Preliminary Hydrological Evaluation Results
JICA Project for the Master Plan Study of 7-33 August, 2011 Hydropower Development in Indonesia
Table 27 Supplemented Monthly Runoff and Collected Monthly Runoff Records (23/43)
No: 23 River Basin: S. PaluStation Name: Palili River: S. LinduStation ID by HPPS2: 04-112-02-02 Catchment Area (km2): 593
Supplemented Monthly Runoff in HPPS2 Unit:m3/s
Year Jan Feb Mar Apr May Jun Jul Aug Sep Oct Nov Dec Ave
1972 13.0 12.9 18.0 42.8 33.0 29.3 20.4 13.9 7.5 7.2 8.4 23.5 19.21973 22.6 17.1 32.9 46.2 44.9 28.9 25.9 23.8 34.9 28.8 36.3 30.3 31.11974 19.0 16.5 9.8 17.9 20.3 18.9 21.3 16.1 18.6 30.3 27.5 16.6 19.41975 12.7 14.8 31.0 29.2 28.1 21.9 37.8 32.0 27.0 21.5 21.8 18.2 24.71976 11.3 4.3 12.6 11.5 20.9 15.7 21.6 12.1 14.4 11.1 19.4 24.4 14.91977 9.2 13.1 15.2 22.7 23.0 44.3 35.4 23.2 14.7 6.9 17.0 17.8 20.21978 18.9 14.2 35.1 31.0 28.7 28.3 34.1 29.9 31.4 27.8 34.7 28.6 28.61979 14.5 20.9 6.3 36.3 31.7 27.7 37.6 27.9 28.8 11.5 25.2 32.6 25.11980 9.0 7.2 8.7 13.0 21.7 22.2 22.5 34.5 11.3 11.8 14.1 20.4 16.41981 6.1 12.7 17.6 37.4 16.0 13.2 24.4 14.4 26.1 32.4 22.2 12.0 19.51982 20.0 18.5 11.0 32.0 11.9 32.9 15.9 17.4 8.3 5.1 14.5 11.3 16.61983 21.1 16.9 8.8 16.7 27.1 26.2 29.0 29.0 16.9 12.3 15.9 14.8 19.61984 18.0 22.2 26.2 33.6 29.1 31.5 15.9 20.1 27.1 22.5 17.6 18.8 23.61985 14.6 15.6 27.4 22.4 31.4 14.4 15.4 16.3 17.1 15.1 25.0 31.4 20.51986 17.5 16.2 23.0 30.0 35.9 18.4 16.2 8.9 8.0 11.3 15.0 23.9 18.7
Ave 15.2 14.9 18.9 28.2 26.9 24.9 24.9 21.3 19.5 17.0 21.0 21.6 21.2
Num 15
Collected Monthly Runoff Unit:m3/s
Year Jan Feb Mar Apr May Jun Jul Aug Sep Oct Nov Dec Ave
- - - - - - - - - - - - - -1987 26.3 24.7 16.8 29.3 37.4 24.8 18.2 13.4 12.6 - - - -- - - - - - - - - - - - - -
Ave - - - - - - - - - - - - -
Num 0

Final Report (Supporting_MP) Part 7 Preliminary Hydrological Evaluation Results
JICA Project for the Master Plan Study of 7-34 August, 2011 Hydropower Development in Indonesia
Table 28 Supplemented Monthly Runoff and Collected Monthly Runoff Records (24/43)
No: 24 River Basin: S. GilirangStation Name: Gilirang River: S. GilirangStation ID by HPPS2: 04-072-01-01 Catchment Area (km2): 230
Supplemented Monthly Runoff in HPPS2 Unit:m3/s
Year Jan Feb Mar Apr May Jun Jul Aug Sep Oct Nov Dec Ave
1979 1.3 5.5 1.1 11.9 14.5 36.1 12.4 3.1 11.6 0.3 0.7 0.6 8.31980 1.8 2.4 1.5 9.4 17.5 23.1 1.7 6.6 0.5 0.4 0.2 0.2 5.41981 0.2 0.2 1.7 35.4 17.4 9.7 62.0 2.1 7.4 6.8 9.5 0.9 12.81982 0.8 0.5 1.6 3.6 10.2 19.6 0.8 0.2 0.1 0.1 0.5 1.9 3.31983 2.9 8.3 0.7 12.1 25.6 32.4 21.1 7.5 0.7 2.3 1.2 0.2 9.61984 1.1 8.0 1.7 6.1 30.6 22.5 65.6 16.0 2.9 2.4 0.8 0.7 13.21985 1.1 5.4 1.2 0.4 14.6 15.9 12.4 13.4 1.5 2.1 1.5 1.0 5.91986 1.9 0.7 2.7 9.5 20.1 23.0 21.9 9.0 2.6 3.5 8.0 1.0 8.71987 1.6 0.6 2.9 29.3 33.0 16.5 3.8 1.0 2.9 1.1 3.9 1.4 8.21988 3.2 2.2 3.3 14.7 24.1 26.2 31.5 8.5 4.9 6.0 1.6 2.8 10.81989 4.9 2.0 1.5 3.1 3.7 16.5 20.4 46.9 25.5 13.5 1.5 0.3 11.71990 0.4 20.4 1.6 3.7 11.2 9.2 8.9 3.6 3.3 7.8 2.0 0.7 6.11991 6.0 0.2 0.7 16.7 20.1 18.6 8.6 1.8 0.6 0.5 0.1 0.4 6.21992 0.5 5.7 2.0 11.6 9.6 12.6 18.0 6.8 8.7 2.9 1.1 0.6 6.71993 0.3 0.1 0.3 3.1 27.0 22.9 17.3 0.8 0.2 0.7 0.5 1.1 6.2
Ave 1.9 4.1 1.6 11.4 18.6 20.3 20.4 8.5 4.9 3.4 2.2 0.9 8.2
Num 15
Collected Monthly Runoff Unit:m3/s
Year Jan Feb Mar Apr May Jun Jul Aug Sep Oct Nov Dec Ave
1994 2.0 1.0 4.7 12.1 44.7 * 13.4 3.3 0.9 0.6 0.7 2.5 -1995 1.3 1.4 5.3 2.7 58.2 88.1 96.5 32.7 12.3 5.3 6.2 1.4 26.01996 0.7 1.9 1.6 17.4 30.4 * * 14.0 8.3 7.7 3.1 1.6 -1997 1.2 0.7 2.0 9.2 2.3 * 3.2 0.6 0.2 0.1 0.0 0.6 -1998 0.6 1.8 3.1 43.5 * 1.4 6.1 0.6 9.5 7.2 3.5 1.1 -1999 0.5 0.2 0.2 0.4 26.2 * 2.2 1.6 0.8 18.8 3.6 1.2 -2000 - - - - - - - - - - - - -2001 3.0 0.7 0.7 6.7 27.4 34.6 6.6 5.0 5.8 15.2 4.6 7.7 9.82002 - - - - - - - - - - - - -2003 1.9 3.7 9.0 13.7 19.2 * 17.1 38.3 5.2 4.3 2.6 22.5 -2004 - - - - - - - - - - - - -2005 - - 0.9 2.2 * 22.7 6.8 1.9 1.7 16.2 2.4 3.7 -2006 1.3 1.1 0.8 0.6 2.6 6.9 3.3 0.8 0.1 0.1 0.4 0.8 1.62007 - - - - - - - - - - - - -2008 0.6 0.7 0.8 3.3 * * * * * * * * -
Ave 1.3 1.3 2.6 10.2 26.4 30.7 17.3 9.9 4.5 7.5 2.7 4.3 12.5
Num 3
Note: Maximum runoff in 1994, 1996, 1997, 1998, 1999, 2003, and 2005 are much higher than others. Hydrograph in 2008 has irregular shape. These data are judge as unreliable.

Final Report (Supporting_MP) Part 7 Preliminary Hydrological Evaluation Results
JICA Project for the Master Plan Study of 7-35 August, 2011 Hydropower Development in Indonesia
Table 29 Supplemented Monthly Runoff and Collected Monthly Runoff Records (25/43)
No: 25 River Basin: S. CenranaeStation Name: Bila River: S. Bila HilirStation ID by HPPS2: 04-073-03-01 Catchment Area (km2): 379
Supplemented Monthly Runoff in HPPS2 Unit:m3/s
Year Jan Feb Mar Apr May Jun Jul Aug Sep Oct Nov Dec Ave
1972 13.0 5.1 3.9 8.4 16.6 8.2 5.7 6.6 3.1 1.7 1.3 3.7 6.41973 4.4 21.2 10.2 24.0 45.2 26.6 50.7 28.2 36.1 19.5 14.6 28.1 25.71974 7.7 8.8 3.7 15.1 18.5 16.8 31.9 12.2 54.2 28.2 18.3 13.1 19.01975 9.8 28.7 23.3 10.1 33.7 25.4 36.1 33.3 47.2 28.9 14.8 11.0 25.21976 5.6 3.5 10.0 7.8 21.6 14.5 10.9 11.8 2.9 4.9 11.5 9.5 9.51977 9.2 3.3 7.7 29.5 17.2 25.8 10.6 17.2 2.5 2.4 2.5 31.0 13.21978 18.3 11.7 27.2 19.2 30.3 24.8 24.7 17.8 19.2 10.9 7.2 24.7 19.71979 8.7 13.7 12.8 24.6 18.4 28.2 12.1 3.8 14.4 3.3 5.5 12.2 13.11980 13.3 6.6 5.9 24.7 32.1 31.8 9.4 8.9 4.9 3.4 3.6 6.4 12.61981 2.7 3.0 14.3 23.5 49.0 16.8 50.7 5.0 10.4 8.4 7.5 7.6 16.61982 7.8 5.3 24.3 28.5 18.2 20.0 3.5 2.8 2.8 2.3 2.3 3.2 10.11983 13.2 22.5 14.5 14.6 33.0 30.5 37.8 6.5 10.7 4.0 3.0 3.6 16.21984 6.2 10.1 12.5 36.4 66.2 51.0 49.4 12.2 9.7 4.1 10.4 6.3 22.91985 2.6 12.7 7.2 9.5 30.9 27.2 17.7 13.9 2.9 4.6 7.9 10.3 12.31986 9.9 4.4 23.4 12.7 23.0 25.0 18.6 6.7 5.1 6.8 14.5 7.7 13.2
Ave 8.8 10.7 13.4 19.2 30.3 24.8 24.7 12.5 15.1 8.9 8.3 11.9 15.7
Num 15
Collected Monthly Runoff Unit:m3/s
Year Jan Feb Mar Apr May Jun Jul Aug Sep Oct Nov Dec Ave
1987 19.0 5.5 - - - - - - - - - - -1988 - - - - - - - - - - - - -1989 - - - - - - - - - - - - -1990 - - - - - - - - - - - - -1991 22.8 8.7 17.8 35.5 29.9 21.6 20.6 12.0 7.2 16.3 15.0 18.3 18.81992 17.6 20.1 31.4 39.0 37.6 21.6 27.8 17.1 23.3 17.9 23.4 23.9 25.11993 30.3 2.9 6.3 40.7 56.8 32.5 15.5 6.2 3.0 3.3 11.7 13.9 18.61994 8.2 7.0 16.7 13.4 12.6 24.9 14.5 14.2 15.8 * * * -1995 * 18.9 17.5 12.2 31.8 127.5 81.6 52.7 36.0 31.7 37.9 12.9 -1996 13.4 19.8 31.0 38.6 49.9 35.3 * * * 25.5 14.4 20.7 -1997 15.3 15.6 11.9 20.0 19.0 15.9 29.7 9.1 3.2 3.0 3.6 5.7 12.71998 * * * * * * * * * * * * -1999 - - - - - - - - - - - - -2000 - - - - - - - - - - - - -2001 - - - - - - - - - - - - -2002 - - - - - - - - - - - - -2003 - - - - - - - - - - - - -2004 - - - - - - - - - - - - -2005 23.9 13.0 16.8 17.3 32.1 14.9 5.5 - - - - - -
Ave 18.8 12.4 18.7 27.1 33.7 36.8 27.9 18.5 14.7 16.3 17.7 15.9 18.8
Num 4
Note: Hydrographs in 1994, 1995 and 1996 has irregular shape. Base flow in 1998 is much higher than others. These data are judged as irregular value.

Final Report (Supporting_MP) Part 7 Preliminary Hydrological Evaluation Results
JICA Project for the Master Plan Study of 7-36 August, 2011 Hydropower Development in Indonesia
Table 30 Supplemented Monthly Runoff and Collected Monthly Runoff Records (26/43)
No: 26 River Basin: Jene KlaraStation Name: Likupande River: Jene KlaraStation ID by HPPS2: 04-083-01-01 Catchment Area (km2): 381
Supplemented Monthly Runoff in HPPS2 Unit:m3/s
Year Jan Feb Mar Apr May Jun Jul Aug Sep Oct Nov Dec Ave
1970 11.3 19.3 14.3 20.8 21.3 10.0 12.3 7.1 4.7 5.7 27.6 35.6 15.81971 26.1 45.1 53.5 24.9 31.7 20.5 9.0 4.9 4.6 7.1 32.6 16.5 23.01972 63.2 20.1 11.5 12.0 9.7 5.1 4.2 1.7 1.1 1.4 1.0 6.2 11.41973 18.7 13.1 18.9 18.6 19.7 12.9 18.9 6.8 6.3 4.5 12.4 19.2 14.21974 32.6 34.6 73.7 68.5 12.5 7.3 9.4 4.3 10.7 14.3 16.3 10.5 24.51975 26.6 29.8 16.9 25.3 23.9 17.2 8.0 8.0 8.4 13.4 22.0 19.0 18.21976 31.5 21.2 22.6 24.5 20.7 11.7 5.6 3.5 2.8 2.9 10.5 12.0 14.11977 30.8 52.9 25.4 13.7 10.2 22.5 4.8 4.3 3.3 1.0 0.9 8.8 14.91978 17.9 17.8 14.2 12.3 22.4 23.9 17.9 8.6 7.0 5.0 6.9 20.3 14.51979 23.4 12.4 21.3 17.8 20.9 13.4 5.4 2.7 2.1 2.4 3.0 10.1 11.21980 21.3 28.8 13.2 15.8 15.1 5.4 3.7 2.0 1.4 1.6 6.4 17.1 11.01981 21.9 14.2 9.3 22.1 16.2 7.5 14.2 5.2 3.8 5.1 17.8 22.8 13.3
Ave 27.1 25.8 24.6 23.0 18.7 13.1 9.4 4.9 4.7 5.4 13.1 16.5 15.5
Num 12
Collected Monthly Runoff Unit:m3/s
Year Jan Feb Mar Apr May Jun Jul Aug Sep Oct Nov Dec Ave
1992 6.9 8.0 19.7 18.7 5.4 6.4 3.0 1.3 0.9 1.6 1.8 3.5 6.41993 24.0 20.3 11.3 19.6 20.4 13.2 2.5 1.2 0.7 0.5 0.4 * -1994 * * * * * * * * * * * * -1995 35.1 8.8 22.6 29.4 10.8 23.9 9.4 0.8 0.7 1.2 15.3 19.7 14.81996 7.7 32.0 21.4 16.3 1.9 2.7 14.2 1.2 0.8 1.8 10.3 37.7 12.31997 16.5 19.5 11.2 3.4 1.2 0.7 0.7 0.4 0.3 0.3 0.6 1.3 4.71998 2.2 13.2 15.7 31.7 18.2 7.3 12.5 7.7 2.6 2.0 4.1 5.0 10.21999 39.5 34.6 23.1 15.4 11.1 4.8 8.3 0.9 0.4 2.5 6.9 26.5 14.52000 - - - - - - - - - - - - -2001 17.7 35.1 18.1 32.6 6.7 17.6 1.5 0.5 0.3 2.8 4.1 27.4 13.72002 * * * * * * * * * * * * -2003 27.7 26.8 7.7 8.8 24.5 3.1 2.4 2.6 2.1 2.9 9.7 50.9 14.12004 * * * * * * * * * * * * -
Ave 19.7 22.0 16.8 19.5 11.1 8.8 6.1 1.8 1.0 1.7 5.9 21.5 11.3
Num 8
Note: Hydrographs in 1993, 1994, 2002, and 2004 have irregular shapes and are judged as unreliable value.

Final Report (Supporting_MP) Part 7 Preliminary Hydrological Evaluation Results
JICA Project for the Master Plan Study of 7-37 August, 2011 Hydropower Development in Indonesia
Table 31 Supplemented Monthly Runoff and Collected Monthly Runoff Records (7/43)
No: 27 River Basin: S. SadangStation Name: Bakaru River: S. MamasaStation ID by HPPS2: 04-093-03-01 Catchment Area (km2): 1,080
Supplemented Monthly Runoff in HPPS2 Unit:m3/s
Year Jan Feb Mar Apr May Jun Jul Aug Sep Oct Nov Dec Ave
1976 44.3 26.8 49.1 36.2 54.0 37.1 30.2 23.6 26.3 74.5 144.0 243.8 65.81977 62.8 51.2 47.0 109.3 72.9 100.8 159.6 29.2 17.2 12.8 182.2 105.1 79.21978 112.9 53.9 121.0 93.0 54.7 62.2 58.2 51.1 73.8 55.8 63.9 67.7 72.31979 60.4 73.4 52.7 73.6 69.3 58.6 73.8 31.7 23.4 41.6 68.5 100.9 60.71980 86.1 60.8 60.1 215.6 150.4 164.6 86.2 73.1 53.0 48.6 46.2 56.9 91.81981 43.2 36.8 63.8 101.4 85.0 73.8 75.5 49.0 45.2 59.4 99.5 75.8 67.41982 94.9 76.3 99.6 94.9 75.2 70.1 35.7 25.8 18.1 16.6 16.7 41.5 55.41983 71.6 82.9 47.6 87.7 111.8 118.6 76.0 57.3 37.6 38.1 45.2 52.5 68.91984 74.5 88.5 96.9 155.3 166.0 89.5 78.6 75.3 83.5 58.7 59.4 84.2 92.51985 81.0 102.5 61.9 89.0 96.5 74.3 59.4 57.4 47.3 37.3 49.4 55.1 67.61986 59.9 54.2 87.7 87.3 86.9 69.3 76.1 34.8 29.3 52.8 83.5 74.5 66.41987 87.8 67.9 108.0 139.5 93.3 52.9 51.2 36.6 20.1 16.9 15.7 143.6 69.51988 61.1 74.0 109.0 109.4 132.3 47.0 42.5 51.2 68.9 87.1 121.7 100.2 83.71989 112.5 117.5 74.7 85.2 52.9 67.6 97.7 58.6 54.8 63.0 69.4 70.0 77.01990 59.6 90.4 51.0 73.6 72.5 71.3 63.6 42.9 41.6 39.7 32.3 78.8 59.81991 61.0 35.2 63.3 78.1 50.5 34.4 23.8 18.7 14.9 13.5 30.5 68.5 41.01992 83.5 69.3 79.7 83.4 84.7 78.4 53.5 37.0 40.7 35.3 40.3 88.1 64.51993 103.3 53.1 69.8 104.8 90.7 90.1 47.8 30.8 23.4 25.3 44.4 73.3 63.11994 64.8 102.6 143.5 100.2 90.5 76.3 36.8 26.5 20.7 21.7 23.3 82.4 65.8
Ave 75.0 69.3 78.2 100.9 88.9 75.6 64.5 42.7 38.9 42.0 65.1 87.5 69.1
Num 19
Collected Monthly Runoff Unit:m3/s
Year Jan Feb Mar Apr May Jun Jul Aug Sep Oct Nov Dec Ave
- - - - - - - - - - - - - -- - - - - - - - - - - - - -- - - - - - - - - - - - - -- - - - - - - - - - - - - -
Ave - - - - - - - - - - - - -
Num 0

Final Report (Supporting_MP) Part 7 Preliminary Hydrological Evaluation Results
JICA Project for the Master Plan Study of 7-38 August, 2011 Hydropower Development in Indonesia
Table 32 Supplemented Monthly Runoff and Collected Monthly Runoff Records (28/43)
No: 28 River Basin: CimandiriStation Name: Kebon Randu River: CicatihStation ID by HPPS2: 02-107-06-01 Catchment Area (km2): 486
Supplemented Monthly Runoff in HPPS2 Unit:m3/s
Year Jan Feb Mar Apr May Jun Jul Aug Sep Oct Nov Dec Ave
1966 30.6 21.3 26.9 27.2 24.1 18.6 8.0 7.9 13.2 28.0 31.2 32.3 22.41967 32.9 31.5 27.5 35.0 30.2 96.8 21.1 25.7 23.5 10.8 20.5 24.9 31.71968 32.3 31.8 32.5 50.7 31.7 30.6 41.4 36.1 39.2 41.9 47.7 33.2 37.41969 35.3 30.7 30.2 31.5 28.4 20.4 16.7 10.8 13.6 18.2 28.2 26.5 24.21970 28.1 25.8 31.4 27.6 32.0 25.3 16.2 9.7 13.7 19.7 33.6 34.3 24.81971 45.0 35.5 28.4 29.6 26.3 18.7 13.8 14.5 14.5 29.8 39.0 51.9 28.91972 45.3 50.3 43.3 35.0 42.7 18.4 12.9 12.3 10.0 11.5 24.3 33.9 28.31973 37.5 31.5 30.8 58.2 50.5 33.0 25.8 25.8 37.1 43.9 32.5 44.2 37.61974 32.8 21.0 19.6 31.6 33.8 14.8 21.1 25.7 37.5 36.4 37.5 29.7 28.51975 37.5 39.8 41.0 38.1 32.0 17.2 19.1 21.0 27.7 34.7 40.2 30.0 31.51976 36.0 26.8 24.8 19.4 14.8 14.8 14.3 14.8 18.9 28.9 36.6 35.4 23.81977 27.5 40.5 31.6 29.5 14.6 11.3 12.7 146.0 19.6 19.6 30.5 35.3 34.91978 27.9 20.8 34.1 35.5 30.6 34.6 30.1 28.8 26.5 33.7 37.2 23.2 30.31979 33.3 33.6 33.6 44.1 35.5 23.7 18.0 10.5 24.7 28.4 38.2 41.5 30.41980 40.9 28.8 34.2 38.0 30.0 23.3 23.0 31.2 23.3 25.7 46.0 44.6 32.41981 31.0 34.0 43.9 40.9 37.0 33.0 33.5 23.6 27.9 26.3 42.7 31.6 33.81982 36.2 27.1 18.8 26.2 11.5 8.8 10.6 9.2 8.7 10.8 13.2 24.3 17.11983 38.6 29.8 31.2 29.5 27.7 26.6 25.9 25.9 25.4 26.9 28.6 27.2 28.61984 37.8 33.8 36.5 36.2 31.5 35.9 25.0 23.3 44.4 27.8 37.0 31.4 33.41985 30.8 37.6 40.9 33.5 39.1 29.2 30.1 29.7 24.3 38.8 32.8 28.1 32.91986 41.8 36.3 47.8 56.8 29.9 25.8 22.1 20.2 20.7 26.5 42.0 44.4 34.51987 31.7 28.3 30.8 29.4 24.5 18.4 9.7 9.2 9.7 13.8 24.0 31.9 21.81988 31.3 38.8 50.1 34.2 36.9 22.3 17.6 28.6 29.7 30.2 33.0 31.5 32.01989 38.1 29.2 27.0 29.0 27.7 26.0 25.5 25.1 25.0 25.5 29.0 30.1 28.11990 - - - - - - - - - - - - -1991 31.6 33.0 35.7 33.5 31.2 23.1 21.2 20.5 19.7 23.7 31.6 29.6 27.91992 32.0 30.8 31.0 33.7 31.2 29.4 28.9 29.4 31.4 36.3 33.5 33.8 31.81993 33.8 31.0 30.2 30.3 28.8 28.4 26.3 27.9 24.5 28.1 29.7 30.7 29.1
Ave 34.7 31.8 33.1 35.0 30.2 26.2 21.1 25.7 23.5 26.9 33.3 33.2 29.6
Num 27
Collected Monthly Runoff Unit:m3/s
Year Jan Feb Mar Apr May Jun Jul Aug Sep Oct Nov Dec Ave
- - - - - - - - - - - - - -- - - - - - - - - - - - - -- - - - - - - - - - - - - -- - - - - - - - - - - - - -
Ave - - - - - - - - - - - - -
Num 0

Final Report (Supporting_MP) Part 7 Preliminary Hydrological Evaluation Results
JICA Project for the Master Plan Study of 7-39 August, 2011 Hydropower Development in Indonesia
Table 33 Supplemented Monthly Runoff and Collected Monthly Runoff Records (29/43)
No: 29 River Basin: CibuniStation Name: Cibuni-3 damsite River: CibuniStation ID by HPPS2: - Catchment Area (km2): 1,124
Supplemented Monthly Runoff in HPPS2 Unit:m3/s
Year Jan Feb Mar Apr May Jun Jul Aug Sep Oct Nov Dec Ave
1953 86.6 110.4 145.2 120.2 100.9 38.6 17.5 8.5 6.2 7.7 60.6 67.9 64.21954 147.1 134.5 96.5 68.9 91.4 85.0 36.8 58.7 28.1 68.2 174.3 152.4 95.21955 105.5 70.8 72.0 88.5 64.8 39.7 75.5 109.3 93.1 155.0 205.1 175.9 104.61956 115.3 65.6 80.9 105.0 82.3 91.0 58.4 60.3 54.5 97.4 107.7 100.1 84.91957 95.9 61.5 106.9 97.8 86.0 40.2 56.3 55.7 23.8 18.2 55.3 103.3 66.71958 101.9 185.2 144.4 101.7 86.9 54.8 83.8 85.1 48.8 85.6 109.2 170.1 104.81959 64.3 94.4 97.9 68.7 91.8 61.0 34.7 14.0 8.6 9.9 54.8 80.2 56.71960 130.9 96.3 69.5 83.2 62.8 30.7 37.8 12.2 8.9 17.1 119.8 91.2 63.41961 63.0 93.1 95.0 102.6 71.3 41.0 15.4 8.5 7.2 7.0 25.0 62.7 49.31962 82.4 43.4 148.2 146.9 75.3 49.5 56.5 22.8 16.4 63.9 92.5 123.6 76.81963 62.4 41.6 57.4 61.2 30.8 13.4 7.5 6.3 6.2 6.0 19.5 61.0 31.11964 84.1 104.3 114.9 129.4 94.0 46.2 25.3 25.9 38.6 61.3 114.8 103.2 78.51965 139.8 155.6 80.0 69.0 22.3 10.7 6.8 5.7 5.6 5.5 28.3 186.2 59.61966 127.1 84.8 164.6 110.3 76.5 54.0 17.7 8.2 11.9 84.0 108.9 142.3 82.51967 134.1 77.3 63.4 136.0 62.9 23.8 10.1 5.7 5.3 5.8 67.8 115.6 59.01968 105.7 60.3 131.3 123.8 119.8 95.3 82.4 98.5 69.6 61.5 124.5 163.8 103.01969 161.2 116.1 132.7 129.8 69.0 49.4 17.3 8.2 31.8 44.8 91.9 102.9 79.61970 129.8 96.8 153.1 139.5 132.7 108.4 46.4 18.1 22.2 33.4 138.6 150.1 97.41971 148.7 84.0 70.8 103.2 65.3 39.4 17.5 9.6 12.4 57.7 143.1 174.6 77.21972 117.7 125.7 88.4 105.5 103.7 32.6 14.1 7.4 6.5 6.4 30.6 88.6 60.61973 126.6 103.1 126.1 150.8 204.4 96.9 74.1 82.9 84.6 114.8 162.3 136.4 121.91974 80.7 82.3 65.0 134.7 108.0 37.7 53.5 51.6 63.0 114.7 145.2 94.3 85.91975 138.4 81.3 143.5 124.0 104.6 52.5 46.0 21.9 55.2 147.7 164.6 124.2 100.31976 90.8 94.5 93.8 79.3 42.1 24.7 10.6 9.3 17.5 42.1 117.5 115.1 61.41977 96.3 87.6 114.3 117.1 80.3 98.3 32.3 14.6 8.3 7.3 53.0 68.1 64.81978 116.1 51.6 136.0 60.3 141.4 128.2 119.9 76.2 55.2 63.8 119.9 179.6 104.01979 133.2 120.6 117.7 163.7 120.0 72.7 26.3 12.5 35.0 74.0 160.0 192.3 102.31980 109.4 81.6 97.0 120.0 73.6 35.8 24.5 4.5 28.6 56.5 160.2 151.8 78.61981 114.2 89.3 121.5 114.7 98.5 81.0 80.1 31.5 24.7 63.9 94.1 69.1 81.91982 83.1 62.8 57.6 102.4 33.0 18.1 10.3 7.8 7.6 7.4 22.3 104.8 43.1
Ave 109.7 91.9 106.2 108.6 86.5 55.0 39.8 31.4 29.5 53.0 102.4 121.7 78.0
Num 30
Collected Monthly Runoff Unit:m3/s
Year Jan Feb Mar Apr May Jun Jul Aug Sep Oct Nov Dec Ave
- - - - - - - - - - - - - -- - - - - - - - - - - - - -- - - - - - - - - - - - - -- - - - - - - - - - - - - -
Ave - - - - - - - - - - - - -
Num 0

Final Report (Supporting_MP) Part 7 Preliminary Hydrological Evaluation Results
JICA Project for the Master Plan Study of 7-40 August, 2011 Hydropower Development in Indonesia
Table 34 Supplemented Monthly Runoff and Collected Monthly Runoff Records (30/43)
No: 30 River Basin: CiujungStation Name: Rangkasbitung River: CiujungStation ID by HPPS2: 02-006-01-06 Catchment Area (km2): 1,383
Supplemented Monthly Runoff in HPPS2 Unit:m3/s
Year Jan Feb Mar Apr May Jun Jul Aug Sep Oct Nov Dec Ave
1970 73.6 201.1 211.1 221.2 147.1 135.8 90.2 32.0 52.7 50.1 113.8 208.5 128.11971 177.8 264.0 166.1 91.3 61.8 62.7 60.4 77.4 50.5 113.1 120.7 90.2 111.31972 259.7 138.8 186.8 80.8 103.5 24.2 13.5 20.9 6.2 9.3 34.1 62.2 78.31973 166.4 110.8 136.6 172.8 188.8 105.9 48.5 63.5 124.8 109.0 101.0 130.9 121.61974 189.4 142.8 140.1 115.2 127.5 58.2 65.6 91.0 184.1 96.1 80.0 88.2 114.91975 102.8 162.3 105.8 55.4 70.6 42.3 62.0 90.6 135.3 74.8 127.0 198.8 102.31976 273.9 101.3 128.4 94.9 58.4 37.7 23.4 24.3 15.0 43.9 76.0 50.4 77.31977 139.0 110.9 155.7 144.6 133.0 75.1 29.8 15.7 15.5 17.8 28.0 46.5 76.01978 182.9 89.4 139.1 85.8 74.3 70.7 61.1 83.5 73.9 77.1 94.6 77.6 92.51979 132.9 150.7 121.1 164.6 63.6 41.0 44.6 26.6 32.7 33.1 96.7 81.0 82.41980 227.3 120.2 72.2 114.6 99.3 47.1 49.4 93.5 97.4 72.8 94.1 135.7 102.01981 214.9 145.5 137.2 114.0 131.4 150.5 116.0 77.6 98.5 108.9 162.5 134.7 132.61982 262.3 87.7 45.2 84.3 59.7 25.7 16.7 8.9 6.0 15.8 84.8 107.1 67.01983 90.8 65.5 54.5 47.5 68.9 32.3 22.9 10.3 13.4 35.2 104.9 77.6 52.01984 118.3 121.3 139.4 144.1 135.9 44.8 78.1 83.2 119.1 71.4 48.8 49.6 96.21985 73.8 151.2 139.9 74.5 75.4 26.3 53.4 41.0 67.0 50.5 79.9 125.5 79.91986 211.2 120.6 123.7 152.0 94.5 104.0 23.5 25.6 31.4 50.6 64.3 142.5 95.31987 119.6 154.9 110.6 134.7 128.8 131.4 80.6 58.2 37.9 37.8 51.2 60.0 92.11988 150.9 184.2 223.7 213.4 92.1 39.0 42.6 44.9 46.1 48.5 65.4 122.9 106.11989 76.5 264.0 89.8 53.3 85.9 47.3 39.4 53.3 64.0 54.2 67.8 101.1 83.11990 388.1 99.8 127.9 84.4 84.7 73.4 115.6 101.5 122.5 90.7 77.4 55.3 118.41991 40.9 179.0 76.1 49.5 18.1 12.7 12.6 9.9 16.4 29.2 30.8 57.2 44.41992 79.8 90.3 81.6 107.7 84.1 50.2 31.8 40.0 39.8 102.4 112.6 67.6 74.01993 189.3 169.1 98.0 136.4 174.4 111.8 59.0 155.1 147.7 111.6 117.3 142.6 134.4
Ave 164.3 142.7 125.4 114.0 98.4 64.6 51.7 55.4 66.6 62.7 84.7 100.6 94.3
Num 24
Collected Monthly Runoff Unit:m3/s
Year Jan Feb Mar Apr May Jun Jul Aug Sep Oct Nov Dec Ave
1994 85.5 62.2 58.4 110.4 146.0 33.7 8.4 6.3 4.4 8.5 41.4 32.2 49.81995 80.6 44.7 37.6 83.0 108.7 83.0 74.4 31.7 18.8 31.4 86.9 157.2 69.81996 109.3 91.0 165.8 91.9 66.8 62.4 49.9 51.4 51.9 54.5 96.2 135.2 85.51997 81.7 89.0 71.8 77.9 91.5 40.5 21.2 7.7 9.2 6.1 23.0 45.2 47.11998 56.9 111.1 123.9 123.9 78.1 43.9 41.0 52.0 46.6 35.4 47.6 73.3 69.51999 266.1 - 73.2 59.8 64.3 52.8 44.4 24.5 35.0 66.2 64.1 105.5 -2000 - - - - - - - - - - - - -2001 - - - - - - - - - - - - -2002 - - - - - - - - - - - - -2003 - - - - - - - - - - - - -2004 - - - - - - - - - - - - -2005 - - - - - - - - - - - - -2006 - - - - - - - - - - - - -2007 57.7 84.5 113.9 64.4 60.6 67.2 40.8 27.8 25.0 40.9 36.3 100.4 60.0
Ave 105.4 80.4 92.1 87.3 88.0 54.8 40.0 28.8 27.3 34.7 56.5 92.7 63.6
Num 6

Final Report (Supporting_MP) Part 7 Preliminary Hydrological Evaluation Results
JICA Project for the Master Plan Study of 7-41 August, 2011 Hydropower Development in Indonesia
Table 35 Supplemented Monthly Runoff and Collected Monthly Runoff Records (31/43)
No: 31 River Basin: CimanukStation Name: Leuwi Goong River: CimanukStation ID by HPPS2: 02-026-01-06 Catchment Area (km2): 760
Supplemented Monthly Runoff in HPPS2 Unit:m3/s
Year Jan Feb Mar Apr May Jun Jul Aug Sep Oct Nov Dec Ave
1964 22.0 21.4 27.7 28.6 20.5 14.8 13.9 13.3 13.3 27.3 44.2 30.8 23.11965 36.1 43.6 34.3 29.2 21.5 14.3 12.1 7.7 6.4 6.6 13.8 33.7 21.61966 55.7 50.2 56.1 34.6 23.3 20.5 10.5 8.2 11.2 21.1 19.4 39.7 29.21967 33.9 39.7 29.7 38.6 15.3 8.9 11.7 6.9 7.2 10.6 17.2 35.9 21.31968 36.8 25.5 37.5 32.4 34.9 27.5 32.7 34.3 19.5 22.1 34.4 46.0 32.01969 52.1 48.3 43.0 46.4 30.0 25.6 18.8 15.9 16.9 16.9 20.3 23.6 29.81970 29.3 34.5 50.3 36.0 30.5 22.7 20.8 12.4 15.5 18.2 31.0 50.5 29.31971 61.4 41.7 45.2 62.0 34.9 20.6 12.9 9.2 11.2 27.3 58.1 54.4 36.61972 43.9 32.8 49.6 32.9 42.7 17.7 10.8 8.5 6.4 6.2 12.5 18.6 23.51973 26.6 32.1 38.1 42.6 61.7 35.8 30.6 16.4 42.1 28.1 45.4 40.0 36.61974 24.9 40.8 29.3 50.8 41.9 15.6 16.9 24.6 21.7 44.7 47.9 57.2 34.71975 52.4 55.1 51.3 58.6 35.5 19.1 14.5 9.7 12.0 49.5 47.8 37.2 36.91976 37.0 37.1 44.2 26.6 21.4 11.2 8.1 7.3 7.2 23.5 37.1 27.9 24.01977 30.3 53.0 46.4 42.0 34.5 34.0 12.1 8.4 8.4 6.4 10.3 22.9 25.71978 23.3 21.0 44.0 20.5 24.0 36.6 37.7 20.2 27.2 22.6 42.3 45.5 30.41979 43.6 46.1 34.8 62.9 57.5 27.1 15.6 12.7 12.0 15.3 30.0 38.6 33.01980 36.5 38.0 33.7 34.0 20.9 14.8 10.8 13.2 9.4 10.3 24.3 36.6 23.51981 28.2 27.9 44.4 39.0 36.7 27.4 27.0 12.5 12.6 15.0 35.5 33.6 28.31982 40.3 41.0 40.7 52.7 16.8 15.0 10.1 8.1 6.5 6.0 9.4 27.7 22.91983 31.6 32.4 32.6 38.3 36.3 14.6 13.0 9.7 8.5 15.4 31.1 25.1 24.01984 49.7 77.8 58.2 52.0 42.2 15.7 13.4 14.8 36.3 37.0 38.4 52.9 40.71985 33.6 36.3 31.5 33.0 22.3 29.4 31.3 17.5 9.9 29.3 34.6 38.4 28.91986 41.2 33.9 53.6 49.0 22.0 26.0 22.7 16.8 32.6 29.2 49.0 27.0 33.61987 30.5 38.6 38.1 30.3 34.4 27.8 24.8 13.8 10.7 11.8 9.3 33.1 25.31988 64.8 58.1 50.5 51.3 36.5 60.7 44.3 26.2 14.8 15.6 50.4 71.3 45.41989 245.9 53.3 41.5 34.0 34.0 35.5 23.7 17.6 14.4 14.8 21.9 24.0 46.71990 25.1 43.6 34.4 30.4 34.4 27.0 18.2 28.7 14.5 13.0 13.7 39.4 26.91991 49.0 32.3 36.8 40.4 23.3 10.9 10.6 9.7 9.6 9.7 26.3 30.6 24.11992 34.9 45.8 52.0 55.1 30.1 23.3 14.5 22.4 18.6 29.9 28.4 40.1 32.91993 46.8 37.3 49.5 44.3 27.5 21.6 14.1 16.3 11.9 11.5 16.7 34.1 27.7
Ave 45.6 40.6 42.0 40.9 31.6 23.4 18.6 14.8 14.9 19.8 30.0 37.2 30.0
Num 30
Collected Monthly Runoff Unit:m3/s
Year Jan Feb Mar Apr May Jun Jul Aug Sep Oct Nov Dec Ave
1997 45.8 24.0 12.4 21.3 19.2 8.4 5.4 4.6 4.0 4.2 10.9 32.0 16.01998 39.6 68.4 76.8 66.3 55.4 41.3 25.2 18.6 14.0 37.9 73.3 69.7 48.91999 - - - - - - - - - - - - -2000 52.5 35.3 18.7 52.1 20.1 13.9 11.0 7.9 7.7 36.8 62.9 56.6 31.32001 44.8 26.1 35.0 24.1 17.1 12.6 11.2 8.9 12.0 32.0 43.6 42.4 25.82002 - - - - - - - - - - - - -2003 - - - - - 8.1 8.4 10.3 15.1 15.5 19.6 19.2 -2004 - - - - - - - - - - - - -2005 - - - - - - - - - - - - -2006 - - - - - - - - - - - - -2007 52.5 57.3 42.8 49.9 23.6 9.4 7.2 6.7 8.2 11.2 - - -
Ave 47.0 42.2 37.1 42.7 27.1 15.6 11.4 9.5 10.2 22.9 42.1 44.0 30.5
Num 4

Final Report (Supporting_MP) Part 7 Preliminary Hydrological Evaluation Results
JICA Project for the Master Plan Study of 7-42 August, 2011 Hydropower Development in Indonesia
Table 36 Supplemented Monthly Runoff and Collected Monthly Runoff Records (32/43)
No: 32 River Basin: K. ProgoStation Name: Krangan -2 River: K. ProgoStation ID by HPPS2: 02-082-01-06 Catchment Area (km2): 423
Supplemented Monthly Runoff in HPPS2 Unit:m3/s
Year Jan Feb Mar Apr May Jun Jul Aug Sep Oct Nov Dec Ave
1968 27.1 47.9 40.4 32.4 20.9 19.9 24.0 26.8 15.1 9.3 19.3 34.5 26.51969 28.4 19.6 28.1 28.7 20.4 14.8 6.1 4.9 4.4 8.2 12.2 15.0 15.91970 18.2 26.2 36.2 24.6 22.6 16.8 8.7 3.9 5.8 11.7 21.2 25.5 18.51971 27.9 28.6 28.9 23.6 24.4 21.2 12.5 8.0 5.4 16.6 24.8 21.7 20.31972 - - - - - - - - - - - - -1973 22.2 28.2 30.8 23.9 33.0 22.1 13.7 8.2 12.4 9.3 16.3 25.3 20.51974 11.3 40.5 32.8 22.2 23.2 8.1 9.2 9.8 17.5 24.6 23.6 21.0 20.31975 35.2 26.3 39.1 30.7 26.5 12.6 11.2 7.2 17.0 36.9 28.6 31.2 25.21976 22.0 24.3 33.3 21.0 10.1 8.2 3.8 3.7 3.5 9.7 19.1 12.3 14.31977 21.9 34.3 35.3 20.9 19.9 23.8 5.1 2.9 2.9 1.8 6.4 14.3 15.81978 24.8 28.2 22.2 20.0 22.1 18.2 23.2 14.0 11.8 14.0 12.8 22.8 19.51979 27.4 24.2 18.8 26.7 32.0 17.3 6.2 4.0 5.4 5.1 8.4 14.5 15.81980 26.4 19.4 29.8 25.1 15.1 6.9 5.8 5.8 4.4 6.9 17.5 19.4 15.21981 23.7 26.2 24.4 27.5 25.3 15.2 13.2 5.7 10.7 10.1 13.7 25.6 18.41982 44.9 46.2 36.6 26.8 8.0 4.8 3.7 2.8 2.6 2.2 4.3 13.5 16.41983 32.3 31.7 25.9 19.9 32.2 9.5 4.0 2.8 2.3 9.4 14.3 16.6 16.71984 38.5 42.3 31.7 38.3 11.6 6.5 5.6 3.4 7.4 12.6 8.9 27.8 19.51985 27.0 33.5 41.9 30.6 11.9 14.4 8.2 8.9 6.6 12.1 14.7 17.4 18.91986 - - - - - - - - - - - - -1987 26.0 30.0 24.7 11.1 7.3 5.5 3.4 2.5 1.9 2.1 4.5 12.2 10.91988 25.4 26.3 20.8 10.4 11.7 5.2 3.4 3.4 2.1 6.9 13.6 13.1 11.91989 20.5 32.2 19.6 14.3 10.6 9.2 13.7 5.7 2.4 3.6 6.5 13.1 12.61990 36.3 26.9 20.4 17.7 14.2 15.5 8.4 5.3 5.2 3.3 7.6 20.2 15.11991 34.8 24.6 21.6 26.6 12.8 6.2 5.1 5.0 3.3 4.1 10.3 17.4 14.31992 20.5 19.1 21.4 22.3 12.4 5.8 3.8 6.3 4.9 7.6 11.1 16.9 12.71993 26.7 19.0 17.1 22.2 14.4 9.2 5.8 5.3 2.8 3.4 7.2 9.1 11.9
Ave 27.1 29.4 28.4 23.6 18.4 12.4 8.7 6.5 6.6 9.6 13.6 19.2 17.0
Num 24
Collected Monthly Runoff Unit:m3/s
Year Jan Feb Mar Apr May Jun Jul Aug Sep Oct Nov Dec Ave
1994 16.7 16.1 21.3 13.7 7.9 5.0 4.6 3.8 1.9 2.5 5.8 7.8 8.91995 14.9 17.0 12.6 10.2 9.0 10.3 8.6 6.1 4.8 9.4 12.8 7.9 10.31996 22.8 29.8 24.6 19.7 9.8 8.7 7.4 7.1 * 3.6 7.6 7.8 -1997 12.3 19.1 6.4 8.2 6.1 5.6 3.8 3.5 2.8 2.8 4.0 11.4 7.21998 12.4 16.8 17.5 17.6 12.8 13.6 14.3 9.1 6.4 11.4 13.8 14.9 13.41999 42.8 36.3 36.7 30.6 26.4 25.5 14.3 21.2 12.7 11.2 18.9 31.3 25.72000 3.3 3.9 4.9 4.0 4.0 2.4 1.0 0.7 0.8 1.3 3.8 3.1 2.82001 * * 16.7 13.4 7.6 7.7 5.6 3.3 2.9 10.1 11.4 9.2 -2002 27.5 26.8 25.5 31.2 19.6 17.5 15.5 14.1 15.6 12.8 17.8 25.1 20.82003 8.2 9.1 6.4 3.6 2.4 0.7 0.8 0.9 0.6 1.1 2.3 3.8 3.32004 16.7 16.1 19.1 15.1 11.2 7.2 7.0 4.5 4.2 4.7 10.1 15.2 10.9
Ave 17.8 19.1 17.4 15.2 10.6 9.5 7.5 6.8 5.3 6.5 9.9 12.5 11.5
Num 9
Note: Hydrographs in 1996 and 2001 have irregular shape and judgeda as unreliable value.

Final Report (Supporting_MP) Part 7 Preliminary Hydrological Evaluation Results
JICA Project for the Master Plan Study of 7-43 August, 2011 Hydropower Development in Indonesia
Table 37 Supplemented Monthly Runoff and Collected Monthly Runoff Records (33/43)
No: 33 River Basin: K. SerayuStation Name: Banyumas River: K. SerayuStation ID by HPPS2: 02-090-01-08 Catchment Area (km2): 2,632
Supplemented Monthly Runoff in HPPS2 Unit:m3/s
Year Jan Feb Mar Apr May Jun Jul Aug Sep Oct Nov Dec Ave
1970 228.1 185.1 326.9 228.1 242.5 150.8 64.7 35.4 39.6 104.6 252.8 336.5 182.91971 435.0 463.0 440.0 271.0 154.0 99.5 84.7 65.7 81.9 246.0 314.0 379.0 252.81972 - - - - - - - - - - - - -1973 395.0 403.0 434.0 479.0 389.0 266.0 186.0 114.0 212.0 248.0 415.0 406.0 328.91974 285.0 402.0 278.3 359.0 223.0 107.8 107.8 140.0 242.0 449.0 257.6 285.0 261.41975 - - - - - - - - - - - - -1976 - - - - - - - - - - - - -1977 283.0 351.0 330.0 274.0 156.0 192.0 64.5 33.8 29.9 23.0 125.0 213.0 172.91978 305.0 263.0 293.0 188.8 229.0 291.0 264.0 133.0 240.0 273.0 278.0 384.0 261.81979 394.0 346.0 324.0 374.0 427.0 159.5 59.6 82.0 80.5 127.9 286.0 371.0 252.61980 276.0 224.0 334.0 380.0 188.0 96.3 59.6 142.0 71.3 204.0 435.0 425.0 236.31981 425.0 352.0 383.0 355.0 330.0 234.0 231.0 125.6 150.0 229.0 353.0 468.0 303.01982 444.9 380.0 297.0 254.0 74.1 45.4 34.6 23.8 24.4 45.9 54.2 135.7 151.21983 342.8 274.0 184.0 183.0 243.0 116.0 43.4 30.3 29.0 140.6 337.0 342.5 188.81984 318.0 524.0 366.0 402.0 267.0 121.0 86.0 59.8 272.9 347.0 311.0 407.0 290.11985 320.0 378.0 332.8 248.0 220.5 246.0 82.5 118.8 86.3 171.0 421.0 362.0 248.91986 - - - - - - - - - - - - -1987 466.0 555.0 364.0 252.0 164.0 111.0 60.5 52.7 50.0 122.0 245.0 473.0 242.91988 351.0 368.0 407.0 194.0 263.0 188.0 51.3 55.3 49.6 165.0 353.0 449.0 241.21989 340.0 397.0 331.0 250.0 192.0 195.0 148.0 107.0 72.1 125.0 246.0 246.0 220.81990 230.0 220.0 247.0 277.0 184.0 191.0 133.0 89.9 110.0 109.0 186.0 475.0 204.31991 576.0 527.0 349.0 360.0 148.0 65.5 94.4 125.0 158.0 115.0 230.0 399.0 262.21992 338.0 349.0 401.0 401.0 259.0 176.0 107.0 158.0 233.0 379.0 378.0 483.0 305.21993 416.0 324.0 351.0 369.0 232.0 138.0 81.0 76.0 60.8 55.5 169.0 335.0 217.3
Ave 358.4 364.3 338.7 304.9 229.3 159.5 102.2 88.4 114.7 184.0 282.3 368.7 241.3
Num 20
Collected Monthly Runoff Unit:m3/s
Year Jan Feb Mar Apr May Jun Jul Aug Sep Oct Nov Dec Ave
1994 298.3 310.4 306.0 225.6 127.2 56.3 41.7 41.2 32.6 29.8 106.9 216.3 149.41995 345.9 533.6 376.8 264.7 271.2 200.4 169.8 92.5 76.8 155.7 373.3 245.3 258.81996 282.6 405.0 332.7 222.0 109.9 96.4 92.0 84.5 62.8 223.1 328.6 250.4 207.51997 170.1 223.3 109.4 104.2 76.4 59.7 31.2 21.0 19.9 * * * -1998 * * 229.7 218.7 127.8 160.6 137.7 89.7 86.2 197.5 340.8 347.3 -1999 * * * * * * * * * * * * -2000 - - - - - - - - - - - - -2001 209.1 211.5 259.3 228.2 128.3 129.8 65.8 45.8 54.3 194.2 284.3 142.2 162.72002 - - - - - - - - - - - - -2003 180.3 270.0 229.0 113.0 89.6 55.9 43.9 38.3 33.6 81.9 178.4 231.6 128.82004 200.5 171.5 198.9 140.0 107.3 57.7 58.6 33.4 38.3 37.2 141.7 307.0 124.32005 200.3 157.0 139.3 176.1 90.3 72.0 65.9 46.8 70.2 147.3 147.0 244.8 129.82006 - - - - - - - - - - - - -2007 150.3 256.4 342.6 419.8 164.8 119.8 74.4 64.0 70.1 82.3 263.5 378.2 198.9
Ave 226.4 282.1 252.4 211.2 129.3 100.9 78.1 55.7 54.5 127.7 240.5 262.6 170.0
Num 8
Note: Hydrographs in 1997, 1998 and 1999 have irregular shape and judged as unirregular value.
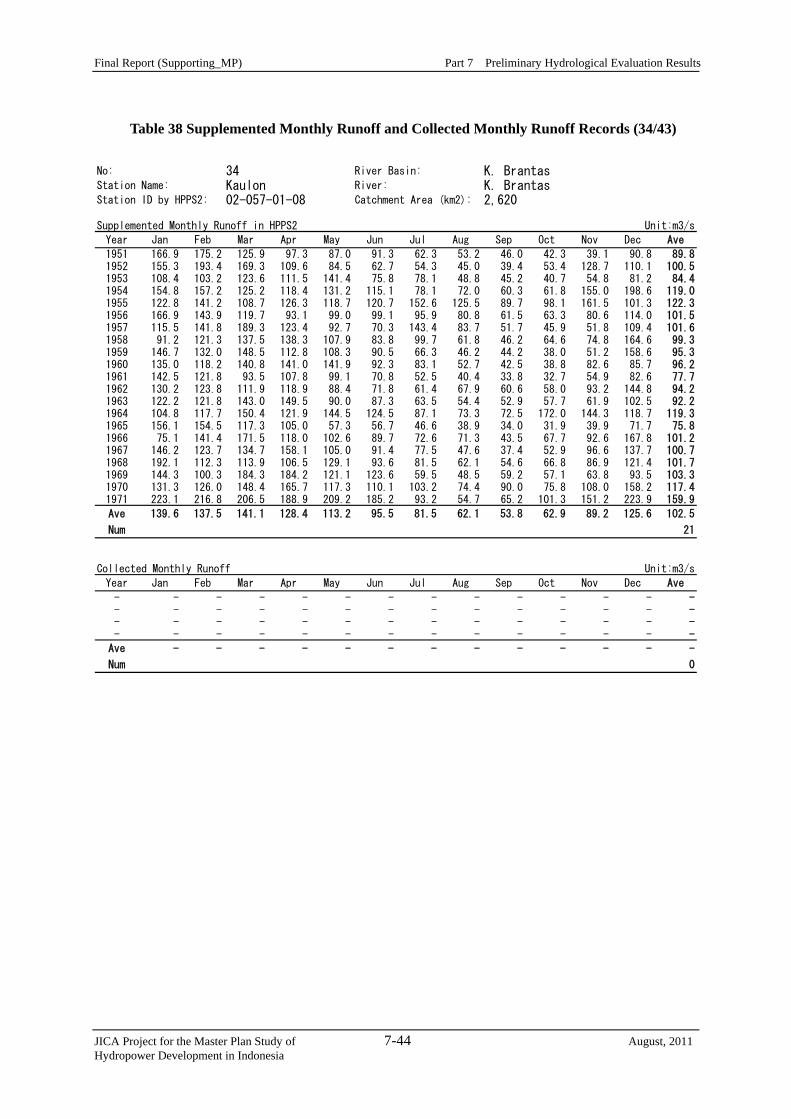
Final Report (Supporting_MP) Part 7 Preliminary Hydrological Evaluation Results
JICA Project for the Master Plan Study of 7-44 August, 2011 Hydropower Development in Indonesia
Table 38 Supplemented Monthly Runoff and Collected Monthly Runoff Records (34/43)
No: 34 River Basin: K. BrantasStation Name: Kaulon River: K. BrantasStation ID by HPPS2: 02-057-01-08 Catchment Area (km2): 2,620
Supplemented Monthly Runoff in HPPS2 Unit:m3/s
Year Jan Feb Mar Apr May Jun Jul Aug Sep Oct Nov Dec Ave
1951 166.9 175.2 125.9 97.3 87.0 91.3 62.3 53.2 46.0 42.3 39.1 90.8 89.81952 155.3 193.4 169.3 109.6 84.5 62.7 54.3 45.0 39.4 53.4 128.7 110.1 100.51953 108.4 103.2 123.6 111.5 141.4 75.8 78.1 48.8 45.2 40.7 54.8 81.2 84.41954 154.8 157.2 125.2 118.4 131.2 115.1 78.1 72.0 60.3 61.8 155.0 198.6 119.01955 122.8 141.2 108.7 126.3 118.7 120.7 152.6 125.5 89.7 98.1 161.5 101.3 122.31956 166.9 143.9 119.7 93.1 99.0 99.1 95.9 80.8 61.5 63.3 80.6 114.0 101.51957 115.5 141.8 189.3 123.4 92.7 70.3 143.4 83.7 51.7 45.9 51.8 109.4 101.61958 91.2 121.3 137.5 138.3 107.9 83.8 99.7 61.8 46.2 64.6 74.8 164.6 99.31959 146.7 132.0 148.5 112.8 108.3 90.5 66.3 46.2 44.2 38.0 51.2 158.6 95.31960 135.0 118.2 140.8 141.0 141.9 92.3 83.1 52.7 42.5 38.8 82.6 85.7 96.21961 142.5 121.8 93.5 107.8 99.1 70.8 52.5 40.4 33.8 32.7 54.9 82.6 77.71962 130.2 123.8 111.9 118.9 88.4 71.8 61.4 67.9 60.6 58.0 93.2 144.8 94.21963 122.2 121.8 143.0 149.5 90.0 87.3 63.5 54.4 52.9 57.7 61.9 102.5 92.21964 104.8 117.7 150.4 121.9 144.5 124.5 87.1 73.3 72.5 172.0 144.3 118.7 119.31965 156.1 154.5 117.3 105.0 57.3 56.7 46.6 38.9 34.0 31.9 39.9 71.7 75.81966 75.1 141.4 171.5 118.0 102.6 89.7 72.6 71.3 43.5 67.7 92.6 167.8 101.21967 146.2 123.7 134.7 158.1 105.0 91.4 77.5 47.6 37.4 52.9 96.6 137.7 100.71968 192.1 112.3 113.9 106.5 129.1 93.6 81.5 62.1 54.6 66.8 86.9 121.4 101.71969 144.3 100.3 184.3 184.2 121.1 123.6 59.5 48.5 59.2 57.1 63.8 93.5 103.31970 131.3 126.0 148.4 165.7 117.3 110.1 103.2 74.4 90.0 75.8 108.0 158.2 117.41971 223.1 216.8 206.5 188.9 209.2 185.2 93.2 54.7 65.2 101.3 151.2 223.9 159.9
Ave 139.6 137.5 141.1 128.4 113.2 95.5 81.5 62.1 53.8 62.9 89.2 125.6 102.5
Num 21
Collected Monthly Runoff Unit:m3/s
Year Jan Feb Mar Apr May Jun Jul Aug Sep Oct Nov Dec Ave
- - - - - - - - - - - - - -- - - - - - - - - - - - - -- - - - - - - - - - - - - -- - - - - - - - - - - - - -
Ave - - - - - - - - - - - - -
Num 0

Final Report (Supporting_MP) Part 7 Preliminary Hydrological Evaluation Results
JICA Project for the Master Plan Study of 7-45 August, 2011 Hydropower Development in Indonesia
Table 39 Supplemented Monthly Runoff and Collected Monthly Runoff Records (35/43)
No: 35 River Basin: K. BondoyudoStation Name: Wonorejo River: K. BondoyudoStation ID by HPPS2: 02-074-01-01 Catchment Area (km2): 314
Supplemented Monthly Runoff in HPPS2 Unit:m3/s
Year Jan Feb Mar Apr May Jun Jul Aug Sep Oct Nov Dec Ave
1973 13.9 19.3 14.2 16.8 16.9 18.9 16.9 14.0 19.4 17.0 97.1 17.7 23.51974 16.7 29.7 21.1 20.0 16.7 14.8 13.3 13.7 13.2 24.3 21.3 23.2 19.01975 24.3 22.6 22.4 24.5 26.8 15.5 16.3 13.6 16.1 20.8 21.3 26.5 20.91976 25.3 26.7 26.0 19.9 17.1 17.7 14.7 13.4 13.6 9.3 12.9 12.0 17.41977 16.8 15.7 20.4 20.4 15.6 14.6 13.2 12.6 12.0 11.5 11.5 11.5 14.71978 16.1 15.9 21.5 17.2 15.0 24.4 17.0 14.2 16.2 21.1 21.7 26.7 18.91979 21.0 19.7 17.3 20.0 16.1 23.2 16.6 15.8 13.0 15.4 17.3 19.2 17.91980 23.6 20.4 19.2 20.2 16.6 13.9 13.5 15.1 13.9 15.8 14.0 21.4 17.31981 15.3 15.7 16.1 17.2 17.5 14.8 15.8 12.3 14.0 13.8 13.9 17.8 15.41982 - - - - - - - - - - - - -1983 19.1 15.8 13.1 12.8 14.0 14.8 14.1 13.5 13.2 14.1 16.1 16.9 14.81984 - - - - - - - - - - - - -1985 - - - - - - - - - - - - -1986 - - - - - - - - - - - - -1987 - - - - - - - - - - - - -1988 19.4 17.6 18.0 16.6 16.1 15.3 14.4 14.0 13.9 14.1 14.8 15.6 15.81989 - - - - - - - - - - - - -1990 23.4 20.9 18.7 18.0 16.4 15.4 14.4 13.9 13.6 13.5 13.8 14.7 16.41991 12.7 13.0 7.4 6.4 6.2 5.4 5.2 5.3 5.1 4.7 18.6 20.8 9.21992 17.0 18.0 16.9 8.0 11.4 13.4 19.8 11.7 14.7 23.6 21.9 23.9 16.71993 16.5 17.0 19.6 18.1 14.8 16.0 12.0 13.6 14.5 16.8 15.3 19.3 16.1
Ave 18.7 19.2 18.1 17.1 15.8 15.9 14.5 13.1 13.8 15.7 22.1 19.1 16.9
Num 15
Collected Monthly Runoff Unit:m3/s
Year Jan Feb Mar Apr May Jun Jul Aug Sep Oct Nov Dec Ave
1994 20.5 21.5 27.5 17.9 15.6 14.7 14.3 14.7 14.6 13.9 13.8 15.0 17.01995 21.3 31.3 27.2 22.1 16.1 15.5 15.1 12.7 12.2 14.7 22.7 20.1 19.31996 23.9 21.5 24.1 21.8 16.0 14.3 13.8 14.4 12.0 14.6 24.4 19.3 18.41997 18.8 18.3 11.0 14.2 10.9 10.9 10.5 10.6 10.4 10.7 10.3 11.3 12.31998 - - - - - - - - - - - - -1999 18.8 33.9 22.7 47.1 21.7 17.5 15.8 14.4 13.3 17.3 17.8 21.6 21.82000 30.0 25.1 21.0 23.8 21.6 14.6 12.2 11.2 12.1 23.5 30.4 22.0 20.62001 26.7 42.2 46.7 23.8 15.9 16.7 15.1 13.0 10.7 14.3 17.8 14.8 21.52002 - - - - - - - - - - - - -2003 - - - - - - - - - - - - -2004 - - - - - - - - - - - - -2005 - - - - - - - - - - - - -2006 20.2 20.7 21.9 24.7 18.2 14.3 13.1 11.7 10.6 9.6 9.4 11.0 15.52007 10.3 13.2 22.7 19.6 14.5 13.8 11.2 10.1 10.2 9.6 10.9 15.7 13.5
Ave 21.2 25.3 25.0 23.9 16.7 14.7 13.5 12.6 11.8 14.2 17.5 16.8 17.8
Num 9

Final Report (Supporting_MP) Part 7 Preliminary Hydrological Evaluation Results
JICA Project for the Master Plan Study of 7-46 August, 2011 Hydropower Development in Indonesia
Table 40 Supplemented Monthly Runoff and Collected Monthly Runoff Records (36/43)
No: 36 River Basin: S. WerbaStation Name: PLTM Werba intakesite River: S. WerbaStation ID by HPPS2: - Catchment Area (km2): 65
Supplemented Monthly Runoff in HPPS2 Unit:m3/s
Year Jan Feb Mar Apr May Jun Jul Aug Sep Oct Nov Dec Ave
1980 1.53 1.15 2.24 2.85 3.56 2.31 2.66 4.89 2.17 2.41 1.69 1.51 2.411981 3.27 2.90 2.21 2.35 2.89 3.04 4.81 4.35 5.13 5.88 5.54 6.65 4.091982 3.86 4.85 5.59 5.53 5.17 2.43 1.98 2.22 1.25 3.88 1.31 0.80 3.241983 0.62 7.62 6.45 3.12 5.12 5.50 3.89 3.38 8.15 14.47 5.95 4.29 5.711984 5.23 4.02 5.27 6.36 6.74 10.86 14.82 14.27 10.31 8.48 5.61 5.77 8.151985 5.11 4.46 2.40 2.49 3.96 8.37 9.79 9.55 9.27 3.27 4.84 4.50 5.671986 2.57 2.31 11.17 5.19 3.13 3.31 2.34 3.23 3.86 6.17 3.20 2.64 4.091987 2.99 1.70 2.16 1.20 2.13 1.32 0.78 0.54 2.33 5.75 2.28 2.28 2.121988 2.38 2.89 2.32 1.81 1.81 3.98 5.20 4.64 5.82 3.95 2.75 2.89 3.371989 2.20 2.13 2.40 1.79 1.43 5.28 7.49 12.53 6.30 5.33 3.60 3.89 4.531990 4.27 2.76 4.05 2.29 4.91 7.82 6.97 4.99 4.80 4.94 3.22 3.18 4.52
Ave 3.09 3.34 4.21 3.18 3.71 4.93 5.52 5.87 5.40 5.87 3.64 3.49 4.35
Num 11
Collected Monthly Runoff Unit:m3/s
Year Jan Feb Mar Apr May Jun Jul Aug Sep Oct Nov Dec Ave
- - - - - - - - - - - - - -- - - - - - - - - - - - - -- - - - - - - - - - - - - -- - - - - - - - - - - - - -
Ave - - - - - - - - - - - - -
Num 0
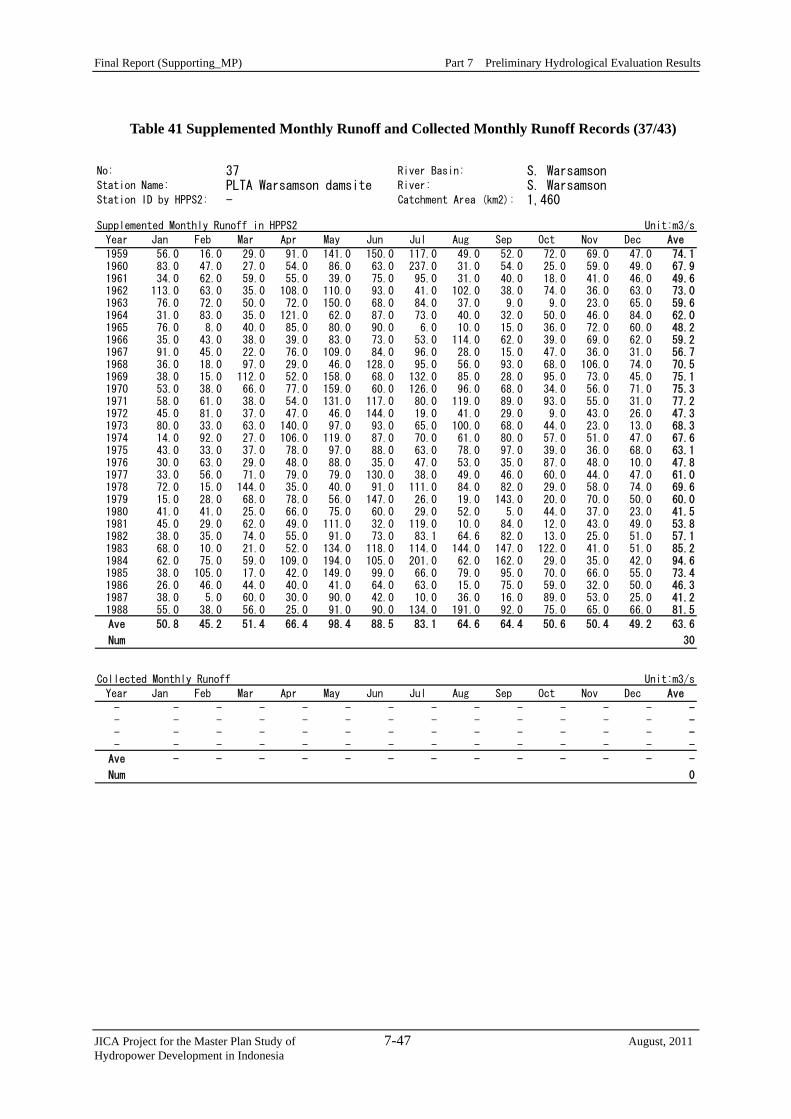
Final Report (Supporting_MP) Part 7 Preliminary Hydrological Evaluation Results
JICA Project for the Master Plan Study of 7-47 August, 2011 Hydropower Development in Indonesia
Table 41 Supplemented Monthly Runoff and Collected Monthly Runoff Records (37/43)
No: 37 River Basin: S. WarsamsonStation Name: PLTA Warsamson damsite River: S. WarsamsonStation ID by HPPS2: - Catchment Area (km2): 1,460
Supplemented Monthly Runoff in HPPS2 Unit:m3/s
Year Jan Feb Mar Apr May Jun Jul Aug Sep Oct Nov Dec Ave
1959 56.0 16.0 29.0 91.0 141.0 150.0 117.0 49.0 52.0 72.0 69.0 47.0 74.11960 83.0 47.0 27.0 54.0 86.0 63.0 237.0 31.0 54.0 25.0 59.0 49.0 67.91961 34.0 62.0 59.0 55.0 39.0 75.0 95.0 31.0 40.0 18.0 41.0 46.0 49.61962 113.0 63.0 35.0 108.0 110.0 93.0 41.0 102.0 38.0 74.0 36.0 63.0 73.01963 76.0 72.0 50.0 72.0 150.0 68.0 84.0 37.0 9.0 9.0 23.0 65.0 59.61964 31.0 83.0 35.0 121.0 62.0 87.0 73.0 40.0 32.0 50.0 46.0 84.0 62.01965 76.0 8.0 40.0 85.0 80.0 90.0 6.0 10.0 15.0 36.0 72.0 60.0 48.21966 35.0 43.0 38.0 39.0 83.0 73.0 53.0 114.0 62.0 39.0 69.0 62.0 59.21967 91.0 45.0 22.0 76.0 109.0 84.0 96.0 28.0 15.0 47.0 36.0 31.0 56.71968 36.0 18.0 97.0 29.0 46.0 128.0 95.0 56.0 93.0 68.0 106.0 74.0 70.51969 38.0 15.0 112.0 52.0 158.0 68.0 132.0 85.0 28.0 95.0 73.0 45.0 75.11970 53.0 38.0 66.0 77.0 159.0 60.0 126.0 96.0 68.0 34.0 56.0 71.0 75.31971 58.0 61.0 38.0 54.0 131.0 117.0 80.0 119.0 89.0 93.0 55.0 31.0 77.21972 45.0 81.0 37.0 47.0 46.0 144.0 19.0 41.0 29.0 9.0 43.0 26.0 47.31973 80.0 33.0 63.0 140.0 97.0 93.0 65.0 100.0 68.0 44.0 23.0 13.0 68.31974 14.0 92.0 27.0 106.0 119.0 87.0 70.0 61.0 80.0 57.0 51.0 47.0 67.61975 43.0 33.0 37.0 78.0 97.0 88.0 63.0 78.0 97.0 39.0 36.0 68.0 63.11976 30.0 63.0 29.0 48.0 88.0 35.0 47.0 53.0 35.0 87.0 48.0 10.0 47.81977 33.0 56.0 71.0 79.0 79.0 130.0 38.0 49.0 46.0 60.0 44.0 47.0 61.01978 72.0 15.0 144.0 35.0 40.0 91.0 111.0 84.0 82.0 29.0 58.0 74.0 69.61979 15.0 28.0 68.0 78.0 56.0 147.0 26.0 19.0 143.0 20.0 70.0 50.0 60.01980 41.0 41.0 25.0 66.0 75.0 60.0 29.0 52.0 5.0 44.0 37.0 23.0 41.51981 45.0 29.0 62.0 49.0 111.0 32.0 119.0 10.0 84.0 12.0 43.0 49.0 53.81982 38.0 35.0 74.0 55.0 91.0 73.0 83.1 64.6 82.0 13.0 25.0 51.0 57.11983 68.0 10.0 21.0 52.0 134.0 118.0 114.0 144.0 147.0 122.0 41.0 51.0 85.21984 62.0 75.0 59.0 109.0 194.0 105.0 201.0 62.0 162.0 29.0 35.0 42.0 94.61985 38.0 105.0 17.0 42.0 149.0 99.0 66.0 79.0 95.0 70.0 66.0 55.0 73.41986 26.0 46.0 44.0 40.0 41.0 64.0 63.0 15.0 75.0 59.0 32.0 50.0 46.31987 38.0 5.0 60.0 30.0 90.0 42.0 10.0 36.0 16.0 89.0 53.0 25.0 41.21988 55.0 38.0 56.0 25.0 91.0 90.0 134.0 191.0 92.0 75.0 65.0 66.0 81.5
Ave 50.8 45.2 51.4 66.4 98.4 88.5 83.1 64.6 64.4 50.6 50.4 49.2 63.6
Num 30
Collected Monthly Runoff Unit:m3/s
Year Jan Feb Mar Apr May Jun Jul Aug Sep Oct Nov Dec Ave
- - - - - - - - - - - - - -- - - - - - - - - - - - - -- - - - - - - - - - - - - -- - - - - - - - - - - - - -
Ave - - - - - - - - - - - - -
Num 0

Final Report (Supporting_MP) Part 7 Preliminary Hydrological Evaluation Results
JICA Project for the Master Plan Study of 7-48 August, 2011 Hydropower Development in Indonesia
Table 42 Supplemented Monthly Runoff and Collected Monthly Runoff Records (38/43)
No: 38 River Basin: S. SermoStation Name: PLTA Genyem damsite River: S. SermoStation ID by HPPS2: - Catchment Area (km2): 491
Supplemented Monthly Runoff in HPPS2 Unit:m3/s
Year Jan Feb Mar Apr May Jun Jul Aug Sep Oct Nov Dec Ave
1976 17.5 21.0 20.8 19.6 14.2 11.0 8.0 7.1 5.7 7.8 10.1 17.0 13.31977 18.0 19.0 27.5 35.9 28.1 23.7 17.5 13.9 11.8 10.9 10.9 14.5 19.31978 22.3 32.9 25.8 26.2 19.0 14.7 10.7 8.3 6.5 8.8 11.6 16.6 17.01979 16.5 22.5 28.6 25.5 20.9 16.2 15.2 12.9 10.0 16.7 16.9 19.7 18.51980 28.3 39.3 34.9 29.5 29.3 30.0 21.9 21.7 17.9 15.6 16.5 15.8 25.11981 17.4 27.6 24.2 31.3 22.7 18.0 13.0 9.8 9.0 8.8 9.3 13.3 17.01982 21.7 25.8 26.8 26.7 23.4 22.0 17.0 14.3 11.5 9.8 14.1 12.2 18.81983 14.2 18.3 18.7 16.1 16.1 16.2 11.7 9.0 9.1 11.7 10.4 14.2 13.81984 10.7 9.3 11.3 8.9 8.8 9.6 8.5 6.9 5.8 5.1 6.1 14.4 8.81985 16.1 19.6 24.3 22.1 18.9 16.5 15.7 11.8 16.2 14.0 16.0 21.7 17.71986 24.4 23.6 20.1 24.2 20.0 21.3 15.9 12.2 9.4 6.8 5.3 13.1 16.41987 17.9 18.0 15.1 18.1 13.1 10.6 8.4 6.3 9.2 6.6 6.4 5.5 11.31988 8.1 13.5 15.6 27.7 28.9 22.4 16.3 14.4 11.1 9.6 10.6 10.9 15.81989 14.8 28.7 22.9 38.8 31.1 24.1 17.5 13.9 11.9 10.9 9.4 19.0 20.31990 22.4 22.9 20.9 25.0 19.1 14.8 10.7 9.3 7.5 6.7 5.2 10.8 14.61991 17.7 20.4 22.0 17.8 15.8 16.0 14.9 12.3 13.2 10.8 10.3 12.7 15.31992 17.0 24.1 21.9 21.2 18.0 15.1 11.0 10.0 7.7 10.8 12.5 14.7 15.3
Ave 17.9 22.7 22.4 24.4 20.4 17.8 13.8 11.4 10.2 10.1 10.7 14.5 16.4
Num 17
Collected Monthly Runoff Unit:m3/s
Year Jan Feb Mar Apr May Jun Jul Aug Sep Oct Nov Dec Ave
- - - - - - - - - - - - - -- - - - - - - - - - - - - -- - - - - - - - - - - - - -- - - - - - - - - - - - - -
Ave - - - - - - - - - - - - -
Num 0
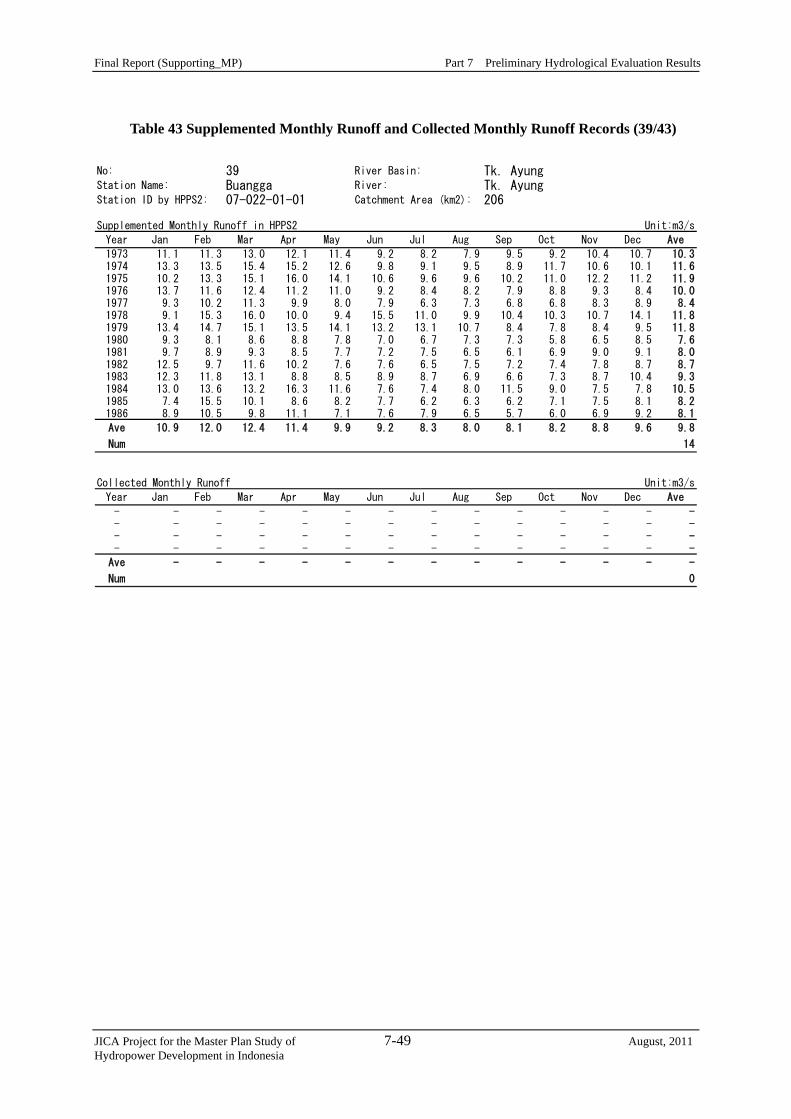
Final Report (Supporting_MP) Part 7 Preliminary Hydrological Evaluation Results
JICA Project for the Master Plan Study of 7-49 August, 2011 Hydropower Development in Indonesia
Table 43 Supplemented Monthly Runoff and Collected Monthly Runoff Records (39/43)
No: 39 River Basin: Tk. AyungStation Name: Buangga River: Tk. AyungStation ID by HPPS2: 07-022-01-01 Catchment Area (km2): 206
Supplemented Monthly Runoff in HPPS2 Unit:m3/s
Year Jan Feb Mar Apr May Jun Jul Aug Sep Oct Nov Dec Ave
1973 11.1 11.3 13.0 12.1 11.4 9.2 8.2 7.9 9.5 9.2 10.4 10.7 10.31974 13.3 13.5 15.4 15.2 12.6 9.8 9.1 9.5 8.9 11.7 10.6 10.1 11.61975 10.2 13.3 15.1 16.0 14.1 10.6 9.6 9.6 10.2 11.0 12.2 11.2 11.91976 13.7 11.6 12.4 11.2 11.0 9.2 8.4 8.2 7.9 8.8 9.3 8.4 10.01977 9.3 10.2 11.3 9.9 8.0 7.9 6.3 7.3 6.8 6.8 8.3 8.9 8.41978 9.1 15.3 16.0 10.0 9.4 15.5 11.0 9.9 10.4 10.3 10.7 14.1 11.81979 13.4 14.7 15.1 13.5 14.1 13.2 13.1 10.7 8.4 7.8 8.4 9.5 11.81980 9.3 8.1 8.6 8.8 7.8 7.0 6.7 7.3 7.3 5.8 6.5 8.5 7.61981 9.7 8.9 9.3 8.5 7.7 7.2 7.5 6.5 6.1 6.9 9.0 9.1 8.01982 12.5 9.7 11.6 10.2 7.6 7.6 6.5 7.5 7.2 7.4 7.8 8.7 8.71983 12.3 11.8 13.1 8.8 8.5 8.9 8.7 6.9 6.6 7.3 8.7 10.4 9.31984 13.0 13.6 13.2 16.3 11.6 7.6 7.4 8.0 11.5 9.0 7.5 7.8 10.51985 7.4 15.5 10.1 8.6 8.2 7.7 6.2 6.3 6.2 7.1 7.5 8.1 8.21986 8.9 10.5 9.8 11.1 7.1 7.6 7.9 6.5 5.7 6.0 6.9 9.2 8.1
Ave 10.9 12.0 12.4 11.4 9.9 9.2 8.3 8.0 8.1 8.2 8.8 9.6 9.8
Num 14
Collected Monthly Runoff Unit:m3/s
Year Jan Feb Mar Apr May Jun Jul Aug Sep Oct Nov Dec Ave
- - - - - - - - - - - - - -- - - - - - - - - - - - - -- - - - - - - - - - - - - -- - - - - - - - - - - - - -
Ave - - - - - - - - - - - - -
Num 0

Final Report (Supporting_MP) Part 7 Preliminary Hydrological Evaluation Results
JICA Project for the Master Plan Study of 7-50 August, 2011 Hydropower Development in Indonesia
Table 44 Supplemented Monthly Runoff and Collected Monthly Runoff Records (40/43)
No: 40 River Basin: K. Sidutan Station Name: Santong River: K. Sidutan Station ID by HPPS2: 08-005-01-01 Catchment Area (km2): 37
Supplemented Monthly Runoff in HPPS2 Unit:m3/s
Year Jan Feb Mar Apr May Jun Jul Aug Sep Oct Nov Dec Ave
1981 5.50 4.30 3.70 3.10 2.60 2.30 1.80 1.50 1.20 1.20 1.30 1.20 2.481982 2.10 2.30 2.40 2.00 1.70 1.40 1.10 1.00 0.80 0.70 0.70 0.80 1.421983 1.70 1.50 1.70 1.30 1.40 1.10 0.90 0.80 0.80 0.80 1.20 1.00 1.181984 1.60 3.10 2.20 1.90 1.60 1.30 1.10 1.00 1.00 0.90 0.90 1.00 1.471985 1.10 1.90 1.90 1.30 1.10 1.00 0.90 0.80 0.80 0.80 0.80 0.80 1.101986 2.70 2.10 1.40 1.60 1.40 1.20 1.00 0.90 1.00 0.80 0.80 0.90 1.321987 2.20 2.10 1.80 1.60 1.50 1.30 1.20 1.10 1.10 1.00 1.00 1.70 1.471988 1.50 1.70 2.80 2.30 1.80 1.60 1.40 1.30 1.20 1.10 1.10 2.10 1.661989 0.90 1.60 1.60 1.40 1.30 1.10 0.90 0.80 0.70 0.70 0.70 0.80 1.041990 3.20 1.60 3.00 1.90 1.60 1.20 1.10 0.90 0.80 0.80 0.70 0.90 1.481991 2.40 5.30 3.40 3.00 2.50 1.80 1.30 1.10 0.90 0.70 0.80 0.70 1.991992 1.60 2.70 2.50 4.80 0.90 1.10 1.10 1.10 0.90 0.90 0.90 0.80 1.611993 1.70 3.50 1.50 1.50 1.30 1.30 1.20 1.10 1.00 0.90 1.10 1.30 1.451994 1.20 1.90 6.70 7.50 1.90 1.00 0.80 0.70 0.60 0.70 0.90 1.40 2.111995 1.10 1.80 1.50 1.40 1.10 1.00 0.80 0.70 0.60 0.60 0.70 0.80 1.01
Ave 2.03 2.49 2.54 2.44 1.58 1.31 1.11 0.99 0.89 0.84 0.91 1.08 1.52
Num 15
Collected Monthly Runoff Unit:m3/s
Year Jan Feb Mar Apr May Jun Jul Aug Sep Oct Nov Dec Ave
1996 1.48 2.02 2.34 1.74 0.84 0.63 0.70 1.12 1.18 0.98 0.97 1.46 1.291997 2.45 2.90 1.86 1.45 0.93 0.55 0.59 0.97 1.38 1.36 1.23 1.27 1.411998 1.42 1.97 1.55 1.72 1.39 1.15 1.21 1.08 1.04 1.20 1.33 1.22 1.361999 - - - - - - - - - - - - -2000 - - - - - - - - - - - - -2001 - - - - - - - - - - - - -2002 - - - - - - - - - - - - -2003 1.98 2.69 2.90 2.14 1.85 1.64 1.38 1.23 1.22 1.15 1.20 1.43 1.732004 - - - - - - - - - - - - -2005 - - - - - - - - - - - - -2006 3.81 3.33 3.80 3.37 3.53 3.17 2.59 2.26 2.08 1.84 1.73 1.97 2.792007 - - - - - - - - - - - - -2008 1.52 4.53 2.51 1.99 1.70 1.44 1.30 1.20 1.20 1.08 1.24 1.15 1.74
Ave 2.11 2.91 2.49 2.07 1.71 1.43 1.29 1.31 1.35 1.27 1.28 1.42 1.72
Num 6

Final Report (Supporting_MP) Part 7 Preliminary Hydrological Evaluation Results
JICA Project for the Master Plan Study of 7-51 August, 2011 Hydropower Development in Indonesia
Table 45 Supplemented Monthly Runoff and Collected Monthly Runoff Records (41/43)
No: 41 River Basin: A. IraStation Name: PLTM Ira intakesite River: A. IraStation ID by HPPS2: - Catchment Area (km2): 118
Supplemented Monthly Runoff in HPPS2 Unit:m3/s
Year Jan Feb Mar Apr May Jun Jul Aug Sep Oct Nov Dec Ave
1984 4.54 4.35 4.04 2.20 1.90 2.97 0.81 0.44 4.83 3.35 1.96 6.67 3.171985 4.51 4.34 1.21 0.56 6.31 5.89 3.99 4.10 3.60 3.98 6.14 5.07 4.141986 2.75 1.83 3.71 1.85 6.65 6.02 4.04 1.15 2.29 0.68 4.96 1.92 3.151987 5.24 6.65 2.35 2.61 4.62 9.35 3.54 4.48 3.11 4.61 1.18 11.78 4.961988 7.31 6.39 5.89 1.68 8.35 5.15 9.05 11.74 3.33 3.60 2.73 9.44 6.221989 9.29 3.16 8.11 2.07 5.05 7.54 9.66 5.44 5.05 1.95 6.89 10.64 6.241990 8.09 2.38 4.97 5.28 3.68 2.75 2.60 3.74 4.02 1.27 5.97 6.50 4.271991 7.43 5.12 2.48 3.86 3.93 3.17 1.64 0.57 0.44 2.06 6.93 2.95 3.381992 3.34 4.04 2.92 4.09 7.18 3.03 5.03 1.53 2.56 0.56 0.32 3.62 3.181993 1.34 0.68 1.45 0.49 0.26 2.55 3.86 3.40 3.42 2.45 4.12 6.51 2.54
Ave 5.39 3.89 3.71 2.47 4.79 4.84 4.42 3.66 3.26 2.45 4.12 6.51 4.13
Num 10
Collected Monthly Runoff Unit:m3/s
Year Jan Feb Mar Apr May Jun Jul Aug Sep Oct Nov Dec Ave
- - - - - - - - - - - - - -- - - - - - - - - - - - - -- - - - - - - - - - - - - -- - - - - - - - - - - - - -
Ave - - - - - - - - - - - - -
Num 0

Final Report (Supporting_MP) Part 7 Preliminary Hydrological Evaluation Results
JICA Project for the Master Plan Study of 7-52 August, 2011 Hydropower Development in Indonesia
Table 46 Supplemented Monthly Runoff and Collected Monthly Runoff Records (42/43)
No: 42 River Basin: Wai IsalStation Name: PLTA Isal-2 damsite River: Wai IsalStation ID by HPPS2: - Catchment Area (km2): 242
Supplemented Monthly Runoff in HPPS2 Unit:m3/s
Year Jan Feb Mar Apr May Jun Jul Aug Sep Oct Nov Dec Ave
1930 18.2 23.5 26.4 22.1 20.4 16.7 5.4 4.2 5.5 11.9 13.7 22.6 15.91931 17.3 29.2 23.5 26.4 20.9 19.8 9.4 9.1 13.8 17.0 20.1 22.3 19.11932 15.0 19.5 13.2 23.4 21.2 15.3 4.1 5.4 6.7 16.1 10.4 16.7 13.91933 22.7 11.0 19.0 18.4 18.6 15.6 10.9 16.4 20.5 20.9 16.0 19.4 17.51934 18.0 19.4 24.0 23.4 19.0 16.4 11.5 26.3 13.0 13.9 11.1 19.1 17.91935 15.5 21.6 15.2 24.8 17.4 13.0 10.0 9.9 5.5 18.5 20.7 11.9 15.31936 22.7 14.7 20.3 25.9 21.7 20.5 22.7 11.9 11.9 8.8 17.2 21.0 18.31937 18.4 19.7 12.0 26.8 22.6 25.6 24.4 12.6 16.9 16.1 11.8 11.9 18.21938 23.3 17.6 14.8 10.5 17.6 8.4 19.8 17.6 17.7 13.0 17.0 15.6 16.11939 14.8 14.3 13.2 19.5 24.2 15.4 18.2 3.7 8.0 12.9 7.3 15.6 13.9
Ave 18.6 19.1 18.2 22.1 20.4 16.7 13.6 11.7 12.0 14.9 14.5 17.6 16.6
Num 10
Collected Monthly Runoff Unit:m3/s
Year Jan Feb Mar Apr May Jun Jul Aug Sep Oct Nov Dec Ave
- - - - - - - - - - - - - -- - - - - - - - - - - - - -- - - - - - - - - - - - - -- - - - - - - - - - - - - -
Ave - - - - - - - - - - - - -
Num 0

Final Report (Supporting_MP) Part 7 Preliminary Hydrological Evaluation Results
JICA Project for the Master Plan Study of 7-53 August, 2011 Hydropower Development in Indonesia
Table 47 Supplemented Monthly Runoff and Collected Monthly Runoff Records (43/43)
No: 43 River Basin: Ira SiquiroStation Name: PLTA Ira Lalaro damsite River: Ira SiquiroStation ID by HPPS2: - Catchment Area (km2): 406
Supplemented Monthly Runoff in HPPS2 Unit:m3/s
Year Jan Feb Mar Apr May Jun Jul Aug Sep Oct Nov Dec Ave
1953 6.5 9.2 11.8 11.3 14.6 12.6 13.9 14.4 5.8 5.9 5.3 8.3 10.01954 9.0 11.0 15.3 11.7 12.1 17.2 21.2 25.7 28.9 14.2 7.0 7.4 15.11955 10.1 11.3 9.8 12.6 9.6 14.5 15.8 13.8 18.4 7.1 8.1 5.4 11.41956 5.7 7.6 10.3 8.1 8.9 7.3 7.7 7.8 6.6 6.6 4.2 6.8 7.31957 8.6 11.9 14.8 12.3 12.2 10.9 11.8 12.1 8.4 4.8 4.7 5.7 9.91958 7.3 9.5 11.0 12.1 13.4 12.9 14.9 13.7 7.7 4.9 3.8 4.9 9.71959 5.5 7.3 10.5 11.6 15.6 14.7 15.9 14.6 5.8 5.3 4.1 5.3 9.71960 6.5 9.9 11.1 11.7 12.3 8.1 8.3 6.0 4.3 4.1 4.4 5.2 7.71961 7.5 9.8 12.3 14.0 15.2 18.1 13.2 15.0 15.8 5.3 5.5 6.2 11.51962 7.7 11.1 11.7 11.5 12.2 12.2 9.0 6.3 4.5 3.9 3.7 4.2 8.21963 5.7 6.6 9.4 10.5 11.2 12.3 11.6 13.4 8.3 5.4 7.0 8.0 9.11964 11.7 12.1 10.0 12.7 8.8 9.8 9.2 8.0 6.7 4.2 3.4 4.4 8.41965 6.6 7.8 10.8 12.2 9.2 9.6 8.5 8.7 8.6 4.4 4.5 5.2 8.01966 6.9 8.8 12.7 12.2 11.2 12.5 8.0 7.1 5.7 4.5 4.2 5.2 8.31967 6.9 8.3 11.8 11.4 12.0 13.4 17.0 20.3 16.2 12.7 3.8 5.1 11.61968 6.5 7.6 11.2 9.5 7.9 8.8 7.5 8.6 8.1 6.0 4.2 6.1 7.71969 6.7 8.5 12.6 9.3 12.0 12.5 14.2 15.5 9.2 5.5 5.0 7.4 9.91970 7.8 8.4 10.9 9.5 8.8 10.7 10.3 10.1 6.4 6.1 5.8 6.7 8.51971 7.8 10.6 11.1 12.5 13.6 15.0 10.9 9.0 6.3 4.0 3.4 4.8 9.11972 6.3 7.6 11.2 12.2 11.7 12.3 12.8 12.2 8.9 7.2 7.8 8.6 9.91973 7.0 9.9 9.1 9.0 10.8 9.1 10.0 7.5 7.8 6.1 5.0 6.0 8.1
Ave 7.3 9.3 11.4 11.3 11.6 12.1 12.0 11.9 9.4 6.1 5.0 6.0 9.5
Num 21
Collected Monthly Runoff Unit:m3/s
Year Jan Feb Mar Apr May Jun Jul Aug Sep Oct Nov Dec Ave
- - - - - - - - - - - - - -- - - - - - - - - - - - - -- - - - - - - - - - - - - -- - - - - - - - - - - - - -
Ave - - - - - - - - - - - - -
Num 0

Final Report (Supporting_MP) Part 7 Preliminary Hydrological Evaluation Results
JICA Project for the Master Plan Study of 7-54 August, 2011 Hydropower Development in Indonesia
Table 48 Weighted Annual Mean Runoff and Rate of Change
Region No. Station NameRunoff(m3/s)
Number of
Years
Runoff(m3/s)
Number of
Years
Runoff(m3/s)
Rate of
Change(%)
Sumatra 1 Lhok Nibong 175.7 21 241.2 3 183.9 4.7%2 Stabat 201.7 22 184.2 5 198.5 -1.6%3 Lb. Sipelanduk 28.4 20 - 0 28.4 0.0%4 Lb. Bendahara 141.5 19 120.0 5 137.0 -3.2%5 Tj. Ampalu 77.6 18 57.5 5 73.2 -5.6%6 Sungai Dareh 310.2 18 247.4 6 294.5 -5.1%7 Muara Inum 107.6 17 - 0 107.6 0.0%8 Martapura 225.0 25 183.3 2 221.9 -1.4%9 Banjarmasin 36.8 22 40.1 6 37.5 1.9%10 Kunyir 23.1 26 17.4 4 22.3 -3.3%11 Kp. Darang 33.1 16 31.1 3 32.8 -0.9%12 Tui Kareng 183.9 11 212.7 3 190.1 3.4%13 Hp. Baru 128.9 21 80.9 4 121.3 -6.0%14 Air Batu 31.3 20 41.7 6 33.7 7.7%15 Air Gadang 121.3 20 100.1 5 117.1 -3.5%16 Despetah 45.2 18 - 0 45.2 0.0%
Kalimantan 17 Silat damsite 73.7 15 - 0 73.7 0.0%18 Kelai-2 damsite 293.6 16 - 0 293.6 0.0%19 Sei Langsat 60.3 20 - 0 60.3 0.0%20 Panaan 45.6 27 26.3 5 42.6 -6.6%
Sulawesi 21 Tulabolo 60.6 9 - 0 60.6 0.0%22 Tincep 3.2 18 - 0 3.2 0.0%23 Palili 21.2 15 - 0 21.2 0.0%24 Gillirang 8.2 15 12.5 3 8.9 8.7%25 Bila 15.7 15 18.8 4 16.4 4.1%26 Likupande 15.5 12 11.3 8 13.9 -10.8%27 Bakaru 69.1 19 - 0 69.1 0.0%
Jawa 28 Kebon Randu 29.6 27 - 0 29.6 0.0%29 Cibuni-3 damsite 78.0 30 - 0 78.0 0.0%30 Rangkasbitung 94.3 24 63.6 6 88.1 -6.5%31 Leuwi Goong 30.0 30 30.5 4 30.0 0.2%32 Krangan-2 17.0 24 11.5 9 15.5 -8.8%33 Banyumas 241.3 20 170.0 8 220.9 -8.4%34 Kaulon 102.5 21 - 0 102.5 0.0%35 Wonorejo 16.9 15 17.8 9 17.2 1.8%
Irian Jaya 36 PLTM Werba 4.4 11 - 0 4.4 0.0%37 PLTA Warsamson 63.6 30 - 0 63.6 0.0%38 PLTA Genyem 16.4 17 - 0 16.4 0.0%
Bali 39 Buangga 9.8 14 - 0 9.8 0.0%Lombok 40 Santong 1.5 15 1.7 6 1.6 3.8%Halmahera 41 PLTM Ira 4.1 10 - 0 4.1 0.0%Seram 42 PLTA Isal-2 16.6 10 - 0 16.6 0.0%Timor 43 PLTA Ira Lalaro 9.5 21 - 0 9.5 0.0%
Supplemented AnnualMean Runoff in HPPS2
Collected AnnualMean Runoff
Weighted AnnualMean Runoff
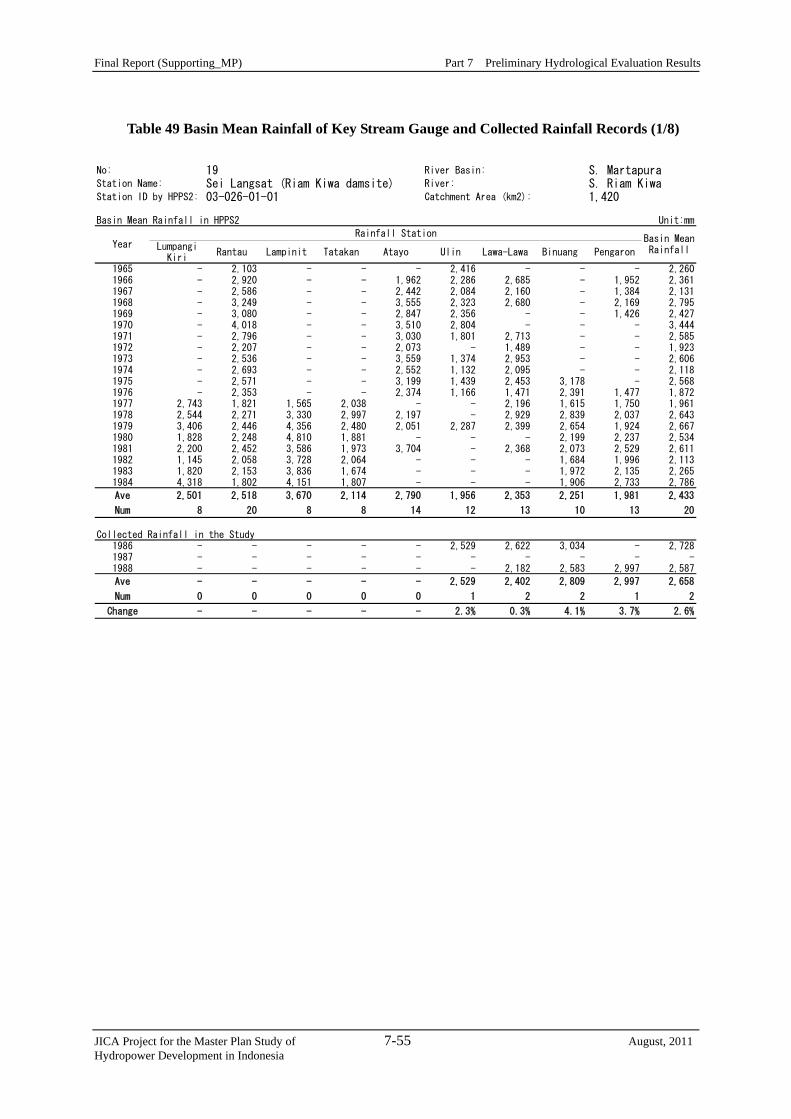
Final Report (Supporting_MP) Part 7 Preliminary Hydrological Evaluation Results
JICA Project for the Master Plan Study of 7-55 August, 2011 Hydropower Development in Indonesia
Table 49 Basin Mean Rainfall of Key Stream Gauge and Collected Rainfall Records (1/8)
No: 19 River Basin: S. MartapuraStation Name: Sei Langsat (Riam Kiwa damsite) River: S. Riam KiwaStation ID by HPPS2: 03-026-01-01 Catchment Area (km2): 1,420
Basin Mean Rainfall in HPPS2 Unit:mm
Rainfall Station
LumpangiKiri
Rantau Lampinit Tatakan Atayo Ulin Lawa-Lawa Binuang Pengaron
1965 - 2,103 - - - 2,416 - - - 2,2601966 - 2,920 - - 1,962 2,286 2,685 - 1,952 2,3611967 - 2,586 - - 2,442 2,084 2,160 - 1,384 2,1311968 - 3,249 - - 3,555 2,323 2,680 - 2,169 2,7951969 - 3,080 - - 2,847 2,356 - - 1,426 2,4271970 - 4,018 - - 3,510 2,804 - - - 3,4441971 - 2,796 - - 3,030 1,801 2,713 - - 2,5851972 - 2,207 - - 2,073 - 1,489 - - 1,9231973 - 2,536 - - 3,559 1,374 2,953 - - 2,6061974 - 2,693 - - 2,552 1,132 2,095 - - 2,1181975 - 2,571 - - 3,199 1,439 2,453 3,178 - 2,5681976 - 2,353 - - 2,374 1,166 1,471 2,391 1,477 1,8721977 2,743 1,821 1,565 2,038 - - 2,196 1,615 1,750 1,9611978 2,544 2,271 3,330 2,997 2,197 - 2,929 2,839 2,037 2,6431979 3,406 2,446 4,356 2,480 2,051 2,287 2,399 2,654 1,924 2,6671980 1,828 2,248 4,810 1,881 - - - 2,199 2,237 2,5341981 2,200 2,452 3,586 1,973 3,704 - 2,368 2,073 2,529 2,6111982 1,145 2,058 3,728 2,064 - - - 1,684 1,996 2,1131983 1,820 2,153 3,836 1,674 - - - 1,972 2,135 2,2651984 4,318 1,802 4,151 1,807 - - - 1,906 2,733 2,786
Ave 2,501 2,518 3,670 2,114 2,790 1,956 2,353 2,251 1,981 2,433
Num 8 20 8 8 14 12 13 10 13 20
Collected Rainfall in the Study1986 - - - - - 2,529 2,622 3,034 - 2,7281987 - - - - - - - - - -1988 - - - - - - 2,182 2,583 2,997 2,587
Ave - - - - - 2,529 2,402 2,809 2,997 2,658
Num 0 0 0 0 0 1 2 2 1 2
Change - - - - - 2.3% 0.3% 4.1% 3.7% 2.6%
Basin MeanRainfall
Year
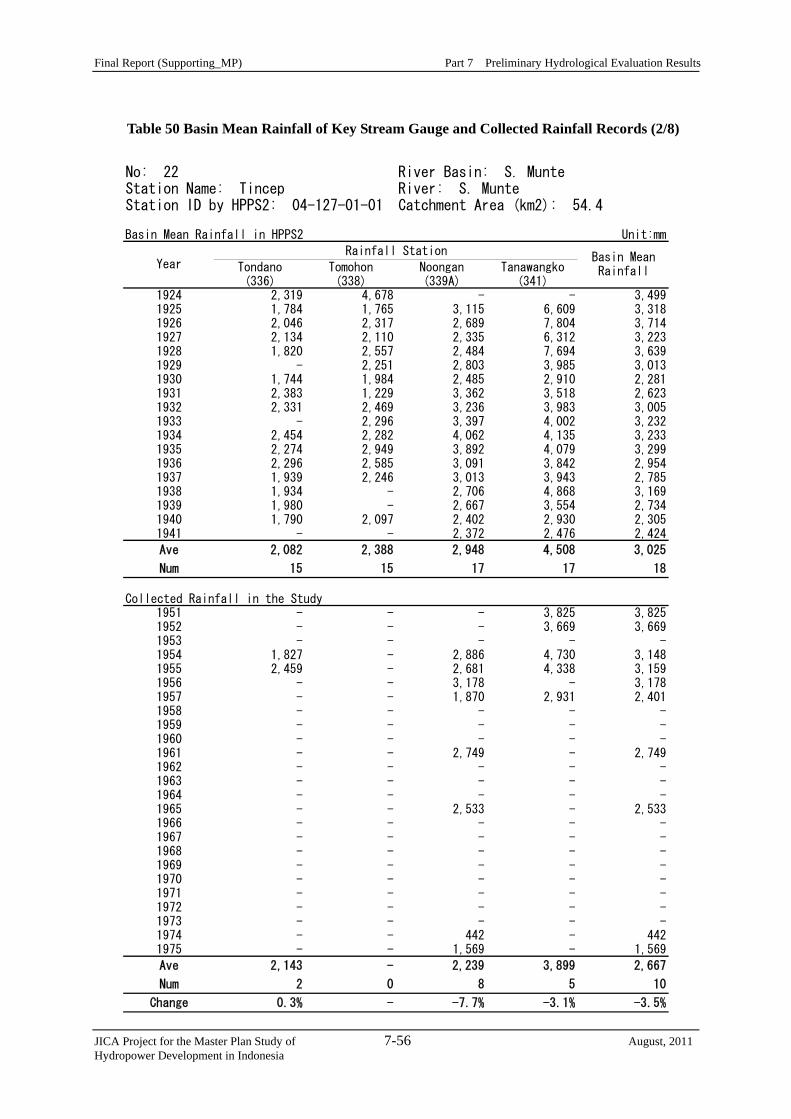
Final Report (Supporting_MP) Part 7 Preliminary Hydrological Evaluation Results
JICA Project for the Master Plan Study of 7-56 August, 2011 Hydropower Development in Indonesia
Table 50 Basin Mean Rainfall of Key Stream Gauge and Collected Rainfall Records (2/8)
No: 22 River Basin: S. MunteStation Name: Tincep River: S. MunteStation ID by HPPS2: 04-127-01-01 Catchment Area (km2): 54.4
Basin Mean Rainfall in HPPS2 Unit:mm
Rainfall Station
Tondano(336)
Tomohon(338)
Noongan(339A)
Tanawangko(341)
1924 2,319 4,678 - - 3,4991925 1,784 1,765 3,115 6,609 3,3181926 2,046 2,317 2,689 7,804 3,7141927 2,134 2,110 2,335 6,312 3,2231928 1,820 2,557 2,484 7,694 3,6391929 - 2,251 2,803 3,985 3,0131930 1,744 1,984 2,485 2,910 2,2811931 2,383 1,229 3,362 3,518 2,6231932 2,331 2,469 3,236 3,983 3,0051933 - 2,296 3,397 4,002 3,2321934 2,454 2,282 4,062 4,135 3,2331935 2,274 2,949 3,892 4,079 3,2991936 2,296 2,585 3,091 3,842 2,9541937 1,939 2,246 3,013 3,943 2,7851938 1,934 - 2,706 4,868 3,1691939 1,980 - 2,667 3,554 2,7341940 1,790 2,097 2,402 2,930 2,3051941 - - 2,372 2,476 2,424
Ave 2,082 2,388 2,948 4,508 3,025
Num 15 15 17 17 18
Collected Rainfall in the Study1951 - - - 3,825 3,8251952 - - - 3,669 3,6691953 - - - - -1954 1,827 - 2,886 4,730 3,1481955 2,459 - 2,681 4,338 3,1591956 - - 3,178 - 3,1781957 - - 1,870 2,931 2,4011958 - - - - -1959 - - - - -1960 - - - - -1961 - - 2,749 - 2,7491962 - - - - -1963 - - - - -1964 - - - - -1965 - - 2,533 - 2,5331966 - - - - -1967 - - - - -1968 - - - - -1969 - - - - -1970 - - - - -1971 - - - - -1972 - - - - -1973 - - - - -1974 - - 442 - 4421975 - - 1,569 - 1,569
Ave 2,143 - 2,239 3,899 2,667
Num 2 0 8 5 10
Change 0.3% - -7.7% -3.1% -3.5%
Basin MeanRainfall
Year
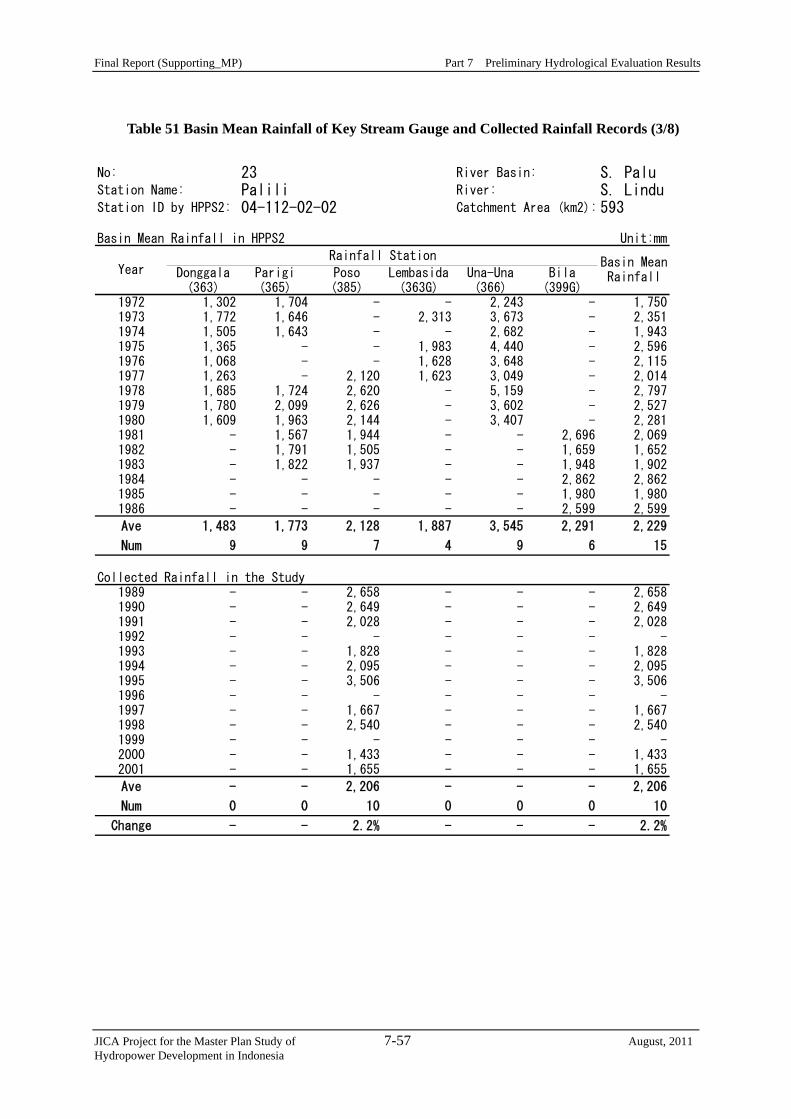
Final Report (Supporting_MP) Part 7 Preliminary Hydrological Evaluation Results
JICA Project for the Master Plan Study of 7-57 August, 2011 Hydropower Development in Indonesia
Table 51 Basin Mean Rainfall of Key Stream Gauge and Collected Rainfall Records (3/8)
No: 23 River Basin: S. PaluStation Name: Palili River: S. LinduStation ID by HPPS2: 04-112-02-02 Catchment Area (km2): 593
Basin Mean Rainfall in HPPS2 Unit:mm
Rainfall Station
Donggala(363)
Parigi(365)
Poso(385)
Lembasida(363G)
Una-Una(366)
Bila(399G)
1972 1,302 1,704 - - 2,243 - 1,7501973 1,772 1,646 - 2,313 3,673 - 2,3511974 1,505 1,643 - - 2,682 - 1,9431975 1,365 - - 1,983 4,440 - 2,5961976 1,068 - - 1,628 3,648 - 2,1151977 1,263 - 2,120 1,623 3,049 - 2,0141978 1,685 1,724 2,620 - 5,159 - 2,7971979 1,780 2,099 2,626 - 3,602 - 2,5271980 1,609 1,963 2,144 - 3,407 - 2,2811981 - 1,567 1,944 - - 2,696 2,0691982 - 1,791 1,505 - - 1,659 1,6521983 - 1,822 1,937 - - 1,948 1,9021984 - - - - - 2,862 2,8621985 - - - - - 1,980 1,9801986 - - - - - 2,599 2,599
Ave 1,483 1,773 2,128 1,887 3,545 2,291 2,229
Num 9 9 7 4 9 6 15
Collected Rainfall in the Study1989 - - 2,658 - - - 2,6581990 - - 2,649 - - - 2,6491991 - - 2,028 - - - 2,0281992 - - - - - - -1993 - - 1,828 - - - 1,8281994 - - 2,095 - - - 2,0951995 - - 3,506 - - - 3,5061996 - - - - - - -1997 - - 1,667 - - - 1,6671998 - - 2,540 - - - 2,5401999 - - - - - - -2000 - - 1,433 - - - 1,4332001 - - 1,655 - - - 1,655
Ave - - 2,206 - - - 2,206
Num 0 0 10 0 0 0 10
Change - - 2.2% - - - 2.2%
Basin MeanRainfall
Year
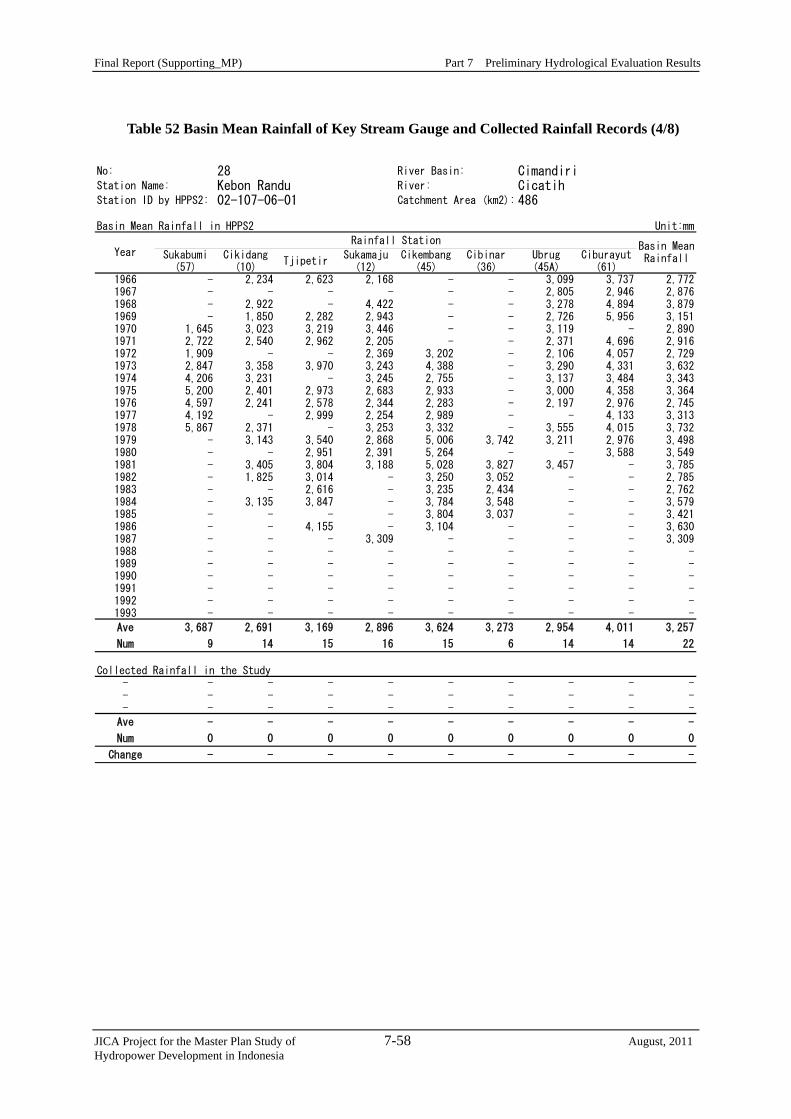
Final Report (Supporting_MP) Part 7 Preliminary Hydrological Evaluation Results
JICA Project for the Master Plan Study of 7-58 August, 2011 Hydropower Development in Indonesia
Table 52 Basin Mean Rainfall of Key Stream Gauge and Collected Rainfall Records (4/8)
No: 28 River Basin: CimandiriStation Name: Kebon Randu River: CicatihStation ID by HPPS2: 02-107-06-01 Catchment Area (km2): 486
Basin Mean Rainfall in HPPS2 Unit:mm
Rainfall Station
Sukabumi(57)
Cikidang(10)
TjipetirSukamaju
(12)Cikembang
(45)Cibinar(36)
Ubrug(45A)
Ciburayut(61)
1966 - 2,234 2,623 2,168 - - 3,099 3,737 2,7721967 - - - - - - 2,805 2,946 2,8761968 - 2,922 - 4,422 - - 3,278 4,894 3,8791969 - 1,850 2,282 2,943 - - 2,726 5,956 3,1511970 1,645 3,023 3,219 3,446 - - 3,119 - 2,8901971 2,722 2,540 2,962 2,205 - - 2,371 4,696 2,9161972 1,909 - - 2,369 3,202 - 2,106 4,057 2,7291973 2,847 3,358 3,970 3,243 4,388 - 3,290 4,331 3,6321974 4,206 3,231 - 3,245 2,755 - 3,137 3,484 3,3431975 5,200 2,401 2,973 2,683 2,933 - 3,000 4,358 3,3641976 4,597 2,241 2,578 2,344 2,283 - 2,197 2,976 2,7451977 4,192 - 2,999 2,254 2,989 - - 4,133 3,3131978 5,867 2,371 - 3,253 3,332 - 3,555 4,015 3,7321979 - 3,143 3,540 2,868 5,006 3,742 3,211 2,976 3,4981980 - - 2,951 2,391 5,264 - - 3,588 3,5491981 - 3,405 3,804 3,188 5,028 3,827 3,457 - 3,7851982 - 1,825 3,014 - 3,250 3,052 - - 2,7851983 - - 2,616 - 3,235 2,434 - - 2,7621984 - 3,135 3,847 - 3,784 3,548 - - 3,5791985 - - - - 3,804 3,037 - - 3,4211986 - - 4,155 - 3,104 - - - 3,6301987 - - - 3,309 - - - - 3,3091988 - - - - - - - - -1989 - - - - - - - - -1990 - - - - - - - - -1991 - - - - - - - - -1992 - - - - - - - - -1993 - - - - - - - - -
Ave 3,687 2,691 3,169 2,896 3,624 3,273 2,954 4,011 3,257
Num 9 14 15 16 15 6 14 14 22
Collected Rainfall in the Study- - - - - - - - - -- - - - - - - - - -- - - - - - - - - -
Ave - - - - - - - - -
Num 0 0 0 0 0 0 0 0 0
Change - - - - - - - - -
Basin MeanRainfall
Year

Final Report (Supporting_MP) Part 7 Preliminary Hydrological Evaluation Results
JICA Project for the Master Plan Study of 7-59 August, 2011 Hydropower Development in Indonesia
Table 53 Basin Mean Rainfall of Key Stream Gauge and Collected Rainfall Records (5/8)
No: 29 River Basin: CibuniStation Name: Cibuni-3 damsite River: CibuniStation ID by HPPS2: - Catchment Area (km2): 1,124
Basin Mean Rainfall in HPPS2 Unit:mm
Rainfall Station
Cimenteng(54C)
Sukanegara(98)
Pagelaran(109A)
Citambur(129)
Cibuni(133)
Dinewati(65)
Agrabintana(114A)
1953 2,766 2,475 2,817 - 2,665 - 3,586 2,8621954 3,757 4,233 3,957 - 3,542 - 4,301 3,9581955 4,479 5,013 3,662 3,882 4,108 - 4,432 4,2631956 3,287 - - - 3,509 - 3,177 3,3241957 2,540 3,450 2,941 3,473 - - 4,615 3,4041958 3,702 4,464 - - - - 3,792 3,9861959 2,397 3,877 - - 3,102 - 3,952 3,3321960 2,782 - - - - - 2,707 2,7451961 1,556 - 2,603 - - - 2,207 2,1221962 2,926 - 3,397 - - - 3,323 3,2151963 2,466 1,660 1,584 - - - - 1,9031964 2,982 4,088 3,416 3,862 3,140 - 5,278 3,7941965 2,070 - 2,904 - - - 2,905 2,6261966 4,139 - - 3,401 - - 4,373 3,9711967 2,372 2,958 2,305 3,082 2,187 - 1,471 2,3961968 4,455 3,864 6,136 4,928 3,513 - 6,305 4,8671969 3,080 2,952 4,046 3,319 3,392 - 2,669 3,2431970 2,830 4,659 3,876 3,486 3,615 - - 3,6931971 - 5,537 - 3,703 3,551 - 2,748 3,8851972 - 2,715 2,373 2,610 - 1,987 - 2,4211973 3,799 - 4,783 4,972 4,290 - 4,640 4,4971974 2,394 - 3,420 3,953 3,967 - 3,813 3,5091975 - 4,364 4,057 4,798 3,810 3,829 3,734 4,0991976 3,329 2,607 2,279 3,698 3,264 3,121 3,591 3,1271977 - 2,678 2,660 3,361 2,427 3,205 4,581 3,1521978 - - 3,946 5,535 4,708 - 4,331 4,6301979 - - - 5,150 4,110 3,350 - 4,2031980 - - - 3,574 4,204 - 3,290 3,6891981 - - - 4,239 3,635 - 3,943 3,9391982 - - - - 2,856 - - 2,856
Ave 3,053 3,623 3,358 3,949 3,505 3,098 3,751 3,457
Num 21 17 20 19 21 5 25 30
Collected Rainfall in the Study1984 - - - - 4,147 - - 4,1471985 - - - - - - - -1986 - - - - - - - -1987 - - - - - - - -1988 - - - - - - - -1989 - - - - - - - -1990 - - 3,594 - - - - 3,5941991 - - - - - - 2,479 2,4791992 - - 4,684 - - - - 4,6841993 - - 3,578 - - - - 3,578
Ave - - 3,952 - 4,147 - 2,479 3,696
Num 0 0 3 0 1 0 1 5
Change - - 2.3% - 0.8% - -1.3% 0.6%
BasinMean
RainfallYear

Final Report (Supporting_MP) Part 7 Preliminary Hydrological Evaluation Results
JICA Project for the Master Plan Study of 7-60 August, 2011 Hydropower Development in Indonesia
Table 54 Basin Mean Rainfall of Key Stream Gauge and Collected Rainfall Records (6/8)
No: 34 River Basin: K. BrantasStation Name: Kaulon River: K. BrantasStation ID by HPPS2: 02-057-01-08 Catchment Area (km2): 2,620
Basin Mean Rainfall in HPPS2 Unit:mm
Rainfall Station
Semen(153)
Wlingi(164)
Batu(7)
Singosari(51)
Doko(165)
Dampit(28)
Kepanjen(39)
1951 - 2,018 1,282 1,939 1,525 3,086 1,292 1,8571952 - 3,012 2,073 1,879 3,511 3,474 1,679 2,6051953 1,407 1,957 1,431 1,721 2,518 1,922 1,484 1,7771954 2,774 2,941 2,201 2,330 3,271 4,008 3,382 2,9871955 5,164 3,382 1,870 2,296 3,722 2,886 2,891 3,1731956 3,740 2,689 1,508 1,982 3,000 1,579 2,108 2,3721957 2,759 2,076 1,790 2,293 2,243 1,586 2,132 2,1261958 3,477 2,215 1,921 2,263 2,478 1,939 2,335 2,3751959 2,737 2,881 1,922 2,237 2,727 1,663 2,686 2,4081960 3,287 2,103 1,955 2,681 2,561 1,769 2,166 2,3601961 1,819 2,234 1,215 1,938 2,277 1,478 1,652 1,8021962 1,670 2,540 2,455 2,653 2,856 1,907 2,364 2,3491963 1,791 1,566 1,397 - 1,899 1,341 1,521 1,5861964 - 2,558 1,845 1,295 2,632 2,122 2,096 2,0911965 1,159 2,322 1,243 - 1,958 1,415 1,333 1,5721966 1,526 3,107 1,983 - 3,042 2,085 - 2,3491967 1,978 2,001 1,717 1,639 1,959 1,651 - 1,8241968 2,992 3,074 2,145 2,146 3,815 3,065 1,909 2,7351969 2,269 1,976 1,768 1,674 2,461 1,456 1,554 1,8801970 2,266 2,315 1,702 1,607 2,816 2,118 - 2,1371971 2,858 - 2,336 2,128 2,717 2,425 - 2,493
Ave 2,537 2,448 1,798 2,039 2,666 2,142 2,034 2,231
Num 18 20 21 18 21 21 17 21
Collected Rainfall in the Study1972 1,463 1,503 1,260 1,127 - - - 1,3381973 3,149 3,015 2,379 2,112 3,668 - 2,860 2,8641974 1,848 2,622 2,246 2,369 2,893 - 2,289 2,3781975 4,154 3,229 2,444 2,970 3,378 - 3,017 3,1991976 2,532 1,803 1,515 - - - 1,572 1,8561977 1,728 1,909 1,358 - - - - 1,6651978 3,609 3,460 1,814 2,474 3,446 - 2,771 2,9291979 3,271 2,384 - 1,839 2,621 - 2,032 2,4291980 - - - - - - - -1981 - - - 1,768 - - - 1,7681982 - - - - - - 1,293 1,2931983 - 2,446 - - - - - 2,4461984 - - - - - - - -1985 - - - - - - - -1986 - - - - 3,254 - - 3,2541987 - - - - - - - -1988 3,519 - 1,269 - 2,682 - - 2,490
Ave 2,808 2,486 1,786 2,094 3,135 - 2,262 2,301
Num 9 9 8 7 7 0 7 13
Change 3.6% 0.5% -0.2% 0.8% 4.4% - 3.3% 2.0%
Basin MeanRainfall
Year

Final Report (Supporting_MP) Part 7 Preliminary Hydrological Evaluation Results
JICA Project for the Master Plan Study of 7-61 August, 2011 Hydropower Development in Indonesia
Table 55 Basin Mean Rainfall of Key Stream Gauge and Collected Rainfall Records (7/8)
No: 42 River Basin: Wai IsalStation Name: PLTA Isal-2 damsite River: Wai IsalStation ID by HPPS2: - Catchment Area (km2): 242
Basin Mean Rainfall in HPPS2 Unit:mm
Rainfall Station
Manusela(485A) Wahai(486) Riring(487C)1930 - - 2,983 2,9831931 3,717 3,762 3,678 3,7191932 2,172 1,770 3,106 2,3491933 2,851 2,208 3,688 2,9161934 3,321 1,926 3,753 3,0001935 2,512 2,722 3,617 2,9501936 3,376 2,203 3,359 2,9791937 3,606 2,779 4,021 3,4691938 2,588 2,967 3,422 2,9921939 2,262 1,916 3,221 2,466
Ave 2,934 2,473 3,485 2,982
Num 9 9 10 10
Collected Rainfall in the Study1940 - 1,760 - 1,7601941 - 903 - 9031942 - - - -1943 - - - -1944 - - - -1945 - - - -1946 - - - -1947 - - - -1948 - - - -1949 - - - -1950 - - - -1951 - - - -1952 - - - -1953 - - - -1954 - 2,132 - 2,1321955 2,319 1,962 - 2,1411956 - 2,239 - 2,2391957 - 1,839 - 1,8391958 - 2,412 - 2,4121959 - 2,021 - 2,0211960 - 1,922 - 1,9221961 - 1,671 - 1,6711962 - - - -1963 - - - -1964 - - - -1965 - - - -1966 - 2,278 - 2,2781967 - 1,595 - 1,5951968 - 1,298 - 1,2981969 - 2,519 - 2,5191970 - 2,234 - 2,2341971 - 2,151 - 2,1511972 - 1,569 - 1,5691973 - 3,151 - 3,1511974 - 1,903 - 1,9031975 - 2,419 - 2,4191976 - 1,449 - 1,4491977 - 2,132 - 2,1321978 - 3,009 - 3,0091979 - 1,693 - 1,6931980 - 1,902 - 1,9021981 - 1,975 - 1,9751982 - 878 - 8781983 - 3,671 - 3,6711984 - 2,798 - 2,7981985 - 4,298 - 4,2981986 - 5,900 - 5,9001987 - 4,533 - 4,5331988 - - - -1989 - - - -1990 - - 1,493 1,4931991 - - - -1992 - - - -1993 - - - -1994 - - 1,939 1,939
Ave 2,319 2,319 1,716 2,289
Num 1 32 2 34
Change -2.1% -4.8% -8.5% -5.1%
Basin MeanRainfall
Year

Final Report (Supporting_MP) Part 7 Preliminary Hydrological Evaluation Results
JICA Project for the Master Plan Study of 7-62 August, 2011 Hydropower Development in Indonesia
Table 56 Basin Mean Rainfall of Key Stream Gauge and Collected Rainfall Records (8/8)
No: 43 River Basin: Ira SiquiroStation Name: PLTA Ira Lalaro damsite River: Ira SiquiroStation ID by HPPS2: - Catchment Area (km2): 406
Basin Mean Rainfall in HPPS2 Unit:mm
Rainfall Station
Tutuala(680C) Los Palos(680B)1953 - 1,647 1,6471954 - 2,249 2,2491955 - 3,622 3,6221956 - 2,403 2,4031957 1,442 1,444 1,4431958 1,483 1,896 1,6901959 1,580 1,901 1,7411960 1,804 2,062 1,9331961 1,382 1,333 1,3581962 2,414 2,697 2,5561963 1,083 1,312 1,1981964 1,860 2,074 1,9671965 1,073 1,374 1,2241966 1,502 1,564 1,5331967 1,401 1,486 1,4441968 1,850 2,598 2,2241969 1,185 1,478 1,3321970 1,828 2,027 1,9281971 1,324 1,588 1,4561972 1,105 1,711 1,4081973 1,991 2,184 2,088
Ave 1,547 1,936 1,830
Num 17 21 21
Collected Rainfall in the Study1974 1,295 1,653 1,4741975 - - -1976 - - -1977 - - -1978 - - -1979 - - -1980 - - -1981 - - -1982 - 1,112 1,1121983 - 2,425 2,4251984 - 2,297 2,2971985 - 1,729 1,7291986 - 2,071 2,0711987 - 1,387 1,3871988 - 1,903 1,903
Ave 1,295 1,822 1,800
Num 1 8 8
Change -0.9% -1.6% -1.3%
Basin Mean RainfallYear

Final Report (Supporting_MP) Part 7 Preliminary Hydrological Evaluation Results
JICA Project for the Master Plan Study of 7-63 August, 2011 Hydropower Development in Indonesia
Table 57 Calculated Annual Mean Runoff at Key Stream Gauges
Runoff Rainfall
Region No. Station NameRunoff(m3/s)
Rate of Change(%)
Rate of Change(%)
Runoff(m3/s)
Sumatra 1 Lhok Nibong 175.7 4.7% - 183.92 Stabat 201.7 -1.6% - 198.53 Lb. Sipelanduk 28.4 - - 28.44 Lb. Bendahara 141.5 -3.2% - 137.05 Tj. Ampalu 77.6 -5.6% - 73.26 Sungai Dareh 310.2 -5.1% - 294.57 Muara Inum 107.6 - - 107.68 Martapura 225.0 -1.4% - 221.99 Banjarmasin 36.8 1.9% - 37.510 Kunyir 23.1 -3.3% - 22.311 Kp. Darang 33.1 -0.9% - 32.812 Tui Kareng 183.9 3.4% - 190.113 Hp. Baru 128.9 -6.0% - 121.314 Air Batu 31.3 7.7% - 33.715 Air Gadang 121.3 -3.5% - 117.116 Despetah 45.2 - - 45.2
Kalimantan 17 Silat damsite 73.7 - - 73.718 Kelai-2 damsite 293.6 - - 293.619 Sei Langsat 60.3 - 2.6% 61.820 Panaan 45.6 -6.6% - 42.6
Sulawesi 21 Tulabolo 60.6 - - 60.622 Tincep 3.2 - -3.5% 3.123 Palili 21.2 - 2.2% 21.624 Gillirang 8.2 8.7% - 8.925 Bila 15.7 4.1% - 16.426 Likupande 15.5 -10.8% - 13.927 Bakaru 69.1 - - 69.1
Jawa 28 Kebon Randu 29.6 - - 29.629 Cibuni-3 damsite 78.0 - 0.6% 78.530 Rangkasbitung 94.3 -6.5% - 88.131 Leuwi Goong 30.0 0.2% - 30.032 Krangan-2 17.0 -8.8% - 15.533 Banyumas 241.3 -8.4% - 220.934 Kaulon 102.5 - 2.0% 104.635 Wonorejo 16.9 1.8% - 17.2
Irian Jaya 36 PLTM Werba 4.4 - - 4.437 PLTA Warsamson 63.6 - - 63.638 PLTA Genyem 16.4 - - 16.4
Bali 39 Buangga 9.8 - - 9.8Lombok 40 Santong 1.5 3.8% - 1.6Halmahera 41 PLTM Ira 4.1 - - 4.1Seram 42 PLTA Isal-2 16.6 - -5.1% 15.8Timor 43 PLTA Ira Lalaro 9.5 - -1.3% 9.3
Weighted AnnualMean Runoff
Result of AnalysisSupplementedAnnual
Mean Runoff inHPPS2

Final Report (Supporting_MP) Part 7 Preliminary Hydrological Evaluation Results
JICA Project for the Master Plan Study of 7-64 August, 2011 Hydropower Development in Indonesia
Daily Runoff Records
1980
1981
1982
1983
1984
1985
1986
1987
1988
1989
1990
1991
1992
1993
1994
1995
1996
1997
1998
1999
2000
1 Despetah 01-074-17 01-074-01-02
2 Lesan Dayak 03-010-01
3 Long Lanuk 03-010-02
4 Tincep 04-127-01 04-127-01-01
5 Palili 04-112-01 04-112-02-02
6 Tombo-Bakaru 04-093-03
7 Tanggeung 02-103-04
8 Pamadangan 02-103-01
9 Malanu 05-034-05
10 Buangga 07-016-01 07-022-01-01
11 Igabola 08-003-02
12 Lele Sirata 14-005-01
Source: PLN-LITBANG
Daily Water Level Records
1980
1981
1982
1983
1984
1985
1986
1987
1988
1989
1990
1991
1992
1993
1994
1995
1996
1997
1998
1999
2000
1 Despetah 01-074-17 01-074-01-02
2 Lesan Dayak 03-010-01
3 Long Lanuk 03-010-02
4 Tincep 04-127-01 04-127-01-01
5 Palili 04-112-01 04-112-02-02
6 Tombo-Bakaru 04-093-03
7 Tanggeung 02-103-04
8 Pamadangan 02-103-01
9 Malanu 05-034-05
10 Buangga 07-016-01 07-022-01-01
11 Igabola 08-003-02
12 Lele Sirata 14-005-01
Source: PLN-LITBANG
No. Station NamePLNID
HPPS2ID Remarks
RemarksHPPS2
ID
The observed water level of Despeta stationmay be influenced by the water level of PLTAMusi.
Station NamePLNIDNo.
Figure 1 Barchart of Collected Daily Runoff and Water Level Records from PLN-LITBANG
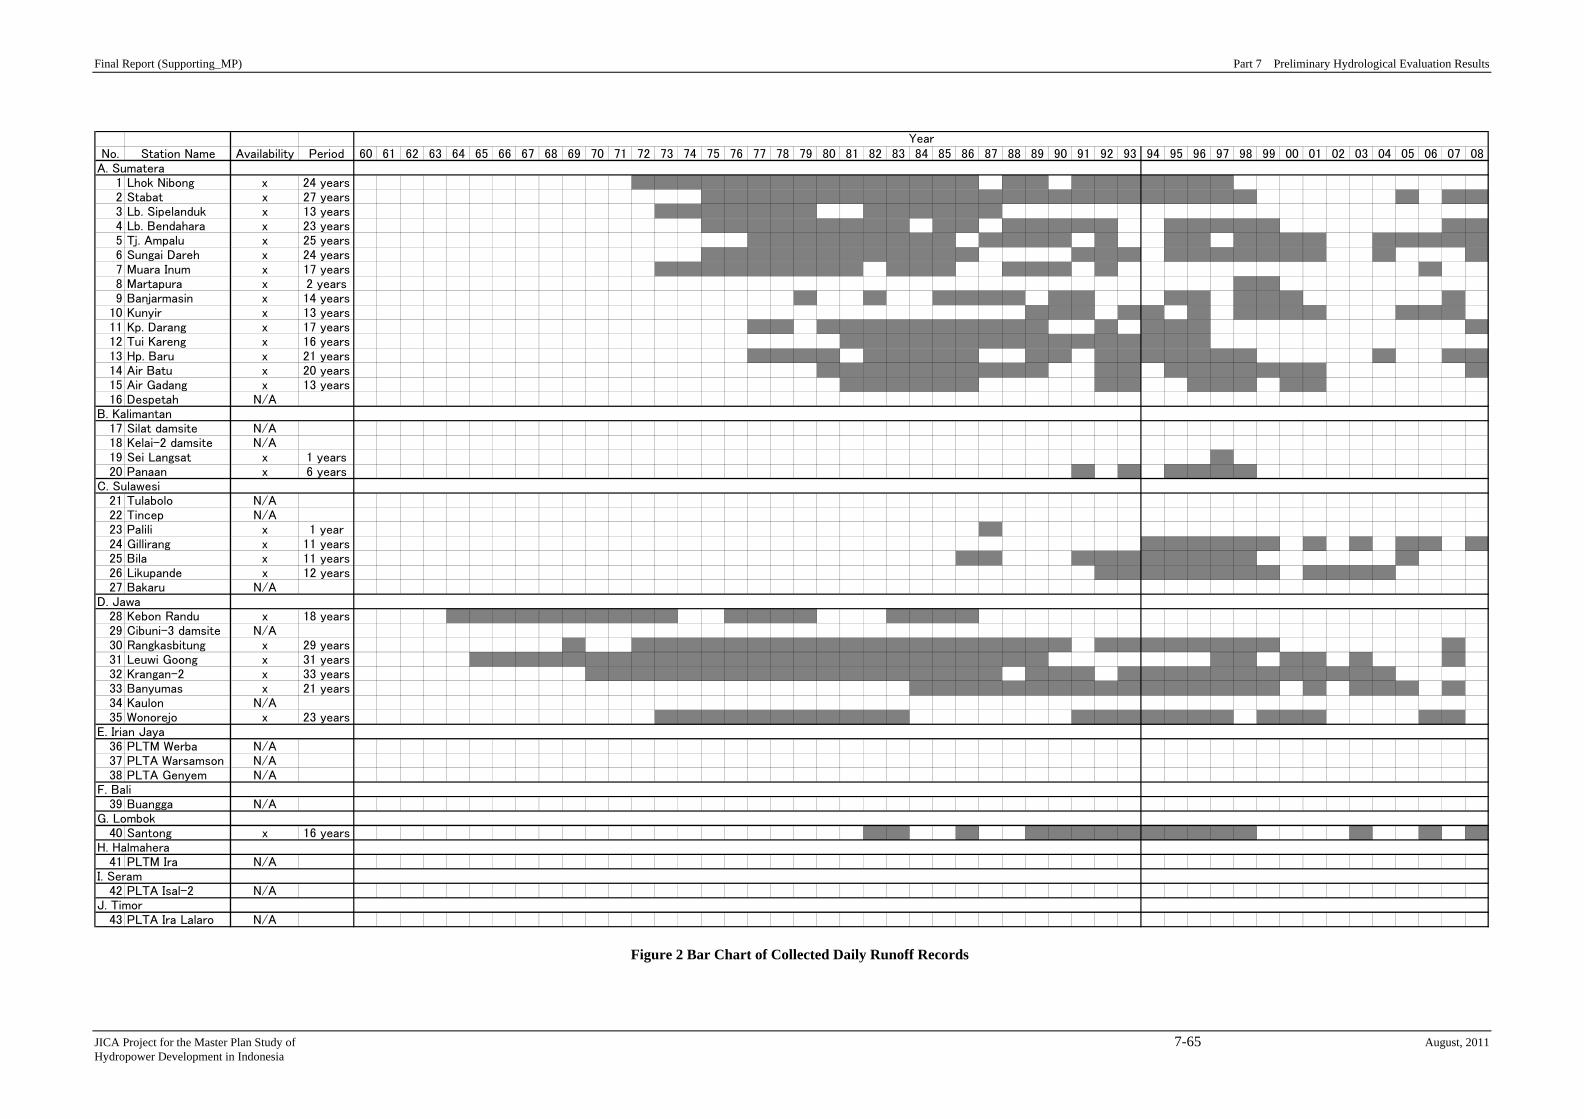
Final Report (Supporting_MP) Part 7 Preliminary Hydrological Evaluation Results
JICA Project for the Master Plan Study of 7-65 August, 2011 Hydropower Development in Indonesia
No. Station Name Availability Period 60 61 62 63 64 65 66 67 68 69 70 71 72 73 74 75 76 77 78 79 80 81 82 83 84 85 86 87 88 89 90 91 92 93 94 95 96 97 98 99 00 01 02 03 04 05 06 07 08A. Sumatera
1 Lhok Nibong x 24 years2 Stabat x 27 years3 Lb. Sipelanduk x 13 years4 Lb. Bendahara x 23 years5 Tj. Ampalu x 25 years6 Sungai Dareh x 24 years7 Muara Inum x 17 years8 Martapura x 2 years9 Banjarmasin x 14 years
10 Kunyir x 13 years11 Kp. Darang x 17 years12 Tui Kareng x 16 years13 Hp. Baru x 21 years14 Air Batu x 20 years15 Air Gadang x 13 years16 Despetah N/A
B. Kalimantan17 Silat damsite N/A18 Kelai-2 damsite N/A19 Sei Langsat x 1 years20 Panaan x 6 years
C. Sulawesi21 Tulabolo N/A22 Tincep N/A23 Palili x 1 year24 Gillirang x 11 years25 Bila x 11 years26 Likupande x 12 years27 Bakaru N/A
D. Jawa28 Kebon Randu x 18 years29 Cibuni-3 damsite N/A30 Rangkasbitung x 29 years31 Leuwi Goong x 31 years32 Krangan-2 x 33 years33 Banyumas x 21 years34 Kaulon N/A35 Wonorejo x 23 years
E. Irian Jaya36 PLTM Werba N/A37 PLTA Warsamson N/A38 PLTA Genyem N/A
F. Bali39 Buangga N/A
G. Lombok40 Santong x 16 years
H. Halmahera41 PLTM Ira N/A
I. Seram42 PLTA Isal-2 N/A
J. Timor43 PLTA Ira Lalaro N/A
Year
Figure 2 Bar Chart of Collected Daily Runoff Records

Part 8 Detailed Record of the Field Observation on Social and Natural Environment

Final Report (Supporting_MP) Part 8 Detailed Record of Field Observation
JICA Project for the Master Plan Study of 8-1 August, 2011 Hydropower Development in Indonesia
PART 8 DETAILED RECORD OF THE FIELD OBSERVATION ON SOCIAL AND NATURAL ENVIRONMENT
1 PROJECT SITE: GUMANTI-1 (W. SUMATRA) <Intake> • No residential houses were found at the intake site. • Substantial water use at Gumanti river was not observed. • Topography at the site is considered as stable. <Power House> • There will be no involuntary resettlement. • Substantial water use was not observed. • Topography at the site is considered as stable.
<General Comment> • Paddy field was confirmed entirely at the project site. • Irrigation water for paddy field was taken from a mountain stream. • The length of water recession section is approximately 3.2km. • Although it was confirmed through interview to local residents that river was not used for
irrigation, some local residents used it for their toilet. • Land and water use at the water recession section is necessary to be confirmed. • Existing road will be used for access road though its expansion will be necessary. • Although residential houses were not confirmed at the proposed site of intake and power
house, there were some houses in the project area. There is a risk for such houses to be relocated involuntary due to access road construction or expansion.
• Due consideration of access road planning is necessary for minimizing negative impact.
Intake Site
Downstream of PH Site

Final Report (Supporting_MP) Part 8 Detailed Record of Field Observation
JICA Project for the Master Plan Study of 8-2 August, 2011 Hydropower Development in Indonesia
2 PROJECT SITE: ANAI-1 (W. SUMATRA) <Intake> • No residential houses were observed. • No cultivation area was observed. • It was found that Anai river at the intake site was not used for irrigation or drinking. • The site has stable topographical condition.
<Power House> • No residential houses were observed. • No cultivated area was confirmed. • It was found that Anai river at the power house site was not used for irrigation or drinking.
<General Comment> • The project site is located in the protected forest (Hutan Lindung) according to the relevant
parties. • Confirmation of official procedure for alternation of the forest category for implementing the
proposed project is necessary. • There is a water fall which is tourism spot called “Air Mantur” in the water recession section. • There is a possibility of land acquisition for access road construction. • There were about 40 small shops in the project area especially around “Air Mantur”. • There is a few local people who use Anai river for washing. • Anai river is used for irrigation at 3km downstream of power house site. • The length of water recession section is approximately 5 km
Intake site
PH site

Final Report (Supporting_MP) Part 8 Detailed Record of Field Observation
JICA Project for the Master Plan Study of 8-3 August, 2011 Hydropower Development in Indonesia
3 PROJECT SITE: ENDIKAT-2 (S. SUMATRA) <Intake> • No residential houses were observed. • No water use in Endikat river was observed through interview to local residents. • The protected forest was said to be located close to the intake site. • Topographical condition is stable.
<Power House> • No residential houses were observed. • Topographical condition is stable. • No water use in Endikat river was observed though interview to local residents.
<General Comment> • The project site was covered with secondary forest, and some of parts were used for coffee
plantation. • The length of water recession section is approximately 5km, and land and water use at this section
is necessary to be confirmed. • Location of the protected forest is necessary to be confirmed.
Intake Site
PH Site

Final Report (Supporting_MP) Part 8 Detailed Record of Field Observation
JICA Project for the Master Plan Study of 8-4 August, 2011 Hydropower Development in Indonesia
4 PROJECT SITE: CIBARENO (W. JAVA) <Intake> • No residential houses were observed. • Secondary forest was observed. • Paddy field was not observed. • Topography and soil condition was stable with rocky, deep, v-shaped valley. <Power House> • No residential houses were observed. • Secondary forest was observed. • Paddy field was confirmed. • Topography and soil condition is stable with rocky, deep, v-shaped valley.
<General> • Cibareno river is used for irrigation and washing according to local residents. • The length of water recession section is approximately 3.7km, and land and water use is
necessary to be confirmed. • Existing road will be used as the access road for the construction site though some arrangement
such as expansion will be required.
IntakeWeir site
Cibareno river
Surge tank Powerhouse

Final Report (Supporting_MP) Part 8 Detailed Record of Field Observation
JICA Project for the Master Plan Study of 8-5 August, 2011 Hydropower Development in Indonesia
5 PROJECT SITE: SIRAHAR (N. SUMATRA) <Intake> • No residential houses were confirmed. • Sirahar river was used for irrigation, drinking, and washing according to local residence. • The land at the proposed project site was covered with secondary forest, and part of it was used as
rubber plantation for export. • Topography and soil condition is stable with rocky, deep, and v-shaped valley. <Power House> • No residential houses were confirmed. • Sirahar river was observed to be used for irrigation, drinking, and washing according to local
residence. • There is no inland fisherman. • Topography and soil condition is stable with rocky, deep, v-shaped valley. • A protected forest is said to be located at the downstream of power house area. <General Comment> • The length of water recession section is approximately 3.5km. • Land and water use of the water recession section is necessary to be confirmed.
Site condition at 100m upstream from the intake area

Final Report (Supporting_MP) Part 8 Detailed Record of Field Observation
JICA Project for the Master Plan Study of 8-6 August, 2011 Hydropower Development in Indonesia
6 PROJECT SITE: GUNUNG-2 (N. SUMATRA) <Intake> • No residential houses were identified. • No cultivation areas around the site were found. • Any other facilities at upstream and downstream of the river were found. • The intake was located in the very steep valley. • Rock was exposed along the river, therefore geologically very stable • Secondary forests were observed around the site. • The existing local road could be used for construction road, so the impact on the forest due to
felling will be minimum.
<Power House> • No residential houses were identified. • According to interview to the local people, there are irrigation scheme for the cultivation. The
water intake from the river for the irrigation was not identified. • There are cultivation areas for banana, Cacao, corn and sugarcane etc. at the opposite of the PS
site. • The topographical characteristic is considered as suitable for the construction of the Power house. • Nothing serious problems about soil were found. • Secondary forests were observed around the site.
<General Comments> • The length of the section of water recession is approximately 2.8km. • There is no cultivation area around the intake point due to the topographical reason. However,
cultivation areas including paddy field might be found along the middle or downstream of the river.
• The present status of the land use at the section of the water recession should be confirmed.
Intake site
PH point

Final Report (Supporting_MP) Part 8 Detailed Record of Field Observation
JICA Project for the Master Plan Study of 8-7 August, 2011 Hydropower Development in Indonesia
7 PROJECT SITE: SIMMANGO-1(N. SUMATRA) • ROR power plant is already under construction by IPP scheme. • The location of the power house is approximate 500m downstream from the intake
(The intake for the IPP)
(PH under construction)
8 PROJECT SITE: SIMMANGO-2 (N. SUMATRA) <Intake> • No residential houses were identified. • No cultivation area around the intake point. • Secondary forests were observed around the site. • Rock was exposed along the river, therefore geologically very stable. <Power House> • There are five houses and small scale paddy land at the opposite site of the PH site. But relocation
will not be necessary. • The access road to the PS site from the existing road will be necessary. However the road has no
impact to those houses. <General Comments> • The length of the section of water recession is approximately 7.8km. • There are narrow path to the intake point along the river. • Small scale cultivation areas and grazing land were found at left side of the path.
Power house

Final Report (Supporting_MP) Part 8 Detailed Record of Field Observation
JICA Project for the Master Plan Study of 8-8 August, 2011 Hydropower Development in Indonesia
(View of the intake point from 1km downstream)
(View of the PH site from the existing road)
9 PROJECT SITE: CIMANDIRI-1 (W.JAVA) <Intake> • Secondary forest and paddies were observed around the intake point. • Cassava, banana etc. were cultivated at agricultural land. • No residential houses were identified. • Well maintained irrigation systems were observed. • Some paddies will be under water after completion of the intake. • Sedimentation was concerned because the river water was muddy.
<Weir point> • The weir is planned at the junction of the main stream and tributary. • The weir is located at the border of the village of “Ci Cadas” and “Ci TalHab”. • Irrigation bridge was observed at the upstream of the weir point. • Secondary forest and paddies were found around the point • Some paddies along the river will be under water after completion of the weir construction. • No residential houses were identified.
Intake point
PH site