part d short-range projections · • low-income premium subsidy (lips) • coverage gap discount...
TRANSCRIPT

Part D Short-Range Projections

Standard Benefit Structure
• Deductible• Initial coverage limit• Coverage gap (to be closed by 2020)• Catastrophic threshold (reinsurance)
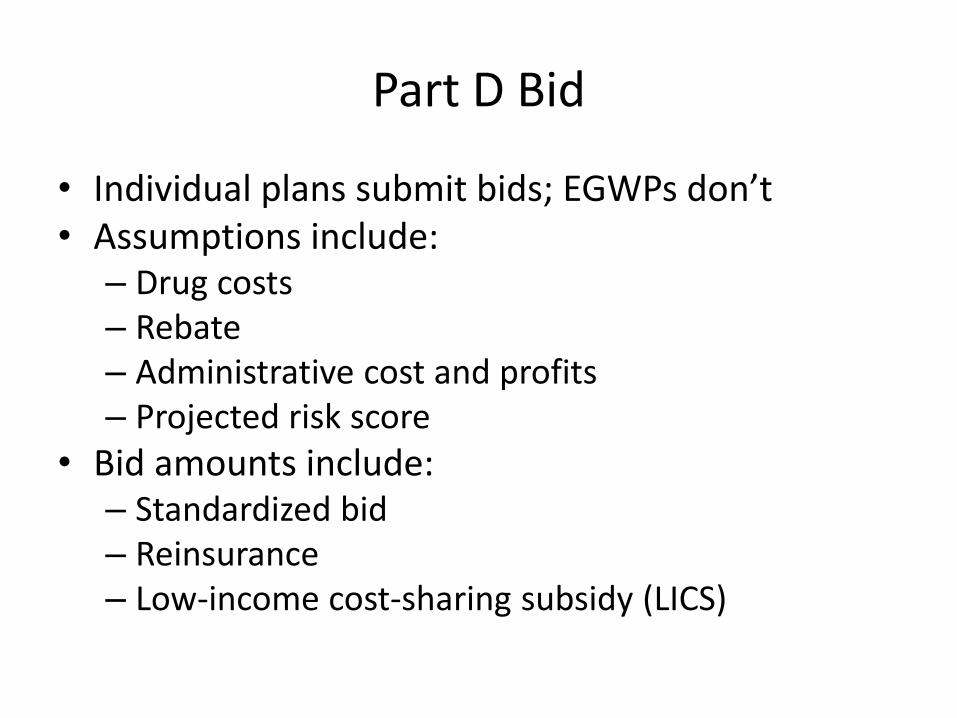
Part D Bid
• Individual plans submit bids; EGWPs don’t• Assumptions include:
– Drug costs– Rebate– Administrative cost and profits– Projected risk score
• Bid amounts include:– Standardized bid– Reinsurance– Low-income cost-sharing subsidy (LICS)

Part D Bid (cont.)
• Bid = Plan benefits – Reinsurance• National average bid and average premium
announced after bids are reviewed• Plan specific premium =
Plan bid- national average bid+ national average premium
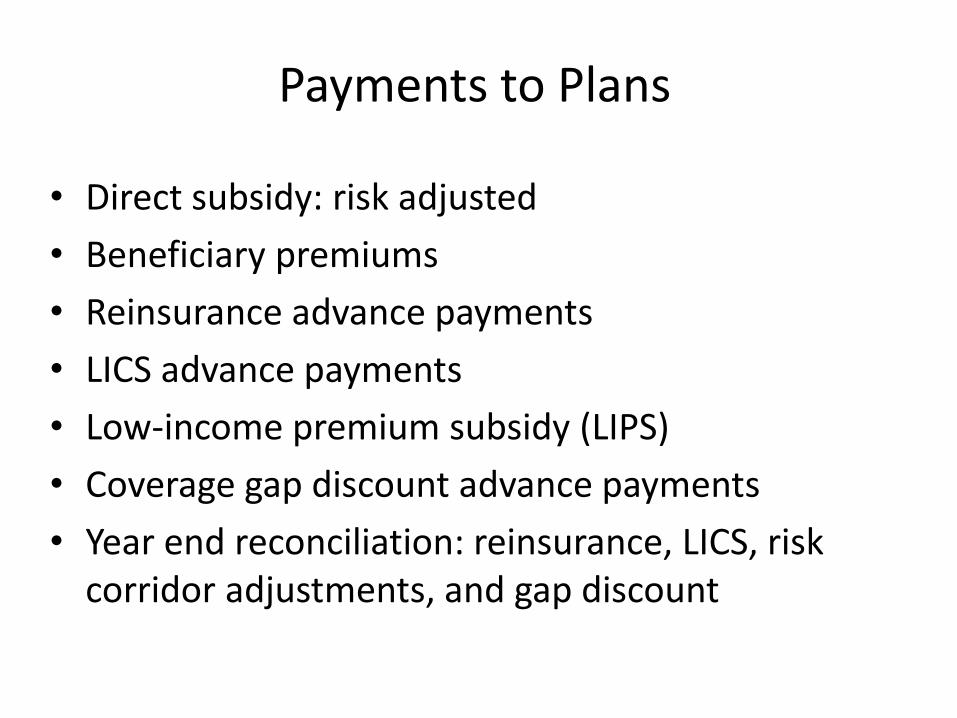
Payments to Plans
• Direct subsidy: risk adjusted• Beneficiary premiums• Reinsurance advance payments• LICS advance payments• Low-income premium subsidy (LIPS)• Coverage gap discount advance payments• Year end reconciliation: reinsurance, LICS, risk
corridor adjustments, and gap discount
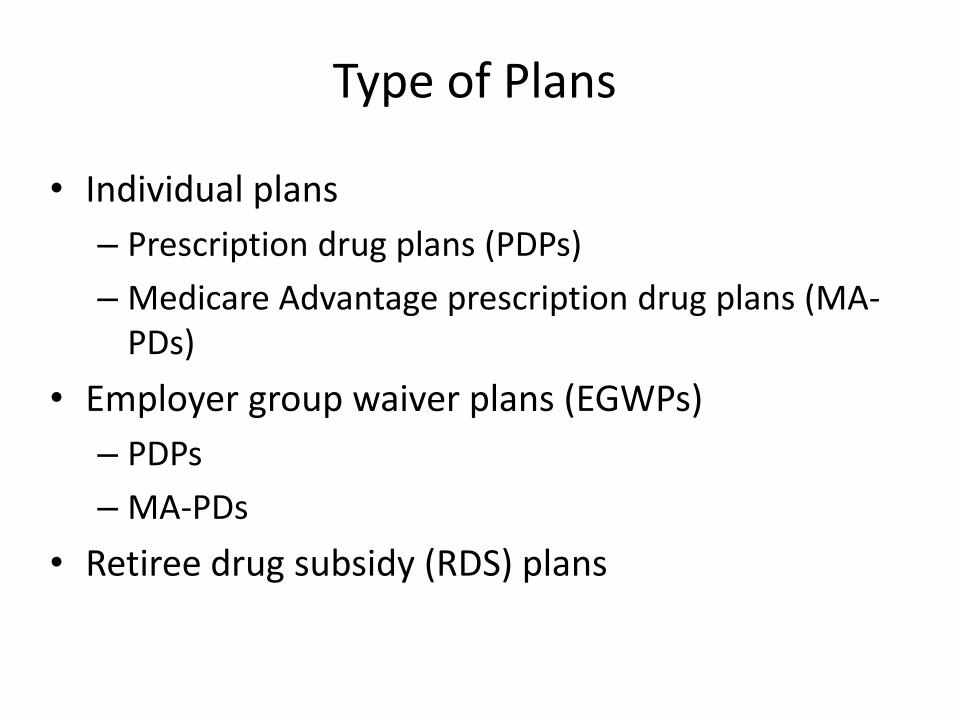
Type of Plans
• Individual plans– Prescription drug plans (PDPs)– Medicare Advantage prescription drug plans (MA-
PDs)• Employer group waiver plans (EGWPs)
– PDPs– MA-PDs
• Retiree drug subsidy (RDS) plans

Retiree Drug Subsidy Plans
• 28% subsidy between $360 and $7,400 in 2016• Tax exempt through 2012• No coverage gap discount• 6.6 million enrollees in 2010; 1.9 million enrollees
in 2016

D Benefits Model Methodology
• Historical spending data• Enrollment• Drug per capita trend• Bid data• Legislative impact

Enrollment
• Part D plans–MAPD vs. PDP– Aged vs. Disabled– Employer vs. non-employer– Four low-income groups
• RDS plans

Part D Enrollment
Total D
Others
LIS
EGWP
RDS
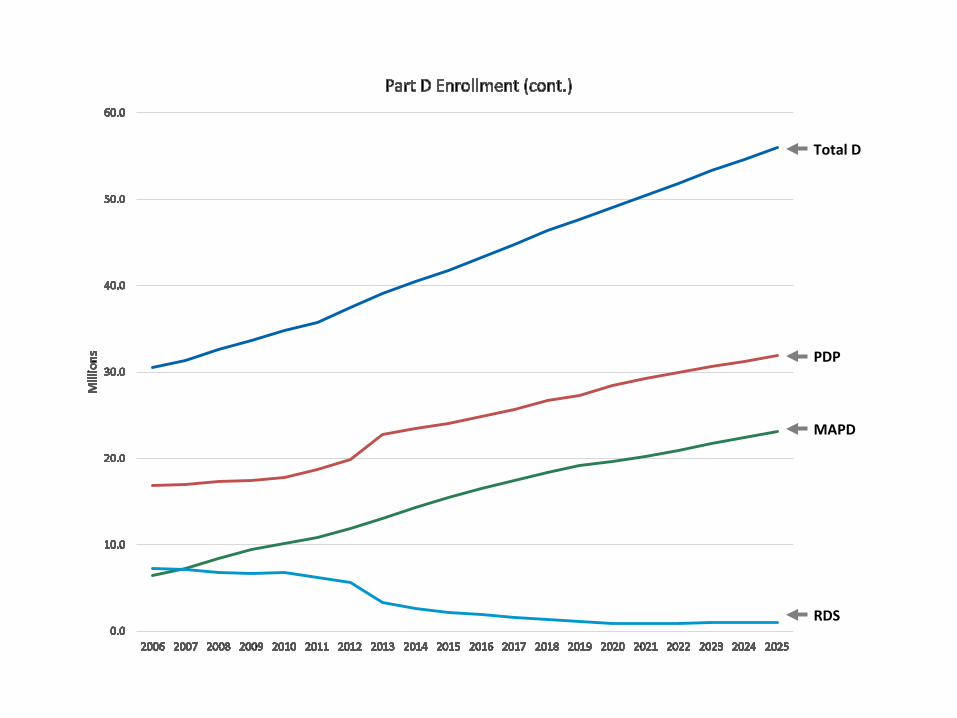
Part D Enrollment (continued)
Total D
RDS
MAPD
PDP

Part D Trend
• The 2011 Technical Panel recommended that OACT should explore the potential for bottom-up models of both the NHE drug component and Part D to improve forecasts in the short run (3 years).
• The Panel also recommended that OACT should explore ways to build Part D experience into the intermediate range (4+ years) forecast .
• A new “micro” model was developed and put to use in TR2015.

Part D Micro Model
• Uses the PDE data• Uses drug-specific and therapeutic-class-specific
utilization and price data• Projects the growth trend for each drug• Considers the dynamics between brand-name
and generic drug competition w.r.t. the patent expiration
• Incorporates any known market information for a specific drug

Part D Trend (cont.)
• Short-run trend is transitioned to NHE projections from years 4 to 6.
• Due to enrollment mix change and legislation, the final trend assumptions used in Part D projection could be slightly different, as illustrated in years 2021-2025 in the following chart.
• A new policy will carve out certain ESRD drugs to Part B in 2025 and cause a drop in Part D trend.
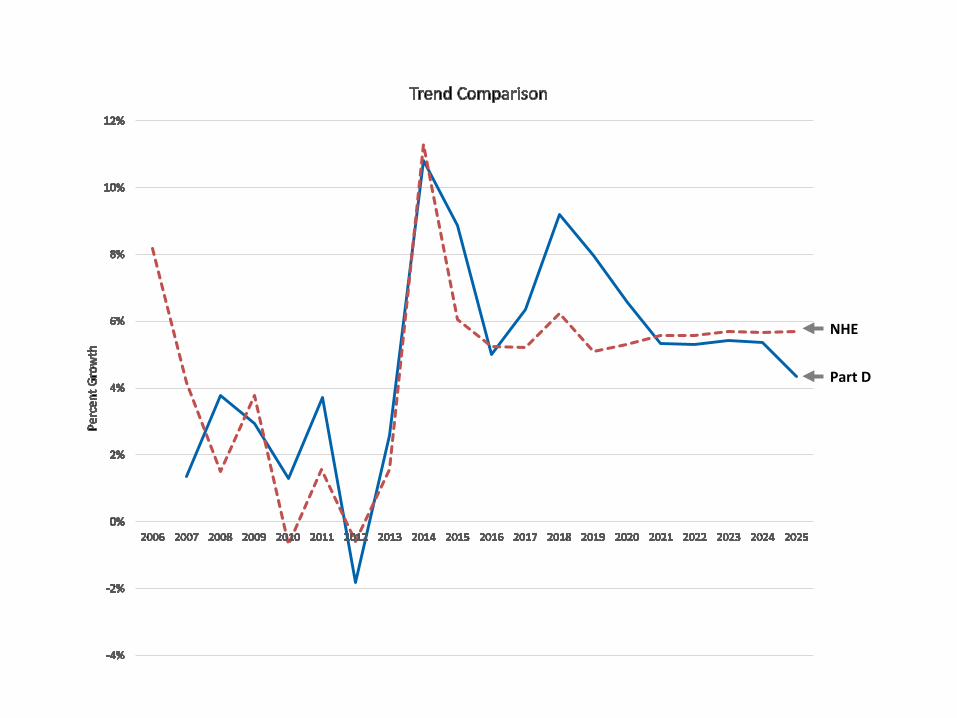
Trend Comparison
NHE
Part D

Per Capita Cost by Plan Type
PDP
MAPD
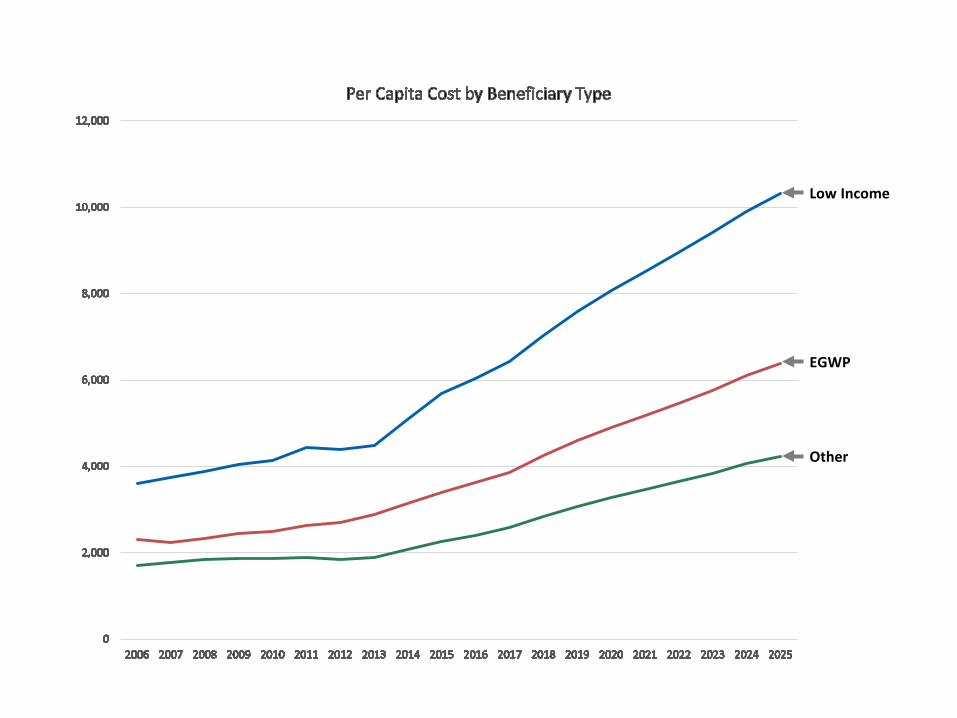
Per Capita Cost by Beneficiary Type
Low Income
EGWP
Other

Share of Catastrophic Spending
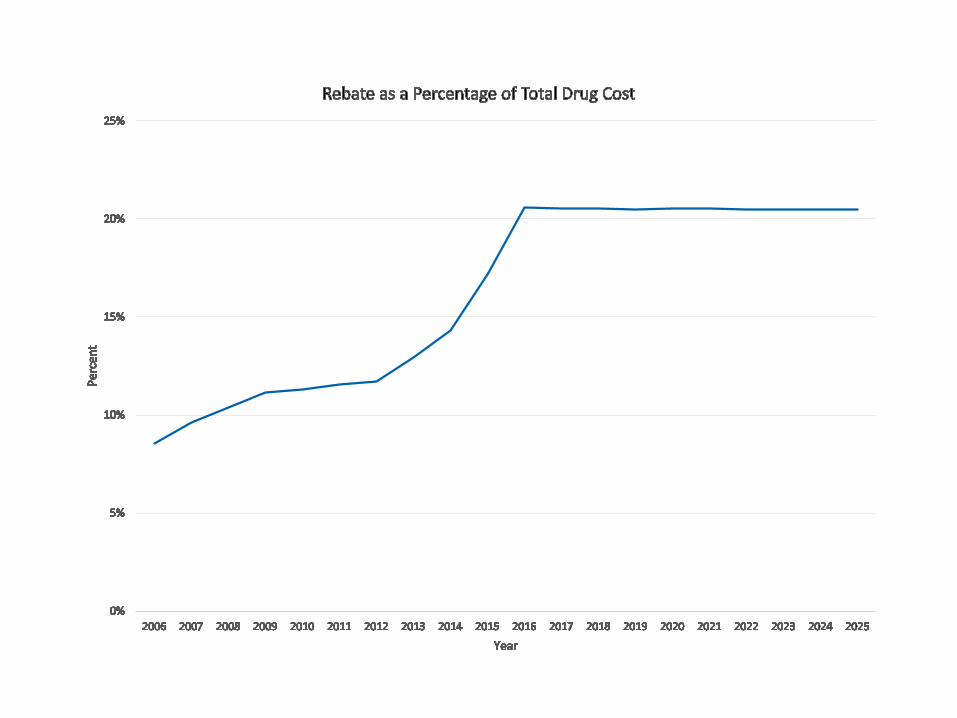
Rebate as a Percentage of Total Drug Cost