part i: analysis of the economics of waste-to-energy plants in china
TRANSCRIPT

PART I: ANALYSIS OF THE ECONOMICS OF WASTE-TO-ENERGY PLANTS IN CHINA
PART II: MSW SORTING MODELS IN CHINA AND POTENTIAL FOR IMPROVEMENT
Ling Qiu
Advisor: Prof. Nickolas J. Themelis
Submitted in partial fulfillment of the requirements for M.S. degree in Earth
Resources Engineering
Department of Earth and Environmental Engineering
Columbia University
December 2012
Research sponsored by the
Earth Engineering Center
Columbia University

1
Executive Summary
Part I: Analysis of the Economics of Waste-to-Energy Plants in China
In a period of less than twenty years, China has become a major actor in the implementation of
waste-to-energy technologies for managing municipal solid wastes (MSW); at the present time,
an estimated 15% (23 million tons of MSW) are processed in over 100 WTE plants. China is also
an exception to the general rule that nations with relatively low GDP per capita rely exclusively
on landfilling. The objective of the first part of this thesis was to examine the technical, policy,
and economic factors that have contributed to this rapid expansion of WTE capacity in China
and the business models used. The study concentrated on large cities in China, in particular
Shanghai, Beijing, and Guangzhou.
Despite the booming WTE market, landfilling is still the main method of waste management in
Chinese cities. The landfilling rates of post-recycling MSW in Shanghai, Beijing, and Guangzhou
are 75%, 85%, and 79%. An appreciable fraction goes to non-regulated waste dumps, which is
called “non-harmless treatment”. The current system has several problems such as low
recycling efficiency, lack of landfill space, and related environmental problems. The cost for
waste transportation and processing in modern sanitary landfills is high. Therefore, WTE
capacity should be increased since it is an effective and, in the long-term, economical solution
to the current waste crisis.
On the technical level, Chinese cities are adept to using modern WTE. Imported moving grate
technology dominates the domestic WTE market. The most popular air pollution control (APC)
system is the combination of semi-dry scrubber, activated carbon injection, and baghouse filter.
NOx control equipment is used in some facilities. According to the field study in Shanghai and
other major cities, the WTE plants have very low emissions of dioxins and mercury, far below
the EU 2010 standard. NOx emission is higher than the E.U. standard but still within the Chinese
National Standard. New national standards will come into effect in 2013 and will bring the
limitation for Cd, Pb, etc. to the same level as the E.U. standard.
The build-operate-transfer (BOT) ownership model is currently preferred for financing and
operating WTE plants in China. This model utilizes private investment, reduces government
capital investment and drives the privatization of the waste management industry. A series of
favorable policies are created to encourage the development of WTE in China. The most
representative is the “grid electricity pricing”, applying specifically to WTE power. A subsidy of
US$30 per MWh of electricity will be provided for plants generating less than 280 kWh/ton of
MSW.
2
In the course of this study, there was a critical analysis of past studies by the Earth Engineering
Center and the published literature. Also, several operating WTE plants were visited in Shanghai
in order to obtain first-hand data on their operation, economics and environmental
performance. Design and construction documents of several WTE projects in other Chinese
cities were also examined. On the basis of this information, actual local specifications and plant
design documents were reviewed to provide capital and operating costs for a hypothetical WTE
of 383,000-ton capacity.. A financial analysis was then carried out at different gate fee scenarios,
to test the profitability of the model plant. The results showed that a plant of this capacity built
in China requires an average capital investment of $74 million, i.e. $193 per ton of annual
capacity, and a gate fee of $20 per ton of MSW.
This study also showed that inadequate MSW sorting in China has impeded the development of
a sustainable waste management system that includes WTE. Therefore, Part II of the thesis
focused on the status of the current sorting practice in China and possible improvements.
Part II: MSW Soring Models in China and Potential for Improvement
MSW sorting (i.e., separating the garbage into recyclable, compostable, etc.) is the first step of
an integrated waste management system because it increases the recovery of materials and
energy from the solid waste stream. This part of the study was based on an analysis of the
Beijing and Guangzhou models and experience in developed countries on materials recovery
from MSW. In 2000, the central government launched a campaign for MSW recycling and
suggested multi-stage sorting that included some source separation by local residents and
neighborhood authorities, to be followed by secondary sorting at regional waste management
centers. The remainder of the MSW is disposed in landfills and waste to energy plants and
Informal recycling was to be included. Different cities have modified this model according to
their own situation. For example, Beijing eliminated household and neighborhood level sorting
and focused on sorting at regional waste management centers (i.e., materials recovery
facilities). The MSW is transported directly from curbside to these centers where the
recyclables are to be sorted out while the rest of the waste is disposed to landfills or WTE plants.
On the other hand, the Guangzhou model emphasized resident source separation and
neighborhood sorting; waste management companies are engaged to transport the sorted
materials to markets and the remainder of the wastes to landfills and waste-to-energy plants,
thus eliminating the regional waste management centers.
Both models are experiencing low public participation, lack of standardized practice, insufficient
economic incentives for participating companies, and poor working conditions for informal
recyclers. The statistical data showed that the sorting model of Guangzhou is superior in terms

3
of its potential to increase recycling and advance sustainable waste management. The results of
this study have shown that this potential can be attained by implementing the following
measures:
-There must be source separation of designated materials (.e.g., paper fiber, metals,
marketable types of plastics and glass, and hazardous wastes) at residences and businesses.
Public involvement should be encouraged by means of fully transparent policies, incentives,
and disincentives for non-compliance. Standard sorting equipment, such as bags, cans and bins
for storing designated recyclable and disposable wastes, must be provided by the municipality.
The city should ensure that the sorting practice is integrated with the market for recyclables, to
ensure that the sorted streams do not end up in landfills.
Non-governmental organizations (NGO) and academic institutions have a high public credibility
and should be engaged in the execution of the sorting system and serve as an information
channel between the public and the government. The objectives and mission of WTERT-China,
an academic-industry organization, was discussed briefly in this report. This organization can
help to advance sustainable waste management in China by means of its website, education
programs, and bringing together universities, industry, and government agencies concerned
with this major environmental issue.
4
ACKNOWLEDGEMENTS
First and foremost, I would like to thank my advisor Professor Nickolas Themelis for his utmost
guidance and support throughout my life in Columbia University. His invaluable expertise in the
field of waste-to-energy is an inexhaustible source of power for my study. I would also like to
thank Liliana Themelis for her warmth, kindness, and support throughout this study.
During the study of the thesis, I was enlightened by Brian Bahor (Covanta Energy) and David
Tooley (Wheelabrator Technologies), who kindly provided me with precious practical
knowledge of the industry.
I would also like to thank Professor Dezhen Chen and Professor Enke An of Tongji University,
Shanghai, China and Prof. Qunxing Huang of Zhejiang University, Hangzhou, China, for their
generous supports and sharing their precious experience in Chinese waste-to-energy industry.
Last, but certainly not least, I would like to give thanks to my dear parents, Ke Qiu and Pei
Zhang and the rest of my family in Shanghai, who wholeheartedly supported my life and study
in the U.S. Their trust and encouragements are always the supreme power in my life.
Ling Qiu, New York City, November 26, 2012

5
Table of Contents Part I: Analysis of the Economics of Waste-to-Energy Plants in China ..................................... 9
1. Introduction ............................................................................................................... 9
2. Waste Management in Chinese Cities .............................................................. 11
2.1 MSW Characterization ........................................................................................ 11
2.2 Waste Management Infrastructure .................................................................. 12
2.3 Post-recycling MSW Management Cost for City Government ..................... 15
2.3.1 Collection cost ................................................................................................... 15
2.3.2. Transportation cost ......................................................................................... 15
2.3.3 Landfilling gate fee ........................................................................................... 16
2.3.4 Landfilling processing cost .............................................................................. 16
3. WTE in Chinese Cities ............................................................................................ 16
3.1 WTE Technologies in Chinese Cities ................................................................ 16
3.2 Plant Emissions .......................................................................................................... 21
3.3 Features of WTE in Chinese Cities .................................................................... 23
3.3.1 Ownership Model ............................................................................................. 23
3.3.2 Strong Government Support ............................................................................ 26
3.3.3 High Social Cost ................................................................................................ 27
4. China WTE Project Economics ............................................................................ 28
4.1 Model Plant ........................................................................................................... 28
4.2 Capital Costs .......................................................................................................... 30
4.3 Operating Period Economic Output ................................................................. 33
4.3.1 MSW Processing Cost ....................................................................................... 33
4.3.2 Bank Loan Repayment ..................................................................................... 34
4.3.3 Total Operating Period Economic Output ...................................................... 35
4.4 Plant Revenues ..................................................................................................... 35
4.4.1 Electricity Sale .................................................................................................. 35
4.4.2 Gate Fee ............................................................................................................. 35
4.4.3 Value-added Tax Return .................................................................................. 37

6
5. Financial Analysis ................................................................................................... 37
5.1 Scenario I ................................................................................................................. 38
5.2 Scenario II ................................................................................................................ 41
6. Conclusions to Part I .............................................................................................. 44
Part II: MSW Sorting Models in China and Potential for Improvement .................................. 46
1. Introduction ............................................................................................................. 46
2. MSW Sorting Models of Beijing and Guangzhou ........................................... 47
2.1 MSW Composition from a Sorting Perspective .............................................. 47
2.2 MSW Sorting Model in Beijing and Guangzhou .............................................. 48
2.2.1 The Beijing MSW Sorting Model ...................................................................... 49
2.2.2 Guangzhou MSW Sorting Model ...................................................................... 53
3. Existing Problems ................................................................................................... 56
3.1 Poor Public Participation ................................................................................... 56
3.2 Lack of Standardized Practice ........................................................................... 57
3.3 Low Profitability .................................................................................................. 57
3.4 Poor Working Conditions for Informal Recyclers......................................... 57
4. MSW Sorting Experience of Developed Countries ....................................... 59
5. Discussion and Conclusions ............................................................................. 61
5.1 Enforcing Source Separation ............................................................................. 61
5.2 Enhancing Public Participation ........................................................................ 61
5.2.1 Improve the Communication Channel ............................................................ 61
5.2.2 Establishing Incentives and Disincentives ..................................................... 61
5.3 Providing Standard Sorting Equipment .......................................................... 62
5.4 Integrating Sorting and Recycling Market ...................................................... 62
5.5 Developing NGOs and Academic Institutions................................................. 62
5.6 WTERT-China as Part of the Sorting Campaign ............................................. 63
5.6.1 WTERT-China Organization............................................................................. 63
5.6.2 WTERT-China Sorting Consideration ............................................................. 64

7
5.6.3 WTERT-China Website Improvement ............................................................. 64
5.6.4 Public Education Program ............................................................................... 65
5.6.5 Organizing Nationwide Academic Efforts ....................................................... 66
References ....................................................................................................................... 66
List of Tables
Table 1 Population, economics, waste generation, and landfill percentage of top three cities ................ 10
Table 2 MSW composition of Shanghai , Beijing, and Guangzhou ............................................................. 12
Table 3 Post-recycling waste management structure in Shanghai, Beijing, and Guangzhou ..................... 13
Table 4 Comparison between different waste management methods and their status in China ............. 13
Table 5 Breakdown of landfill processing cost 2010 (8) ............................................................................. 16
Table 6 WTE plants in major cities .............................................................................................................. 17
Table 7 Air emission for the plant ............................................................................................................... 22
Table 8 Fugitive emissions .......................................................................................................................... 22
Table 9 Water emission .............................................................................................................................. 23
Table 10 Three different scenarios and the relevant electricity selling income (13) ................................. 27
Table 11 Basic technical information of the model plant ........................................................................... 29
Table 12 Major equipment of the model plant .......................................................................................... 30
Table 13 Chinese National Regulations for WTE Project ............................................................................ 31
Table 14 Capital investment detail ............................................................................................................. 31
Table 15 Average on-site personnel during construction ........................................................................... 32
Table 16 Composition of MSW processing costs ........................................................................................ 34
Table 18 Cash flow for Scenario I ................................................................................................................ 38
Table 19 Relationship between the gate fee and NPV without VAT return ............................................... 39
Table 20 Relationship between gate fee and IRR without VAT return ....................................................... 40
Table 21 Cash flow for Scenario II ............................................................................................................... 41
Table 22 Relationship between gate fee and NPV with VAT return ........................................................... 42
Table 23 IRR with VAT return ...................................................................................................................... 43
Table 24 Difference of IRR between two scenarios .................................................................................... 44
Table 25 MSW composition of Guangzhou in 2009 .................................................................................... 47
Table 26 Beijing policies regarding MSW sorting........................................................................................ 51
Table 27 Beijing harmless treatment capacity (1) ...................................................................................... 52
Table 28 Beijing waste management .......................................................................................................... 52
Table 29 Guangzhou policies regarding MSW sorting ................................................................................ 54
Table 30 Guangzhou harmless treatment capacity (22) ............................................................................. 55
Table 31 Guangzhou waste management (22) ........................................................................................... 55
Table 32 MSW sorting strategy for some developed countries (27) .......................................................... 59

8
List of Figures
Figure 1 MSW generation with the urban population growth in the recent decade ................................... 9
Figure 2 Hierarchy of sustainable management ......................................................................................... 11
Figure 3 A snapshot of the film Beijing Besieged by Waste by Wang Jiuliang ............................................ 15
Figure 4 Flowchart of the "seven-stage controlling method" .................................................................... 21
Figure 5 Two different cooperation methods for government investment-enterprise operation model . 24
Figure 6 Relationship between different parties in BOT model ................................................................. 26
Figure 7 Relationship between gate fee and NPC without VAT return ...................................................... 39
Figure 8 Relationship between gate fee and IRR without VAT return ........................................................ 40
Figure 9 Relationship between gate fee and NPV with and without VAR return ....................................... 42
Figure 10 Relationship between gate fee and IRR with and without VAT return ....................................... 43
Figure 11 Grouping of Guangzhou MSW components in terms of their potential for material and energy
recovery ...................................................................................................................................................... 48
Figure 12 Theoretical process and stakeholders of MSW sorting, as recommended by the Ministry ....... 49
Figure 13 Practical process and stakeholders of MSW sorting in Beijing ................................................... 50
Figure 14 Practical process and stakeholders of MSW sorting in Guangzhou ............................................ 53
Figure 15 Picture of sorting bin (left side for non-recyclables and right for recyclables) ........................... 56
Figure 16 Garbage pickers in a landfill Source: HDWIKI Image,
http://tupian.hudong.com/11249/4.html?prd=zutu_thumbs ................................................................... 58
Figure 17 WTERT-China (ZJU Sector) .......................................................................................................... 64
Figure 18 Resource recirculation from WTERT website ............................................................................. 65

9
Part I: Analysis of the Economics of Waste-to-Energy Plants in China
1. Introduction China has the largest population (1.33 billion) on Earth and a nominal GDP of $7.3 trillion. As
one of the world’s fastest developing countries, China has experienced a high growth rate in
economic development and urbanization. The urban population (non-agriculture population)
increased from 58 million in 1949 to 670 million in 2010 (1), indicating a steady rise in material
consumption of modern life style and ever growing municipal solid waste (MSW) generation. A
fivefold increase in MSW generation from 31 to 156 million tons was reported between 1982
and 2004 (1). The latest national reports show that the MSW generation of the country has
reached 158 million tons (1). Figure 1 show the MSW generation with the urban population
growth in the recent decade.
Figure 1 MSW generation with the urban population growth in the recent decade
At 2010, there were 64 cities with a population of over a million in the country, corresponding
to 24.4% of China’s urban population. These cities dominate the country’s economy and suffer
the most from the skyrocketing MSW generation because of the disparity between urban
development and waste management facilities. One of the major problems is lack of landfill
space. Therefore it is imperative to convert the current waste management structure of cities
to a more sustainable and long-termly cost-effective one. Table 1 shows the population,
480.64
669.78
134.7
158.04
120
125
130
135
140
145
150
155
160
450
500
550
600
650
700
2001 2002 2003 2004 2005 2006 2007 2008 2009 2010
Urb
an P
op
ula
tio
n (
mil
lion
)
MSW
Ge
ner
atio
n (
mill
ion
to
ns)
Year
Urban Population (million)
MSW Generation (million tons)

10
economics, waste generation, and landfill percentage of three major cities. The GDP
(PPP)(purchasing power parity was used to reflect the actual purchasing power compared
across countries)per capita were converted from the nominal GDP per capita using China’s
PPP/GDP ratio, 0.6 provided by the World Bank.
Table 1 Population, economics, waste generation, and landfill percentage of top three cities
Population (million)
GDP
(nominal)*
(billion
USD)
GDP
(nominal)
per capita
GDP (PPP) per
capita (USD)
MSW
Generation
(million
tons/year)
MSW
Generation
per capita
(ton/year)
MSW TO
LANDFILLS
(sanitary
and non-
sanitary)
Shanghai 23.0 297.2 12,922 20,545 7.3 0.3 74.8%
Beijing 19.6 251.6 12,837 20,410 6.3 0.3 85.3%
Guangzhou 12.7 158.8 12,504 19,881 6.5 0.5 79.0%
China 1,300 7,300 5,413 8,500 158 0.1 82.8%
Source: China 2011 Statistical Yearbook
From Table 1 it can be seen that the MSW generation per capita of the three cities far exceeds
the national average, which is consistent with the huge discrepancy in GDP (PPP) per capita.
This means the purchasing power influences the MSW generation. In terms of landfill
percentage, there is no obvious difference between the three cities and the national average
despite the wide gap between their GDP. This also indicates a large potential for the cities to
reduce landfills, since globally landfill rates are inversely proportional to the region’s economic
development.
According to the hierarchy of sustainable waste management (Figure 2), waste-to-energy (WTE)
is in the mid of the pyramid, moving part of the post-recycling and composting waste stream
from landfill in the bottom. Table 1 indicates that waste management in Chinese cities is placed
mainly in the lower part of the hierarchy. Municipalities should try every means to move up the
“ladder” of waste management, in order to alleviate the current landfill space crisis. WTE, as
the last step before the waste stream going to landfills is regarded internationally as an
indispensable part of the solution.

11
Figure 2 Hierarchy of sustainable management
By far, the largest cost item in the operation of WTE plant is the repayment of the initial capital
investment of $600 to $750 per annual metric ton of capacity, which results in capital charges
of $60-75 per ton of MSW processed (2). The capital cost for WTE in China is expected to be
lower but the prevailing low gate fees and electricity generation per ton of waste still put the
profitability of these plants under question.
The objective of this study was to compile and analyze information of the current waste
management system in Chinese cities and estimate the expenditures and revenues of a 383,000
ton/year WTE plant. Different gate fee scenarios were considered and the net present value
(NPV) method and internal rate of return (IRR) method were used to identify the required
breakeven gate fee for such a plant, including any government subsidies for WTE projects.
2. Waste Management in Chinese Cities
2.1 MSW Characterization
Like most developing countries, the MSW in China is characterized by high moisture content
and low heating value (3). The actual composition and heating value varies according to
different geological and economic conditions of these cities, but the average heating value is
estimated to be around 5.5 MJ/kg of MSW. Table 2 shows the MSW composition of Shanghai,
Beijing, and Guangzhou.

12
Table 2 MSW composition of Shanghai , Beijing, and Guangzhou
Composition Mass distribution (% wet weight)
Shanghai (Eastern China)a Beijing (Northern China)b Guangzhou (southern China)c
Paper 22.2 14.3 6.9
Plastic and rubber 20.9 13.6 17.2
Wood 3.3 7.5 2.8
Textiles 6.0 9.6 5.9
Organic waste 21.7 44.2 56.3
Metals 0.8 1.2 0.3
Glass & stone 8.3 7.2 4.6
Small waste
residues
14.6 2.5 6.0
Average Moisture
content %
51.66
a. Source: Field research at Shanghai Jiangqiao WTE plant by Prof. Dezhen Chen of Tongji University, 2008
b. Source: Rong Bo et al. Composition Analysis of Beijing’s Domestic Refuse and Corresponding Treatment
Countermeasure, Environmental Protection, Oct. 2004
c. Source: Guidebook of MSW Sorting in Guangzhou
According to EEC previous research, southern cities have more organic waste while northern
cities have more dry ash in the MSW, especially in winter. The heating value varies in a very
short range despite the changing moisture content.
2.2 Waste Management Infrastructure
Waste management in Chinese cities is based mainly on landfilling and WTE. Landfilling is still
the dominant method of MSW disposal, although many cities are now running out of land. The
percentages of post-recycling MSW sanitary landfilling, composting, WTE, and unregulated
landfilling (aka “non-harmless treatment” in China) for Shanghai, Beijing, and Guangzhou till the
end of 2010 are listed in Table 3.
Due to inadequate waste sorting, the portion of composting in the whole waste management
system in China remains low (1% of the Chinese total)(1). For large cities, which usually have
much less portion of food waste in the MSW stream than smaller ones, the development of

13
composting is limited and therefore must turn to WTE to diminish landfill. Table 4 shows the
comparison between different waste management methods and their status in China.
Table 3 Post-recycling waste management structure in Shanghai, Beijing, and Guangzhou
City/Treatment Sanitary Landfill% Composting% WTE% “Non-harmless”
treatment
Beijing 70.4 12.5 10.5 1.8
Shanghai 56.8 2.9 14.8 25.5
Guangzhou 83.6 0 8.3 8.1
*Source: China 2011 Statistical Yearbook
Table 4 Comparison between different waste management methods and their status in China
Non-Sanitary Landfill
Sanitary Landfill Composting WTE
Land consumption Large Large Large Small
Harmfulness Severe secondary pollution
Light secondary pollution
Some secondary pollution
No secondary pollution
Volume reduction No No Not obvious 90% volume reduction
Weight reduction No No No 75% weight reduction
Resource recovery No Landfill gas collection to some extent
Fertilizer Electricity
Water contamination
Severe Nearly no pollution
Heavy No pollution
Soil contamination Severe Little Heavy No pollution
Air pollution Severe Little Heavy No pollution if under control
Life span Short, generally 10 to 20 years
Short, generally 10 to 20 years
Long Long
Capital investment Low High High High
Operational cost Low High High High
Domestic usage Many, but not adopted in developed areas
Little Very little, and not successful
Adopted by developed areas and cities
National policy Not encouraged, restricted in some regions
Not encouraged Not encouraged Encouraged, and enjoys favorable policies
Future trend Gradually eliminate
Adopted by some regions
Hard to spread in the short-term
Increased with economic development

14
The current waste management systems in Chinese cities are facing the following problems:
a) High rate of disorganized informal recycling with low efficiency
Due to the lack of public awareness and relevant infrastructure, organized formal recycling in
Chinese cities has a very high cost. Even though a few cities have been assigned to implement
formal recycling strategy by the central government since 1998, an overwhelming portion of
the waste stream still goes to untraceable, disorganized, and low efficiency individual recyclers.
A number of cities have tried various methods to enhance formal recycling, such as curbside
waste separation, charging disposition fee for per kilogram of household waste, and penalty for
dumping main recyclables. However, little effect was seen in the past few years.
b) Lack of landfill space
A number of cities in China are now running out of landfill space due to the booming waste
generation and the slow development of alternative strategies. Not having sufficient budget for
long distance transportation and disposition, most of the cities are now besieged by an
enlarging ring of landfill. This problem is too severe for recycling alone to solve. Guangzhou city
boasts its national No. 1 33% of waste recycling rate, claiming that it recovers 5,800 tons of
MSW per day. However, one of the local landfills, which has a designed capacity of 2,500 tons
per day, now receives 7,000 tons daily (4). Actually, the city is expected to use up all its landfill
space if no more aggressive strategy is taken.
c) Environmental problems of composting and landfilling
With the expanding urban boundary, many residential and developing areas in Chinese cities
are located near, or even on the previous landfills. Composting and landfilling odors can affect
as far as 15 km in the worst case, degrading the land value and investment attraction of
surrounding areas. The Shanghai Laogang Landfill, the largest landfill in the city, is only 40 km
from Lujiazui, China’s major financial center. Surrounding neighborhoods have never stopped
complaining about the landfill and the neighboring composting project. One composting plant
in that area near Caoluzhen, a 2,000 ton per day facility, has caused significant social instability
because of its heavy odor and suspected health risk. Foreign investments are severely
prohibited due to the unfavorable environment. The same thing happens to other cities and
property values in these areas suffer heavily. Figure 3 shows a wild burning of garbage on a
landfill right near a new residential area in Beijing (5).

15
Figure 3 A snapshot of the film Beijing Besieged by Waste by Wang Jiuliang
2.3 Post-recycling MSW Management Cost for City Government
The cost for post-recycling MSW management is mainly composed of three parts: collection
cost, transportation cost, and terminal processing cost. Collection and transportation are done
by governmental agencies such as the local Environmental Protection Bureau and
neighborhood authority and the costs are calculated according to operational expenses, while
the terminal processing is practiced by authorized partner companies and the government
expenses is calculated by fixed subsidies (gate fee) for per ton of MSW received by the facility.
This section includes only sanitary landfilling as the terminal processing method, for WTE
processing cost will be discussed in detail later in this study.
This part of study is based on the price and environmental protection information available for
some of the average cities in China. The information and data include the economic effect of
vehicle, material, power, maintenance, equipment depreciation, personnel, and tax throughout
a certain process. Actual cost varies case by case due to unbalanced economic development of
these cities. Usually megacities like Shanghai and Beijing have a much higher cost than average.
2.3.1 Collection cost
The collection cost is mainly composed of the personnel expenses for frontline labors and
managing positions as well as the transportation, vehicle, and material involved in the process.
The average cost for MSW collection is calculated to be $10.27 per ton of MSW. 31.4% of the
expense is paid by municipal environmental protection bureau and the rest is paid by
neighborhood authorities (6).
2.3.2. Transportation cost
The transportation cost mainly consists of the personnel expenses of truck drivers, technicians
and fuel expenses. The average transportation cost is calculated to be $6.92 per ton of MSW, in

16
which 41.5% is associated with vehicle fuel and maintenance (6). The municipal environmental
protection bureau is responsible for all of the transportation processes.
2.3.3 Landfilling gate fee
Gate fee is the fixed governmental subsidy paid to terminal processing facility owners for per
ton of MSW received. The average gate fee for sanitary landfill facilities is around $9.52 per ton
of MSW (7). Part of this fund is collected by the government from local residents and
enterprises as waste disposal fee. However, the amount is far from enough compared with the
whole gate fee without governmental financial subsidies.
2.3.4 Landfilling processing cost
“Waste disposition cost (in the landfill) should be contained under governmental subsidies
(gate fee), therefore we have very little profitability”, said Zhou Xiaohua, general manager of
Veolia Environment China, owner of the Shanghai Laogang Landfill, the largest sanitary landfill
in China (7). Compared with the relatively fixed gate fee, the ever increasing personnel and fuel
costs continue to fill the gap between processing costs and gate fee. The processing costs for a
sanitary landfill is around $8.41 (8). Table 5 shows the breakdown of the landfill processing cost.
Table 5 Breakdown of landfill processing cost 2010 (8)
Item Percentage %
Leachate processing 38.98
Personnel 32.74
Fuel 4.02
Equipment maintenance 2.90
Office expense 8.83
Auxiliary materials 3.79
Others 8.75
Total 100
3. WTE in Chinese Cities
3.1 WTE Technologies in Chinese Cities
Generally speaking, a 200-ton per day capacity is the minimum amount for a WTE line to be
commercially viable and the fluctuation of MSW supply should be maintained within 20% (9).
An average lower heating value above 5 MJ/kg is required for combustion without auxiliary fuel
(9). The MSW generation and characterization in Chinese cities have fulfilled the prerequisites
mentioned above therefore it is technically feasible to practice WTE in these cities.

17
Between the two main WTE technologies in China, moving grate combustion of as-received
MSW and circulated fluidized bed (CFB), the former is favored over the latter in cities. Almost
all of the existing moving grate combustion technologies are imported from Europe, U.S.A., and
Japan in these cities while CFB is mainly from domestic Zhejiang University (ZJU) and Chinese
Academy of Science and the market is much smaller and immature. Three reasons account for
this preference:
a) CFB technology is mainly designed for low-grade MSW characterized with high moisture and
low lower heating value as well as relatively low investment per ton for domestically designed
and constructed CFB plants (generally 70% of the moving grate combustion plant investment)
(10). Large Chinese cities usually have much higher quality MSW and more severe problem of
waste crisis than less urbanized cities, therefore imported technologies that have been proved
effective in developed countries are preferred even with a higher investment.
b) CFB technology needs waste pretreatment before combustion such as shredding, which
complicates the operation and maintenance of the facility. Much simpler technology is
preferred in cities in order to maintain a high availability of the plant.
c) CFB technology produces more fly ash than moving grate combustion (10), which lays heavy
burden on post-combustion processes and environmental impacts. Large cities have more strict
environmental assessment mechanism and monitoring system, therefore any possible risk is
avoided by these cities.
Table 6 shows the statistics of WTE plants in major cities.
Table 6 WTE plants in major cities
Plant Name City Capacity (tons/year)
Combustion Technology
Electricity Generation Capacity (MW)
Investment (million USD)
Investment/ton of annual capacity
(USD/ton)
Imported technologies
Shanghai Pudong Yuqiao WTE Plant Shanghai 346,500
Alstom, France, CITY 2000 grate furnace 2*8.5 100.00 289
Shanghai Jiangqiao WTE Plant Shanghai 495,000
Steinmuller, Germany, grate furnace 2*12 139.68 282

18
Ningbo Fenglin WTE Plant Ningbo 346,500
Noell-KRC, Germsny ladder type pushing grate furnace 2*6 63.33 183
Hangzhou Lvneng WTE Plant Hangzhou 148,500
Japan Mitsubishi Heavy Industry Martin grate furnace 7 34.13 230
Shenzhen Longgang Pinghu WTE Plant (Phase I) Shenzhen 363,000
Mitsubishi Heavy Industry, Japan, Martin grate furnace 12 45.40 125
Shenzhen Baoan Baigehu WTE Plant Shenzhen 396,000
Seghers SHA, Belgium, multistage grate furnace 9 63.49 160
Shenzhen Yantian WTE Plant Shenzhen 148,500
Seghers SHA, Belgium, multistage grate furnace 6 36.51 246
Shenzhen Nanshan WTE Plant Shenzhen 264,000
Seghers SHA, Belgium multistage grate furnace 12 68.57 260
Shenzhen Baoan Laohukeng WTE Plant Shenzhen 198,000
Seghers SHA, Belgium multistage grate furnace N/A 99.68 503
Chongqing Tongxing WTE Plant Chongqing 396,000
Alstom, France, CITY 2000 grate furnace 2*12 50.00 126
Tianjin Shuanggang WTE Plant Tianjin 396,000
TAKUMA SN, Japan, grate furnace 2*12 85.71 216
Taiyuan WTE Plant Taiyuan 330,000 Japan EBARA CFB 2*12 57.78 175
Guangzhou Likeng WTE Plant Guangzhou 330,000
Mitsubishi Heavy Industry, Japan, Martin grate furnace 2*7.5 100.00 303
Guangzhou Likeng WTE Plant (Phase II) Guangzhou 660,000
Mitsubishi Heavy Industry, Japan, Martin grate furnace 40 153.49 233

19
Suzhou Suneng WTE Plant Suzhou 330,000
Seghers SHA, Belgium multistage grate furnace N/A 79.37 241
Dalian WTE Plant Dalian 495,000
EBARA, Japan, CFB reactot N/A 99.21 200
Xiamen WTE Plant Xiamen 132,000
Von Roll, Switzerland, multi-stage grate furnace 6 31.75 241
Fuzhou Hongmiaoling WTE Plant Fuzhou 330,000
Mitsubishi Heavy Industry, Japan, Martin grate furnace 2*8 57.94 176
Beijing Gaoantun WTE Beijing 528,000
TAKUMA SN, Japan, grate furnace 2*15 119.05 225
Chengdu Luodai WTE Plant Chengdu 396,000 Grate furnace 2*12 76.19 192
Changzhou WTE Plant Changzhou 264,000
TAKUMA SN, Japan, grate furnace 3*9 52.38 198
Wuhan Guanshan WTE Plant Wuhan 330,000 Grate furnace N/A 68.25 207
Foshan Nanhai WTE Plant Foshan 462,000
BASIC Model 1000 , U.S.A., pulsed type grate furnace 12 55.56 120
Foshan Shunde Xingtan Youtan WTE Plant Foshan 198,000
BASIC Model 1000 , U.S.A., pulsed type grate furnace 12 31.75 160
Shenyang Daxin WTE Plant Shenyang 313,500
Richway CAO, Canada, Pyrolysis furnace 2*7.5 46.03 147
Huizhou WTE Plant Huizhou 264,000
Richway CAO, Canada, Pyrolysis furnace 2*6 28.57 108
Domestic technologies
Changchun Xinxiang WTE Plant Changchun 171,600 N/A 6 25.40 148

20
Shijiazhuang Qili WTE Plant
Shijiazhuang 165,000 CFB 2*15 21.59 131
Harbin WTE Plant Harbin 66,000 CFB 3 22.70 344
Hangzhou Jinjiang WTE Plant Hangzhou 264,000
ZJU Differential Density CFB N/A N/A N/A
Zhengzhou WTE Plant Zhengzhou 330,000
ZJU Differential Density CFB N/A N/A N/A
Wuhu WTE Plant Wuhu 198,000
ZJU Differential Density CFB 2*6 32.22 163
Wuxi WTE Plant Wuxi 372,900
Chinese Academy of Science CFB 2*18 36.51 98
Shenzhen Pinghu WTE Plant Shenzhen 222,750
Chinese Academy of Science CFB N/A 36.51 164
Source: Statistics for the National Tenth Five-year plan period Existing and Planning WTE Plants
Some plants use a squeezing press to decrease the moisture content of the MSW. At one of the
plants visited by the author in Shanghai, this practice was reported to increase the Lower
Heating Value of the MSW by as much as 2 MJ/kg. However, the tradeoff is the unbalanced
density distribution of the feedstock entering the combustion chamber, which causes unstable
temperature zones on the grate.
The leachate collected in the waste bunker in some plants is used in anaerobic digestion
facilities to form biogas, which is then injected into the combustion chamber to enhance
combustion.
The most common Air Pollution Control system used in these WTE plants is the combination of
semi-dry scrubber, activated carbon injection device and fabric filter baghouse. Also, in some
WTE plants, SNCR technology is incorporated in the air pollution control system, for example in
the WTE plants planned for Guangzhou and Chongqing. Due to the relatively loose national
standard for NOx emission and people’s less awareness of its harmfulness, most plants
reserved room for NOx control equipment while not implement the control method to avoid
additional cost. Temperature control technology is also widely utilized in the combustion
chamber to keep the flue gas temperature above the decomposition temperature of dioxin for
an adequate period of time. Therefore the complete air pollution control process is called

21
“seven-stage controlling method” in China. Figure 4 shows the flowchart for the “seven-stage
controlling method”.
Figure 4 Flowchart of the "seven-stage controlling method"
3.2 Plant Emissions
One WTE plant in an eastern China city was investigated by the author and the emission data
was acquired. The plant investigated has three CITY2000 moving grate lines and the total actual
daily capacity is 1350 tons. It has two 8.5 MW electricity generation units. The APC system
consists of semi-dry scrubber, activated carbon injection, and baghouse. No SNCR technology is
implemented. The ten-year-old plant has a decent environmental performance and is
representative of Chinese city plants of the same capacity in terms of APC system and grate
technology. The average value of the environmental performance of the three lines is
presented in this paper as agreed with the plant operator to protect confidentiality. The
average plant availability was 92.8% in 2011.
Table 7 shows the air emission for the plant (by local Environmental Monitoring Station).
Temperature controlling combustion
combustion chamber
SNCR
Absorption tower
Ca(OH)2
Baghouse
Activated carbon
ID Fan Stack
Online monitoring

22
Table 7 Air emission for the plant
From table 7 it obvious that the Dioxin and heavy metal emission of the plant is far below the
EU standard, which indicates a perfect performance of the APC system. The acid emission (SO2
and HCL) is also within the EU Standard. When it comes to NOx emission, the plant’s emission
data shows a good performance according to the Chinese National Standard, while exceeds the
EU Standard. This is because of the omission of NOx reduction strategy in compliance with the
looser national standard. The new national standard starting from 2013 for existing plants will
bring the NOx emission standard a step lower to 250 mg/m3 and mercury as well as Cadmium
emission standard to as low as that of EU (11).
Table 8 shows the fugitive emissions of the plant (by local Environmental Monitoring Station).
Table 8 Fugitive emissions
Average Testing Results Local Emission Standard
Odor Concentration 10 20
NH3 (mg/m3) 0.07 1.5
H2S (mg/m3) 0.001 0.06
Table 9 shows the water emission of the plant (by local Environmental Monitoring Station)
Pollutant Average Chinese National Standard (GB 18485-2001)
EU Standard (2010)
HCL (mg/m3) 5.42 75 10
SO2 (mg/Nm3) 27 260 50
Nox (mg/Nm3) 286 400 200
CO (Nmg/m3) <1 150 50
Particulate matter (Nmg/m3) 3.33 80 10
Hg (mg/Nm3) 7.3 E -7 0.2 0.05
Cd (mg/Nm3) <0.0006 0.1 0.05
Pb (mg/Nm3) <0.0006 1.6 0.5
Dioxin TEQ ng/m3 0.0085 1 0.1

23
Table 9 Water emission
Average Testing Results Local Sewage Standard
CODCr (mg/l) 144 500
5 days BOD (mg/l) 43.9 300
NH3-N (mg/l) 5.68 40
Oil (mg/l) 2.6 100
Suspended Solid (mg/l) 87 400
pH 6.3 6-9
From Table 8 and Table 9 it can be seen that the plant’s odor and water emission meet the local
standard for environmental safety therefore no health risk is taken by surrounding communities.
The water emitted shows a feature of weak acid but is within the local sewage standard.
In 2011, the plant generated 80,875 tons of bottom ash (0.19 ton per ton of MSW processed)
and 12,540 tons of fly ash (0.03 ton per ton of MSW processed). The bottom ash of the plant
was used as roadbed material after recycling heavy metals while the fly ash was sent to the
nearby hazardous waste monofill.
3.3 Features of WTE in Chinese Cities
3.3.1 Ownership Model
Like many developed countries, most WTE plants in China are now practicing commercialized
models rather than governmental non-profit service. There are two major ownership models
for WTE plants in China--government owned model and build-operate-transfer (BOT) model.
The latter model, also known as BOT model, is practiced more in cities.
a) Government owned model
In this model, the government utilizes its annual budget or national government loans to invest
in the WTE project and then hire, through tendering, professional operator companies to
manage and operate the project. The government pays the operator for management and
operation and at the meantime supervises the environmental performance of the plant. The
model can be sub-divided into two cooperation methods according to different ways of
payment for management and operation by the government. Figure 5 (a) and (b) show the
difference between the two methods.

24
(a) Method A
(b) Method B
Figure 5 Two different cooperation methods for government investment-enterprise operation model
In both methods the local government is the investor of the project and wholly owns the plant. The difference is how the operator company makes a profit. In method A all of the electricity selling income is turned over to the government, which, in return, pays the operator for plant operation and management according to the contract. In method B, the operator company has more degree of freedom than in method A in adjusting its operational strategy to make profit. It can be easily understood that method B is more preferred by plant operators who have high quality and sufficient supply of MSW so decent and stable electricity selling income is guaranteed with lower processing cost.
Engineering Company
WTE Plant Government Environmental Agency
Government
Operator Company
Construct
Supervise
Operate
Pay operation and management fee
Invest
Electricity selling income
Engineering Company
WTE Plant Government Environmental Agency
Government
Operator Company
Construct
Supervise
Operate
Invest
Small portion of electricity selling income
Major electricity selling income

25
The government investment-enterprise operation model is still characterized by strong governmental interference, in which the WTE facility is still a governmental infrastructure. No gate fee is involved in the model. Heavy financial burden is laid on the local government by capital investment and payment to the operator company. Long-term development of the industry is compromised. Therefore in recent years Chinese cities have shifted their WTE ownership model to the new BOT model.
b) Build-operate-transfer model (BOT)
The build-operate-transfer (BOT) model is now widely used among Chinese cities for WTE projects. It is a form of project financing, wherein a private entity receives a concession from the government to finance, design, construct, and operate a facility stated in the concession contract. This enables the project proponent to recover its investment, operating and maintenance expenses in the project. The economic analysis in this study was based on the BOT model.
BOT model finds extensive application in the infrastructure projects and in public–private partnership. In the BOT framework a third party, the local government, delegates to a private sector entity to design and build infrastructure and to operate and maintain these facilities for a certain period. The period for WTE projects is usually 20 to 30 years. During this period the private entity has the responsibility to raise the finance for the project and is entitled to retain all revenues generated by the project and is the owner of the regarded facility. One source of revenue specific to WTE plants is the governmental subsidy for per ton of waste received by the facility, which is called gate fee. The facility will be then transferred to the government at the end of the concession agreement (12), without any remuneration of the private entity involved. The following parties are involved in the WTE BOT project:
a) Local government: The local government is the initiator of the WTE project and decides if the BOT model is appropriate to meet its needs. The government provides normally support for the project in some form (provision of the land and favorable policies). In addition, the government is responsible for a stable supply of the fuel (MSW) to the plant with adequate amount of gate fee to guarantee the profitability of the project. Higher purchasing price is also given by the government to the plant’s electricity generation. The Environmental Agency of the government serves to supervise the performance of the plant.
b) The concessionaire: The project sponsors who act as concessionaire create a special purpose entity which is capitalized through their financial contributions.
c) Lending banks: Most WTE BOT projects are funded to a big extent by commercial debt. The bank will be expected to finance the project on “non-recourse” basis meaning that it has recourse to the special purpose entity and all its assets for the repayment of the debt.
d) Other lenders: The special purpose entity might have other lenders such as national or regional development banks and foreign funds.
Figure 6 shows the relationship between different parties in the BOT model.

26
Figure 6 Relationship between different parties in BOT model
The BOT model exempts the local government from raising huge amount of fund itself to deal
with the emerging waste management crisis, therefore solves the problem of heavy financial
burden of WTE on local economy. On the meantime, the concession contract between the
government and the private entity serves as a guarantee for profitability, which helps the entity
get easy bank loan of huge amount.
3.3.2 Strong Government Support
In order to help the BOT model perform smoothly, Chinese government has launched a series
of favorable policies and subsidies apart from gate fees to ensure the profitability of the WTE
project. The most representative is the latest “Announcement of Improving WTE Electricity
Purchasing Price Policy” (13) (the announcement, in the rest of the thesis) issued in March,
2012 by National Development and Reform Commission for WTE projects approved after
January 1st, 2006.
The announcement designed a specific pricing mechanism according to the low heating value
characteristic of Chinese MSW so as to maximize the subsidy to adequate facilities while
preventing operators from adding unpermitted amount of auxiliary fossil fuel during
combustion to generate excessive subsidized electricity.
In the announcement, the price for WTE electricity was set as 65 cents CNY ($10 cents), 20
cents CNY ($3.2 cents) higher than fossil fuel electricity. The 20 cents CNY subsidy was paid
collaboratively by local grid companies, terminal customers, and national budget renewable
energy. However, not all of the electricity sold by WTE plants was entitled with such a higher
price. The mechanism was based on the difference between the baseline electricity generation
Bank Private entity Government
WTE Plant Government environmental agency
loan
Repayment
Gate fee
Invest, construct, operate and management
Supervise
Supply site and MSW source
Electricity selling income

27
per ton of MSW, which was set by the central government, and the actual electricity generation
per ton by the plant. The announcement assumed, according to domestic condition, that the
baseline unit electricity generation for WTE is 280 kWh/ton of MSW. And the assumed baseline
grid electricity is the actual tonnage of the MSW processed by the plant multiplied by the
baseline unit, 280 kWh/ton of MSW. Three scenarios may occur according to the
announcement. Table 10 shows the three different conditions and the relevant electricity
selling income according to the subsidy.
Table 10 Three different scenarios and the relevant electricity selling income (13)
Condition High Electricity Generation
Moderate Electricity Generation
Low Electricity Generation
Actual Grid Electricity Higher than two times the baseline
Higher than baseline but lower than two times the baseline
Lower than baseline
Electricity Selling Income (including tax)
Counted as fossil electricity, no subsidy
Baseline amount of grid electricity × benchmark price (65 cents); excess amount counted as fossil electricity;
Actual amount of grid electricity × benchmark price (65 cents);
The pricing mechanism takes into to consideration the low heating value nature of Chinese
MSW and encourages MSW sorting in order to reasonably raise the heating value of the waste
as close to the baseline unit electricity generation ability (280 kWh/ton of MSW) as possible for
the WTE operators to make more profit. Other favorable policies, apart from the grid electricity
pricing subsidy, also help stimulate the industry. The most used practices are: local income tax
relief, easy bank loan policy, favorable land usage policy, etc. to name but a few.
3.3.3 High Social Cost
On the contrary to the firm governmental support, local residents and environmentalists have
never given up their right of opposition. Cities are usually the frontline of public opposition
because the opponents there are generally more informed, organized, and financed. A number
of WTE projects in cities like Shanghai and Guangzhou were postponed or even forever crippled
by the public opposition. One representative case is the Panyu WTE Project in Guangzhou. The
project was initially proposed to be built in 2009, but was postponed till 2012 due to strong
public opposition. According to a public poll for the project done in 2009, 97.1% of the 1,550
respondents were against building the project on the proposed site, driving the local
government to hold the project for fear of social instability.
During previous researches, WTERT has identified several possible reasons for continuing public
opposition to WTE projects in China:

28
a. Inadequate information to public as to benefits of WTE by Chinese academia;
b. Need for transparency of WTE emission data by government;
c. Fear that new WTE project will lower surrounding property values;
d. Odor emissions from the plant and related infrastructures; and
e. Inadequate operating control of emissions by some WTE plants.
To address the problems, a few suggestions are put forward in this study:
a. Establish academic organizations that combines the regional efforts on WTE to popularize the
unbiased knowledge of WTE through easy-understanding online sources and brochures rather
than confusing technical parameters and convoluted academic terms;
b. Establish regular report mechanism for local WTE facility online and on newspaper, improve the
public opinion channel to the relevant governmental agency to understand the most desired
information from the public;
c. Organize education programs for local stakeholders;
d. Use sealed garbage truck and enhanced air extraction strategy in order to maintain the
negative pressure in the tipping floor even when the combustion load is decreased by
maintenance, operational fault, etc.; and
e. Enhance governmental regulation and punishment method for improper operation.
4. China WTE Project Economics
4.1 Model Plant
To build the model, the study surveyed engineering documents of the WTE projects in several
cities. The model is based on the information from these documents as well as field surveys
done by the author. An average level WTE plant is built in the model, which uses widely
accepted technologies and economic output in China. The capital cost of the model is mainly
based on a series of national standards and regulations for WTE and power industry as well as
estimations according to existing plants of the similar capacity and technologies. The operation
cost analysis is based on local documents and field survey. Table 11 shows the basic technical
information of the model plant.

29
Table 11 Basic technical information of the model plant
Item Unit Value
Processing Capacity t/d 3×350
Processing Capacity per Line t/h 14.58
Annual Capacity t/a 382,500
Boiler Evaporation Capacity t/h 30.5
Steam Parameters
400 ○C, 4.0
MPa
Electricity Capacity MW 18
Plant Availability h/a 8000
Total Power Output MWh/a 117,000
Grid Electricity MWh/a 97,700
Plant Electricity Consumption Rate % 16
Life Year 28
Construction Period Year 2
Project Boundary Area m2 60,000
Total Personnel 70
Table 12 shows the major equipment of the model plant.

30
Table 12 Major equipment of the model plant
Item Technology Number Import/Domestic
Furnace Martin Reverse Grate 3
Imported technology & domestic manufacturing
APC System
Semi-dry Scrubber
3 Imported Equipment Activated Carbon Injection
SNCR
Baghouse
Online Flue Gas Monitoring System 3
Imported Equipment
Leachate Processing System MBR+NF 1
Domestic Equipment
Boiler 3 Domestic Equipment
Turbine Condensing Steam Turbine 2
Domestic Equipment
Generator 2 Domestic Equipment
Controlling System DSC 1
Domestic Equipment
With the development of domestic manufacturing level, more and more cities are now using a
combination of imported technology with domestic manufacturing for grate furnace. This
reduces the capital cost of WTE in China to a large extent. However, for APC systems, imported
equipment is thought to be more adequate by city investors.
4.2 Capital Costs
The capital costs include all of the economic expenses within the project boundary for
construction and equipment purchase. Land using expenses and local residents relocation fee
are paid by the government therefore is not included in the study.
The project capital costs are based on estimations according to similar existing plants and the
following regulations:
31
Table 13 Chinese National Regulations for WTE Project
Regulation Application in the Study
Budgeting and Calculation Standard for Coal Fired Power Plant, 2006
Allocation of project investment
The Electricity Industry Construction Project Fixed Budget, China Electricity Industry Association, 2006
Project cost estimation, construction labor wage estimation
China Mechanical and Electrical Product Pricing Content, 2009
Equipment pricing estimation
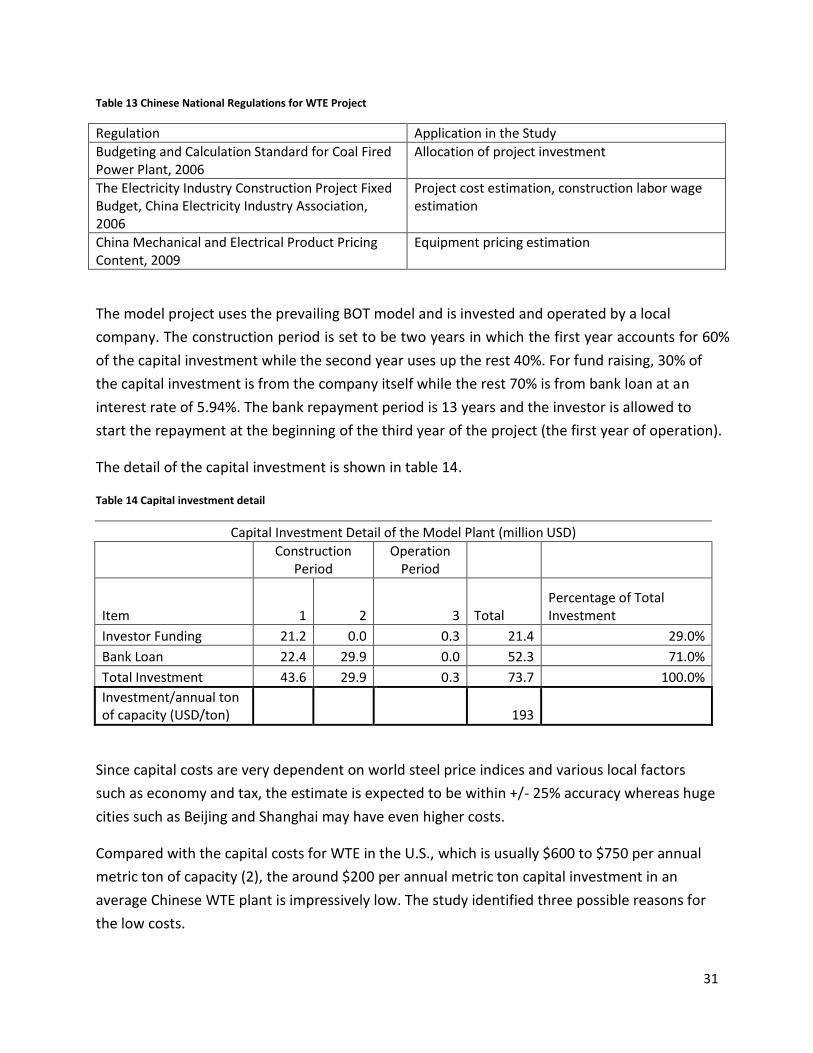
The model project uses the prevailing BOT model and is invested and operated by a local
company. The construction period is set to be two years in which the first year accounts for 60%
of the capital investment while the second year uses up the rest 40%. For fund raising, 30% of
the capital investment is from the company itself while the rest 70% is from bank loan at an
interest rate of 5.94%. The bank repayment period is 13 years and the investor is allowed to
start the repayment at the beginning of the third year of the project (the first year of operation).
The detail of the capital investment is shown in table 14.
Table 14 Capital investment detail
Capital Investment Detail of the Model Plant (million USD)
Construction
Period Operation
Period
Item 1 2 3 Total Percentage of Total Investment
Investor Funding 21.2 0.0 0.3 21.4 29.0%
Bank Loan 22.4 29.9 0.0 52.3 71.0%
Total Investment 43.6 29.9 0.3 73.7 100.0%
Investment/annual ton of capacity (USD/ton) 193
Since capital costs are very dependent on world steel price indices and various local factors
such as economy and tax, the estimate is expected to be within +/- 25% accuracy whereas huge
cities such as Beijing and Shanghai may have even higher costs.
Compared with the capital costs for WTE in the U.S., which is usually $600 to $750 per annual
metric ton of capacity (2), the around $200 per annual metric ton capital investment in an
average Chinese WTE plant is impressively low. The study identified three possible reasons for
the low costs.

32
a) Low construction labor cost
The labor cost for the model plant construction is based on The 2006 Electricity Industry
Construction Project Fixed Budget, which standardized the baseline daily salary for construction
labor is 26 CNY ($4.13)/person•day, and 31 CNY ($4)/person•day for equipment installation
skilled worker. Cities usually have a much higher payment—100 CNY ($15) for skilled worker
per day and 70 CNY ($11) for labor per day. Managing positions on the construction site can
have a monthly salary of 5,000 to 7,000 CNY ($462-770). Despite the regional differences in
labor cost, generally it is much lower than that in the U.S., which significantly reduces the
construction cost of the plant. The construction labor plan of the model plant is based on the
plan for an existing WTE plant of similar design (14). The two-year construction period has a
peak time personnel of as many as 680 people, with an average of 422 people on the
construction site. Table 15 shows the composition of the 442 on-site personnel.
Table 15 Average on-site personnel during construction
Managing 33
Logistic 41
Skilled workers 216
Labors 132
Sum 422
b) Localization of equipment and technologies
There is a trend that Chinese WTE projects are now trying to maximize the localized portion in
the plant equipment and technology. Domestic manufacturing of major equipment such as
Martin grate furnace cuts down the investment to a large extent. Furthermore, the model plant
uses domestic technologies in leachate processing and automation systems to further reduce
the costs. With the domestic technologies and manufacturing industry getting more and more
mature, the capital investment of Chinese WTE plants is expected to become even lower due to
the lower local labor and material cost.
c) Favorable tax policy
According to Chinese laws regarding equipment import, environmental protection industry
related equipment is waived off tariff and value-added tax (VAT). Only sea transportation fees
and other procedure fees are charged.
The country’s low national price level may partly contribute to the low costs listed above.
According to The World Bank, the national price level is the ratio of PPP (purchasing power

33
parity) to GDP, which “tells how many dollars are needed to buy a dollar’s worth of goods in the
country as compared to the United States.” The national price level for developing countries
like China are usually low (0.6), however, it can be quite high for developed countries (.e.g., U.K.:
1.1, France: 1.2, and Japan: 1.3) (The World Bank Database). Therefore, the $193 per annual
ton capacity capital costs can be converted to $322 per annual ton capacity using the PPP/GDP
ratio if the plant was built in the U.S.
4.3 Operating Period Economic Output
The economic output during the operating period can be divided into two parts: MSW
processing costs and bank loan repayment from the beginning of the third year of to the end of
the 13th year of the project.
4.3.1 MSW Processing Cost
The MSW processing cost estimation for the model plant is based on local market price and
industrial internal price. The costs for core WTE plant materials are: lime powder--300 CNY/ton
($48), activated carbon powder--7000 CNY/ton ($1111), and urea--1800 CNY/ton ($285). The
fabric filter in the baghouse is designed to be changed every 2.5 years, with an average annual
cost of 280,000CNY ($44,444). The fly ash is sent to hazardous waste monofill and the operator
is responsible for 100 CNY/ton of fly ash ($16). The bottom ash is reused as roadbed material
therefore no cost and income is included in this study. The total personnel for the plant
operation are estimated to be 70, with an average annual salary of 25,000 CNY ($3968). The
personnel expenses are the salary plus the welfare at a rate of 33% and coordination fee at a
rate of 22%. Table 16 shows the composition of MSW processing costs.

34
Table 16 Composition of MSW processing costs
Cost (million USD/year)
Raw Material Purchase 0.76
Fuel and Water Purchase 0.07
Leachate Processing 0.49
Fly Ash Disposition 0.22
Personnel 0.45
Maintenance 0.99
Depreciation Charges 4.37
Other Fees 3.88
Total 11.23
Costs/ton of MSW (USD) 29.36
4.3.2 Bank Loan Repayment
The bank loan principal and interest in the study is paid by uniform annual repayment during
the 12-year period. The repayment starts from the beginning of the third year and stops at the
end of the 13th year. The annual repayment is calculated according to the uniform series capital
recovery equation (15):
where:
A is the uniform annual repayment;
P is the present value of the loan at the beginning of the repayment period;
i is the interest rate;
n is the repayment period.
According to this calculation, the uniform repayment amount is decided to be $6.4 million.

35
4.3.3 Total Operating Period Economic Output
The operating period economic output can be divided into two stages: before and after the
bank debt is cleared. Therefore before the beginning of the 14th year of the project, the total
economic output is $17.6 million while after that, the annual economic output is $11.2 million.
During the repayment period, the economic output per ton of MSW processed can be as high
as $46.
4.4 Plant Revenues
Three main sources of WTE plant revenues are considered in this study—electricity sale, gate
fee, and value-added tax (VAT) return. Metal recycling is not included in the study because of
the low metal content in the MSW.
4.4.1 Electricity Sale
According to the national announcement for WTE electricity sale (13), the model plant’s grid
electricity generation is within the “low electricity generation” scenario in table 9. Therefore all
of the electricity the plant sells is covered by the $10 cents/kWh subsidized price. According to
table 10, the estimated annual grid electricity sale is 97,700 MWh, so the annual electricity sale
revenue is estimated to be $9.8 million.
4.4.2 Gate Fee
Gate fee is the payment that the landfills or WTE plants earns per ton of waste received from
the local government. The source of this part of subsidy is mainly from governmental budget
and waste disposition fee charged from local residents. It is a very important source of revenue
which dominates the profitability of the WTE project. The fee is a very case sensitive index,
depending heavily on the local economy, waste management structure, and plant condition.
Generally the gate fee for WTE is higher than that for sanitary landfill due to the high capital
cost for WTE plant. The highest gate fee in Chinese cities is $39 for one WTE plant in Shanghai,
while the lowest can be around $10 for a plant of the similar capacity. Gate fee for CFB plants is
even lower due to the low capital cost of them. The financial analysis in the following section
gave a thorough understanding of the relationship between gate fee and plant profitability in
these cities. Table 17 shows the gate fee for some of the WTE projects in China.

36
Table 17 Gate fees for some of the WTE plants in China
Plant Name City Capacity (t/day) Combustion Technology
Investment (million USD)
Gate Fee (USD)
Shanghai Pudong Yuqiao WTE Plant
Shanghai 3*365 Moving grate
100 39.2
Shanghai Jiangqiao WTE Plant
Shanghai 3*500 Moving grate
139.68 29
Tianjin Shuanggang WTE Plant
Tianjin 3*400 Moving grate
85.71 26.5
Shenzhen Baoan Baigehu WTE Plant
Shenzhen 1000 Moving grate
63.49 20.3
Ningbo Fenglin WTE Plant
Ningbo 3*350 Moving grate
63.33 15.9
Changzhou WTE Plant
Changzhou 2*400 Moving grate
52.38 15.4
Hangzhou Lvneng WTE Plant
Hangzhou 3*150 Moving grate
34.13 13.5
Chengdu Luodai WTE Plant
Chengdu 3*400 Moving grate
76.19 11.3

37
Foshan Nanhai WTE Plant
Foshan 4*350 Moving grate
55.56 7.9
Foshan Shunde Xingtan Youtan WTE Plant
Foshan 600 Moving grate
31.75 4.8
Hangzhou Jinjiang WTE Plant
Hangzhou 800 CFB N/A 4
4.4.3 Value-added Tax Return
WTE plant is categorized as an environmental protection facility. According to Chinese National
Finance and Taxation (2000) 198 Document, MSW WTE plants are subject to the value-added
tax return policy. The tax is returned at the point of imposition, which causes a 5 million CNY
($0.8 million) tax return income. This tax policy is made by the central government to stimulate
the investment of WTE in China. However, with the WTE market in China getting more and
more mature and commercialized, the grant is expected to be reduced and later totally omitted
in the future according to some market analysis.
5. Financial Analysis The financial analysis in the study is based on the prevailing BOT model for WTE projects in
China. The government grants the right of developing and operating the WTE plant with a series
of favorable policies and supporting infrastructures to the concessionaire for a 30-year period
of time (two years of construction plus 28 years of operation). And the latter is responsible for
the financing, loan repayment, and profit making from the project in the agreed time period.
Two scenarios were investigated in the study: with VAT return and without the return to see
the project’s dependence on governmental participation. For both scenarios, a range of gate
fees are fitted into the analysis to check the profitability as well as the feasibility of the project.
Two financial indicators are used in the study to do the analysis: Net Present Value (NPV) and
Internal Rate of Return (IRR). NPV is an indicator of how much value an investment or project

38
adds to the firm. It can be described as the “difference amount” between the sums of
discounted cash inflows and cash outflows in a certain time period. It compares the present
value of money today to the present value of money in the future, taking inflation and returns
into account. Appropriately risked projects with a positive NPV could be accepted. In financial
theory, if there is a choice between two mutually exclusive alternatives, the one yielding the
higher NPV should be selected (15). The IRR on an investment or project is the "annualized
effective compounded return rate" or "rate of return" that makes the NPV of all cash flows
(both positive and negative) from a particular investment equal to zero. An investment is
considered acceptable if its IRR is greater than an established minimum acceptable rate of
return (MARR). A typical value for MARR is the interest rate for bank loans (16), which is used in
the study. Thus, the MARR equals to 5.94%.
5.1 Scenario I
This scenario assumes that there is no tax return for the project.
The cash flow of the project within the BOT period is listed in table 18. The bank loan cash flows
do not have numerical impact during construction period (the first and second year of the
project) therefore they were not shown in the table.
Table 18 Cash flow for Scenario I
At the beginning of the year
Item Amount (million USD)
1 Investment (without bank loan) -21.2
2 Investment (without bank loan) 0
3 Investment (without bank loan) -0.3
Bank loan repayment -6.4
4-14 Operating expenses -11.2
Bank loan repayment -6.4
Electricity sale 9.8
Gate fee To be determined
15-31 Operating expenses -11.2
Electricity sale 9.8
Gate fee To be determined
From table 18 it can be seen that bank repayment lays a large burden on the project’s operating
finance. Actually in low gate fee situations in the study, the net cash flow for the equity in the
13-year bank repayment period remains negative, indicating a deficit during its operation. A
group of gate fees ranging from $0 to $40 is fitted into the cash flow context to check the

39
profitability of the project. Table 19 and Figure 7 show the relationship between the gate fee
and NPV without VAT return.
Table 19 Relationship between the gate fee and NPV without VAT return
Gate fee (USD)
NPV without VAT return(million USD)
Net cash flow during bank repayment period (million USD)
0 -84.2 -7.8
5 -62.5 -5.9
10 -40.8 -4
15 -19.1 -2.1
20 2.6 -0.2
25 24.3 1.8
30 46 3.7
35 67.7 5.6
40 89.4 7.5
Figure 7 Relationship between gate fee and NPC without VAT return
From the table and the chart it is obvious that gate fee has a significant impact on the
profitability of the project. The horizontal axis intercept for Figure 7 is $19.4; therefore the
project reaches the breakeven point at that rate of gate fee. To ensure the profitability of the
project, a gate fee of $20/ton of MSW or more is required. From table 16, most of the existing
WTE plants whose capital investment is close to or higher than the model plant have a gate fee
higher than $20, indicating a positive economic condition of the plants. For cities that can
-100
-80
-60
-40
-20
0
20
40
60
80
100
0 5 10 15 20 25 30 35 40
NP
V (
mill
ion
USD
)
Gate fee (USD)
NPV without VAT return(million USD)

40
afford less than the amount of gate fee, proper strategies to lower the capital and operating
costs are urged in order not to compromise the adequate operation of the plant.
During the bank repayment period, the net cash flow remains negative until the gate fee
reaches $20.4. Therefore an actual gate higher than that amount is preferred to guarantee the
equity’s healthy capital chain.
Table 20 and Figure 8 show the results of IRR analysis for the project.
Table 20 Relationship between gate fee and IRR without VAT return
Gate fee (USD)
IRR without VAT return
5 -13.6%
10 -3.3%
15 2.07%
20 6.4%
25 10.5%
30 14.3%
35 18%
40 21.6%
Figure 8 Relationship between gate fee and IRR without VAT return
From table 20 and Figure 8 it can be seen that the IRR remains under the MARR (5.94%) until
the gate fee approaches $20, which is consistent with the result for NPV analysis. A higher gate
-15.00%
-10.00%
-5.00%
0.00%
5.00%
10.00%
15.00%
20.00%
25.00%
5 10 15 20 25 30 35 40
IRR
Gate fee (USD)
IRR without VAT return

41
fee around $25 that can bring the IRR to 10.5% is desired to prevent the project from practical
economic risks such as the fast growing inflation rate in economic downturn.
The study also investigated the investment payback period of the suggested gate fee. The result
shows that with a $25/ton MSW gate fee, the investment of the equity is paid back at the 16th
year of operation (18th year of the project).
5.2 Scenario II
This scenario assumes that there is VAT return for the project.
The cash flow of the project within the BOT period is listed in table 21. The bank loan cash flows
do not have numerical impact during construction period (first and second year of the project)
therefore they were not shown in the table.
Table 21 Cash flow for Scenario II
At the beginning of the year
Item Amount (million USD)
1 Investment (without bank loan) -21.2
2 Investment (without bank loan) 0
3 Investment (without bank loan) -0.3
Bank loan repayment -6.4
4-14 Operating expenses -11.2
Bank loan repayment -6.4
Electricity sale 9.8
Gate fee To be determined
Added-value tax return 0.8
15-31 Operating expenses -11.2
Electricity sale 9.8
Gate fee To be determined
Added-value tax return 0.8
Compared with electricity sale, the annual added-value tax return revenue is much less in
amount. However, its impact on financial indicators is still worth to investigate. A group of gate
fees ranging from $0 to $40 is fitted into the cash flow context to check the profitability of the
project in this scenario. Table 22 shows the relationship between the gate fee and NPV with
VAT return.

42
Table 22 Relationship between gate fee and NPV with VAT return
Gate fee (USD)
NPV with VAT return(million USD)
Net cash flow during bank repayment period (million USD)
0 -75.1 -7
5 -53.4 -5.1
10 -31.7 -3.2
15 -10 -1.3
20 11.7 0.6
25 33.4 2.6
30 55.1 4.5
35 76.8 6.4
40 98.5 8.3
Figure 9 shows a comparison of the gate fee-NPV relationship between the two scenarios.
Figure 9 Relationship between gate fee and NPV with and without VAR return
From Figure 9 it can be seen that the VAT return raises the NPV to a certain extent for the same
amount of gate fee and brings the breakeven point leftward on the horizontal axis from $19.4
to $17.3. This means the tax preferential by the central government can help alleviate the
financial burden of WTE on the local government by at least $0.8 million of budget for the
model plant in terms of gate fee expense to reach the breakeven. It stimulates less developed
cities to involve WTE in their waste management system.
During the bank repayment period, the net cash flow starts to be positive when the gate fee
reaches $18.3. This alleviates the financial burden and possible economic risks during the
repayment period.
-100
-80
-60
-40
-20
0
20
40
60
80
100
0 5 10 15 20 25 30 35 40
NP
V (
mill
ion
USD
)
Gate fee (USD)
NPV with VAT return(million USD)
NPV without VAT return (million USD)
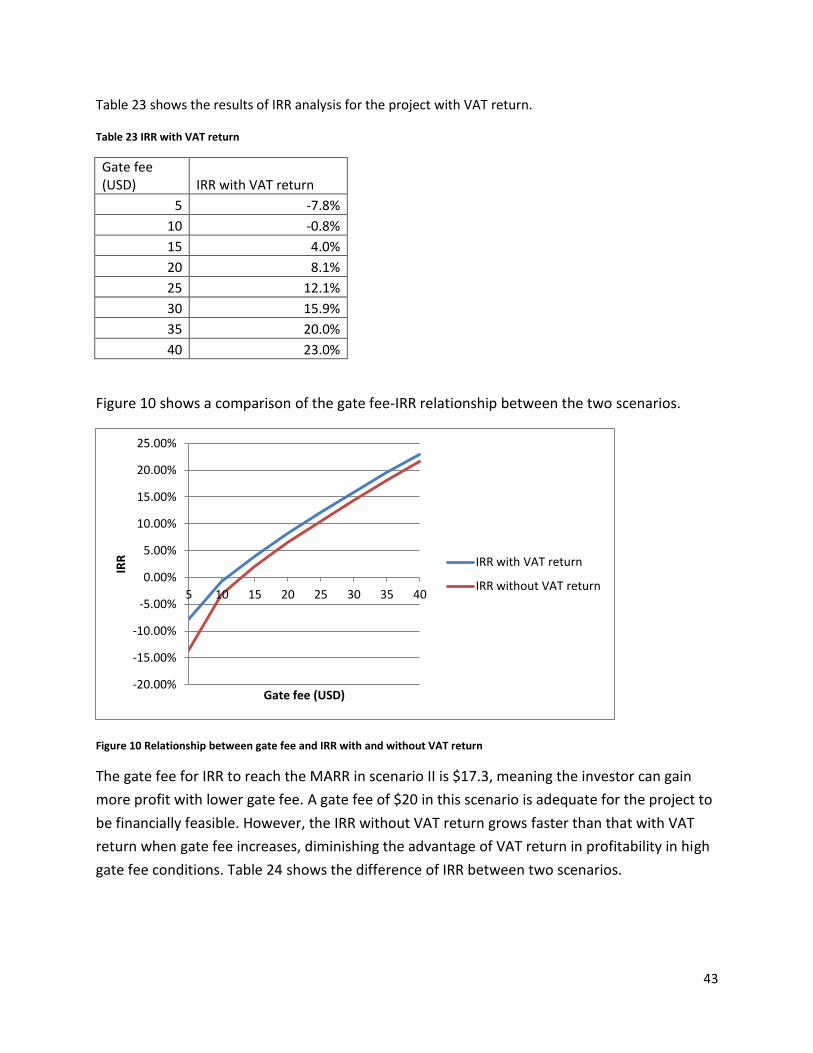
43
Table 23 shows the results of IRR analysis for the project with VAT return.
Table 23 IRR with VAT return
Gate fee (USD) IRR with VAT return
5 -7.8%
10 -0.8%
15 4.0%
20 8.1%
25 12.1%
30 15.9%
35 20.0%
40 23.0%
Figure 10 shows a comparison of the gate fee-IRR relationship between the two scenarios.
Figure 10 Relationship between gate fee and IRR with and without VAT return
The gate fee for IRR to reach the MARR in scenario II is $17.3, meaning the investor can gain
more profit with lower gate fee. A gate fee of $20 in this scenario is adequate for the project to
be financially feasible. However, the IRR without VAT return grows faster than that with VAT
return when gate fee increases, diminishing the advantage of VAT return in profitability in high
gate fee conditions. Table 24 shows the difference of IRR between two scenarios.
-20.00%
-15.00%
-10.00%
-5.00%
0.00%
5.00%
10.00%
15.00%
20.00%
25.00%
5 10 15 20 25 30 35 40
IRR
Gate fee (USD)
IRR with VAT return
IRR without VAT return

44
Table 24 Difference of IRR between two scenarios
Gate fee (USD) IRR (II) - IRR (I)
5 5.85%
10 2.43%
15 1.90%
20 1.70%
25 1.62%
30 1.57%
35 1.51%
40 1.45%
According to table 21, IRR difference between the two scenarios decreases with the increase of
gate fee, which means that the tax preferential does more help for profitability in low gate fee
conditions. This reflects the central government’s intension to assist cities with weaker
economic development to launch WTE projects. Since projects in rich cities with high gate fee
benefit less from the tax subsidy, their dependence on the policy is getting far less with the
maturation of the market. It can be expected that the nationwide VAT return policy will
gradually become a regional one.
The investment payback period of the suggested gate fee ($20) for the scenario is calculated.
The result shows that the investment of the equity can be paid back at the 15th year of
operation (17th year of the project). The VAT return policy reduces the payback time at the
meantime of alleviating the gate fee burden on local government.
6. Conclusions to Part I The current waste management in Chinese cities relies heavily on landfilling. The system is
confronted with low recycling efficiency, lack of landfill space, and severe environmental
problems of composting and landfilling. Therefore WTE should be developed in the system to
move up the “ladder” of sustainable waste management.
On the technical level, Chinese cities are adept to using modern WTE. Imported moving grate
technology dominates the domestic WTE market. The domestic technology—CFB technology,
has much lower capital cost but more complicated processing procedures and environmental
problems. The most common air pollution control system is the combination of semi-dry
scrubber, activated carbon injection, and baghouse filter.

45
One existing WTE plant was investigated in the study for its emission data. It shows that most of
the pollutant emissions of the plant are within the EU 2010 standard. The dioxin emission
reaches 0.0085 TEQ ng/m3 against the 0.1 TEQ ng/m3 for EU standard. NOx emission is higher
than the EU standard value but within the Chinese national standard. A new national standard
to be launched in 2013 will be more strict and closer to the EU standard especially in mercury
and Cadmium emission.
WTE industry is now commercialized in China. BOT model is the prevalent model for WTE
project financing and operating. The model alleviates the economic burden of high capital cost
on the government, which, in return, ensures the profitability of the plant owner through the
concession contract.
The overwhelming support through both the central and local government to WTE stimulates
the rapid development of the industry and guarantees the profitability of the BOT model. The
most important policy supporting WTE is the “grid electricity pricing”, applying specifically to
WTE power by the National Development and Reform Commission. For situations in which
actual electricity generation rate is lower than the 280 kWh/ton of MSW benchmark, the grid
purchasing price is counted as 65 cents CNY ($10 cents) per kWh.
A model plant with 1050 ton/day capacity is considered in the economic analysis. The capital
cost for the plant is $193 annual metric ton of capacity. 70% of the total capital cost is from
bank loan with a repayment period of 13 years.
Several gate fees are tested in the study to see the profitability of the model in two scenarios.
In scenario I (no VAT return), a gate fee of $19.4 breaks even the project finance. A less risky
IRR of 10.5% is reached when the gate fee is $25. In such situation, the total investment can be
paid back at the 16th year of the operation. In scenario II (VAT return), a gate fee of $17.3
breaks even the project. And an IRR of 8.1% is reached when the gate fee is $20. The study
shows that the VAT return policy reduces the budget burden on local government and the
economic risk on the investors, especially local economy is not developed enough to support a
high gate fee.
46
Part II: MSW Sorting Models in China and Potential for Improvement
1. Introduction MSW sorting is the first step of an integrated waste management system. It increases the
recovery of materials and energy from the solid waste stream. As noted in Part I of this thesis,
inadequate MSW sorting in Chinese cities affects recycling and also has impeded the
development of composting and anaerobic digestion, resulting in high moisture food and other
organic wastes going to WTE; this reduces the heating value of the feedstock and increases the
processing cost of the plant. Therefore, better sorting systems can benefit a municipality in
three ways:
a) Reduce landfill space: Due to the lower economic level there is less packaging material in the
MSW and a large fraction consists of food wastes and other biodegradable materials. Diverting
this material to composting or anaerobic digestion facilities will conserve landfill space.
b) Environmental protection: Hazardous waste, e.g., batteries and thermometers contain
hazardous materials such as mercury and cadmium. Since some of the Chinese MSW is
disposed in non-sanitary landfills, these materials can contaminate the local soil and water. Also,
if unsorted MSW goes to WTE plants, the burden on the Air Pollution Control (APC) system is
increased.
c) Resource recovery: According to local newspapers and media, China as a whole generates
around four billion fast food containers, 500 to 700 million instant noodle boxes, and billions of
other disposables, all of which account up to 15% of the MSW. These materials are made from
petrochemicals or paper fiber and have a relatively high heating value. Disposing these wastes
in landfills represents a loss of a valuable resource.
Although governments at all levels have been aware of the importance of MSW recycling and
composting and have launched a series of policies for more than a decade, the implementation
and effectiveness of these policies are still inadequate due to low budgets and public
cooperation. As early as 2000, the National Ministry of Housing and Urban-Rural Development,
from now on referred to as the Ministry, requested Beijing, Shanghai, Guangzhou and five
other cities to practice MSW sorting, i.e., attempt to separate paper, plastics, and hazardous
wastes from the waste stream at the collection point. However, as discussed in the following
sections, twelve years after implementation. This nationwide campaign has been hampered by
several practical problems.
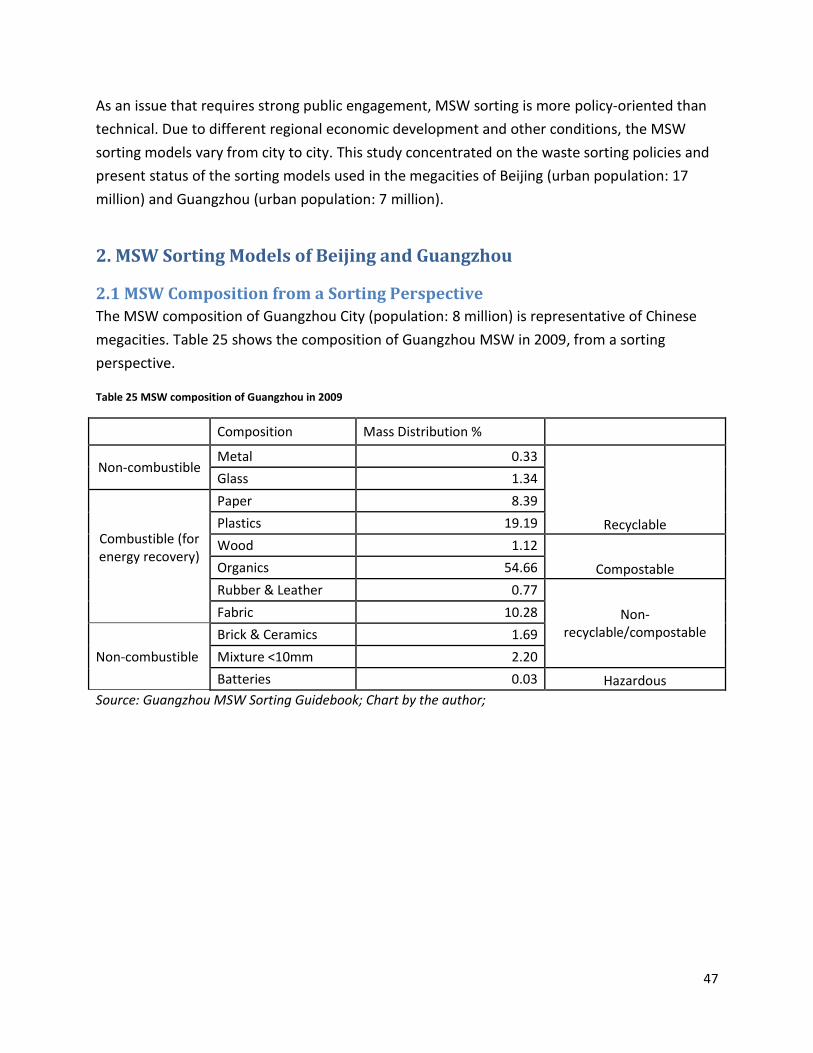
47
As an issue that requires strong public engagement, MSW sorting is more policy-oriented than
technical. Due to different regional economic development and other conditions, the MSW
sorting models vary from city to city. This study concentrated on the waste sorting policies and
present status of the sorting models used in the megacities of Beijing (urban population: 17
million) and Guangzhou (urban population: 7 million).
2. MSW Sorting Models of Beijing and Guangzhou
2.1 MSW Composition from a Sorting Perspective
The MSW composition of Guangzhou City (population: 8 million) is representative of Chinese
megacities. Table 25 shows the composition of Guangzhou MSW in 2009, from a sorting
perspective.
Table 25 MSW composition of Guangzhou in 2009
Composition Mass Distribution %
Non-combustible Metal 0.33
Recyclable
Glass 1.34
Combustible (for energy recovery)
Paper 8.39
Plastics 19.19
Wood 1.12
Compostable Organics 54.66
Rubber & Leather 0.77
Non-recyclable/compostable
Fabric 10.28
Non-combustible
Brick & Ceramics 1.69
Mixture <10mm 2.20
Batteries 0.03 Hazardous
Source: Guangzhou MSW Sorting Guidebook; Chart by the author;
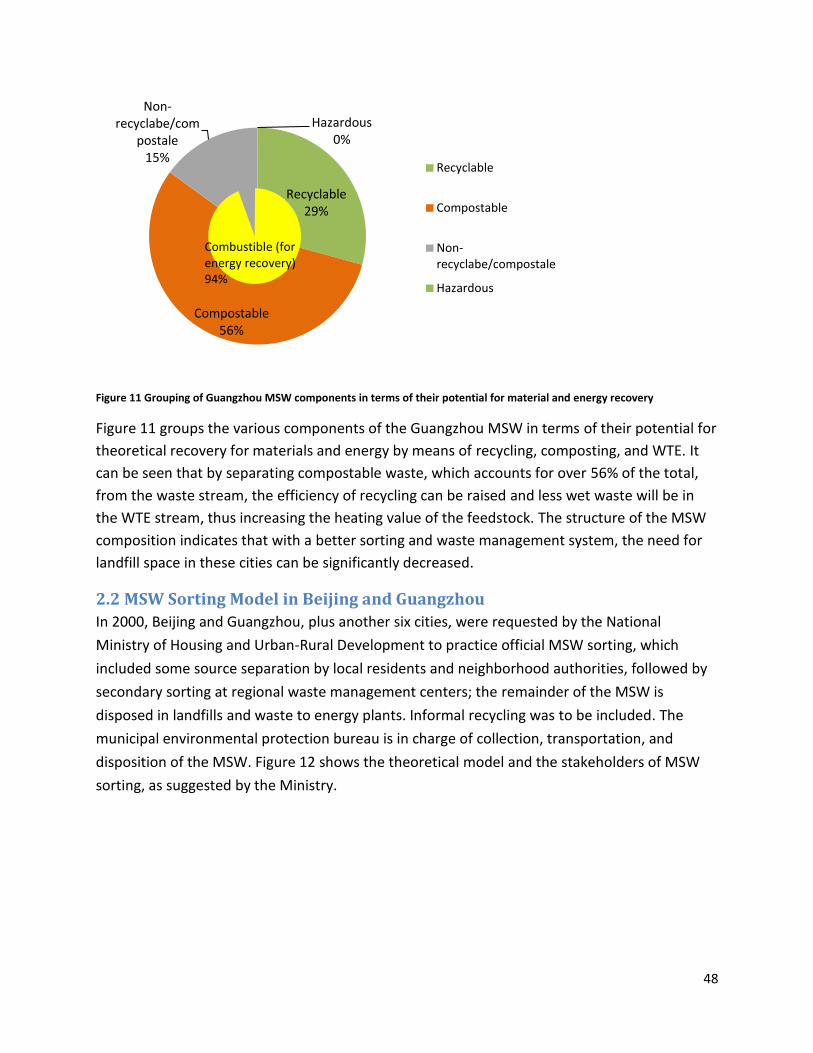
48
Figure 11 Grouping of Guangzhou MSW components in terms of their potential for material and energy recovery
Figure 11 groups the various components of the Guangzhou MSW in terms of their potential for
theoretical recovery for materials and energy by means of recycling, composting, and WTE. It
can be seen that by separating compostable waste, which accounts for over 56% of the total,
from the waste stream, the efficiency of recycling can be raised and less wet waste will be in
the WTE stream, thus increasing the heating value of the feedstock. The structure of the MSW
composition indicates that with a better sorting and waste management system, the need for
landfill space in these cities can be significantly decreased.
2.2 MSW Sorting Model in Beijing and Guangzhou
In 2000, Beijing and Guangzhou, plus another six cities, were requested by the National
Ministry of Housing and Urban-Rural Development to practice official MSW sorting, which
included some source separation by local residents and neighborhood authorities, followed by
secondary sorting at regional waste management centers; the remainder of the MSW is
disposed in landfills and waste to energy plants. Informal recycling was to be included. The
municipal environmental protection bureau is in charge of collection, transportation, and
disposition of the MSW. Figure 12 shows the theoretical model and the stakeholders of MSW
sorting, as suggested by the Ministry.
Recyclable 29%
Compostable 56%
Non-recyclabe/com
postale 15%
Hazardous 0%
Recyclable
Compostable
Non-recyclabe/compostale
Hazardous
Combustible (for energy recovery) 94%

49
Figure 12 Theoretical process and stakeholders of MSW sorting, as recommended by the Ministry
As shown in Figure 12, the key stakeholders are designated to be the local residents and
regional/neighborhood infrastructures. Mechanical technologies are to be introduced into the
process to improve the efficiency of sorting.
Since 2000, the municipal governments of the two cities under study have spent a huge amount
of money in purchasing collection trucks, sorting trash bins, sorting trash bags, and food waste
processing equipment. A series of regulations and compulsory measures were also put in place
to support this practice. However, the actual models practiced in different cities are different
from the “ideal” model for various reasons. This section discusses the sorting models used in
Beijing and Guangzhou. The remaining problems are discussed in Section 3.
2.2.1 The Beijing MSW Sorting Model
Since 2000, the Beijing municipal government has launched a series of various means and
expenditures to support MSW sorting. During 2007 to 2009, the focus of MSW sorting was
shifted from residents to waste management companies, thus relying more on concentrated
processing downstream the curbside collection: The curbside sorting streams were reduced
from four (plastics, metals, paper, and “trash”) to three (food waste, recyclables, and “trash”).
Since 2009, the curbside sorting by citizens was simplified to two streams: wet and dry waste.
However, in practice, there is little source separation at curbside, with the exception of
informal recycling. The principal actors in the present sorting system in Beijing are informal
Informal recycling sector by scavengers
Waste generation
Curbside sorting by Local residents
Primary manual sorting by Neighborhood cleaning staff
Mechanical sorting by regional waste management center
Secondary manual sorting by regional sorters
Disposition to landfills/WTEs
Theoretical Key Stakeholders in MSW Sorting

50
sector Recyclers (scavengers) and regional waste management stations that receive most of the
city’s MSW before any sorting is done. Figure 13 shows the overall sorting system currently in
practice.
Figure 13 Practical process and stakeholders of MSW sorting in Beijing
The blue dashed arrow in the chart denotes a loose bonding between two stakeholders and the
red dashed boxes denotes weakly implemented items. Informal recyclers and regional waste
management centers are the main stakeholders in such a system. The regional waste
management center is designed to further sort recyclables from the incoming MSW and then
send the rest to landfills and waste-to-energy plants. However, due to the practical difficulties
in sorting mixed MSW, in practice the centers are now only acting only as a transition center
between curbside and terminal processing facilities.
In addition to the national initiatives, the local municipality has implemented a number of
policies and regulations attempting to strengthen the city’s MSW sorting. These policies have
been changed over the years and reflect the evolving trend for MSW sorting during that period.
Table 26 shows the local policies and regulations and their functions regarding MSW sorting.
Informal recycling by scavengers
Waste generation
Curbside sorting by local residents
Primary manual sorting by Neighborhood cleaning staff
Mechanical sorting by regional waste management center
Secondary manual sorting by regional sorters
Disposition to landfills/WTEs
Practical Key Stakeholders in MSW Sorting
Weakly implemented
Weakly implemented

51
Table 26 Beijing policies regarding MSW sorting
Policy/Regulation Year Function
The Announcement for Implementation of MSW Sorting in Collection and Disposition (18)
2003 Regulated that MSW in residential areas be roughly sorted into four categories and food waste be composted in-situ;
Implementation Proposal for the Pilot Plan for Industrialization of Beijing Renewable Resource Recovery System (19)
2006 To enhance the cooperation between government environmental protection resources and social recycling resources;
Implementation Proposal for Beijing Eleventh Fifth year MSW Treatment Infrastructure Construction Plan (20)
2007 To increase the promotion of source separation of MSW; Install sorting equipment in regional waste management center to shift from dispersed source separation to concentrated regional sorting;
Suggestions for a Complete Improvement of MSW Treatment (21)
2009 Set a clear goal for MSW source reduction and sorting: a 50% sorting adequacy rate in 2012 and a 65% sorting adequacy rate in 2015; a zero increase in MSW generation in 2015;
A review of the policies implemented in Beijing showed that special attention was paid to food
waste. In fact, the city’s MSW sorting strategy was designed to maximize the recovery of food
waste. District government was encouraged to set aside specific budgets to subsidize
composting facilities in various neighborhoods to dispose food waste on site (18). The trend
was consistent with the city’s initiative to shift its waste management system from landfilling to
a WTE dependent model with the assistance of composting and some landfilling. The ratio of
MSW to WTE, composting, and landfilling is expected to change from 2:3:5 in 2012 to 4:3:3 in
2015 (21).
Various social resources are expected to be involved in the MSW sorting process. The main
social resources are informal recyclers and waste management companies. In one of the pilot
neighborhoods, waste management companies were encouraged to integrate local informal
recyclers (scavengers) into their recycling business.
The actual result of the model for the city’s waste management is a high rate of harmless
treatment (97%), which includes sanitary landfill, composting, and WTE, but low rate of
recycling. The harmless treatment stream is dominated by sanitary landfill (73%) (1), because of
the poor source separation. Table 27 shows the city’s capacity for harmless treatment.
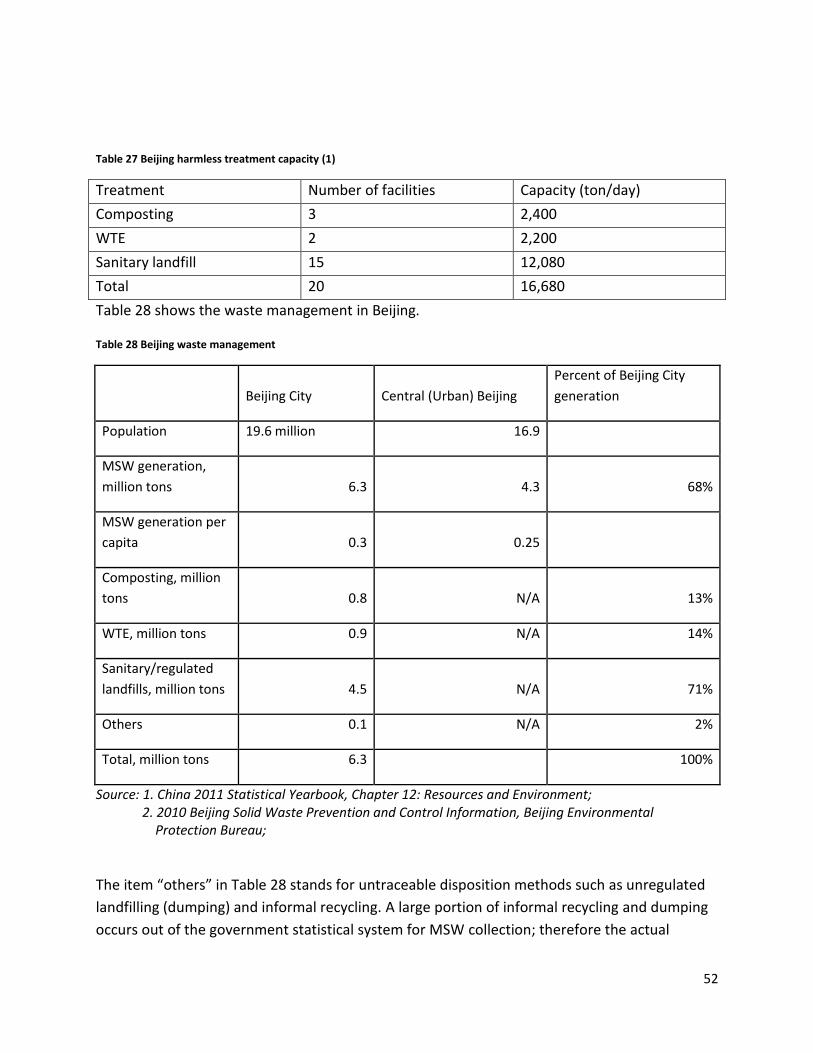
52
Table 27 Beijing harmless treatment capacity (1)
Treatment Number of facilities Capacity (ton/day)
Composting 3 2,400
WTE 2 2,200
Sanitary landfill 15 12,080
Total 20 16,680
Table 28 shows the waste management in Beijing.
Table 28 Beijing waste management
Beijing City Central (Urban) Beijing
Percent of Beijing City
generation
Population 19.6 million 16.9
MSW generation,
million tons 6.3 4.3 68%
MSW generation per
capita 0.3 0.25
Composting, million
tons 0.8 N/A 13%
WTE, million tons 0.9 N/A 14%
Sanitary/regulated
landfills, million tons 4.5 N/A 71%
Others 0.1 N/A 2%
Total, million tons 6.3 100%
Source: 1. China 2011 Statistical Yearbook, Chapter 12: Resources and Environment; 2. 2010 Beijing Solid Waste Prevention and Control Information, Beijing Environmental Protection Bureau;
The item “others” in Table 28 stands for untraceable disposition methods such as unregulated
landfilling (dumping) and informal recycling. A large portion of informal recycling and dumping
occurs out of the government statistical system for MSW collection; therefore the actual

53
tonnage for this item is expected to be greater than the official number. The amount of formal
recycling is negligible due to the low source separation nature of the model.
2.2.2 Guangzhou MSW Sorting Model
Guangzhou is the first city in China to make MSW sorting mandatory. The Temporary MSW
Sorting Management Regulation, issued in February 2011, imposes a fine of at least 50 RMB
(7.9 USD) on each violator, and at least 500 RMB (79 USD) per cubic meter of MSW, on each
organization. This regulation came into effect in April, 2011 and aims to building up a
comprehensive waste sorting system. As of now, the only step that residents are expected to
do is to separate their MSW into “dry” and “wet”; the municipal sanitation staff is responsible
for collecting these two streams and sorting the dry stream into recyclable materials using the
appropriate equipment (22). As the campaign goes on, according to the Guide Book of MSW
Sorting in Guangzhou, residents are expected to sort the MSW into four streams: Recyclable,
non-recyclable, hazardous waste, and ”trash”. Compared to Beijing, Guangzhou emphasizes
more on curbside/resident MSW sorting than concentrated processing facilities. Figure 14
shows the practical process and stakeholders of MSW sorting in Guangzhou.
Figure 14 Practical process and stakeholders of MSW sorting in Guangzhou
Figure 14 shows that apart from local residents and the neighborhood cleaning service, waste
management companies play a key role between the neighborhood and the landfills and waste-
Informal recycling by scavengers
Waste generation
Curbside sorting by local residents
Primary manual sorting by Neighborhood cleaning stuff
Mechanical sorting by regional waste management center
Secondary manual sorting by regional sorters
Disposition to landfills/WTEs
Practical Key Stakeholders in MSW Sorting
Weakly implemented
Other non-food sorting by waste management companies

54
to-energy.. Unlike the Beijing model, where waste management companies have an auxiliary
role, the Guangzhou model embeds these companies in the sorting system. Informal recyclers
(scavengers) are not considered to be stakeholders in this model, since better management is
applied to curbside/neighborhood collection.
On the policy level, Guangzhou’s sorting policies and regulations are stricter with individual and
organization non-compliance. Table 27 shows the policies and regulations regarding MSW
sorting in Guangzhou.
Table 29 Guangzhou policies regarding MSW sorting
Policy & Regulation Year Function
MSW Sorting Evaluation Standard (23)
2004 Categorized and defined MSW into six streams: recyclable, bulk waste, compostable, combustible, hazardous waste, and others; standardized the MSW sorting collection bin; Gave mathematical methods to quantify sorting efficiency;
Working Plan for MSW Sorting and Collection
2004 Gave a more applicable way of categorization in residential areas, which includes recyclable, bulk waste, hazardous waste, food waste, and others;
Temporary MSW Sorting Management Regulation (24)
2011 Made MSW sorting mandatory and applied economic punishment against violation;
Apart from the policies and regulations listed in table 24, the city has a series of auxiliary
standards and regulations for the sorting containers, encouraging resident participation, etc..
The most thorough and practical guide is the Guidebook of MSW Sorting in Guangzhou. All of
these policies intend to enhance the source separation of the MSW, which can facilitate the
downstream processes.
Social resources such as waste management companies in Guangzhou usually work closely with
neighborhood authorities and customize sorting strategies according to the features of the
service area. These companies are responsible for purchasing sorting equipment and providing
collecting/sorting staff who work with the local neighborhood office. The companies gain profit
from the management fees paid by the neighborhood and by selling the sorted recyclables. The
model reduces direct investment into the sorting facilities and labor by the neighborhood and
builds an easy channel between curbside recyclables and the recyclable demanding market.
The model’s emphasis on public involvement and commercialization results in a high recycling
rate (33%), as reported in official statistics (29). The “harmless treatment” rate (92%) is not as
high as that of Beijing (97%) Table 30 shows how the means of Guangzhou’s harmless
treatment system (22).

55
Table 30 Guangzhou harmless treatment capacity (22)
Treatment Number of facilities Capacity (ton/day)
Composting 0 0
WTE 1 1040
Sanitary landfill 5 9800
Total 6 10840
Table 31 shows the waste management in Guangzhou (22). The data of Beijing was also
included in order to compare the waste management system of both cities.
Table 31 Guangzhou waste management (22)
Guangzhou City Beijing City
Central (Urban) Guangzhou
Percent of Guangzhou City generation
Percent of Beijing City generation
Population 12.7 million 19.6 million 7.7 million
MSW generation, million tons 6.5 6.3 3.6 55% 68%
MSW generation tons per capita 0.5 0.3 0.5
Recycling 2.1 Negligible NA* 33% 0%
Composting, million tons 0 0.8
NA
0% 13%
WTE, million tons 0.4 0.9 NA 6% 14%
Sanitary/regulated landfills, million tons 3.6 4.5
NA
55% 71%
Others 0.4 0.1 NA 6% 2%
Total, million tons 6.5 6.3 100% 100%
Source: 1. Guangzhou Statistical Bureau: Guangzhou 2011 Statistical Yearbook 2. Bulletin of Sixth Guangzhou Census, 2010 3. Guidebook for Guangzhou MSW Sorting *NA: Not available
The item “Others” in Table 31 consists of illegal dumping and a small amount of informal
recycling. The high rate of recycling (2.1 million tons or 33% of the MSW)reported by
Guangzhou results in calculating a lower rate of landfilling (55%) than Beijing (71%). However,
Table 25 showed that all the potential recyclable materials (metal, glass, paper, and plastics)
amount to a total of 29.25%. It was not possible in this study to verify the “2.1 millions of

56
recycling” by tracing the actual tonnages of sorted materials that reached the recycling market.
Nevertheless, the recycling program of Guangzhou is indeed impressive and could be improved
further, as discussed in the following section.
3. Existing Problems Generally speaking, the whole process of MSW treatment is characterized by overwhelming
government involvement—other stakeholders, such as the public and waste management
companies, play a much smaller role in planning, implementing, and managing the system than
the local environmental protection bureau.. This lack of stakeholder interaction results in
passive condition throughout the whole chain of waste management. Local residents accept the
unilateral policy and sorting guidance passively, while the governmental agency adjusts the
collecting manner according to the negative reaction from the residents, and the initial plan is
compromised. Therefore, most MSW sorting programs in Chinese cities suffer from low
efficiency. Four main problems of MSW sorting are discussed in this section.
3.1 Poor Public Participation
Since a large portion of regulations and policies are made from the government’s point of view,
public awareness of MSW sorting and participation are underdeveloped. Despite the wide
media coverage of waste sorting and punitive measures, residents are still not used to
practicing sorting in their daily life. Since people seldom separate the household garbage in
their home, curbside and neighborhood sorting bins are just belated actions. Figure 15 is a
picture taken in one neighborhood that suffers from poor public participation.
Figure 15 Picture of sorting bin (left side for non-recyclables and right for recyclables)

57
Although Guangzhou model has made it mandatory for MSW sorting and fines are imposed on
violation, the implementation of such an aggressive is still under question due to the lack of
monitoring mechanism. It is impossible for neighborhood offices to check the garbage sorting
practice for every single household, so actually only organizations and companies have been
fined for unsorted garbage disposal.
3.2 Lack of Standardized Practice
Although guidance such as the MSW Sorting Evaluation Standard (23) has been issued for a
couple of years, sorting categorization and facilities still vary from block to block. Even in the
same neighborhood, sorting collection bins can have various combinations and styles in
different residential areas. This imposes huge pressure and labor on waste collection and
downstream sorting. Due to different sorting standards in various areas, waste content in
different category bins varies from area to area. On the other hand, in many cities only one
agency, the local environmental protection bureau, is responsible for the collection and
processing of MSW with uniformed vehicles and facilities. Therefore, many times it is nearly
impossible for the agency to sort waste from a number of combinations of categories. The
result for that confusion is poor sorting efficiency. The Beijing model described earlier is the
main victim of this kind of problem. On the contrary, the Guangzhou model can solve part of
the problem because of its stronger company involvement. In order to maximize the profit,
companies are more likely to customize the sorting and collecting style according to different
areas. However, the Guangzhou model is not flawless. The following problem is usually
discovered in the sorting systems of other cities.
3.3 Low Profitability
Profitability is the driving force to involve social resources in MSW sorting. However, high
processing cost and low economic return has made sorting less attractive. For example, In
general, companies are required to purchase equipment such as food waste shredders;
however, due to the currently low composting capacity and lack of market for the compost
product, the equipment is operating under low load. Furthermore, because of the inadequate
curbside/resident sorting mentioned above, the quality of the feedstock to this equipment
varies widely.. This increases the labor and maintenance cost for the sorting facility. As a result,
the recycling service industry is actually shrinking in some cities in China. For example, in 1965,
there were more than 2,000 recycling centers in Beijing; however, now there are less than 16
(26).
3.4 Poor Working Conditions for Informal Recyclers
The informal recycling sector in Chinese cities plays a very important role in diverting the MSW
from landfill and recover valuable content. It has also provided working positions for a number

58
of jobless people. For example, there are over 50,000 informal recyclers in Beijing; an estimated
30,000 recycle plastics, paper, and metals, while 20,000 deal with food waste. Through a rough
calculation, this garbage-picking army can save the municipal government almost a billion CNY
in MSW disposal costs per year (26). However, along with its impressive digesting ability, the
Chinese informal recycling sector has also caused a number of human health and urban
sanitation problems. The disorganized garbage pickers are distributed through the whole MSW
treatment process, from curbside/neighborhood garbage bin to landfill sites. In order to get
valuable materials from the neighborhood garbage bins, the scavengers sometimes tear the
sealed trash bags or even break the trash bins, which cause severe odor and leachate problems.
The garbage pickers around regional MSW centers and landfills work in miserable hygiene
conditions and without adequate health protection equipment.. On the food waste side, due to
the lack of official or regulated agency to accept the waste from the informal sector, usually the
recovered food waste is used to produce swill oil and sold to some restaurants at a much lower
price than clean oil. The dregs are then dumped at illegal sites. Therefore, the informal recycling
sector in China, if not regulated and organized, will continue to be a contributor to the city’s
sanitation troubles. The Beijing theoretical model may be improved by integrating these
disorganized “garbage pickers” into the formal recycling system and providing them with much
better e working and living conditions. Figure 16 shows a group of garbage pickers waiting for
the waste to be discharged from a collection truck at a landfill.
Figure 16 Garbage pickers in a landfill Source: HDWIKI Image,
http://tupian.hudong.com/11249/4.html?prd=zutu_thumbs

59
4. MSW Sorting Experience of Developed Countries
MSW sorting is a case-by-case issue that depends on the community’s waste composition,
population density, waste management budget, etc. Countries and regions successful in waste
sorting have customized the sorting strategy according to their particular condition. Table 28
shows the MSW sorting strategy of some developed countries and regions.
Table 32 MSW sorting strategy for some developed countries (27)
Country Strategy & Highlights
U.K.
1. Every household has three garbage bins for
food and yard waste, cans and bottles, and
others;
2. Different trucks come to the household
weekly to transport three kinds of garbage to
local sorting centers separately;
3. Local sorting centers further sort the
garbage into 42 kinds of recyclables;
South Korea 1. Specific trash bags are applied to different
kinds of garbage;
2. Particular time and place is determined for
household trash collection;
Japan 1. Every household has to sort the garbage
into more than 10 categories according to
standard sorting table;
2. Government assigned trash bags are used
to place different garbage;
3. Different weekdays are assigned for
different kinds of garbage;
France 1. Strict law for waste sorting;
2. Special attention is paid to waste packaging
materials, which results in a 80% recycling rate
for packaging;
Australia 1. Every household has three garbage bins in
red, yellow, and green for yard waste,
recyclables, and others respectively;
2. Garbage should be sent to designated
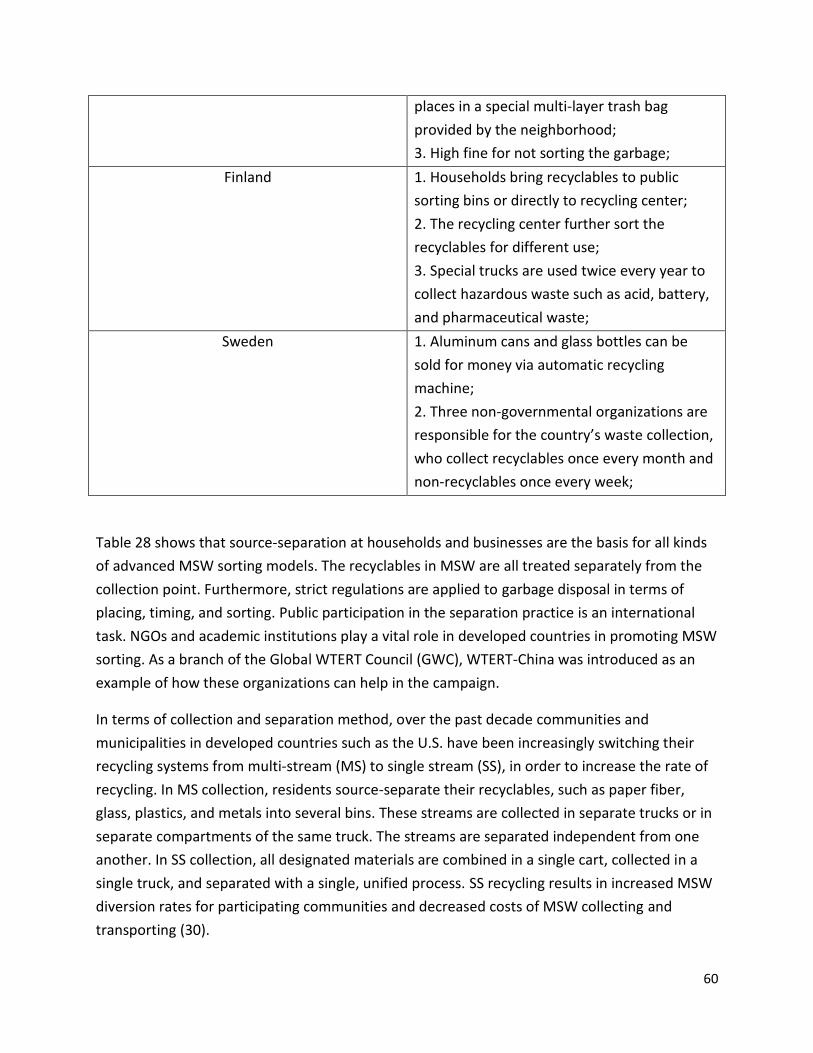
60
places in a special multi-layer trash bag
provided by the neighborhood;
3. High fine for not sorting the garbage;
Finland 1. Households bring recyclables to public
sorting bins or directly to recycling center;
2. The recycling center further sort the
recyclables for different use;
3. Special trucks are used twice every year to
collect hazardous waste such as acid, battery,
and pharmaceutical waste;
Sweden 1. Aluminum cans and glass bottles can be
sold for money via automatic recycling
machine;
2. Three non-governmental organizations are
responsible for the country’s waste collection,
who collect recyclables once every month and
non-recyclables once every week;
Table 28 shows that source-separation at households and businesses are the basis for all kinds
of advanced MSW sorting models. The recyclables in MSW are all treated separately from the
collection point. Furthermore, strict regulations are applied to garbage disposal in terms of
placing, timing, and sorting. Public participation in the separation practice is an international
task. NGOs and academic institutions play a vital role in developed countries in promoting MSW
sorting. As a branch of the Global WTERT Council (GWC), WTERT-China was introduced as an
example of how these organizations can help in the campaign.
In terms of collection and separation method, over the past decade communities and
municipalities in developed countries such as the U.S. have been increasingly switching their
recycling systems from multi-stream (MS) to single stream (SS), in order to increase the rate of
recycling. In MS collection, residents source-separate their recyclables, such as paper fiber,
glass, plastics, and metals into several bins. These streams are collected in separate trucks or in
separate compartments of the same truck. The streams are separated independent from one
another. In SS collection, all designated materials are combined in a single cart, collected in a
single truck, and separated with a single, unified process. SS recycling results in increased MSW
diversion rates for participating communities and decreased costs of MSW collecting and
transporting (30).

61
5. Discussion and Conclusions
As noted in the previous sections of this Report, both the Beijing and Guangzhou models are
experiencing low public participation, lack of standardized practice, insufficient economic
incentives for participating companies, and poor working conditions for informal recyclers. The
statistical data show that the sorting model of Guangzhou is superior in terms of its potential to
increase recycling and advance sustainable waste management. The results of this study have
shown that this potential can be attained by implementing the following measures:
5.1 Enforcing Source Separation
Based on the foreign and the author’s study, there must be source separation of designated
materials (.e.g., paper fiber, metals, marketable types of plastics and glass, and hazardous
wastes) at residences and business. Whenever the recyclables are mixed with the trash in
households, it is almost impossible to separate them in later processes. Single stream collection
and separation, which requires the residents only to separate the MSW into recyclables and
non-recyclables, was suggested by the author, because it increases diversion rates of MSW in
households and simplifies MSW collection and transportation. Furthermore, China’s
inexpensive labor costs reduce the expenses in sorting recyclables in materials recovery
facilities (MRF).
5.2 Enhancing Public Participation
5.2.1 Improve the Communication Channel
A large portion of inadequate implementation results from poor public-government
communication. In order to boost MSW sorting, a lot of municipal governments in China take a
very aggressive measure or simply duplicate successful experience from developed countries,
without taking into account the level of public awareness, economic conditions, , etc. This can
result in public unwillingness to do household sorting. Residents have no initiative to spend
extra effort and money on separating their daily output when imposed a series of to-dos by the
local government. Therefore it is suggested that each neighborhood should hold hearings when
designing the area’s MSW sorting policy. Online feedback section should be established during
the practice of the policy to improve it iteratively. On the meanwhile, every building should
have a resident sorting observer to timely report the sorting condition to the neighborhood
authorities.
5.2.2 Establishing Incentives and Disincentives
Reward should go along with punishment in a mature system. In China’s current condition,
punishment without adequate monitoring will only result in illegal avoidance. The study

62
suggests that local government link the monthly waste disposal fee with the household’s level
of sorting adequacy. The Swedish experience for cans and bottles recycling can be introduced
after modification. Each neighborhood can have a recycling center which accepts major
recyclables from households, which, in return, get certain credits for the amount they provide
and later apply them to the waste disposal fee.
5.3 Providing Standard Sorting Equipment
According to the experience from developed countries, the most effective way for household to
have adequate waste sorting is to provide them with standard garbage bins and trash bags. The
increase in the budget can be offset by the decrease in sorting labor in regional MSW
processing centers and the sorting efficiency can be significantly increased.
5.4 Integrating Sorting and Recycling Market
The sorting, collecting, recycling, and terminal treatment of the MSW stream should be an
integrated system. An adequate sorting mechanism is to be supported by a well-shaped
recovery market to digest the sorted materials. Government should play an important role in
forming the market, since under-regulated companies and informal sector are only extracting
commodities with immediate value in the MSW stream while dumping the rest because of the
high disposal cost. Several suggestions are put forward in the study:
a) Set Separate Collection and Transportation Strategy for Sorted MSW
Local environmental authority should be responsible for organizing different governmental
agencies and waste management companies to deal with various kinds of sorted waste. Sorted
MSW should be transported with separate vehicle in different times.
b) Setup Special Place for Secondary Sorting
According to the current condition in Chinese cities, it is nearly impossible to have as detailed a
household MSW sorting level as Japan do. Therefore secondary sorting is necessary in every
neighborhood to further separate roughly sorted MSW from households. The secondary sorting
center should be co-managed by environmental protection agency, recycling agencies, and
waste management companies. The environmental protection agency or other MSW collection
entities are responsible for the input to the center while the waste management companies are
dedicated to the output of the center.
5.5 Developing NGOs and Academic Institutions
NGOs and academic institutions play a vital role in issues which involve both the government
and companies. They help monitor the decision-making process and transfer the opinion from
the bottom to the top and vice versa. By education programs and online publications, third-

63
party organizations improve the public awareness for MSW sorting and visualize the result of
sorting.
Due to their better public credibility, third-party organizations have already been active in all
kinds of environmental issues by conducting public opinion polls and organizing education
activities. Generally speaking, third-party organizations can facilitate MSW sorting in two ways:
convey public opinions to the policy-makers so as to enhance a public-oriented strategy; and
popularizing MSW sorting knowledge so as to improve public acceptance and initiative.
5.6 WTERT-China as Part of the Sorting Campaign
As a non-governmental, non-profit organization, WTERT’s mission is to identify the best
available technologies for dealing with various waste materials, conduct additional academic
research as required, and disseminate this information by means of publications, the WTERT
webpages, and periodic meetings (28). The Global WTERT Council consists of several national
organizations. WTERT-China is devoted to upgrading the country in the hierarchy of sustainable
waste management, by increasing recycling, composting and waste to energy and ensuring that
the rest of the MSW is deposited in sanitary landfills.
5.6.1 WTERT-China Organization
Due to the country’s vast territory and varied regional economic development, WTERT-China at
this time does not have a single base of operations. The two academic groups involved in
WTERT-China are Zhejiang University (ZJU) in the city of Hangzhou and Chongqing University of
Science and Technology (CQUST) in Chongqing City. ZJU is the top research institution in China
on thermal treatment technologies and is home to one of the National Dioxin Laboratories.
CQUST is closer to industry and has a cooperation relationship with Covanta, a major U.S. WTE
company. Meanwhile, Tongji University (TJU) in Shanghai is also in contact with WTERT in areas
of sustainable waste management. TJU is the leading university of waste management in
Shanghai and has contributed a lot to the regular testing, assessment, and improvements to the
existing two WTE plants in Shanghai.
At this stage, WTERT-China is still in its starting period and a network needs to be built
connecting as many as possible academic groups who are engaged in waste management
research in China. The ZJU WTERT website has been built and there are plans to improve it
(http://wtert.zju.edu.cn/cn/index.asp). Figure 17 shows the homepage of WTERT-China Website (ZJU
Sector).

64
Figure 17 WTERT-China (ZJU Sector)
5.6.2 WTERT-China Sorting Consideration
As mentioned in the introduction section of Part II, MSW sorting is the very basis of adequate
WTE and recycling. Therefore WTERT-China should also try every possible means for improving
the upstream conditions, before the post-recycling MSW reaches the WTE plants.
5.6.3 WTERT-China Website Improvement
Currently, WTERT-China’s website focuses only on WTE rather than the whole hierarchy of
sustainable waste management. It is necessary that the website expands its coverage to other
waste management technologies and setup a special section of MSW sorting knowledge for
public education. According to the current condition in China, the public has much higher
acceptance of recycling than the other means of waste management, while they are not aware
of the complementary role that WTE plays in developed countries, thus reducing landfilling.
Therefore, the WTERT-China websites can contribute much in explaining the hierarchy of
sustainable waste management and emphasize the importance of MSW sorting to all kinds of
technologies, including WTE.

65
For example, It is important for the public to know where the sorted streams are going.
Therefore, it is suggested that the WTERT-China websites provide a flow chart for all kinds of
sorted MSW, from curbside collection to terminal facility and keep it updated according to new
policies and measures. Figure 18 shows a snapshot from WTERT-US website about resource
recirculation.
Figure 18 Resource recirculation from WTERT website
5.6.4 Public Education Program
Since it is based at top academic institutions working on waste management issues, WTERT-
China can take full advantage of the academic resource it has and the high credibility of non-
governmental organizations to conduct education campaigns that popularize waste
management technologies with an emphasis on the role sorting plays in them. For example, the
various parts of WTERT-China can cooperate with local government in setting up sorting
knowledge lectures in neighborhoods and help design and distribute instructive brochures for
residential waste management. University students can be involved in designing the waste
management strategy under professors’ instruction to convert the fruits of academic research
to practical use. Outstanding design and neighborhood performance in waste management can
be rewarded by means of an annual prize.

66
Currently, most neighborhood lectures about sorting are hosted by sub-district or
neighborhood offices. The instructors are usually office staff who have just gained the relevant
knowledge from upper level meetings. This prevents the instructors from conveying the very
essence of the knowledge to the residents since they themselves are new learners. WTERT-
China can take the responsibility of co-hosting the neighborhood lectures and have experts and
outstanding students be lecturers.
5.6.5 Organizing Nationwide Academic Efforts
Successful experience of other WTERT branches shows that it is of great significance to
integrate the existing academic efforts in the country so as to provide advice to policy-makers
from a scientific perspective. A network of Chinese waste management academic institutes can
be built to facilitate contact and cooperation. ZJU, as a top academic institution in waste
management technologies, can take advantage of its nationwide influence to start the network.
A nationwide waste management summit can be organized on a regular basis to exchange ideas.
According to the author’s review, there is no professional waste management magazine in
China currently. It is suggested that WTERT-China try to coordinate national academic resources
to form an editor group and publish the latest waste management technology and progress.
Such a journal could be called “Waste Management and Research in China”.
References: 1. National Bureau of statistics of China, “China 2011 Statistical Yearbook”,
http://www.stats.gov.cn/tjsj/ndsj/2011/indexch.htm (2012).
2. Nickolas J. Themelis and Saman Reshadi, 2009, “Potential for Reducing the Capital Costs of
WTE Facilities”: the 17th Annual North American Waste-to-Energy Conference (2009).
3. Kalogirou, Efstratios, “Technical Report from Visit in China, 20-26 August 2011”: Earth
Engineering center, http://www.columbia.edu/ (2011).
4. Guangzhou Nightly Newspaper, Jul. 28th, 2011
http://news.163.com/11/0728/14/7A2C56SM00014AED.html (2011).
5. Wang Jiuliang, 2011, “Film Beijing Besieged by Waste” (2011).
6. Huizhou City Price Bureau, 2006, “Report for Huizhou City MSW Disposal Cost Audit” (2006).
7. Fenghuang News, May, 2010, “The Cost for MSW Disposal”,
http://finance.ifeng.com/stock/roll/20100507/2159014.shtml (2010).
8. Shi Dongxiao, Zhang Xiaoyi, Chen Yiqin, Ding Yuping, Lu Qing, 2012, “Cost Analysis and
Control of Domestic Waste Landfill Treatment: Taking Changzhou Domestic Waste Treatment

67
Center as an Example”: Changzhou Domestic Waste Treatment Center, Changzhou
Environmental Sanitation Management Office, Environmental Sanitation Engineering, Vol. 20
No.1 (2012).
9. Ning Ping, 2007, “Chapter 6: Thermal Treatment of Solid Waste, Solid Waste Disposal and
Treatment”, China Higher Education Press (2007).
10. Dezhen Chen and Thomas H. Christensen, 2010, “Life-cycle Assessment of Two Municipal
Solid Waste Incineration Technologies in China”, Waste Management & Research 0(0) 1-12
(2010).
11. Ministry of Environmental Protection, 2011, “GB 18485-20XX National Standard for
Pollution Control on the Municipal Solid Waste Incineration” (Exposure Draft) (2011).
12. PPPIRC, March 13, 2012, “Concessions, Build-Operate-Transfer (BOT) and Design –Build-
Operate (DBO) Projects”, http://ppp.worldbank.org/public-private-
partnership/agreements/concessions-bots-dbos (2012).
13. 国家发展改革委关于完善垃圾焚烧发电价格政策的通知,发改价格[2012] 801 号,
http://www.sdpc.gov.cn/zcfb/zcfbtz/2012tz/t20120410_472395.htm (2012).
14. Unreleased source, “Tianjin Shuanggang WTE Project Construction Design”,
http://www.docin.com/p-41816966.html
15. John R. Canada, et al, 2005, “Capital investment analysis for engineering and management
3rd Edition”: Upper Saddle River, NJ: Pearson Prentice Hall (2005).
16. Lang, Hans J, Merino and Donald N, 1993, “The selection process for capital projects, New
York”: J. Wile & Sons (1993).
17. Qu Xiaoyan, et al, 2009, “Beijing MSW Sorting Mechanism”: Environmental Pollution and
Prevention, 2009, 31(5).
18. Office of Beijing Municipal Government, http://law.solidwaste.com.cn/view/id_450 (2002).
19. Beijing Municipal Commission of Commerce,
http://www.bjcoc.gov.cn/zwgk/jcjzdsx/201008/t20100820_47765.html (2006).
20. Beijing Municipal Commission of Development and Reform,
http://www.bjpc.gov.cn/fzgh_1/news/200710/t195311.htm (2007).
21. Beijing Municipal Government, http://zhengwu.beijing.gov.cn/gzdt/gggs/t1046173.htm
(2009).

68
22. Yani Dong, 2011, “Development of Waste-to-Energy in China; and Case Study of the
Guangzhou Likeng WTE Plant”: Earth Engineering Center, Columbia University,
http://www.columbia.edu/ (2011).
23. Guangzhou Environmental Protection Bureau, 2004, “Environmental Sanitation Engineering
Technology Research Center for Ministry of Housing and Urban-Rural Development”,
http://www.cityup.org/center/bzgf/hybz/20120515/86260.shtml (2004).
24. Guangzhou Municipal Government,
http://www.gz.gov.cn/business/htmlfiles/GZ00/2.1/201102/767495.html (2011).
25. 163.com, 2009, “News Comment: The Haunting MSW”,
http://discover.news.163.com/09/0729/19/5FDNKHQP000125LI_3.html (2009).
26. Wang Weiping, Beijing Environmental Protection Bureau, http://esoftbank.com.cn/wz/73_6866.html
(2004).
27. Fenghuang News, 2011, “How Foreign Countries Do MSW Sorting”,
http://news.ifeng.com/gundong/detail_2011_05/12/6342234_0.shtml (2011).
28. Charter of the Global WTERT Council (GWC), October 31, 2010: Earth Engineering Cener, Columbia
University, http://www.columbia.edu/ (2010).
29. Guangzhou Committee of City Management, “Guidebook of MSW Sorting in Guangzhou”,
http://www.gzcgw.gov.cn/portal/site/site/portal/gzcgw/index.jsp (2010).
30. Garret C. Fitzgerald, Jonathan S. Krones, Nickolas J. Themelis, December 2012, “Greenhouse gas
impact of dual stream and single stream collection and separation of recyclables”, Resources,
Conservation and Recycling, Volume 69, Pages 50-56 (2012).