part i: gdp - saylor · part i: gdp. gross domestic product (gdp) ... using prices to distinguish...
TRANSCRIPT
TOPIC 1TOPIC 1
I d i M DIntroduction to Macro Data
Goals and Outline of Topic 11. Gross Domestic Product (GDP)
– What is Gross Domestic Product and how we measure it? Why is this measure important?p
– What are the definitions of the major expenditure components? – What are the trends in these components over time?
2 Inflation2. Inflation – What is the difference between ‘Real’ and ‘Nominal’ variables?– How is inflation measured?
3. Interest Rate– How is inflation measured? – Why do we care about Inflation?
4. Unemployment– How is Unemployment measured? – Why do we care about Unemployment?
2
PART I: GDP
Gross Domestic Product (GDP)
• GDP is a measure of output!
• Why Do We Care?
– Because output is highly correlated (at certain times) with things we care about (standard of living, wages, unemployment, inflation, budget and trade deficits, value of currency, etc…)
• Formal Definition:
– GDP is the Market Value of all Final Goods and Services Newly Produced on Domestic Soil During a Given Time Period (different than GNP)
4
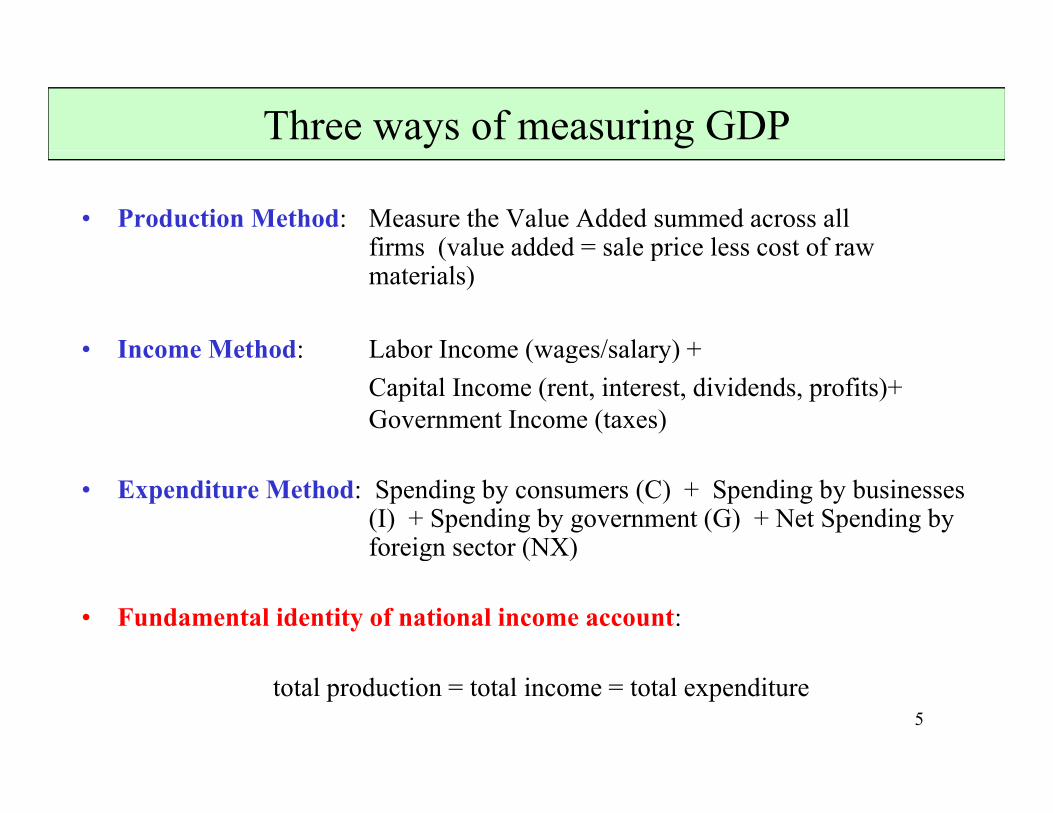
Three ways of measuring GDP
• Production Method: Measure the Value Added summed across allfirms (value added = sale price less cost of rawfirms (value added sale price less cost of raw materials)
• Income Method: Labor Income (wages/salary) +Income Method: Labor Income (wages/salary) + Capital Income (rent, interest, dividends, profits)+ Government Income (taxes)
• Expenditure Method: Spending by consumers (C) + Spending by businesses (I) + Spending by government (G) + Net Spending by foreign sector (NX)g ( )
• Fundamental identity of national income account:
5total production = total income = total expenditure
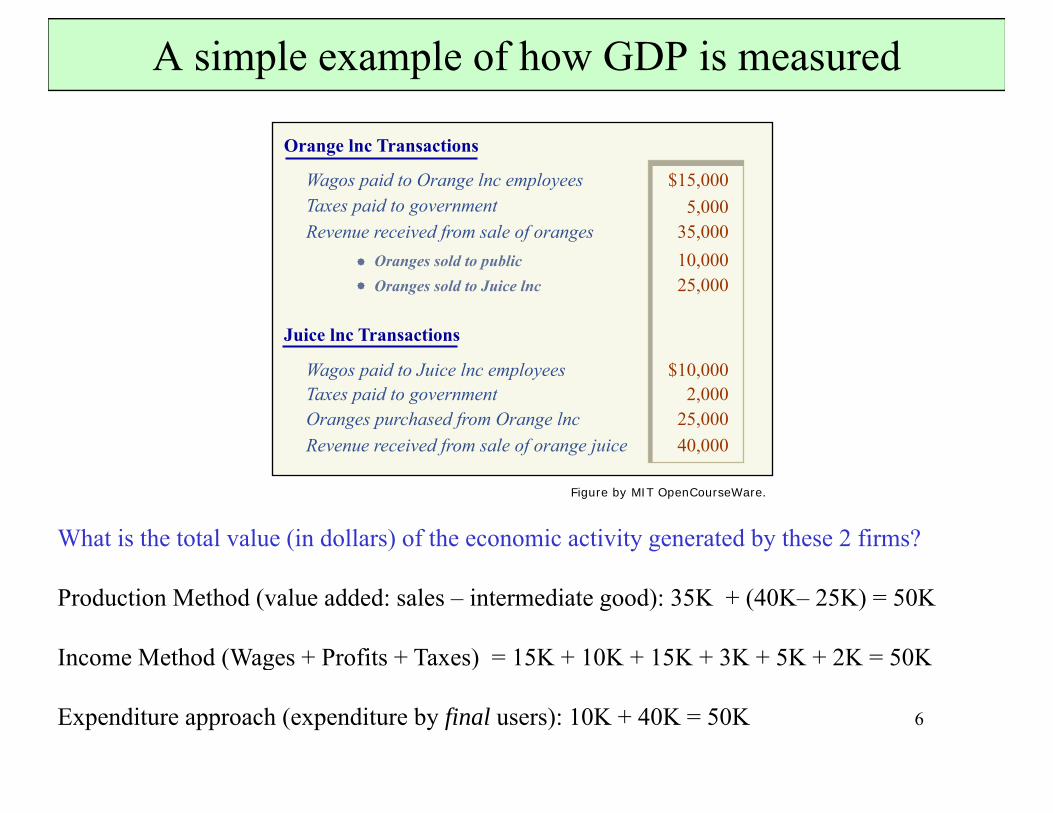
A simple example of how GDP is measured
What is the total value (in dollars) of the economic activity generated by these 2 firms?
Production Method (value added: sales – intermediate good): 35K + (40K– 25K) = 50K
Income Method (Wages + Profits + Taxes) = 15K + 10K + 15K + 3K + 5K + 2K = 50K
6
Income Method (Wages + Profits + Taxes) 15K + 10K + 15K + 3K + 5K + 2K 50K
Expenditure approach (expenditure by final users): 10K + 40K = 50K
Orange lnc Transactions
Juice lnc Transactions
Wagos paid to Orange lnc employees
Wagos paid to Juice lnc employees
Taxes paid to government
Taxes paid to governmentOranges purchased from Orange lncRevenue received from sale of orange juice
Revenue received from sale of orangesOranges sold to publicOranges sold to Juice lnc
$15,000
$10,000
5,000
2,00025,00040,000
35,00010,00025,000
Figure by MIT OpenCourseWare.
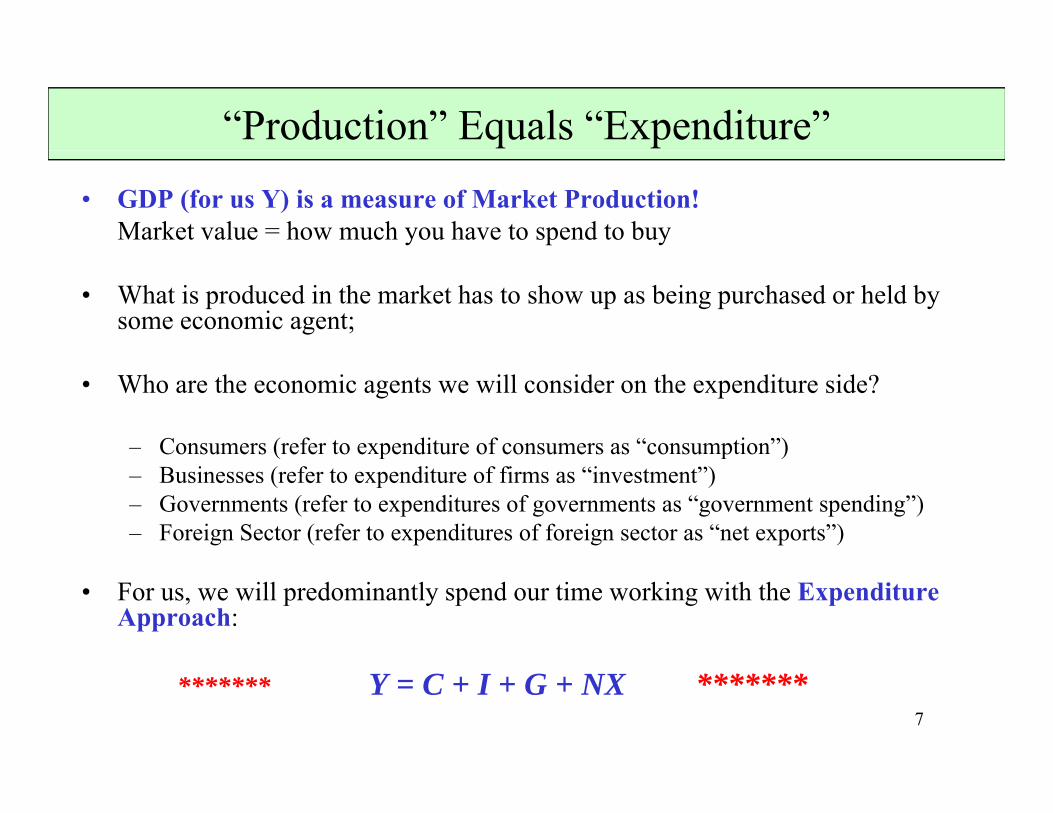
“Production” Equals “Expenditure”• GDP (for us Y) is a measure of Market Production!
Market value = how much you have to spend to buy
• What is produced in the market has to show up as being purchased or held by some economic agent;
• Who are the economic agents we will consider on the expenditure side?
– Consumers (refer to expenditure of consumers as “consumption”)( p p )– Businesses (refer to expenditure of firms as “investment”)– Governments (refer to expenditures of governments as “government spending”)– Foreign Sector (refer to expenditures of foreign sector as “net exports”)
• For us, we will predominantly spend our time working with the Expenditure Approach:
7******* Y = C + I + G + NX *******
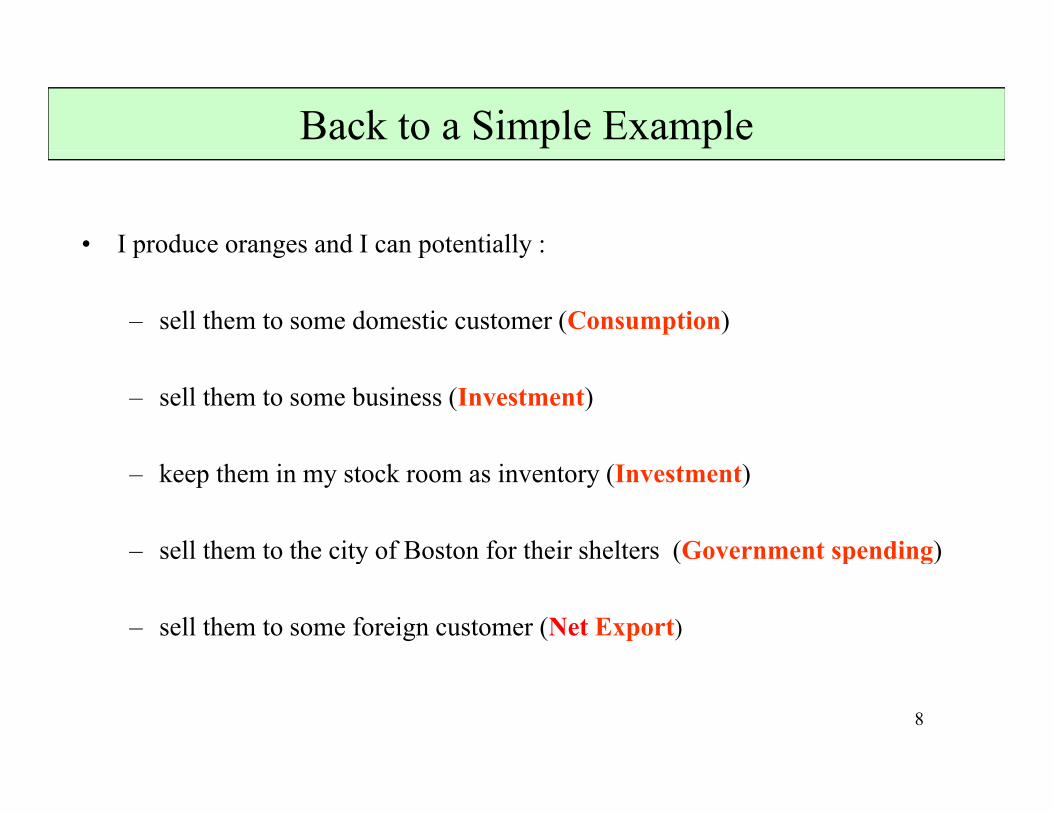
Back to a Simple Example
• I produce oranges and I can potentially :p g p y
– sell them to some domestic customer (Consumption)
– sell them to some business (Investment)
– keep them in my stock room as inventory (Investment)
– sell them to the city of Boston for their shelters (Government spending)y ( p g)
– sell them to some foreign customer (Net Export)
8
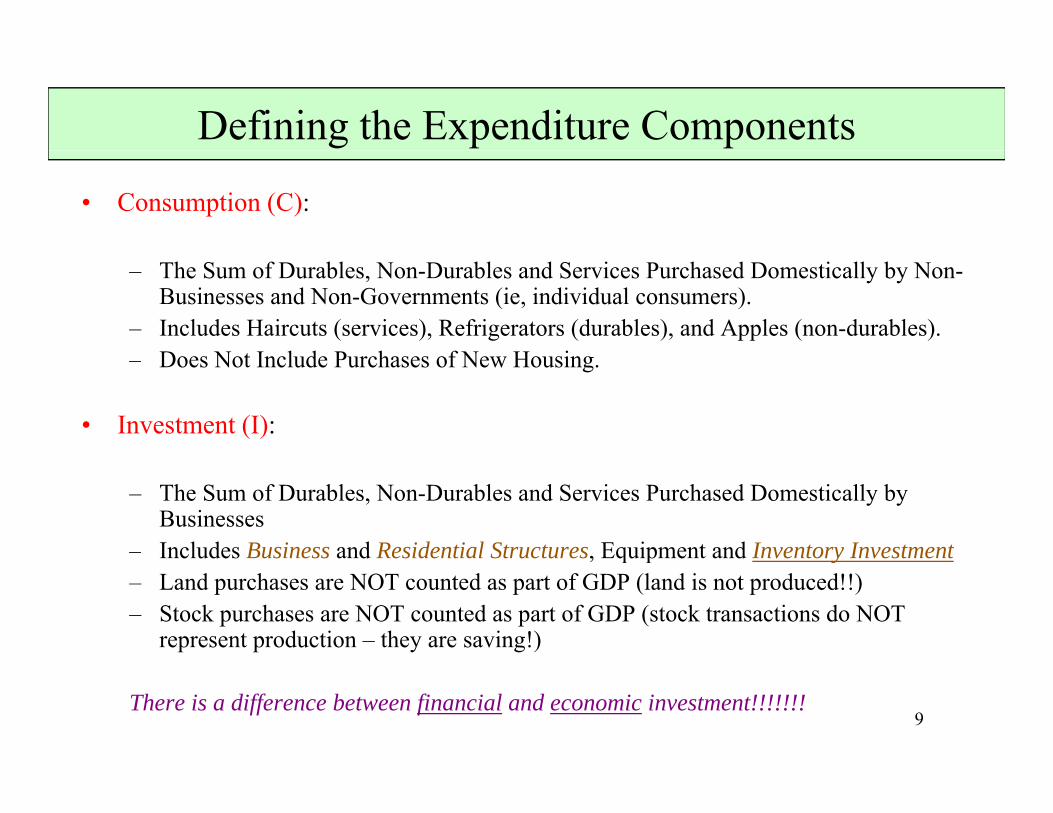
Defining the Expenditure Components
• Consumption (C):
– The Sum of Durables, Non-Durables and Services Purchased Domestically by Non-Businesses and Non-Governments (ie, individual consumers).
– Includes Haircuts (services), Refrigerators (durables), and Apples (non-durables).D N t I l d P h f N H i– Does Not Include Purchases of New Housing.
• Investment (I):
– The Sum of Durables, Non-Durables and Services Purchased Domestically by Businesses
– Includes Business and Residential Structures, Equipment and Inventory Investment, q p y– Land purchases are NOT counted as part of GDP (land is not produced!!)– Stock purchases are NOT counted as part of GDP (stock transactions do NOT
represent production – they are saving!)
9There is a difference between financial and economic investment!!!!!!!
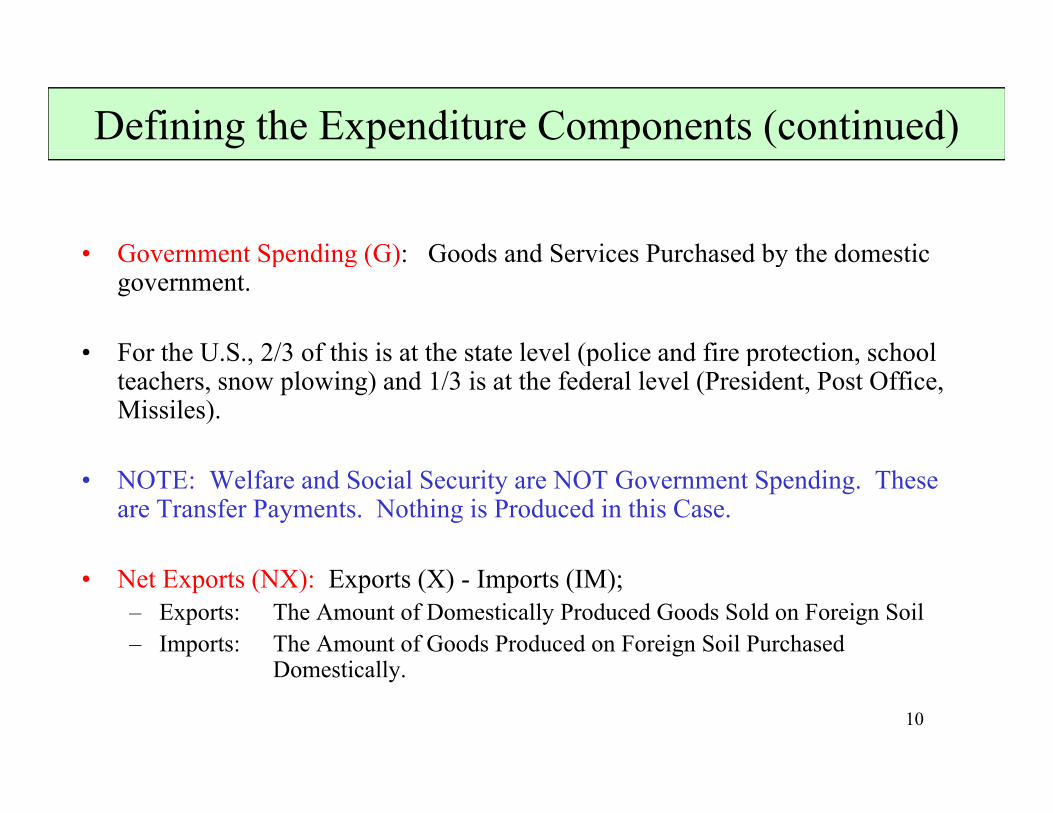
Defining the Expenditure Components (continued)
• Government Spending (G): Goods and Services Purchased by the domestic• Government Spending (G): Goods and Services Purchased by the domestic government.
• For the U S 2/3 of this is at the state level (police and fire protection schoolFor the U.S., 2/3 of this is at the state level (police and fire protection, school teachers, snow plowing) and 1/3 is at the federal level (President, Post Office, Missiles).
• NOTE: Welfare and Social Security are NOT Government Spending. These are Transfer Payments. Nothing is Produced in this Case.
• Net Exports (NX): Exports (X) - Imports (IM); – Exports: The Amount of Domestically Produced Goods Sold on Foreign Soil – Imports: The Amount of Goods Produced on Foreign Soil Purchased
D ti ll
10
Domestically.
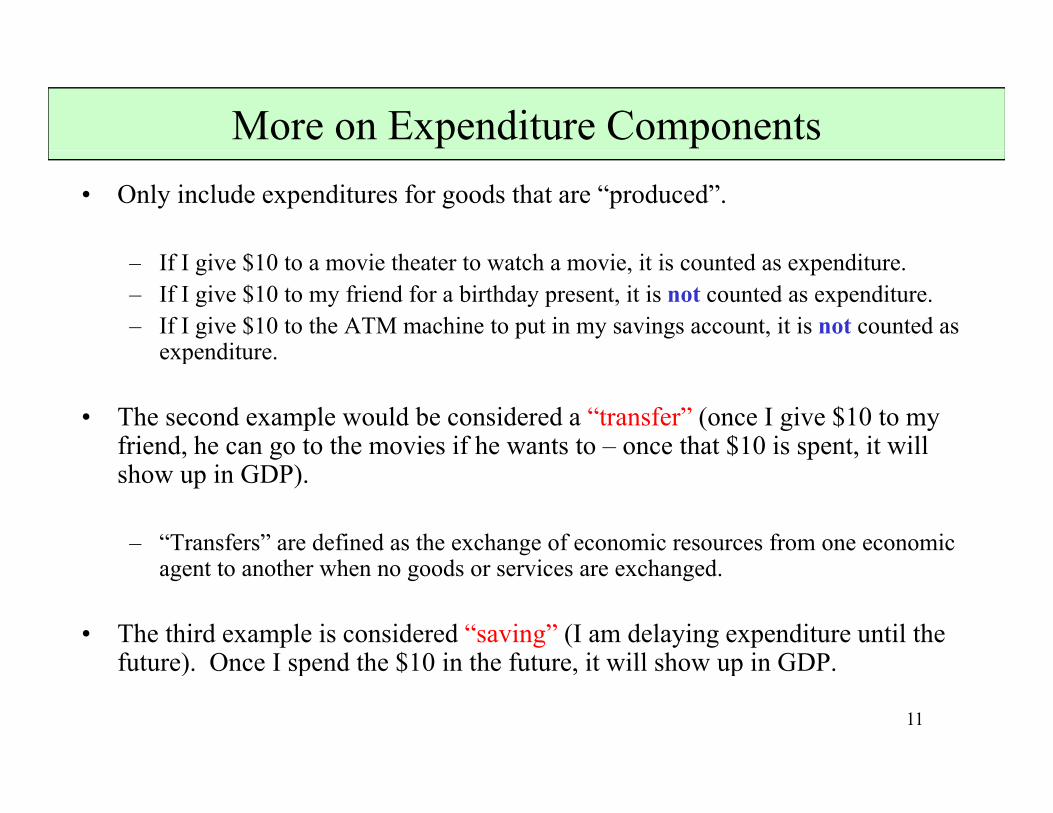
More on Expenditure Components• Only include expenditures for goods that are “produced”.
– If I give $10 to a movie theater to watch a movie, it is counted as expenditure.– If I give $10 to my friend for a birthday present, it is not counted as expenditure.– If I give $10 to the ATM machine to put in my savings account, it is not counted as
expenditureexpenditure.
• The second example would be considered a “transfer” (once I give $10 to my friend, he can go to the movies if he wants to – once that $10 is spent, it will , g p ,show up in GDP).
– “Transfers” are defined as the exchange of economic resources from one economic h h d i h dagent to another when no goods or services are exchanged.
• The third example is considered “saving” (I am delaying expenditure until the future) Once I spend the $10 in the future it will show up in GDP
11
future). Once I spend the $10 in the future, it will show up in GDP.
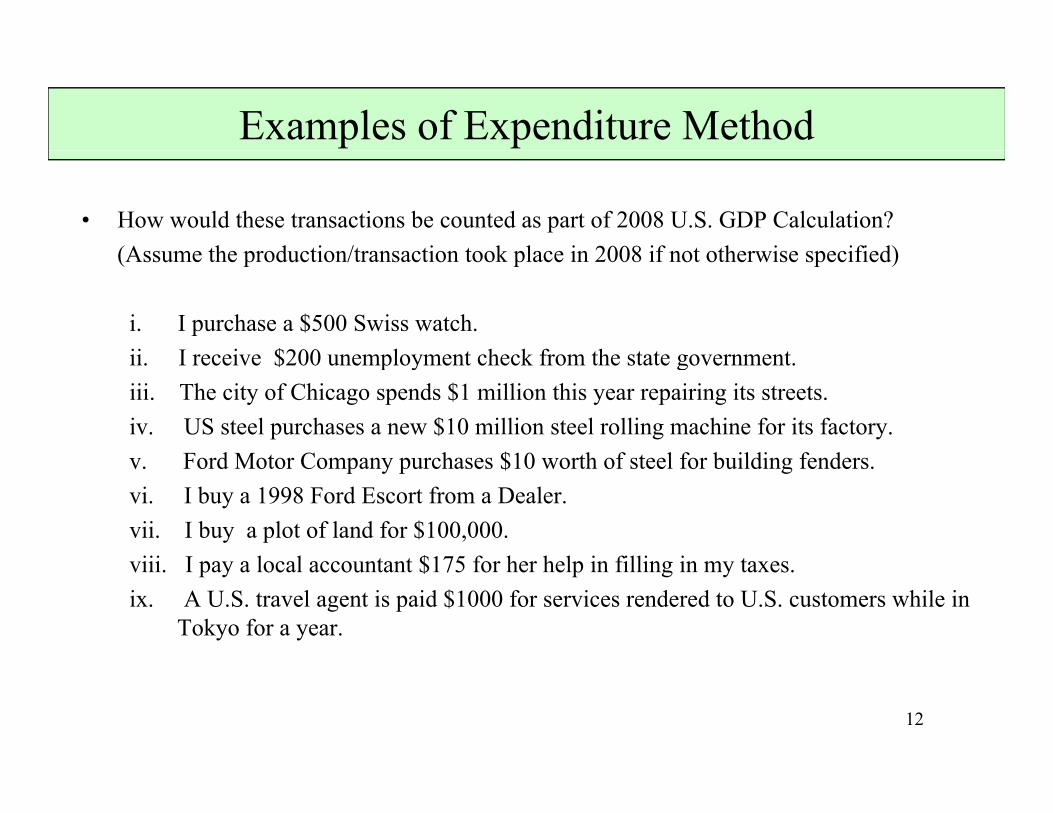
Examples of Expenditure Method
• How would these transactions be counted as part of 2008 U.S. GDP Calculation?(Assume the production/transaction took place in 2008 if not otherwise specified)(Assume the production/transaction took place in 2008 if not otherwise specified)
i. I purchase a $500 Swiss watch.ii I receive $200 unemployment check from the state governmentii. I receive $200 unemployment check from the state government.iii. The city of Chicago spends $1 million this year repairing its streets.iv. US steel purchases a new $10 million steel rolling machine for its factory. v Ford Motor Company purchases $10 worth of steel for building fendersv. Ford Motor Company purchases $10 worth of steel for building fenders. vi. I buy a 1998 Ford Escort from a Dealer.vii. I buy a plot of land for $100,000.iii I l l t t $175 f h h l i filli i tviii. I pay a local accountant $175 for her help in filling in my taxes.
ix. A U.S. travel agent is paid $1000 for services rendered to U.S. customers while in Tokyo for a year.
12

Preview: Accounting vs Economics
Y = C + I + G + NX
• Macroeconomics studies the determinants of Y (= aggregate supply) and C+I+G+NX (aggregate demand), and shows how, in equilibrium, prices/wages/interest rates/exchange rates have to adjust such that AS = AD.– Classic economics believes prices/wages move immediately to attain
equilibrium.– Keynesian economics sticky prices/wages give rise to unemployment
and an active role to monetary policy.
• With this basic setup we can understand how changes in the determinants of aggregate demand and supply affect growth and prices in an economy.
13
What GDP is NOT!
GDP i l i b b l f ll b i !• GDP is not, or never claims to be, an absolute measure of well-being!
– Size effects : But even GDP per capita is not a perfect measure of welfare
• Ideally, what we would like to measure is quality of one’s life:
– Present discounted value of utility from one’s own consumption and leisure and that of one’s loved ones.
14
More on What GDP Is Not
• GDP Does Not Measure:
– Non-Market Activity (home production, leisure, black market activity)
– Environmental Quality/Natural Resource DepletionQ y p
– Life Expectancy and Health
– Income Distribution
– Crime/Safety
15
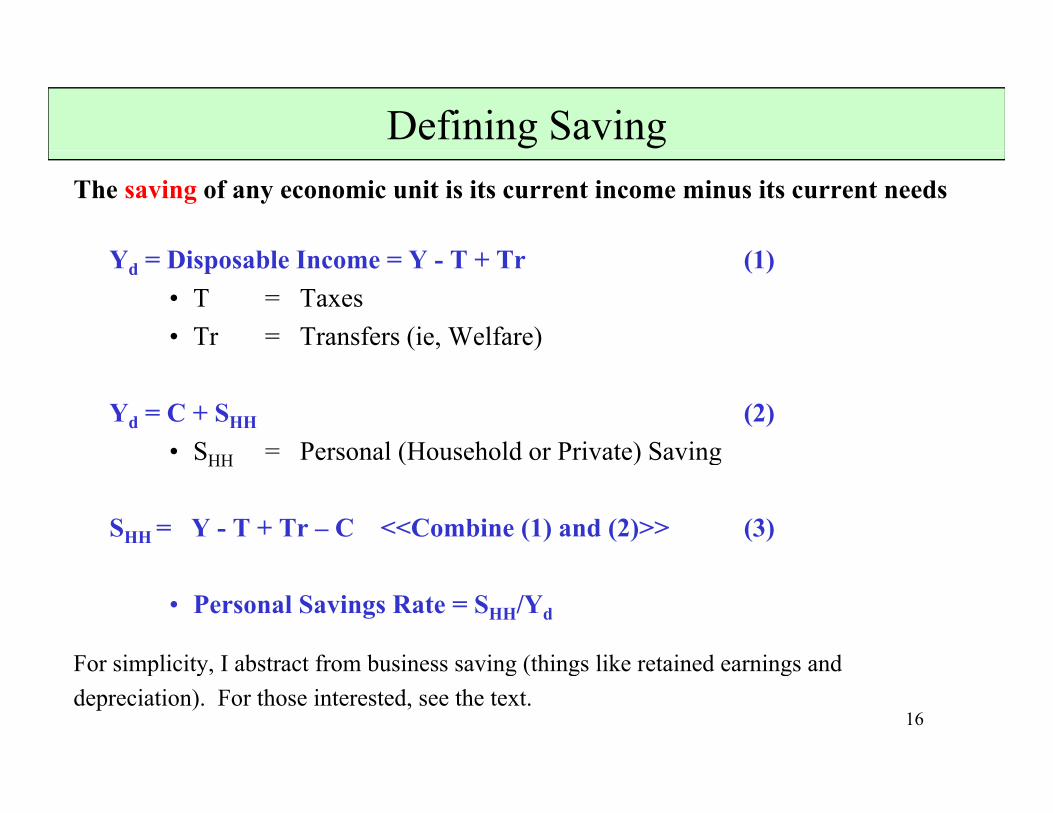
Defining SavingThe saving of any economic unit is its current income minus its current needs
Y Di bl I Y T + T (1)Yd = Disposable Income = Y - T + Tr (1)• T = Taxes• Tr = Transfers (ie, Welfare)
Yd = C + SHH (2)• SHH = Personal (Household or Private) SavingSHH Personal (Household or Private) Saving
SHH = Y - T + Tr – C <<Combine (1) and (2)>> (3)
• Personal Savings Rate = SHH/Yd
For simplicity I abstract from business saving (things like retained earnings and
16
For simplicity, I abstract from business saving (things like retained earnings anddepreciation). For those interested, see the text.
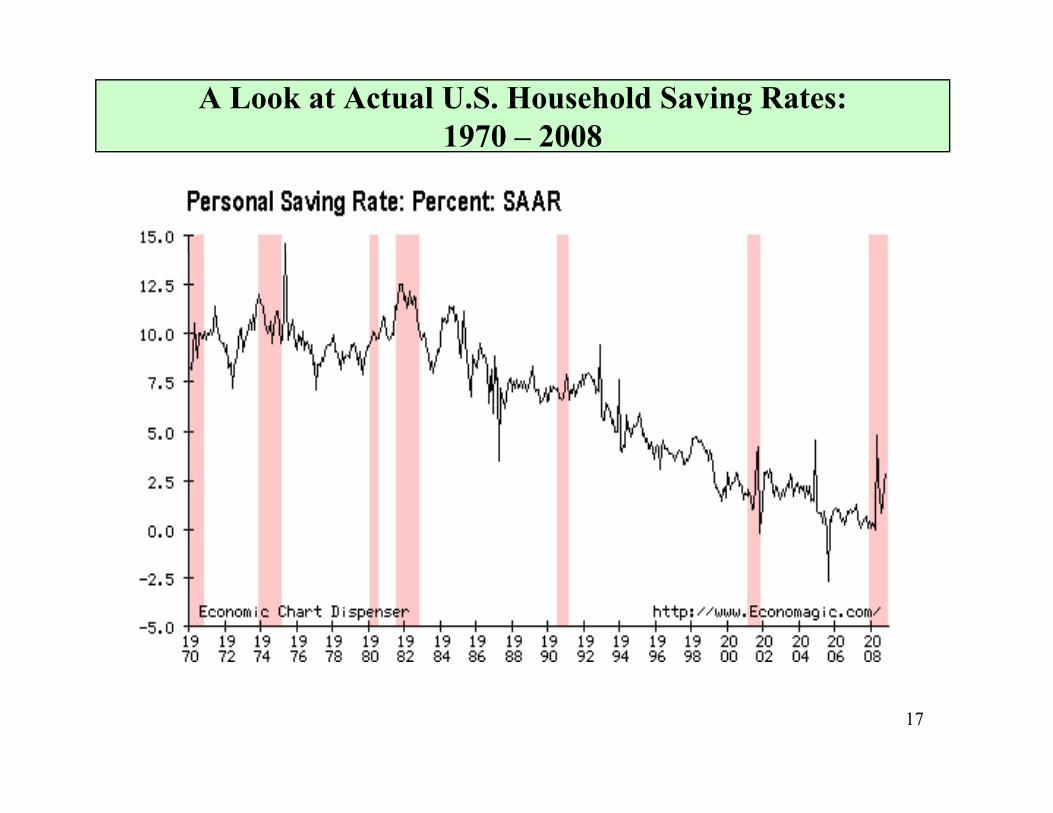
A Look at Actual U.S. Household Saving Rates: 1970 – 2008
17
Defining Saving (continued)
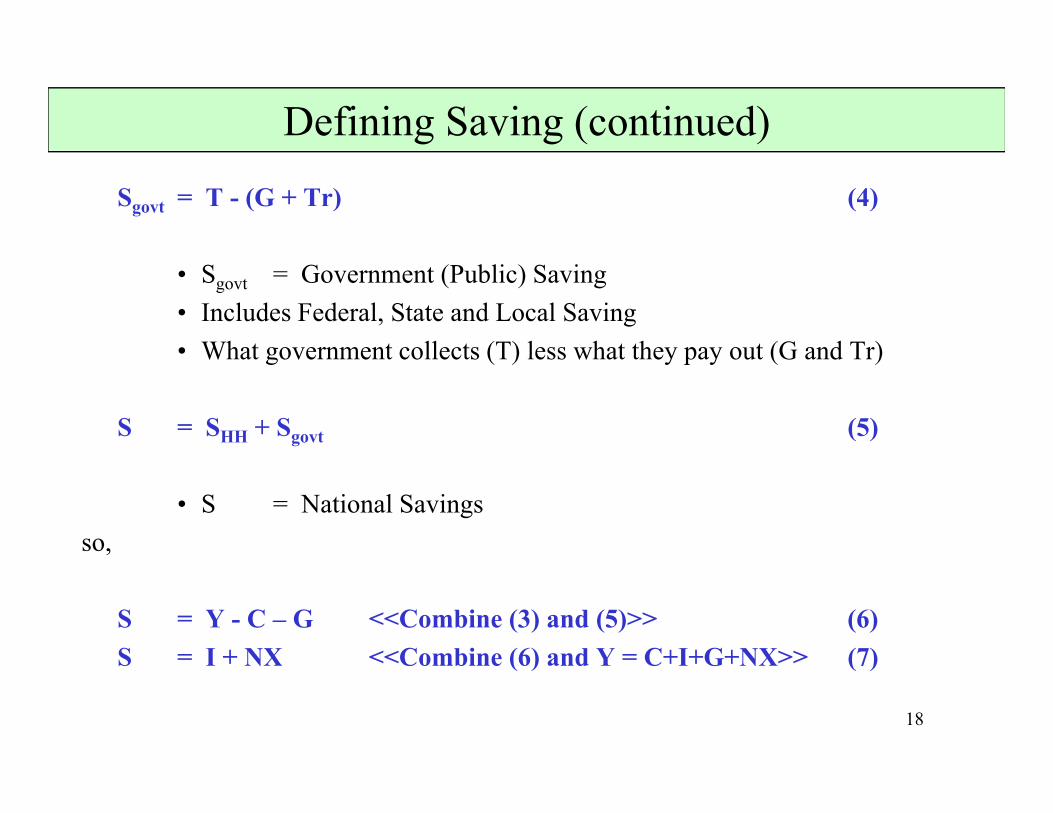
Sgovt = T - (G + Tr) (4)
• Sgovt = Government (Public) Saving • Includes Federal, State and Local Saving• What government collects (T) less what they pay out (G and Tr)What government collects (T) less what they pay out (G and Tr)
S = SHH + Sgovt (5)
• S = National Savingsso,
S = Y - C – G <<Combine (3) and (5)>> (6)S = I + NX <<Combine (6) and Y = C+I+G+NX>> (7)
18
S I + NX <<Combine (6) and Y C+I+G+NX>> (7)
PART II: Inflation
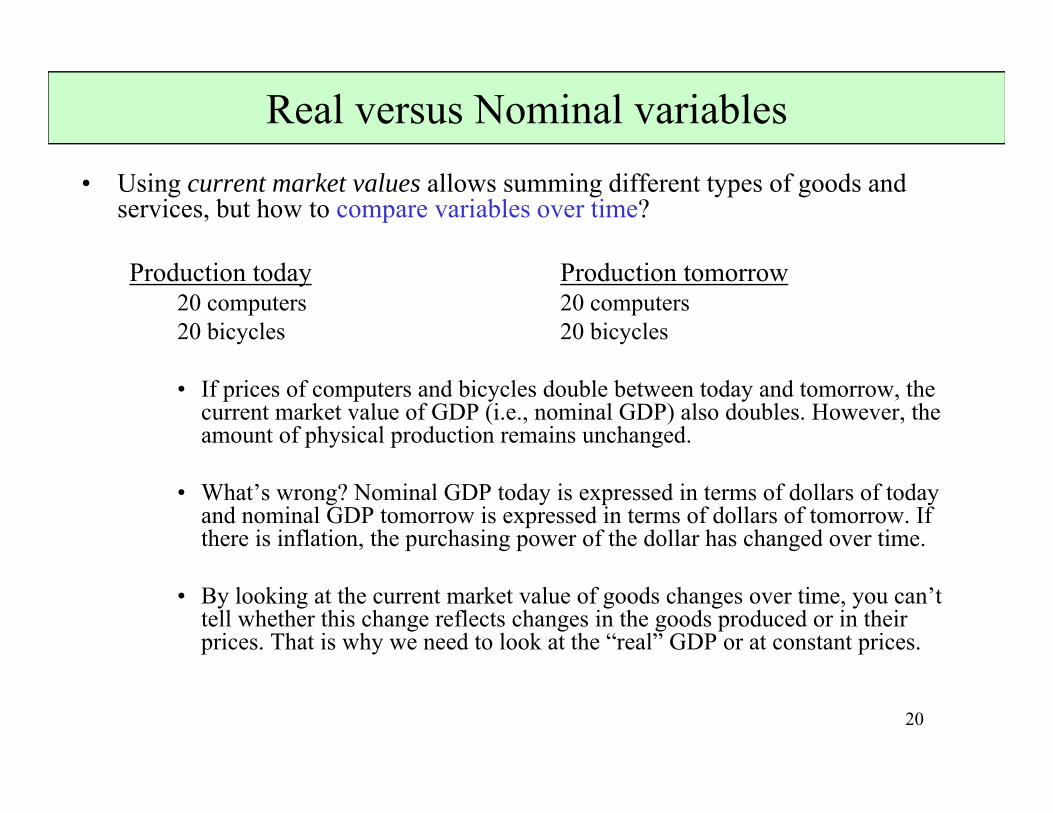
Real versus Nominal variables• Using current market values allows summing different types of goods and
services, but how to compare variables over time?
Production today Production tomorrow20 computers 20 computers 20 bicycles 20 bicycles
• If prices of computers and bicycles double between today and tomorrow, the current market value of GDP (i.e., nominal GDP) also doubles. However, the amount of physical production remains unchanged.
• What’s wrong? Nominal GDP today is expressed in terms of dollars of today and nominal GDP tomorrow is expressed in terms of dollars of tomorrow. If there is inflation, the purchasing power of the dollar has changed over time.
• By looking at the current market value of goods changes over time, you can’t tell whether this change reflects changes in the goods produced or in their prices. That is why we need to look at the “real” GDP or at constant prices.
20
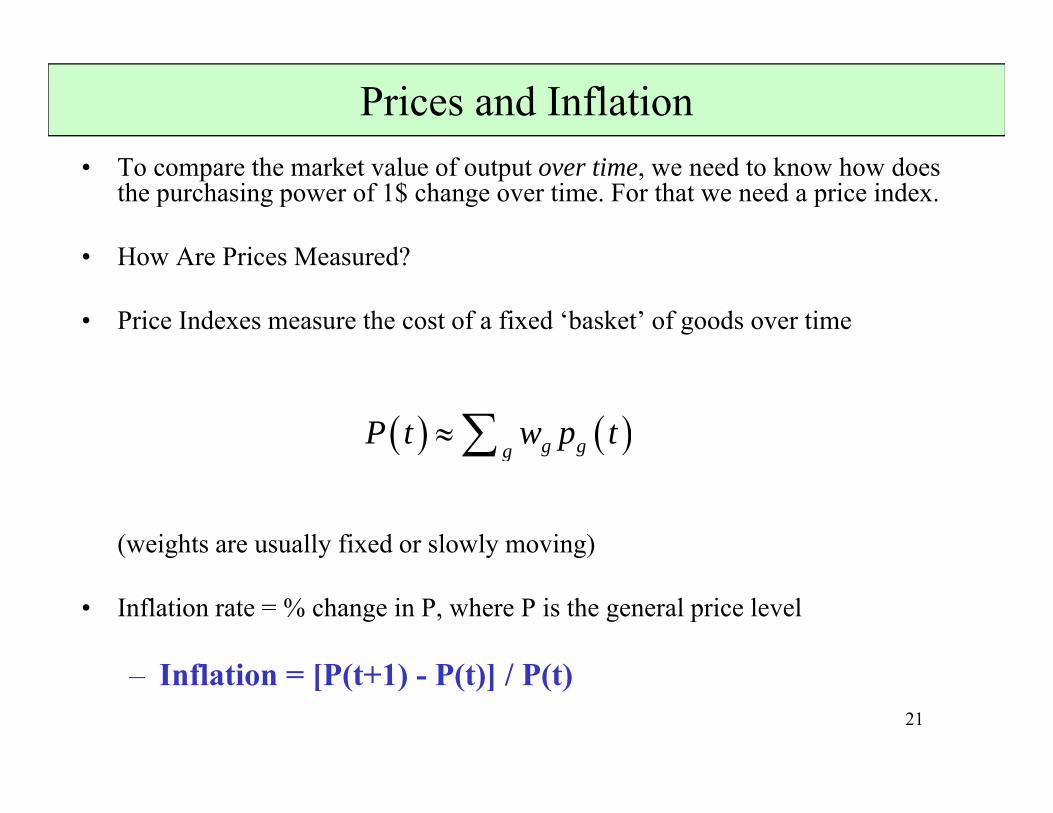
Prices and Inflation• To compare the market value of output over time, we need to know how does
the purchasing power of 1$ change over time. For that we need a price index.
Ho Are Prices Meas red?• How Are Prices Measured?
• Price Indexes measure the cost of a fixed ‘basket’ of goods over time
g ggP t w p t
(weights are usually fixed or slowly moving)
g
• Inflation rate = % change in P, where P is the general price level
21
– Inflation = [P(t+1) - P(t)] / P(t)
Prices and Inflation
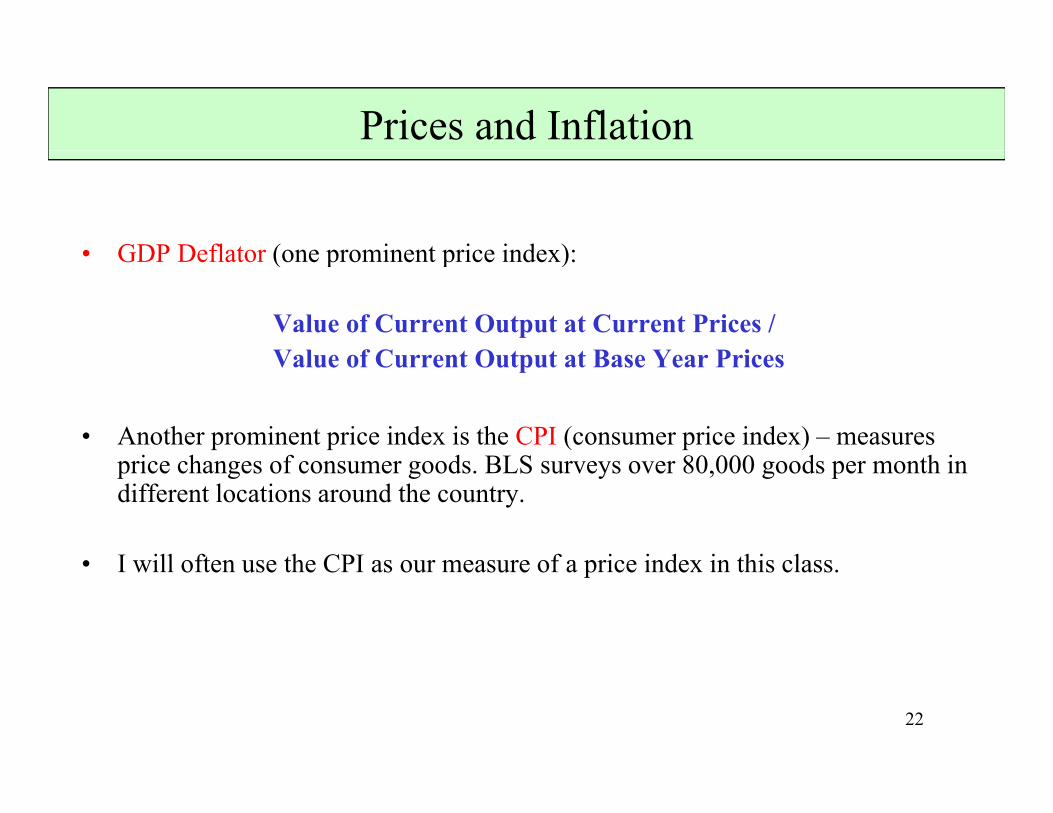
• GDP Deflator (one prominent price index):• GDP Deflator (one prominent price index):
Value of Current Output at Current Prices / Value of Current Output at Base Year PricesValue of Current Output at Base Year Prices
• Another prominent price index is the CPI (consumer price index) – measures i h f d BLS 80 000 d th iprice changes of consumer goods. BLS surveys over 80,000 goods per month in
different locations around the country.
• I will often use the CPI as our measure of a price index in this class• I will often use the CPI as our measure of a price index in this class.
22
Using Prices to distinguish between Nominal and Real Variables
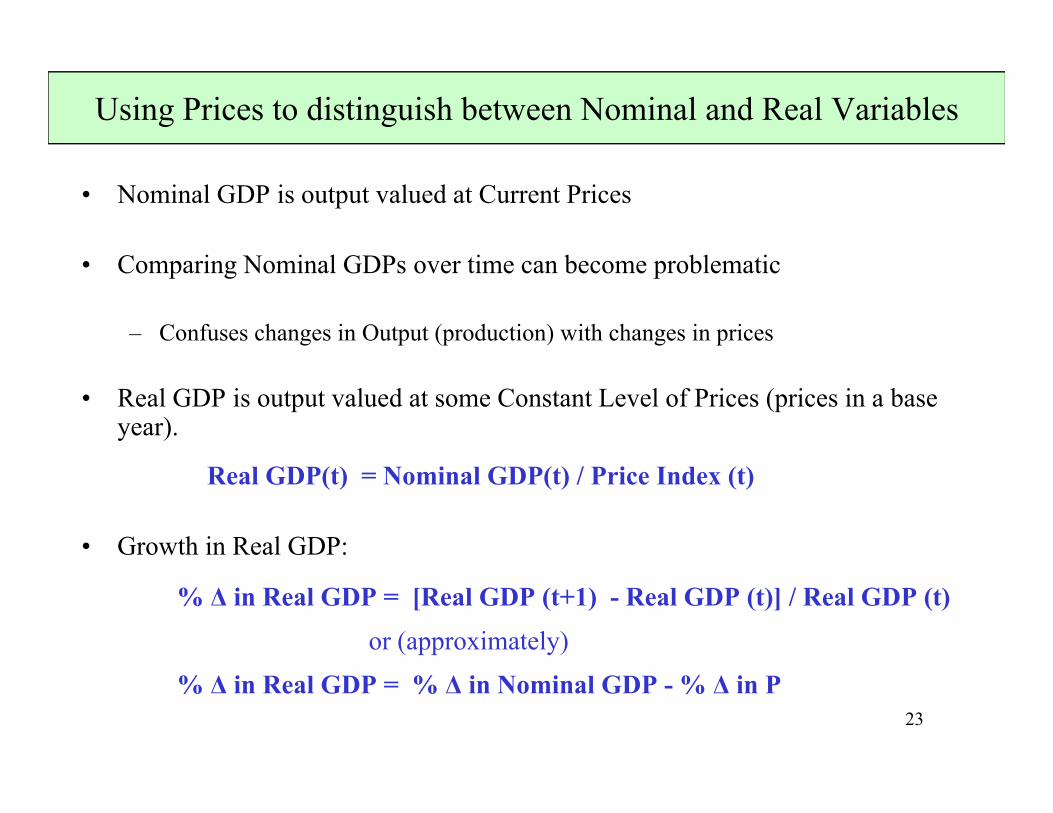
• Nominal GDP is output valued at Current Prices
• Comparing Nominal GDPs over time can become problematic
– Confuses changes in Output (production) with changes in prices
• Real GDP is output valued at some Constant Level of Prices (prices in a base year).
Real GDP(t) = Nominal GDP(t) / Price Index (t)
• Growth in Real GDP:
% Δ in Real GDP = [Real GDP (t+1) - Real GDP (t)] / Real GDP (t)
or (approximately)
23
% Δ in Real GDP = % Δ in Nominal GDP - % Δ in P
Example of Price Index Calculations
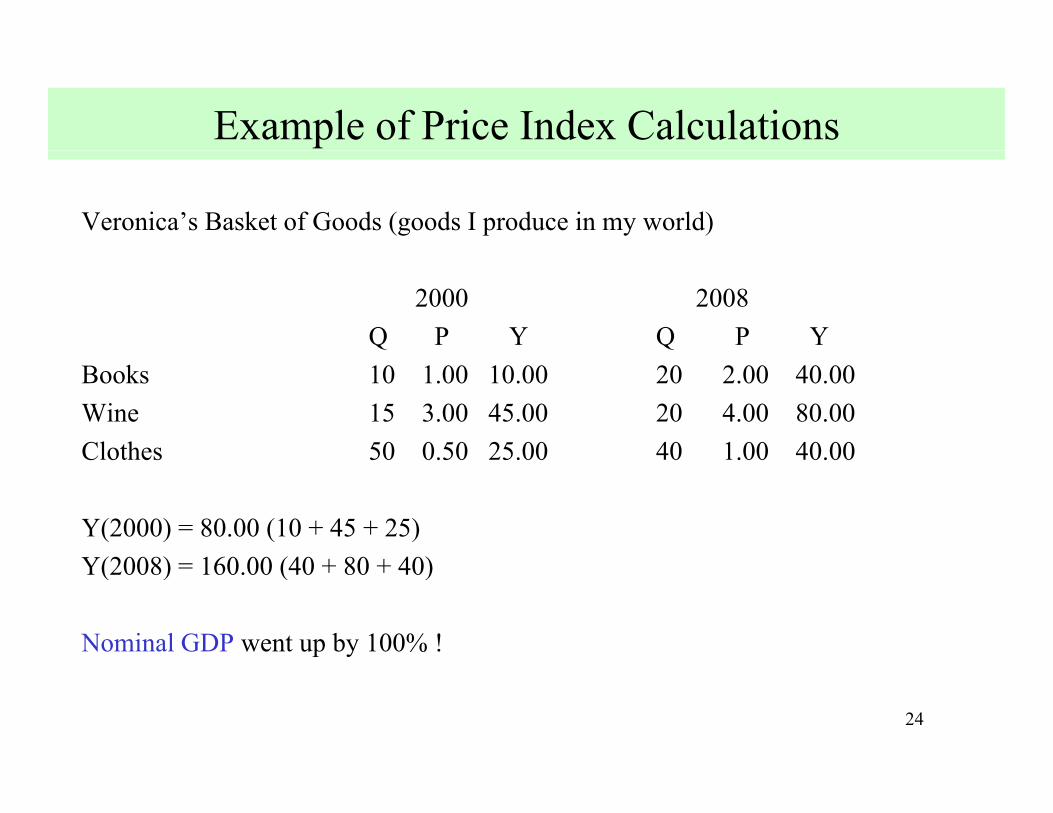
Veronica’s Basket of Goods (goods I produce in my world)
2000 2008Q P Y Q P Y
Books 10 1.00 10.00 20 2.00 40.00Wine 15 3.00 45.00 20 4.00 80.00Clothes 50 0.50 25.00 40 1.00 40.00Clothes 50 0.50 25.00 40 1.00 40.00
Y(2000) = 80.00 (10 + 45 + 25)Y(2008) 160 00 (40 + 80 + 40)Y(2008) = 160.00 (40 + 80 + 40)
Nominal GDP went up by 100% !
24
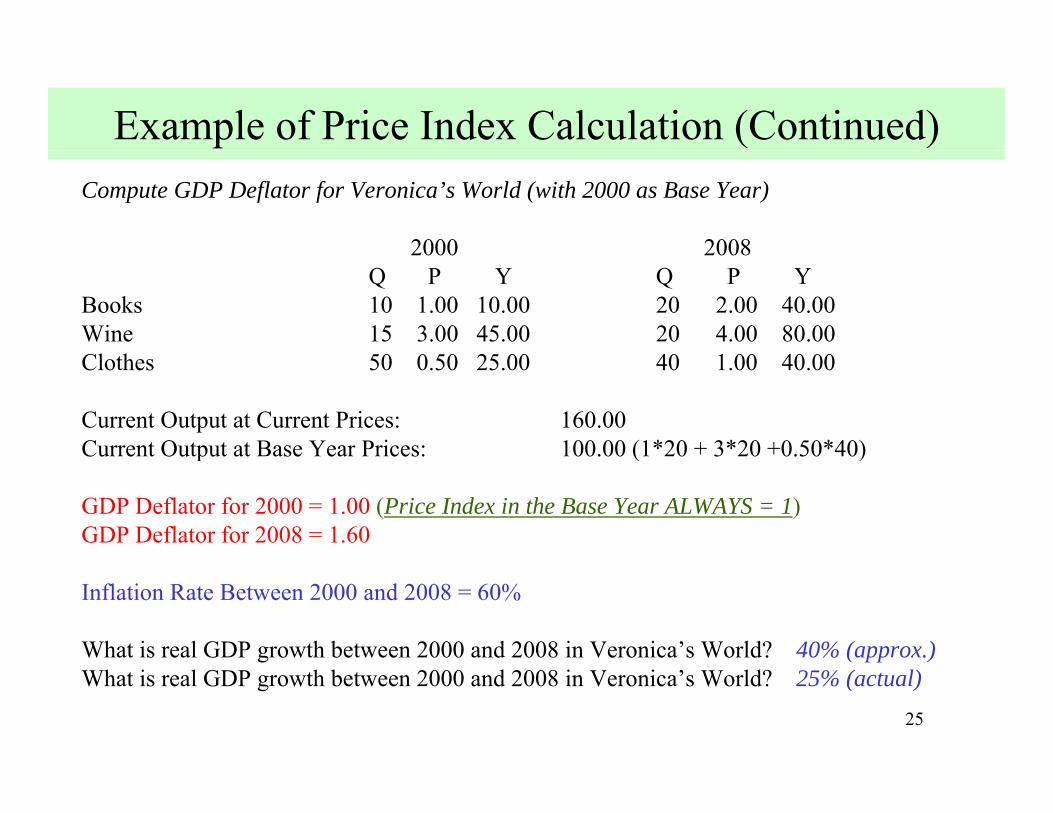
Example of Price Index Calculation (Continued)Compute GDP Deflator for Veronica’s World (with 2000 as Base Year)
2000 20082000 2008Q P Y Q P Y
Books 10 1.00 10.00 20 2.00 40.00Wine 15 3.00 45.00 20 4.00 80.00Cl h 50 0 50 25 00 40 1 00 40 00Clothes 50 0.50 25.00 40 1.00 40.00
Current Output at Current Prices: 160.00Current Output at Base Year Prices: 100.00 (1*20 + 3*20 +0.50*40)p ( )
GDP Deflator for 2000 = 1.00 (Price Index in the Base Year ALWAYS = 1)GDP Deflator for 2008 = 1.60
Inflation Rate Between 2000 and 2008 = 60%
What is real GDP growth between 2000 and 2008 in Veronica’s World? 40% (approx.)
25
What is real GDP growth between 2000 and 2008 in Veronica’s World? 25% (actual)
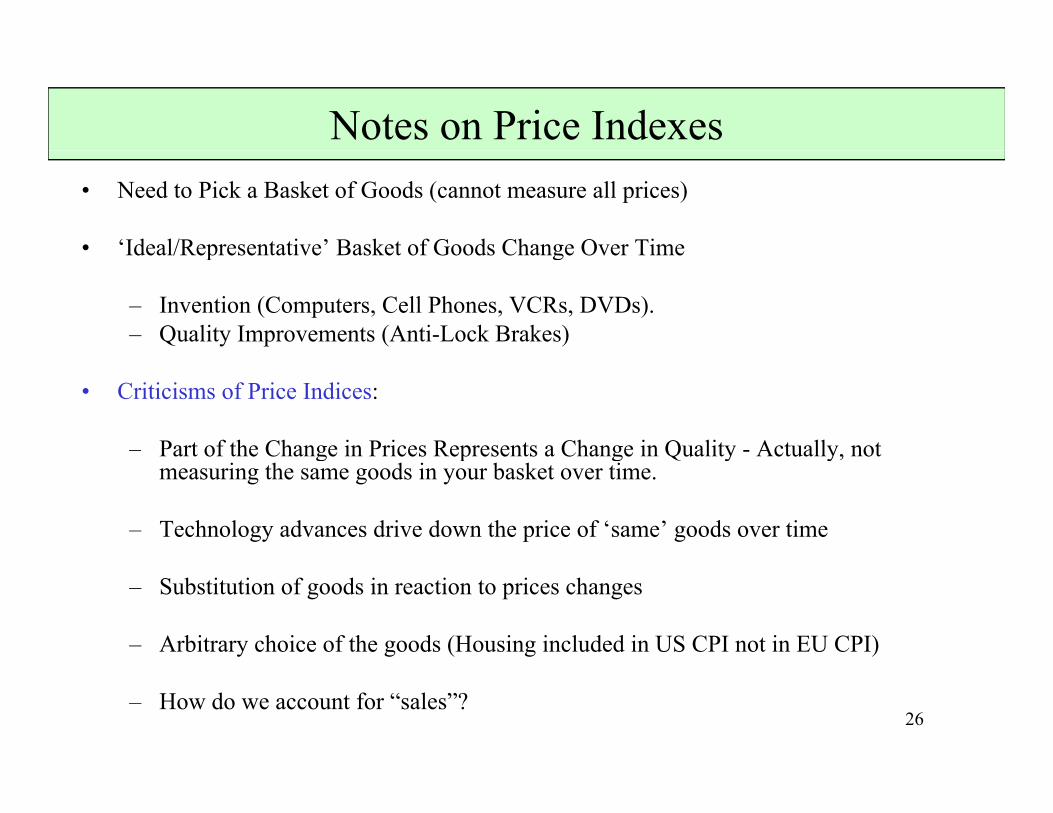
Notes on Price Indexes• Need to Pick a Basket of Goods (cannot measure all prices)
• ‘Ideal/Representative’ Basket of Goods Change Over TimeIdeal/Representative Basket of Goods Change Over Time
– Invention (Computers, Cell Phones, VCRs, DVDs).– Quality Improvements (Anti-Lock Brakes)
• Criticisms of Price Indices:
– Part of the Change in Prices Represents a Change in Quality - Actually, not g p g Q y y,measuring the same goods in your basket over time.
– Technology advances drive down the price of ‘same’ goods over time
– Substitution of goods in reaction to prices changes
– Arbitrary choice of the goods (Housing included in US CPI not in EU CPI)
26– How do we account for “sales”?
Notes on Price Indexes (continued)
B ki R t (1996) C l d th t CPI O t t I fl ti b 1 1%• Boskin Report (1996) Concludes that CPI Overstates Inflation by 1.1% per year (quality adjustment/substitution bias)
• Overstating Inflation means understated Real GDP increases - makes it appear that the U.S. Economy has Grown Slower Over Time. (Same for Stock Market, Housing Prices, Wages - any Nominal Measure)
• Measures to Get Around Problems with CPI - Chain Weighting – Read Box 2.2 in the Text to get a sense of chain weighting
27
Focus on Real Variables
Whi h i b tt R l N i l?• Which is better: Real or Nominal?
– In this class, we will focus on the ‘Real’! We are trying to measure changes in production, expenditures, income, standard of livings, etc. We will separately focus on the changes in prices.
– From now on, both in the analytical portions and the data portions of the course, we will assume everything is real unless otherwise told.
• ie, Y = Real GDP, C = Real Consumption, G = Real Government Purchases, etc...
28

PART III: Interest Rate
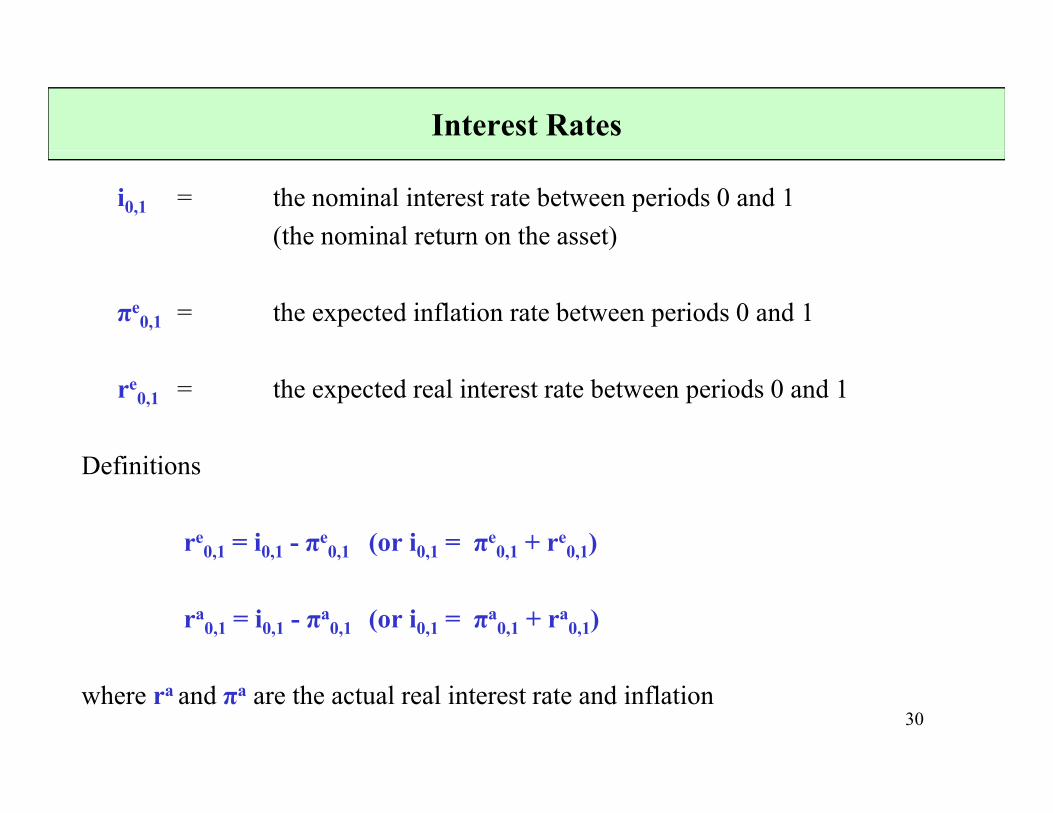
Interest Rates
i0,1 = the nominal interest rate between periods 0 and 1(the nominal return on the asset)
πe0,1 = the expected inflation rate between periods 0 and 1
re0,1 = the expected real interest rate between periods 0 and 1
D fi i iDefinitions
re0,1 = i0,1 - πe
0,1 (or i0,1 = πe0,1 + re
0,1)
ra0,1 = i0,1 - πa
0,1 (or i0,1 = πa0,1 + ra
0,1)
30where ra and πa are the actual real interest rate and inflation
Interest Rate Notes
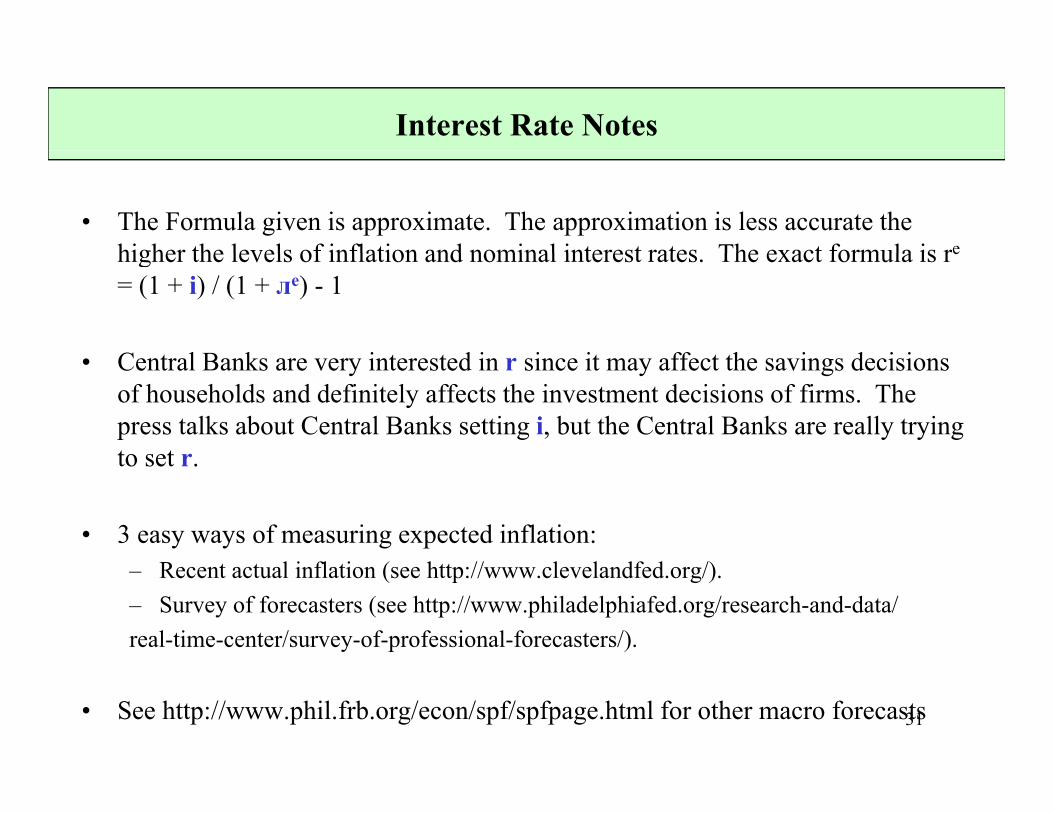
• The Formula given is approximate. The approximation is less accurate the higher the levels of inflation and nominal interest rates The exact formula is rehigher the levels of inflation and nominal interest rates. The exact formula is re
= (1 + i) / (1 + лe) - 1
C t l B k i t t d i i it ff t th i d i i• Central Banks are very interested in r since it may affect the savings decisions of households and definitely affects the investment decisions of firms. The press talks about Central Banks setting i, but the Central Banks are really trying to set rto set r.
• 3 easy ways of measuring expected inflation:– Recent actual inflation (see http://www.clevelandfed.org/).– Survey of forecasters (see http://www.philadelphiafed.org/research-and-data/real-time-center/survey-of-professional-forecasters/).– Interest rate spread on nominal vs. inflation-indexed securities (WSJ).
31• See http://www.phil.frb.org/econ/spf/spfpage.html for other macro forecasts
Why We Care About Inflation?
N t W ill h h l l t thi l t i th• Note: We will have a whole lecture on this later in the course
• Inflation is Unpredictable
• Indexing Costs (even if you know the inflation rate - you have to deal with it).
• Menu Costs (have to go and re-price everything)
Sh L th C t ( t t h ld l h h t t th b k• Shoe-Leather Costs (you want to hold less cash - have to go to the bank more often).
32
• Caveat: There may be some benefits to small inflation rates - more on this later.
Why We Care About Inflation?
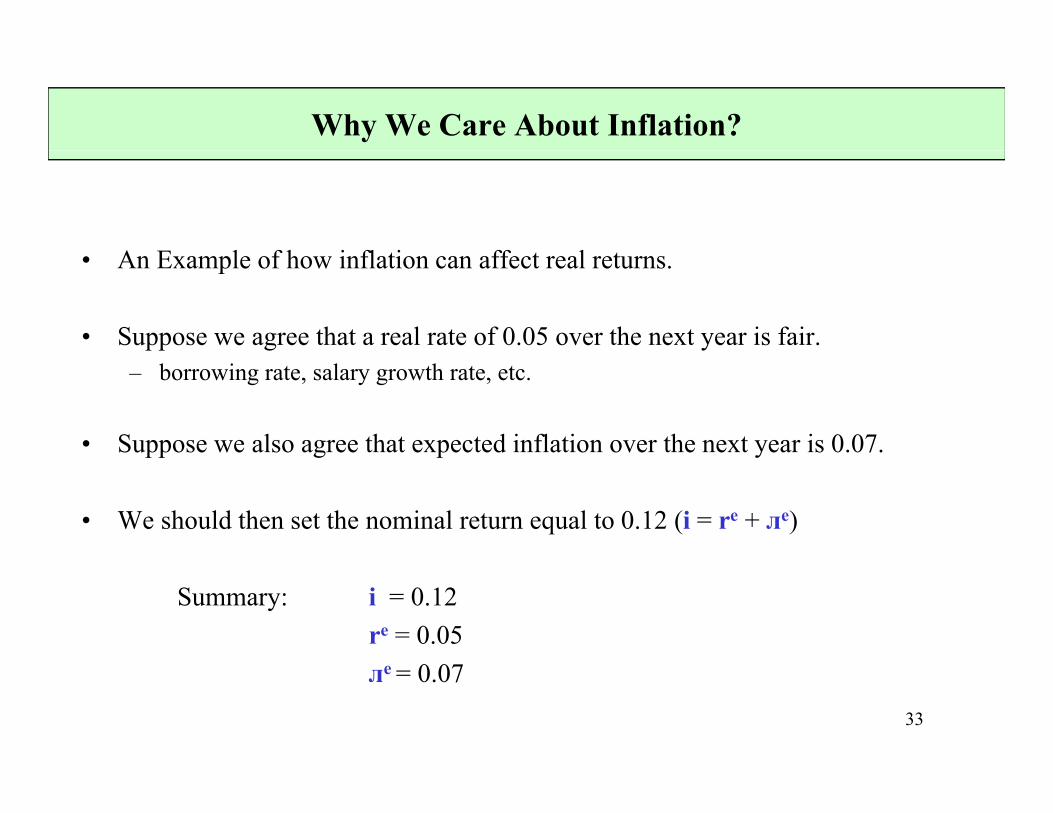
A E l f h i fl ti ff t l t• An Example of how inflation can affect real returns.
• Suppose we agree that a real rate of 0.05 over the next year is fair. – borrowing rate, salary growth rate, etc.
• Suppose we also agree that expected inflation over the next year is 0.07.
• We should then set the nominal return equal to 0.12 (i = re + лe)
Summary: i = 0.12re = 0.05
33
лe = 0.07
Why We Care About Inflation?
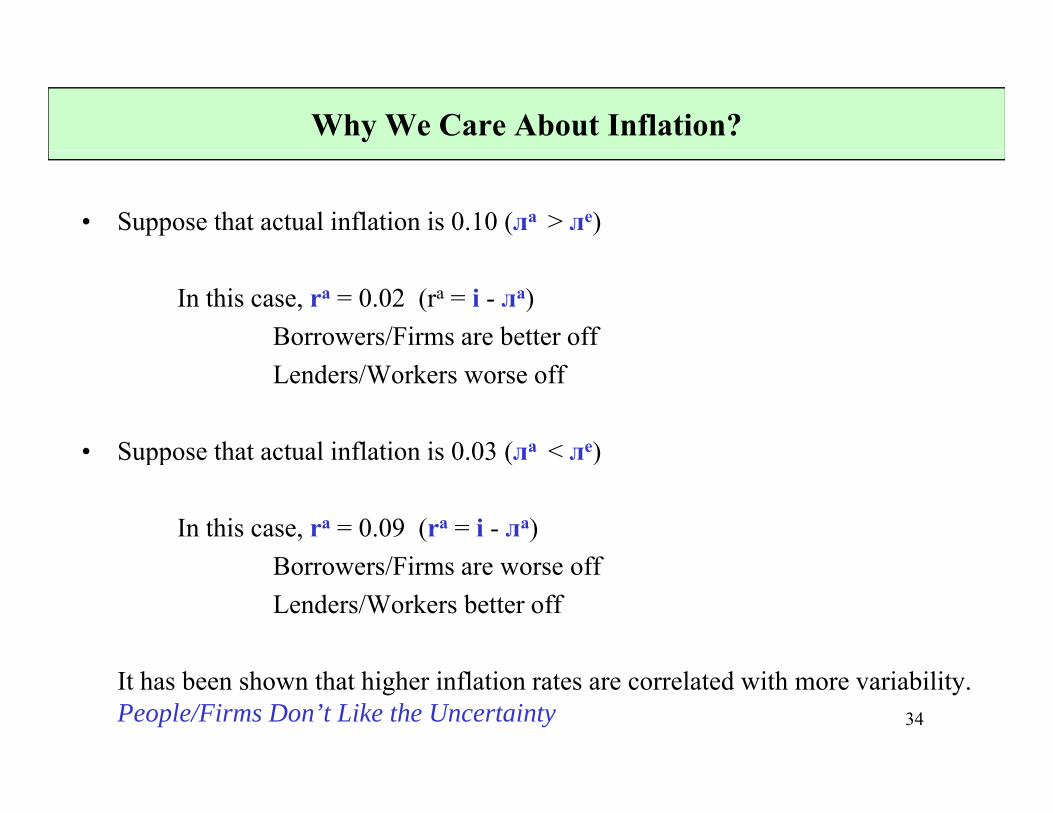
• Suppose that actual inflation is 0.10 (лa > лe)
In this case, ra = 0.02 (ra = i - лa)Borrowers/Firms are better offLenders/Workers worse off
• Suppose that actual inflation is 0.03 (лa < лe)Suppose that actual inflation is 0.03 (л л )
In this case, ra = 0.09 (ra = i - лa)B /Fi ffBorrowers/Firms are worse offLenders/Workers better off
34
It has been shown that higher inflation rates are correlated with more variability. People/Firms Don’t Like the Uncertainty
PART IV: Unemployment
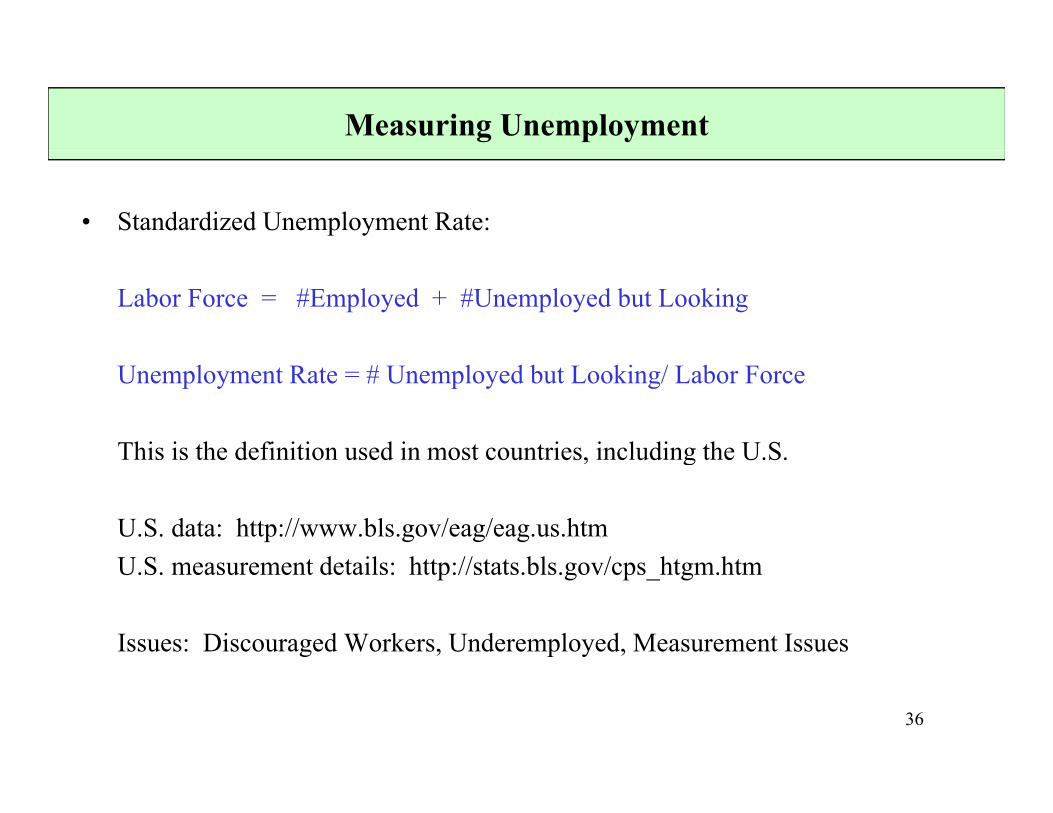
Measuring Unemployment
• Standardized Unemployment Rate:
Labor Force = #Employed + #Unemployed but Looking
Unemployment Rate = # Unemployed but Looking/ Labor Force
This is the definition used in most countries, including the U.S.This is the definition used in most countries, including the U.S.
U.S. data: http://www.bls.gov/eag/eag.us.htmU S t d t il htt // t t bl / ht htU.S. measurement details: http://stats.bls.gov/cps_htgm.htm
Issues: Discouraged Workers, Underemployed, Measurement Issues
36
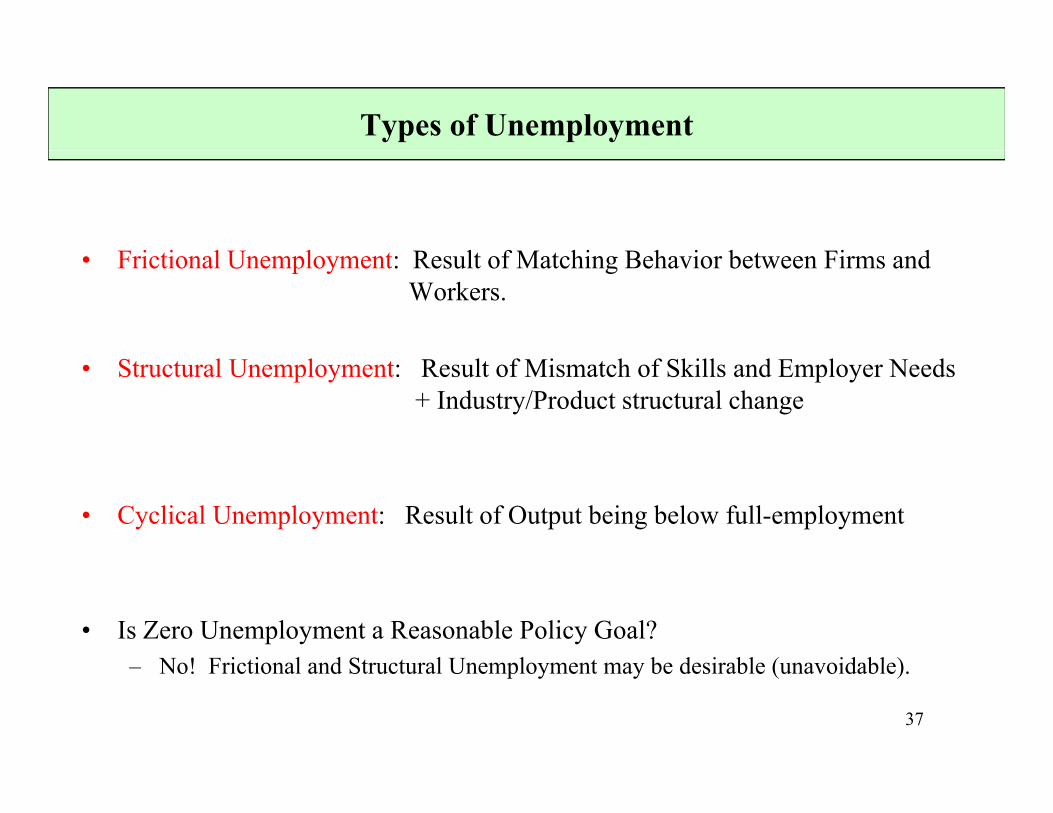
Types of Unemployment
F i ti l U l t R lt f M t hi B h i b t Fi d• Frictional Unemployment: Result of Matching Behavior between Firms and Workers.
• Structural Unemployment: Result of Mismatch of Skills and Employer Needs + Industry/Product structural change
• Cyclical Unemployment: Result of Output being below full-employment
• Is Zero Unemployment a Reasonable Policy Goal?No! Frictional and Structural Unemployment may be desirable (unavoidable)
37
– No! Frictional and Structural Unemployment may be desirable (unavoidable).
Why We Care About Unemployment
D i ti f H C it l• Depreciation of Human Capital
• Productive Extranalities
• Social Extranalities
• Individual Self Worth
38
PART V: Preview of the model
The Mechanics of The Course (1)
The Demand Side
• The aggregate demand (AD) curve represents the expenditure (demand) side of the economy.
• Aggregate demand curve will relates price changes with changes in ‘real’• Aggregate demand curve will relates price changes with changes in realexpenditures.
• Demand side of the economy will be the expenditure side of the economy!y p y
Y = C + I + G + NX (what we learned above)
• We will prove later in the course that the AD curve slopes down (take my word for it now). As prices increase, aggregate demand in the economy will fall.
40
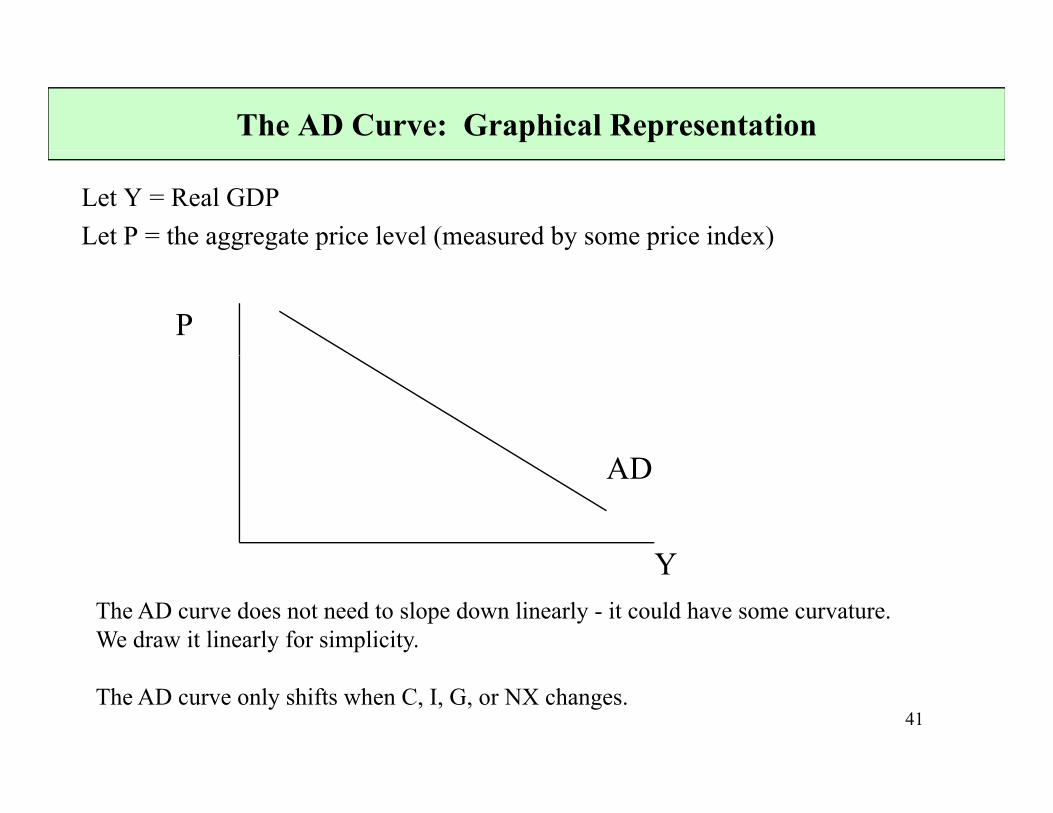
The AD Curve: Graphical Representation
Let Y = Real GDPLet P = the aggregate price level (measured by some price index)
P
AD
Y
AD
YThe AD curve does not need to slope down linearly - it could have some curvature. We draw it linearly for simplicity.
41The AD curve only shifts when C, I, G, or NX changes.
The Mechanics of The Course (2)
The Supply Side
• The aggregate supply (AS) curve represents the production (supply) side of the economy. The supply side of the economy is determined by firm production.
• Aggregate supply curve relates price changes with changes in production.
• The focus of next week’s lecture will be on the aggregate production function gg g pfor the economy.
Y = f(inputs in the economy; land, labor, machines, oil, etc)
• We will prove later in the course that the short run AS curve slopes upward (take my word again!). As prices increase, aggregate production in the
42
economy will rise.
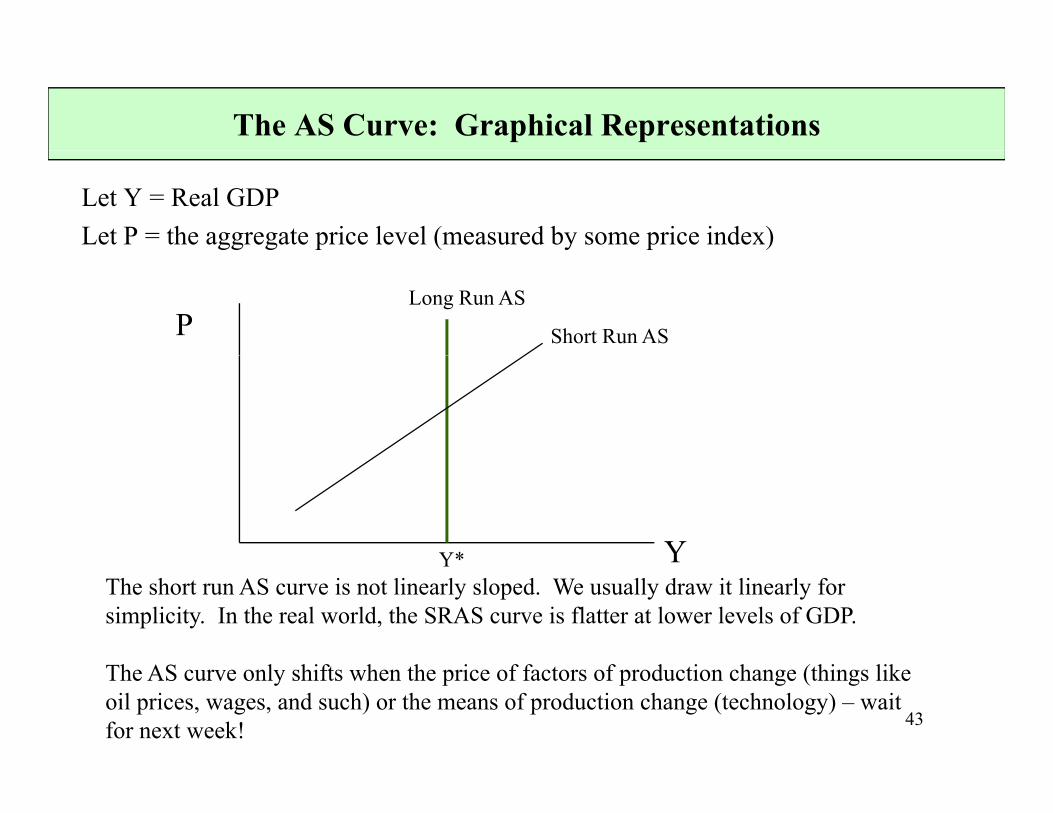
The AS Curve: Graphical Representations
Let Y = Real GDPLet P = the aggregate price level (measured by some price index)
P Short Run AS
Long Run AS
YY* YThe short run AS curve is not linearly sloped. We usually draw it linearly for simplicity. In the real world, the SRAS curve is flatter at lower levels of GDP.
Y
43
The AS curve only shifts when the price of factors of production change (things like oil prices, wages, and such) or the means of production change (technology) – wait for next week!

LONG RUN: Potential Output (Y*)
• Potential Output (Y*) is going to be the level of output in the economy where the economy is in long run equilibrium. In other words, if no shocks hit the
h ill Y* ( i ill i d Y*)economy, the economy will stay at Y* (or it will gravitate towards Y*).
(ok, that definition is kind of technical, what does Y* really mean?)
• Think of it this way, Y* is the level of economic activity that the economy was designed to sustain:g
– People are working the ‘right’ amount given labor market conditions (not working too much not working too little)working too much, not working too little),
– Machines are working the right amount given profit maximizing conditions (not working too much, not working too little)
44• We will formalize this (and all concepts) as the course progresses.
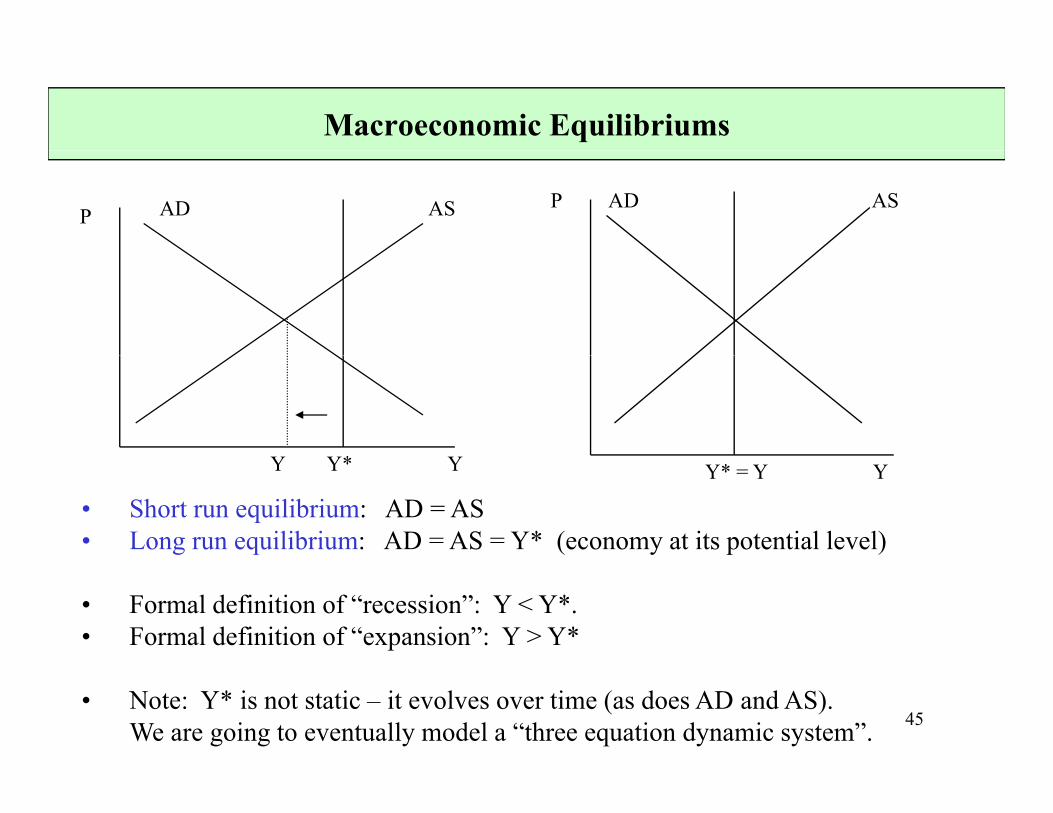
Macroeconomic Equilibriums
PP AD ASAD AS
Y Y* YY Y* Y Y* = Y Y
• Short run equilibrium: AD = AS• Long run equilibrium: AD = AS = Y* (economy at its potential level)
• Formal definition of “recession”: Y < Y*.• Formal definition of “expansion”: Y > Y*
45• Note: Y* is not static – it evolves over time (as does AD and AS).
We are going to eventually model a “three equation dynamic system”.
Macroeconomic Equilibrium
Short run equilibrium: AD equals short run AS (SRAS)
What does that mean? What is produced is equal to what is purchased (total expenditures).p )
Long run equilibrium: AD equals short run AS at the potential level of output (Long run AS curve - Y* = LRAS)(Long run AS curve Y LRAS)
What does that mean? What is produced is equal to what is purchased and what is produced is equal to the sustainable level of productionwhat is produced is equal to the sustainable level of production.
How are these equilibriums ensured? prices in the economy adjust (price level, i t t t )
46
interest rates, wages).
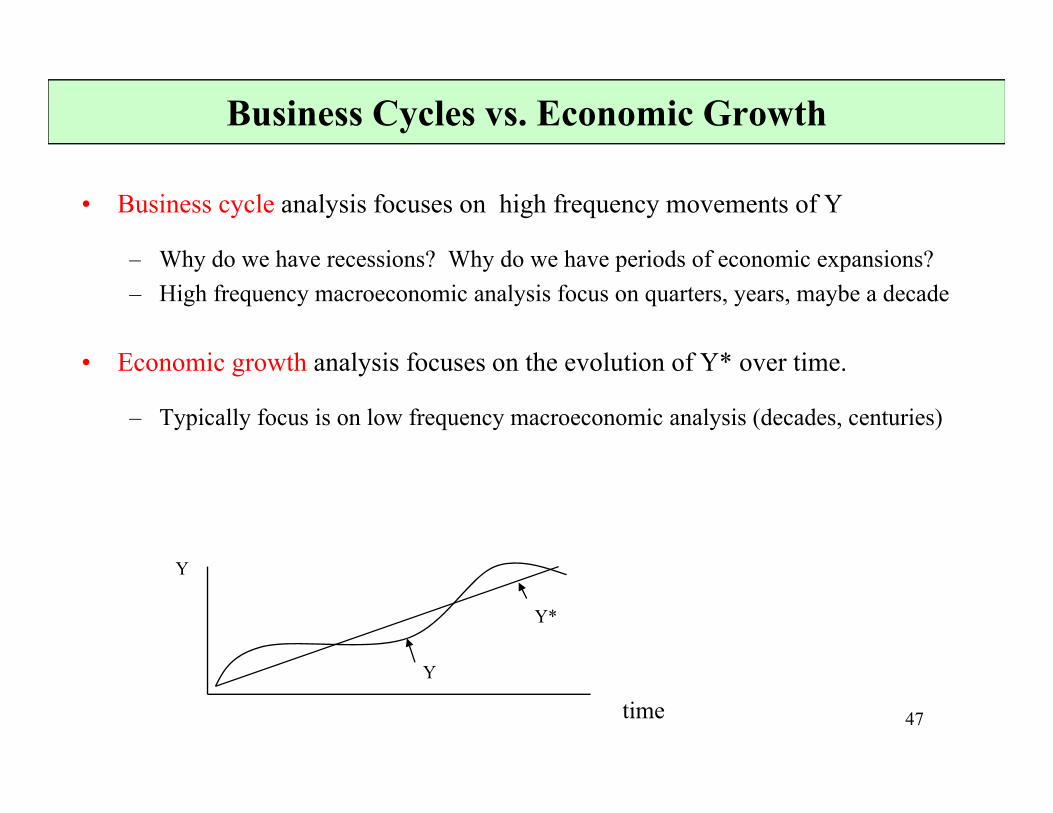
Business Cycles vs. Economic Growth
• Business cycle analysis focuses on high frequency movements of Y
Wh d h i ? Wh d h i d f i i ?– Why do we have recessions? Why do we have periods of economic expansions? – High frequency macroeconomic analysis focus on quarters, years, maybe a decade
E i th l i f th l ti f Y* ti• Economic growth analysis focuses on the evolution of Y* over time.
– Typically focus is on low frequency macroeconomic analysis (decades, centuries)
Y*
Y
47time
Y
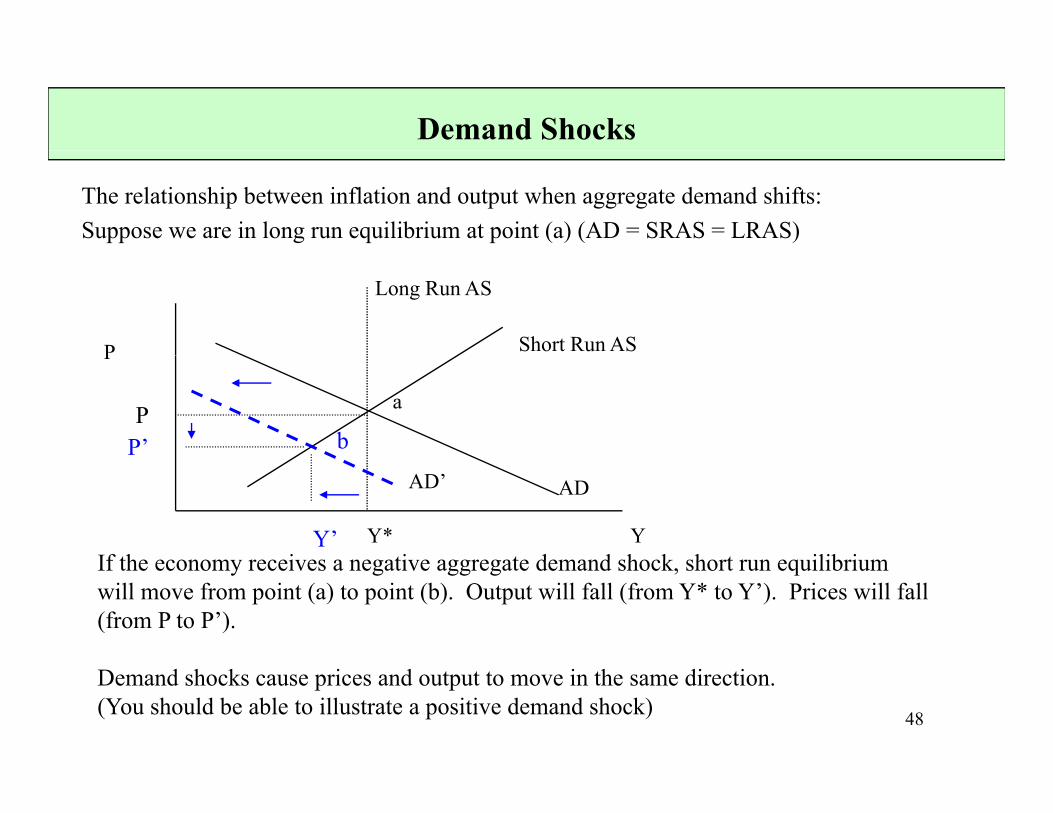
Demand Shocks
The relationship between inflation and output when aggregate demand shifts: Suppose we are in long run equilibrium at point (a) (AD = SRAS = LRAS)
Short Run AS
Long Run AS
PP
a
bP’P
Y
AD
Y*
AD’
Y’If the economy receives a negative aggregate demand shock short run equilibriumIf the economy receives a negative aggregate demand shock, short run equilibrium will move from point (a) to point (b). Output will fall (from Y* to Y’). Prices will fall (from P to P’).
48
Demand shocks cause prices and output to move in the same direction.(You should be able to illustrate a positive demand shock)
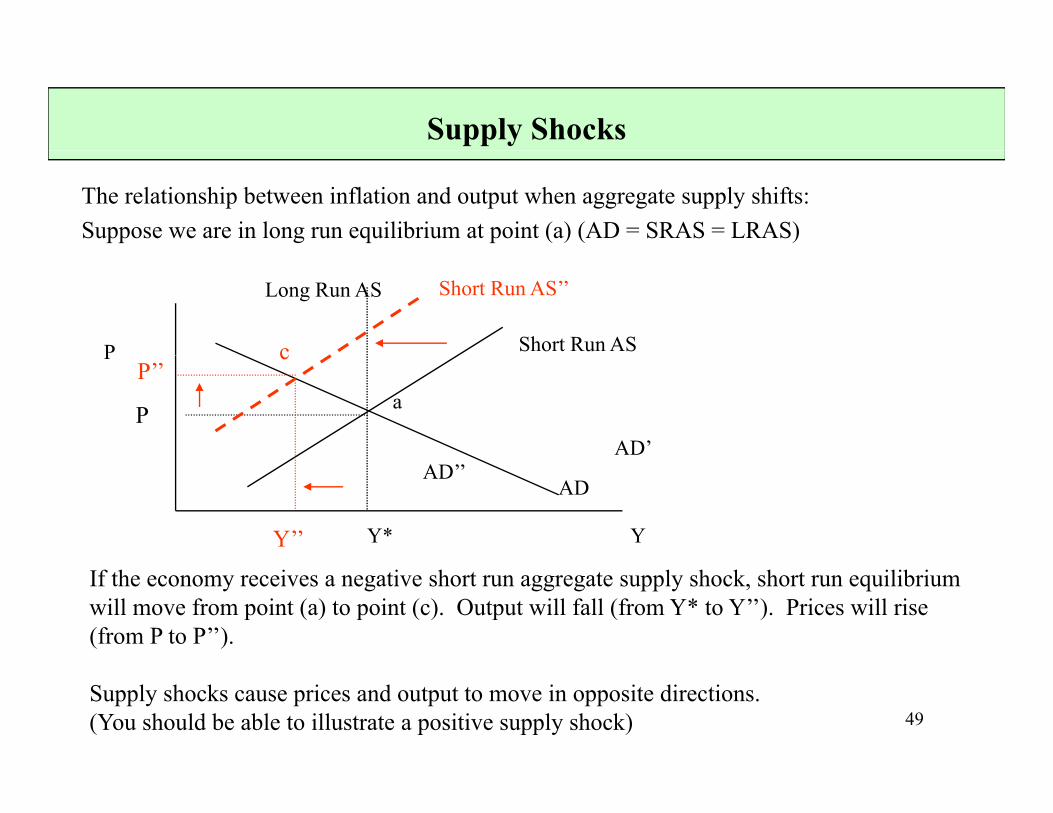
Supply Shocks
The relationship between inflation and output when aggregate supply shifts: Suppose we are in long run equilibrium at point (a) (AD = SRAS = LRAS)
Short Run AS
Long Run AS
P
Short Run AS’’
cP
AD’
aP’’
P
c
Y
AD
Y*
AD’’
Y’’
If the economy receives a negative short run aggregate supply shock, short run equilibrium will move from point (a) to point (c). Output will fall (from Y* to Y’’). Prices will rise (from P to P’’).
49Supply shocks cause prices and output to move in opposite directions.(You should be able to illustrate a positive supply shock)
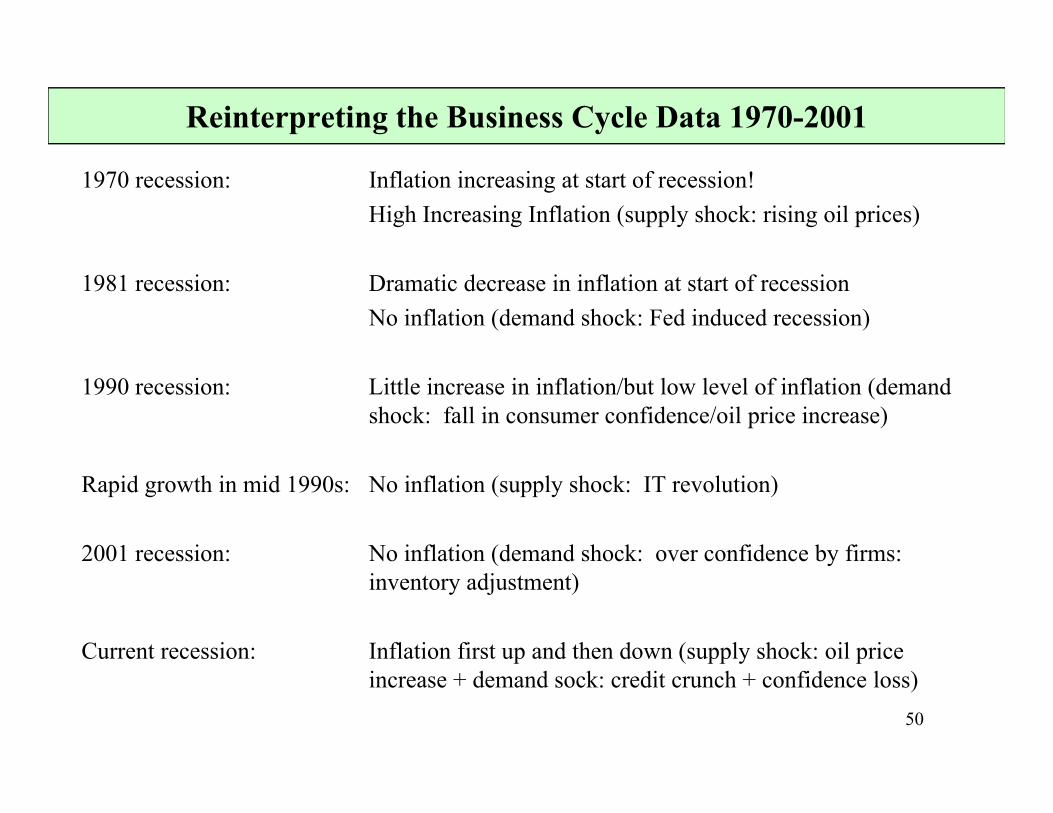
Reinterpreting the Business Cycle Data 1970-2001
1970 recession: Inflation increasing at start of recession! High Increasing Inflation (supply shock: rising oil prices)
1981 recession: Dramatic decrease in inflation at start of recessionNo inflation (demand shock: Fed induced recession)
1990 recession: Little increase in inflation/but low level of inflation (demand shock: fall in consumer confidence/oil price increase)
Rapid growth in mid 1990s: No inflation (supply shock: IT revolution)
2001 recession: No inflation (demand shock: over confidence by firms:2001 recession: No inflation (demand shock: over confidence by firms: inventory adjustment)
Current recession: Inflation first up and then down (supply shock: oil price
50
p ( pp y pincrease + demand sock: credit crunch + confidence loss)
MIT OpenCourseWarehttp://ocw.mit.edu
14.02 Principles of MacroeconomicsFall 2009
For information about citing these materials or our Terms of Use, visit: http://ocw.mit.edu/terms.