part - i parameters and metrics for category 'a ... · a methodology for ranking of...
TRANSCRIPT

Part - I
Parameters and Metrics for Category 'A' Institutions
(Architecture institutions)

A Methodology for Ranking of Architecture Institutions
Part - I : Parameters and Metrics for Category 'A' Institutions
Overview : Category 'A' Institutions
Summary of Ranking Parameters
Sr. No.
Parameter
Marks
Weightage
1 Teaching, Learning & Resource (TLR) 100 0.30
2 Research, Professional Practice & Collaborative Performance (RPC)
100
0.30
3 Graduation Outcome (GI) 100 0.15
4 Outreach and Inclusivity (OI) 100 0.15
5 Perception (PR) 100 0.10

A Methodology for Ranking of Architecture Institutions
Part - I : Parameters and Metrics for Category 'A' Institutions
Cumulative Sheet Sr. No. Parameter Weightage / Marks
1.0 Teaching, Learning and Resources (TLR) (Ranking Weightage = 0.30)
A1. Teacher Student Ratio with Emphasis on Permanent Faculty
25 Marks
A 2. . Teacher Student Ratio with Emphasis on Visiting Faculty
15 Marks
B. Combined Metric for Faculty with Ph.D, Professional Experience
20 Marks
C. Metric for Library, Studio, Laboratory Facilities 30 Marks
D. Metric for Sports and Extra Curricular Facilities 10 Marks
2.0 Research, Professional Practice & Collaborative Performance (RPC)
(Ranking Weightage = 0.30)
A. Combined Metric for Publications 30 Marks
B. Combined Metric for Citations 20 Marks
C.IPR and Patents/copy rights: Granted, Filed, Licensed 15 marks
D. Percentage of Collaborative Publications and Patents 15 Marks
E. Footprint of Projects and Professional Practice
20 Marks
3.0 Graduation Outcome (GO) (Ranking Weightage = 0.15)
A. Combined Performance in Public and University Examinations
20 Marks
B. Combined Metric for Placement, Higher Studies and Entrepreneurship
70 Marks
C. Mean Salary for Employment 10 Marks
4.0 Outreach and Inclusivity (OI) (Ranking Weightage = 0.15)
A. Outreach Footprint (Continuing Education, Service) 25 Marks
B. Percentage of Students from Other States/Countries 25 Marks
C. Percentage of Women Students and Faculty 20 Marks
D. Percentage of Economically and Socially Disadvantaged Students
20 Marks
E. Percentage of Physically Challenged Students 10 Marks
5.0 Perception (PR) (Ranking Weightage = 0.10)
Process for Peer Rating in Category 100 Marks

A Methodology for Ranking of Architecture Institutions
Part - I : Parameters and Metrics for Category 'A' Institutions
1
Teaching, Learning & Resources (TLR)
Teaching, Learning & Resources (TLR) – 100 Marks
Ranking Weight : 0.30
Overall Assessment Metric:
TLR = (FSR1 +FSR2+ FQE + LL + SEC )
The component metrics are explained on the following pages.

A Methodology for Ranking of Architecture Institutions
Part - I : Parameters and Metrics for Category 'A' Institutions
A1. Faculty-Student Ratio with Emphasis on Permanent Faculty (FSR) – 25 Marks
Assessment will be based on the ratio of number of regular faculty members in the Institute and total sanctioned/approved intake considering all UG & PG Programs.
Regular appointment means faculty on full time basis with no time limit on their employment. However, faculty on contract basis for a period of not less than three (3) years, on gross salary similar to those who are permanent can also be included.
Only faculty members with Ph.D or Masters qualifications in Architecture and its allied fields should be considered and counted here.
The benchmark is set as a ratio of 1:10 for scoring maximum Marks.
Assessment metric will be the same for Category A and Category B Institutions.
FSR1=25×[10×(F/N)]
Here,
N: Total number of sanctioned students in the institution considering all UG and PG Programs, including the Ph.D program. F: Full time regular faculty of all UG and PG Programs in the previous
For F/N < 1: 50, FSR will be set to zero.
A2. Faculty-Student Ratio with Emphasis on Eminent Visiting Faculty (FSR) – 15 Marks
Assessment will be based on the ratio of number of eminent visiting faculty members in the Institute and total sanctioned/approved intake considering all UG & PG Programs.

A Methodology for Ranking of Architecture Institutions
Part - I : Parameters and Metrics for Category 'A' Institutions
Eminent Visiting faculty means eminent faculty invited for not less than three hours per week and for a complete semester. Eminent Visiting faculty members with not less than Bachelors degree in Architecture and its allied fields with not less than 10 years of experience should be considered and counted here.
The benchmark is set as a ratio of 1:25 for scoring maximum Marks.
Assessment metric will be the same for Category A and Category B Institutions. FSR2=15×[25×(F/N)]
Here,
N: Total number of sanctioned students in the institution considering all UG and PG Programs, including the Ph.D program. F: Eminent Visiting faculty of all UG and PG Programs in the previous year.
For F/N < 1: 100, FSR will be set to zero. FSR=FSRI+FSR2

A Methodology for Ranking of Architecture Institutions
Part - I : Parameters and Metrics for Category 'A' Institutions
Data Collection:
From the concerned Institutions in prescribed format on an On-line facility. As mentioned in the preamble, an institution will be eligible for ranking, if all relevant, and updated data about the faculty members (in the previous three (3) years) is available on a publicly visible website. The data will be archived and also maintained by the ranking agency.
Data Verification:
By the Ranking Agency on a random sample basis.
A Methodology for Ranking of Architecture Institutions
Part - I : Parameters and Metrics for Category 'A' Institutions
i
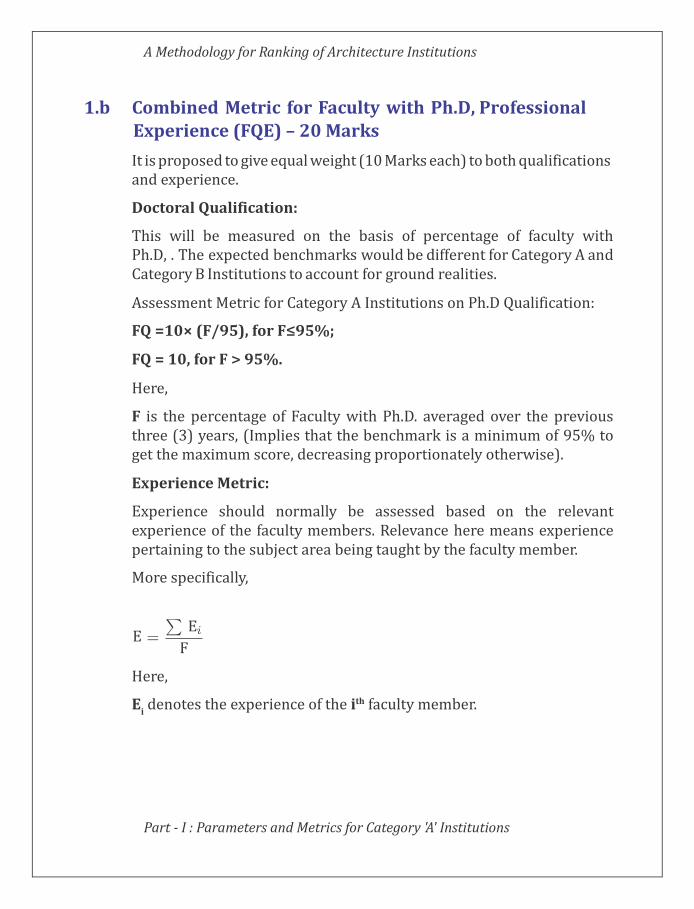
1.b Combined Metric for Faculty with Ph.D, Professional Experience (FQE) – 20 Marks
It is proposed to give equal weight (10 Marks each) to both qualifications and experience.
Doctoral Qualification:
This will be measured on the basis of percentage of faculty with Ph.D, . The expected benchmarks would be different for Category A and Category B Institutions to account for ground realities.
Assessment Metric for Category A Institutions on Ph.D Qualification:
FQ =10× (F/95), for F≤95%;
FQ = 10, for F > 95%.
Here,
F is the percentage of Faculty with Ph.D. averaged over the previous three (3) years, (Implies that the benchmark is a minimum of 95% to get the maximum score, decreasing proportionately otherwise).
Experience Metric:
Experience should normally be assessed based on the relevant experience of the faculty members. Relevance here means experience pertaining to the subject area being taught by the faculty member.
More specifically,
Here,
E denotes the experience of the ith faculty member.

A Methodology for Ranking of Architecture Institutions
Part - I : Parameters and Metrics for Category 'A' Institutions
i
For simplicity, however, E may also be calculated from the age profile of the faculty members as follows:
Ei = Ai – 30, for Ai ≤ 45 years
Ei = 15, for Ai ≥ 45 years.
Assessment Metric for Experience:
FE = 10×(E/15), for E ≤ 15 years
FE = 10, for E > 15 years.
Here,
E is the average years of experience of all faculty members as calculated above.
This implies that the benchmark experience is to be 15 years to score maximum marks, decreasing proportionately otherwise.
Data Collection:
Institutions to submit information in a tabular form indicating faculty name, age, qualifications (indicating the University attended for the qualifying degree) and experience under the categories of academic and professional. Updated data for the last three (3) years should be available on a publicly available website, and suitably archived for consistency check in subsequent years.
Data Verification:
On a random sampling basis.
Combined Metric for Faculty Qualifications and Experience:
FQE = FQ + FE

A Methodology for Ranking of Architecture Institutions
Part - I : Parameters and Metrics for Category 'A' Institutions
1.c Metric for Library, Studio and Laboratory Facilities (LL) – 30 Marks
It is proposed to give equal weights (15 Marks each) to Library, Studio a n d Laboratory facilities.
Library (LI):
LI = 15 × (Percentile parameter on the basis of annual expenditure (EXLI) on library resources per student)
EXLI = EXLIPS + EXLIES
EXLIPS = EXLIP/N
EXLIES = 2 × EXLIE/N
EXLIP: Actual Annual Expenditure on Physical Resources, Books, Journals, etc.
EXLIE: Actual Annual Expenditure on Electronic Resources, Books, Journals etc.
If this expenditure is below a threshold value to be determined separately for each category of institutions,
EXLI = 0
Studio and Laboratories (SLB):
SLB = 15 × (Percentile parameter on the basis of annual expenditure (EXSLB) on running studio projects , creation and maintenance of laboratory resources)
If this expenditure is below a threshold value to be determined separately for each category of institutions, EXSLB = 0
Combined Metric for Library, Studio and Lab Resources:
LL=LI + SLB
A Methodology for Ranking of Architecture Institutions
Part - I : Parameters and Metrics for Category 'A' Institutions
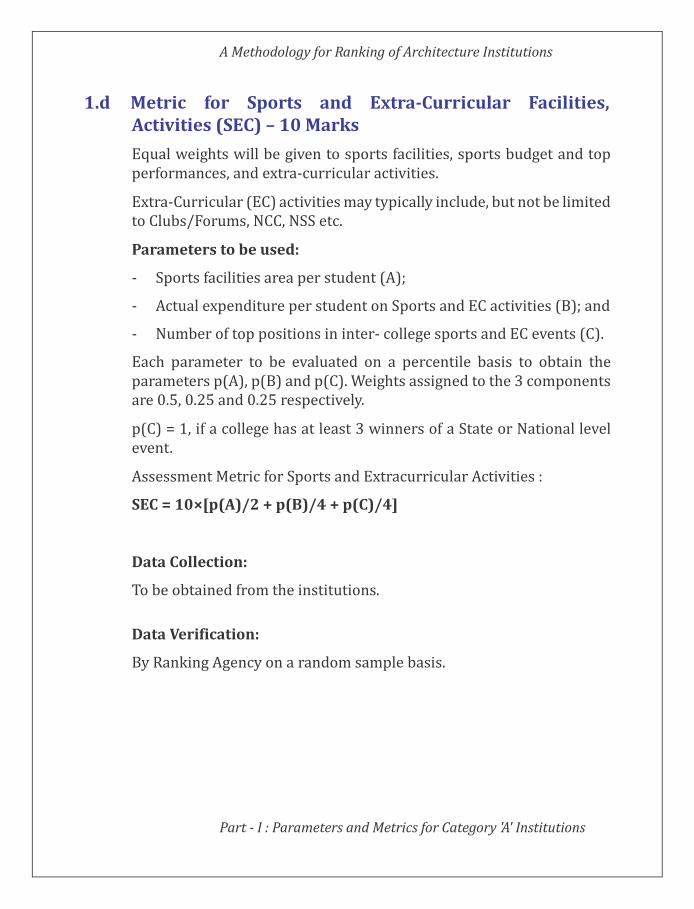
1.d Metric for Sports and Extra-Curricular Facilities, Activities (SEC) – 10 Marks
Equal weights will be given to sports facilities, sports budget and top performances, and extra-curricular activities.
Extra-Curricular (EC) activities may typically include, but not be limited to Clubs/Forums, NCC, NSS etc.
Parameters to be used:
- Sports facilities area per student (A);
- Actual expenditure per student on Sports and EC activities (B); and
- Number of top positions in inter- college sports and EC events (C).
Each parameter to be evaluated on a percentile basis to obtain the parameters p(A), p(B) and p(C). Weights assigned to the 3 components are 0.5, 0.25 and 0.25 respectively.
p(C) = 1, if a college has at least 3 winners of a State or National level event.
Assessment Metric for Sports and Extracurricular Activities :
SEC = 10×[p(A)/2 + p(B)/4 + p(C)/4]
Data Collection:
To be obtained from the institutions.
Data Verification:
By Ranking Agency on a random sample basis.

A Methodology for Ranking of Architecture Institutions
2 Research, Professional Practice &
Collaborative Performance (RPC)
Research, Professional Practice & Collaborative Performance (RPC) – 100 Marks
Ranking Weight : 0.30
Overall Assessment Metric:
RPC = (PU + CI + IPR + CP + FPPP)
The component metrics are explained on the following pages.

A Methodology for Ranking of Architecture Institutions
Part - I : Parameters and Metrics for Category 'A' Institutions
2.a Combined Metric for Publications (PU) – 30 Marks
It is proposed that Publications indexed in Scopus, Web of Science, Google Scholar will be counted for assessment. An average value P for the previous three (3) years will be computed as detailed later in this item.
The Institution will submit faculty publication list as supporting information. However, the primary sources of information will be Scopus, Web of Science and Google Scholar.
Books/Monographs should have ISBN number and be published by reputed publishers.
Assessment Metric for Publications:
PU = 30× Percentile parameter (expressed as a fraction) on the basis of (P/F)
P is the number of publications = Weighted average of numbers given by Scopus, Web of Science, Google Scholar over the previous three years.
P = 0.2 PW + 0.3 PS + 0.5PG
Here,
PW: Number of publications reported in Web of Science.
PS: Number of publications reported in Scopus
PG: Number of publications reported in Google Scholar.
F is the number of regular faculty members as used in Item 1.

A Methodology for Ranking of Architecture Institutions
Part - I : Parameters and Metrics for Category 'A' Institutions
2.b Combined Metric for Citations (CI) – 20 Marks
The proposed assessment is based on the ratio of number of citations in the previous three (3) years to the number of papers published during this time. A weighted average of the numbers from the three popular Databases will be used.
Institutions will be asked to provide information in a tabular form giving relevant details. However, the primary sources will be the seven standard Databases Scopus, Web of Science, Google Scholar.
Assessment Metric for Citations:
CI = [20 × Percentile parameter (expressed as a fraction) on the basis of (CC/P) for Category A × Percentile parameter on the basis of P]
Here,
CC is Total Citation Count over previous 3 years, and
P is total number of publications over this period as computed for 2a.
CC is computed as follows
CC = (0.2 CCW + 0.3 CCS + 0.5 CCG)
Here,
CCW : Total Number of Citations reported in Web of Science.
CCS : Total Number of Citations reported in Scopus.
CCG : Total Number of Citations reported in Google Scholar.

A Methodology for Ranking of Architecture Institutions
Part - I : Parameters and Metrics for Category 'A' Institutions
2.c IPR and Patents/copy rights: Granted, Filed, Licensed (IPR)– 15 Marks
Proposed Marks distribution :
Granted : 6 Marks,
Filed : 3 Marks,
Licensed : 6 Marks
IPR will be include broadly based on registered copyrights, designs and patents over the last three (3) years.
Assessment method will be identical for both category of institutions; however, the indicated percentile will be calculated for the two categories separately.
IPR = PF + PG + PL
Assessment of IPR on patents (including copyrights and designs) filed:
PF = 3× Percentile parameter (expressed as a fraction) on the basis of (PF/F )
Here,
PF is the number of patents, copyrights, designs filed.
F is the number of regular faculty members.
Assessment Metric for IPR on patents (including copyrights and designs) granted:
PG = 6× Percentile parameter (expressed as a fraction) on the basis of (PG/F )
Here,
PG is the number of patents, copyrights, designs granted/registered.
F is the number of regular faculty members.
A Methodology for Ranking of Architecture Institutions
Part - I : Parameters and Metrics for Category 'A' Institutions
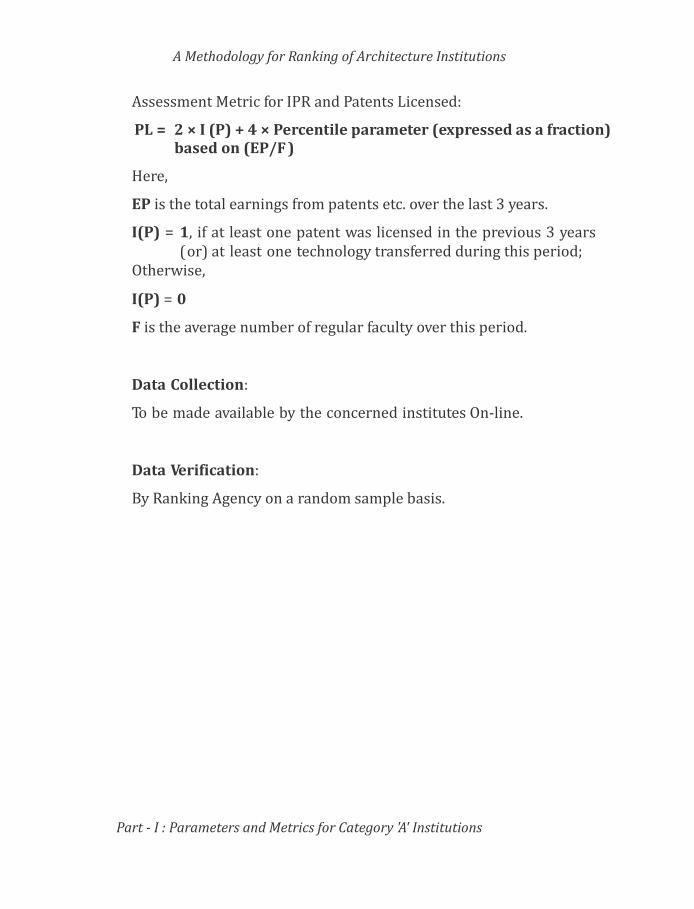
Assessment Metric for IPR and Patents Licensed:
PL = 2 × I (P) + 4 × Percentile parameter (expressed as a fraction) based on (EP/F )
Here,
EP is the total earnings from patents etc. over the last 3 years.
I(P) = 1, if at least one patent was licensed in the previous 3 years ( or) at least one technology transferred during this period;
Otherwise,
I(P) = 0
F is the average number of regular faculty over this period.
Data Collection:
To be made available by the concerned institutes On-line.
Data Verification:
By Ranking Agency on a random sample basis.

A Methodology for Ranking of Architecture Institutions
Part - I : Parameters and Metrics for Category 'A' Institutions
2.d. Percentage of Collaborative Publications and Patents (CP) – 15 Marks
Assessment Metric for Collaborative Publication and Patents:
CP = 15 × (Fraction of publications and projects jointly with outside collaborators + Fraction of patents jointly with outside collaborators)
In case this number turns out to be more than 2 0, the score will be restricted to this value.
Data Collection:
Mainly from Databases like Scopus, Web of Science and Google Scholar. Could be aided by information from the institute.
A Methodology for Ranking of Architecture Institutions
Part - I : Parameters and Metrics for Category 'A' Institutions
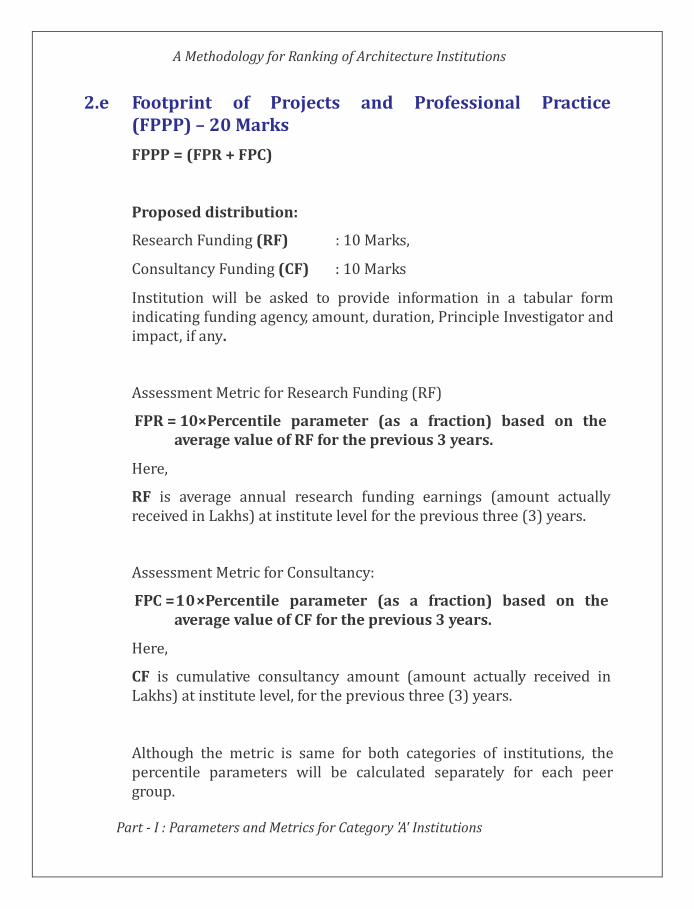
2.e Footprint of Projects and Professional Practice (FPPP) – 20 Marks
FPPP = (FPR + FPC)
Proposed distribution:
Research Funding (RF) : 10 Marks,
Consultancy Funding (CF) : 10 Marks
Institution will be asked to provide information in a tabular form indicating funding agency, amount, duration, Principle Investigator and impact, if any.
Assessment Metric for Research Funding (RF)
FPR = 10×Percentile parameter (as a fraction) based on the average value of RF for the previous 3 years.
Here,
RF is average annual research funding earnings (amount actually received in Lakhs) at institute level for the previous three (3) years.
Assessment Metric for Consultancy:
FPC =10×Percentile parameter (as a fraction) based on the average value of CF for the previous 3 years.
Here,
CF is cumulative consultancy amount (amount actually received in Lakhs) at institute level, for the previous three (3) years.
Although the metric is same for both categories of institutions, the percentile parameters will be calculated separately for each peer group.
A Methodology for Ranking of Architecture Institutions
3 Graduation Outcome (GO)
Graduation Outcome (GO) –100 Marks
Ranking Weight: 0.15
Overall Assessment Metric:
GO = (PUE + PHE + MS)
The component metrics are explained on the following pages.
A Methodology for Ranking of Architecture Institutions
Part - I : Parameters and Metrics for Category 'A' Institutions
i
i
i
i i
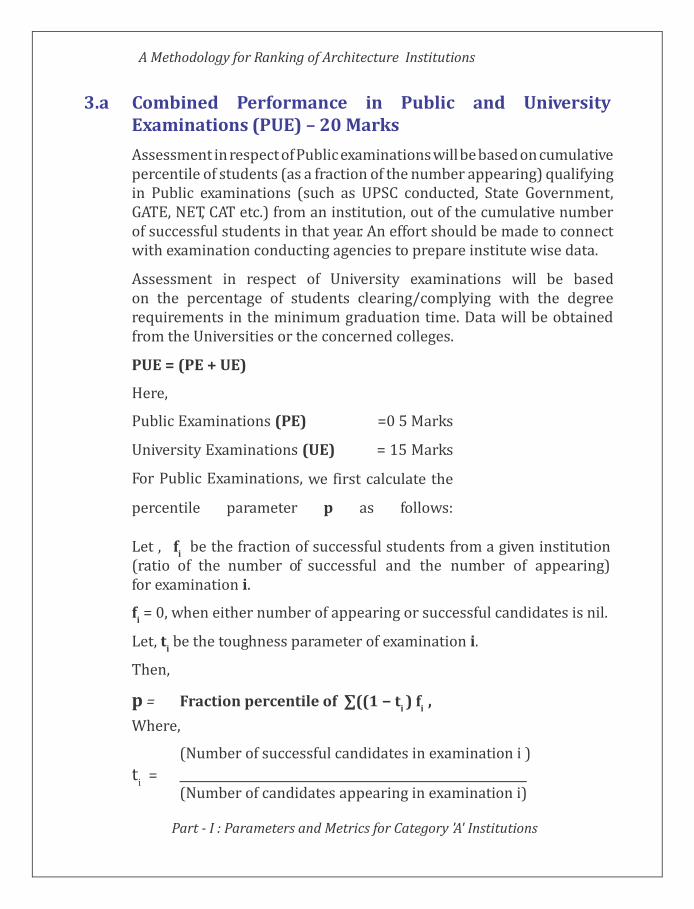
3.a Combined Performance in Public and University Examinations (PUE) – 20 Marks
Assessment in respect of Public examinations will be based on cumulative percentile of students (as a fraction of the number appearing) qualifying in Public examinations (such as UPSC conducted, State Government, GATE, NET, CAT etc.) from an institution, out of the cumulative number of successful students in that year. An effort should be made to connect with examination conducting agencies to prepare institute wise data.
Assessment in respect of University examinations will be based on the percentage of students clearing/complying with the degree requirements in the minimum graduation time. Data will be obtained from the Universities or the concerned colleges.
PUE = (PE + UE)
Here,
Public Examinations (PE) =0 5 Marks
University Examinations (UE) = 15 Marks
For Public Examinations, we first calculate the
percentile parameter p as follows:
Let , f
be the fraction of successful students from a given institution(ratio of the number of successful and the number of appearing) for examination i.
f = 0, when either number of appearing or successful candidates is nil.
Let, t be the toughness parameter of examination i.
Then,
p = Fraction percentile of ∑((1 − t ) f ,
Where,
(Number of successful candidates in examination i )
t = i
(Number of candidates appearing in examination i)
A Methodology for Ranking of Architecture Institutions
Part - I : Parameters and Metrics for Category 'A' Institutions
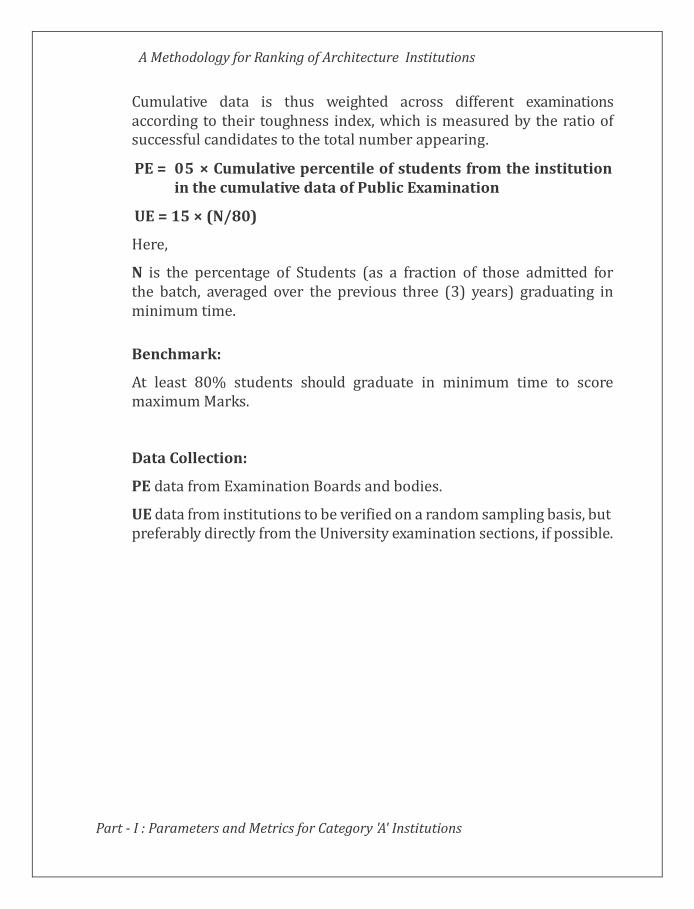
Cumulative data is thus weighted across different examinations according to their toughness index, which is measured by the ratio of successful candidates to the total number appearing.
PE = 05 × Cumulative percentile of students from the institution in the cumulative data of Public Examination
UE = 15 × (N/80)
Here,
N is the percentage of Students (as a fraction of those admitted for the batch, averaged over the previous three (3) years) graduating in minimum time.
Benchmark:
At least 80% students should graduate in minimum time to score maximum Marks.
Data Collection:
PE data from Examination Boards and bodies.
UE data from institutions to be verified on a random sampling basis, but preferably directly from the University examination sections, if possible.
A Methodology for Ranking of Architecture Institutions
Part - I : Parameters and Metrics for Category 'A' Institutions
3
1
3 2
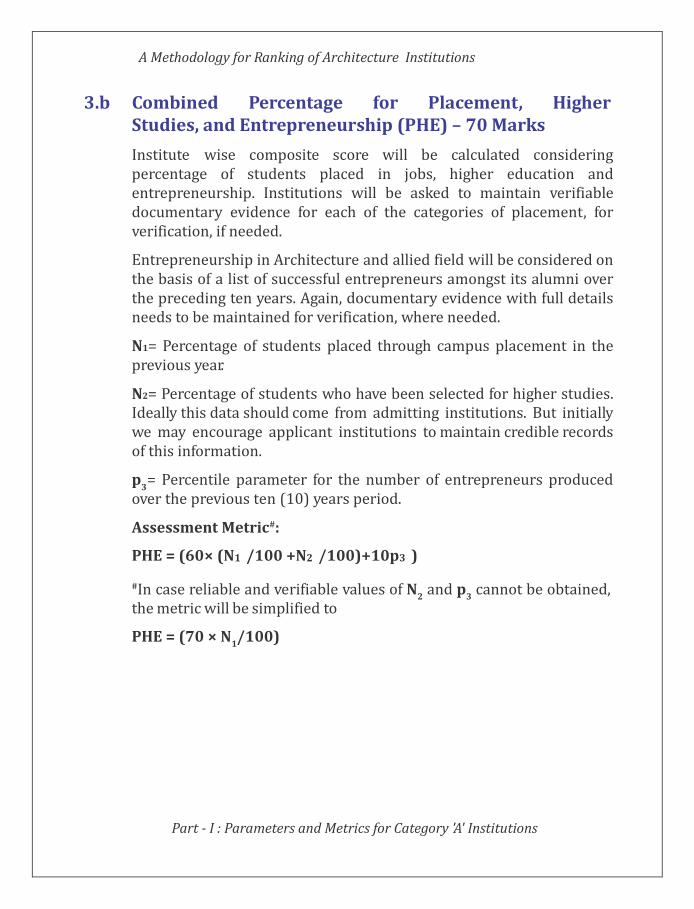
3.b Combined Percentage for Placement, Higher Studies, and Entrepreneurship (PHE) – 70 Marks
Institute wise composite score will be calculated considering percentage of students placed in jobs, higher education and entrepreneurship. Institutions will be asked to maintain verifiable documentary evidence for each of the categories of placement, for verification, if needed.
Entrepreneurship in Architecture and allied field will be considered on the basis of a list of successful entrepreneurs amongst its alumni over the preceding ten years. Again, documentary evidence with full details needs to be maintained for verification, where needed.
N1= Percentage of students placed through campus placement in the previous year.
N2= Percentage of students who have been selected for higher studies. Ideally this data should come from admitting institutions. But initially we may encourage applicant institutions to maintain credible records of this information.
p = Percentile parameter for the number of entrepreneurs produced over the previous ten (10) years period.
Assessment Metric#:
PHE = (60× (N1 /100 +N2 /100)+10p3 )
#In case reliable and verifiable values of N the metric will be simplified to
PHE = (70 × N /100)
and p cannot be obtained,

A Methodology for Ranking of Architecture Institutions
Part - I : Parameters and Metrics for Category 'A' Institutions
3.c Mean Salary for Employment (MS) – 10 Marks
Institutions will be asked to submit and maintain information regarding average salary and highest salary.
The information will be evaluated relatively on percentile basis separately for Category A and Category B institutions.
Suggestion:
In due course of time, this data could be requested from a list of chosen 100 (or 50) top employers to obtain average salary offered to students from different institutions. The bouquet of employers could be different for each category of institutions. The list of employers could be rotated from year to year to avoid biases of any kind.
Alternatively, this data could also be populated through outsourcing the task to a reliable market survey agency.
MS = (10 × Average salary of graduates from an institution as a percentile parameter of the maximum average salary across institutions × Placement percentile parameter)
Alternatively, we may attempt to obtain this data and ascertain its reliability. Once reliable data starts coming in, this metric may be used. Otherwise, we may modify the marks of various other components.

A Methodology for Ranking of Architecture Institutions
Part - I : Parameters and Metrics for Category 'A' Institutions
4 Outreach and Inclusivity (OI)
Outreach and Inclusivity (OI) – 100 Marks
Ranking Weight: 0.15
Overall Assessment Metric:
OI = (CES + WS +ESCS + PCS)
The component metrics are explained on the following pages.

A Methodology for Ranking of Architecture Institutions
Part - I : Parameters and Metrics for Category 'A' Institutions
4.a Outreach Footprint (Continuing Education, Service) (CES) – 25 Marks
Information to be sought from institutions regarding:
- Names and Number of CEP courses organized with participation numbers. Teacher Training and related outreach activities.
- Participation in technology enhanced programs like NPTEL, Virtual Labs or related activities like TEQIP etc.
- Interactions with industry.
- Facilitation of faculty in quality improvement.
- Any other activities falling in this category.
Assessment Metric
CES = (25 × Percentile parameter based on N)
Here,
N: Number of participation certificates issued per year (averaged over previous three ( 3) years) to Teachers/Industry Personnel etc. for outreach programs of six (6) days or more.
Percentile parameter calculated separately for each category of institutions.

A Methodology for Ranking of Architecture Institutions
Part - I : Parameters and Metrics for Category 'A' Institutions
4.b Percent Students from other States/Countries - Region Diversity (RD) – 25 Marks
Assessment Metric:
RD = (18 × Percentile fraction of total students admitted (averaged over past 3 years) from other states + 7 × Percentile fraction of students admitted (averaged over past 3 years) from other countries)
A Methodology for Ranking of Architecture Institutions
Part - I : Parameters and Metrics for Category 'A' Institutions
3
N
1 2
N 1 2
3
4.c Percentage of Women Students and Faculty (WS) – 20 Marks
WS=8 × (N
Here,
/50) + 8 × (N /20)+(4 x N /2)
and N
are the percentage of Women Students and faculty respectively.
is the number of women members of eminence as Institute Head or on the Governing Board.
Bench Marks:
50% women students and 20% women faculty and 2 women as Institute Head or in the Governing Board expected to score maximum marks.
A Methodology for Ranking of Architecture Institutions
Part - I : Parameters and Metrics for Category 'A' Institutions
4.d Percentage of Economically and Socially Disadvantaged Students (ESDS) – 20 Marks
ESCS =20× (N/50)
Here,
N is the percentage of economically and socially disadvantaged Students averaged over the previous 3 years.
Benchmark:
50% economically and socially disadvantaged students should be admitted to score maximum marks.
A Methodology for Ranking of Architecture Institutions
Part - I : Parameters and Metrics for Category 'A' Institutions
4.e Facilities for Physically Challenged Students (PCS) –10 Marks
PCS = 10 Marks,
If the Institute provides full facilities for physically challenged students.
NAAC and NBA may be requested to provide their assessment, as possible.
A Methodology for Ranking of Architecture Institutions
Part - I : Parameters and Metrics for Category 'A' Institutions
5 Perception (PR)
Perception (PR) – 100 Marks
Ranking Weight: 0.1
Overall Assessment Metric:
P = PR
The component metrics are explained on the following pages.

A Methodology for Ranking of Architecture Institutions
Part - I : Parameters and Metrics for Category 'A' Institutions
5.a Process for Peer Rating in Category (PR) – 100 Marks
- This is to be done through a survey conducted over a large category of academics, institution heads, Architectural firms, HR head of employers, members of funding agencies in Government, Private sector, NGOs, etc.
- Lists may be obtained from institutions and a comprehensive list may be prepared taking into account various sectors, regions, etc.
- Lists to be rotated periodically.
- This will be an On-line survey carried out in a time-bound fashion.

A Methodology for Ranking of Architecture Institutions
Part - II Parameters and Metrics
for Category 'B' Institutions (Architecture institutions)

A Methodology for Ranking of Architecture Institutions
Part - II : Parameters And Metrics for Category 'B' Institutions
Overview : Category 'B' Institutions
Summary of Ranking Parameters
Sr. No.
Parameter
Marks
Weightage
1 Teaching, Learning & Resources (TLR) 100 0.30
2 Research, Professional Practice & Collaborative Performance (RPC)
100
0.20
3 Graduation Outcome(GO) 100 0.25
4 Outreach and Inclusivity(OI) 100 0.15
5 Perception(PR) 100 0.10
A Methodology for Ranking of Architecture Institutions
Part - II : Parameters And Metrics for Category 'B' Institutions
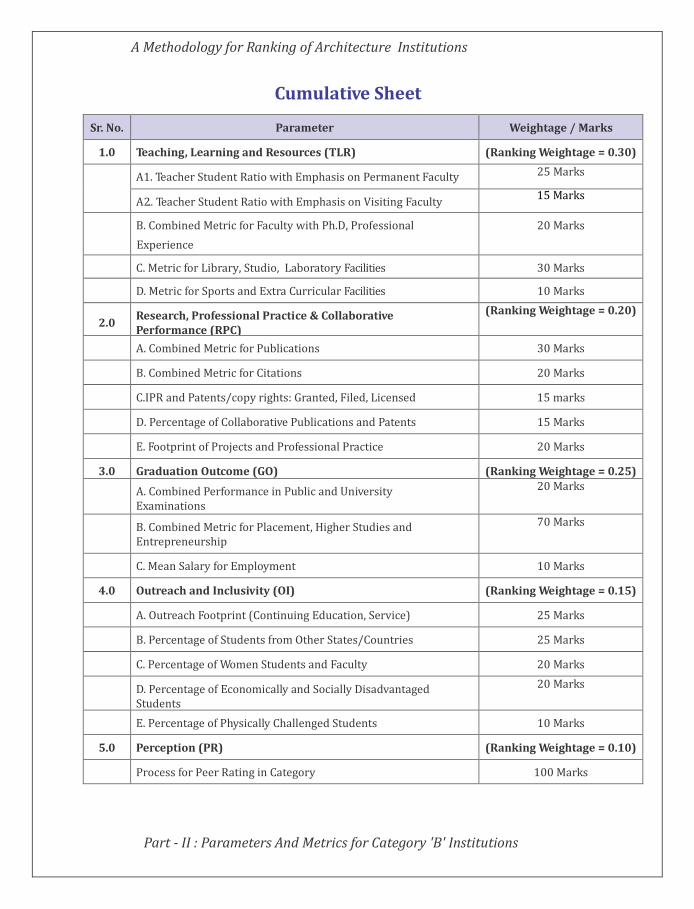
Cumulative Sheet
Sr. No. Parameter Weightage / Marks
1.0 Teaching, Learning and Resources (TLR) (Ranking Weightage = 0.30)
A1. Teacher Student Ratio with Emphasis on Permanent Faculty
25 Marks
A 2. . Teacher Student Ratio with Emphasis on Visiting Faculty
15 Marks
B. Combined Metric for Faculty with Ph.D, Professional
Experience
20 Marks
C. Metric for Library, Studio, Laboratory Facilities 30 Marks
D. Metric for Sports and Extra Curricular Facilities 10 Marks
2.0 Research, Professional Practice & Collaborative Performance (RPC)
(Ranking Weightage = 0.20)
A. Combined Metric for Publications 30 Marks
B. Combined Metric for Citations 20 Marks
C.IPR and Patents/copy rights: Granted, Filed, Licensed 15 marks
D. Percentage of Collaborative Publications and Patents 15 Marks
E. Footprint of Projects and Professional Practice 20 Marks
3.0 Graduation Outcome (GO) (Ranking Weightage = 0.25)
A. Combined Performance in Public and University Examinations
20 Marks
B. Combined Metric for Placement, Higher Studies and Entrepreneurship
70 Marks
C. Mean Salary for Employment 10 Marks
4.0 Outreach and Inclusivity (OI) (Ranking Weightage = 0.15)
A. Outreach Footprint (Continuing Education, Service) 25 Marks
B. Percentage of Students from Other States/Countries 25 Marks
C. Percentage of Women Students and Faculty 20 Marks
D. Percentage of Economically and Socially Disadvantaged Students
20 Marks
E. Percentage of Physically Challenged Students 10 Marks
5.0 Perception (PR) (Ranking Weightage = 0.10)
Process for Peer Rating in Category 100 Marks

A Methodology for Ranking of Architectue Institutions
Part - II : Parameters And Metrics for Category 'B' Institutions
1
Teaching, Learning & Resources (TLR)
Teaching, Learning & Resources (TLR) – 100 Marks
Ranking Weight : 0.30
Overall Assessment Metric:
TLR = (FSR1 +FSR2+ FQE + LL + SEC )
The component metrics are explained on the following pages.

A Methodology for Ranking of Architecture Institutions
Part - II : Parameters And Metrics for Category 'B' Institutions
A1. Faculty-Student Ratio with Emphasis on Permanent Faculty (FSR) – 25 Marks
Assessment will be based on the ratio of number of regular faculty members in the Institute and total sanctioned/approved intake considering all UG & PG Programs.
Regular appointment means faculty on full time basis with no time limit on their employment. However, faculty on contract basis for a period of not less than three (3) years, on gross salary similar to those who are permanent can also be included.
Only faculty members with Ph.D or Masters qualifications in Architecture and its allied fields should be considered and counted here. The benchmark is set as a ratio of 1:10 for scoring maximum Marks. Assessment metric will be the same for Category A and Category B Institutions.
FSR1=25×[10×(F/N)]
Here,
N: Total number of sanctioned students in the institution considering all UG and PG Programs, including the Ph.D program. F: Full time regular faculty of all UG and PG Programs in the previous
For F/N < 1: 50, FSR will be set to zero.
A2. Faculty-Student Ratio with Emphasis on Eminent Visiting Faculty (FSR) – 15 Marks
Assessment will be based on the ratio of number of eminent visiting faculty members in the Institute and total sanctioned/approved intake considering all UG & PG Programs.

A Methodology for Ranking of Architecture Institutions
Part - II : Parameters And Metrics for Category 'B' Institutions
Eminent Visiting faculty means Eminent faculty invited for not less than three hours per week and for a complete semester. Eminent Visiting faculty members with not less than Bachelors degree in Architecture and its allied fields with not less than 10 years of experience should be considered and counted here.
The benchmark is set as a ratio of 1:25 for scoring maximum Marks.
Assessment metric will be the same for Category A and Category B Institutions. FSR2=15×[25×(F/N)]
Here,
N: Total number of sanctioned students in the institution considering all UG and PG Programs, including the Ph.D program. F: Eminent Visiting faculty of all UG and PG Programs in the previous year.
A Methodology for Ranking of Architecture Institutions
Part - II : Parameters And Metrics for Category 'B' Institutions
Data Collection:
From the concerned Institutions in prescribed format on an On-line facility. As mentioned in the preamble, an institution will be eligible for ranking, if all relevant, and updated data about the faculty members (in the previous three (3) years) is available on a publicly visible website. The data will be archived and also maintained by the ranking agency.
Data Verification:
By the Ranking Agency on a random sample basis.

A Methodology for Ranking of Architecture Institutions
Part - II : Parameters And Metrics for Category 'B' Institutions
i
1.b Combined Metric for Faculty with Ph.D, Professional Experience (FQE) – 20 Marks
It is proposed to give equal weight (10 Marks each) to both qualifications and experience.
Doctoral Qualification:
This will be measured on the basis of percentage of faculty with Ph.D,. The expected benchmarks would be different for Category A and Category B Institutions to account for ground realities.
Assessment Metric for Category B Institutions on Ph.D Qualification:
FQ =10× (F/95), for F≤95%;
FQ = 10, for F > 95%.
Here,
F is the percentage of Faculty with Ph.D. averaged over the previous three (3) years, (Implies that the benchmark is a minimum of 95% to get the maximum score, decreasing proportionately otherwise).
Experience Metric:
Experience should normally be assessed based on the relevant experience of the faculty members. Relevance here means experience pertaining to the subject area being taught by the faculty member.
More specifically,
Here,
E denotes the experience of the ith faculty member.
A Methodology for Ranking of Architecture Institutions
Part - II : Parameters And Metrics for Category 'B' Institutions
i
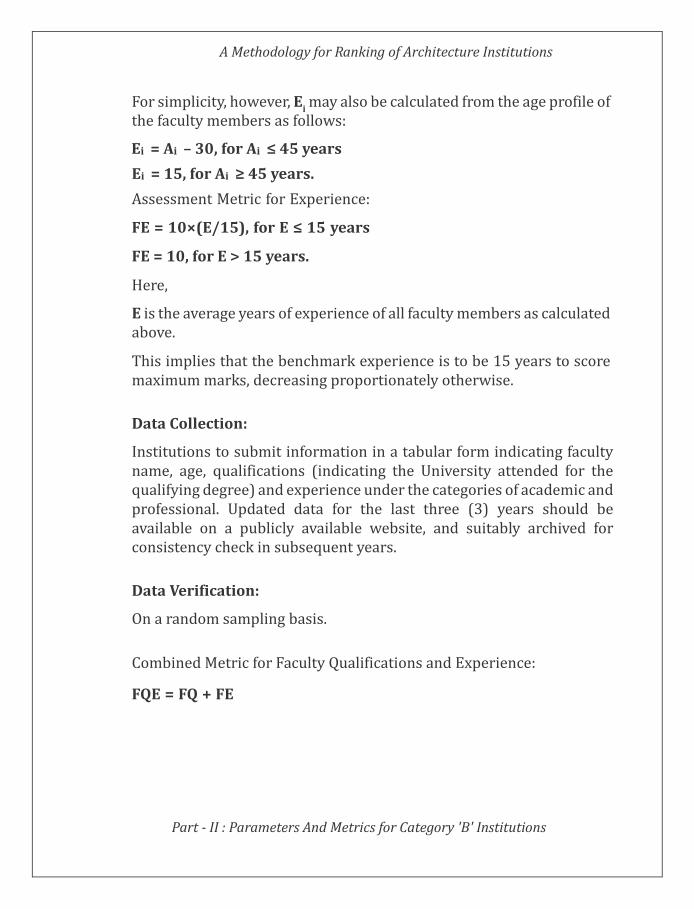
For simplicity, however, E may also be calculated from the age profile of the faculty members as follows:
Ei = Ai – 30, for Ai ≤ 45 years
Ei = 15, for Ai ≥ 45 years.
Assessment Metric for Experience:
FE = 10×(E/15), for E ≤ 15 years
FE = 10, for E > 15 years.
Here,
E is the average years of experience of all faculty members as calculated above.
This implies that the benchmark experience is to be 15 years to score maximum marks, decreasing proportionately otherwise.
Data Collection:
Institutions to submit information in a tabular form indicating faculty name, age, qualifications (indicating the University attended for the qualifying degree) and experience under the categories of academic and professional. Updated data for the last three (3) years should be available on a publicly available website, and suitably archived for consistency check in subsequent years.
Data Verification:
On a random sampling basis.
Combined Metric for Faculty Qualifications and Experience:
FQE = FQ + FE
A Methodology for Ranking of Architecture Institutions
Part - II : Parameters And Metrics for Category 'B' Institutions
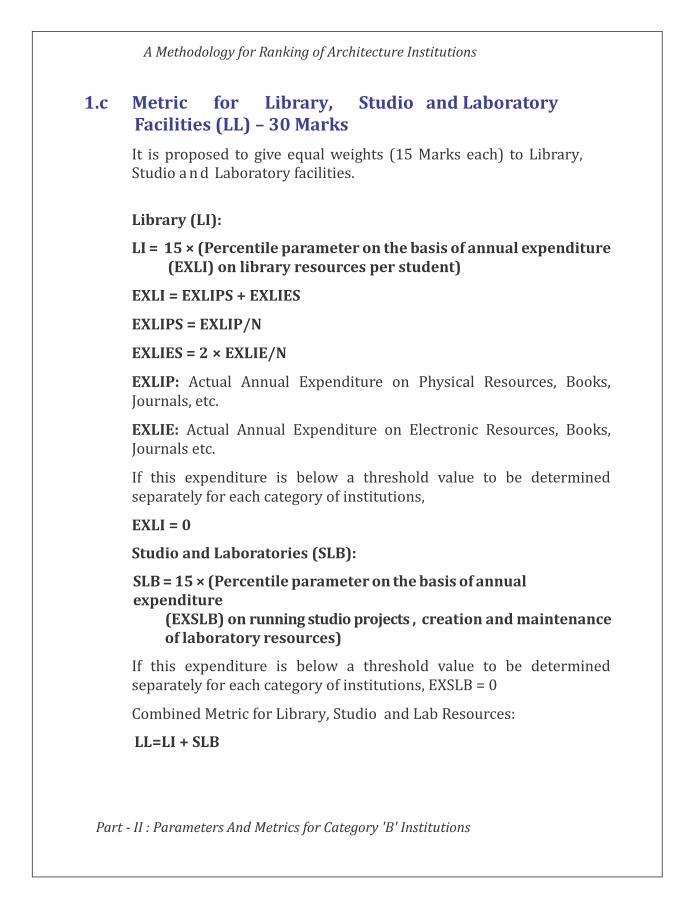
1.c Metric for Library, Studio and Laboratory Facilities (LL) – 30 Marks
It is proposed to give equal weights (15 Marks each) to Library, Studio a n d Laboratory facilities.
Library (LI):
LI = 15 × (Percentile parameter on the basis of annual expenditure (EXLI) on library resources per student)
EXLI = EXLIPS + EXLIES
EXLIPS = EXLIP/N
EXLIES = 2 × EXLIE/N
EXLIP: Actual Annual Expenditure on Physical Resources, Books, Journals, etc.
EXLIE: Actual Annual Expenditure on Electronic Resources, Books, Journals etc.
If this expenditure is below a threshold value to be determined separately for each category of institutions,
EXLI = 0
Studio and Laboratories (SLB):
SLB = 15 × (Percentile parameter on the basis of annual expenditure
(EXSLB) on running studio projects , creation and maintenance of laboratory resources)
If this expenditure is below a threshold value to be determined separately for each category of institutions, EXSLB = 0
Combined Metric for Library, Studio and Lab Resources:
LL=LI + SLB
A Methodology for Ranking of Architecture Institutions
Part - II : Parameters And Metrics for Category 'B' Institutions
1.d Metric for Sports and Extra-Curricular Facilities, Activities (SEC) – 10 Marks
Equal weights will be given to sports facilities, sports budget and top performances, and extra-curricular activities.
Extra-Curricular (EC) activities may typically include, but not be limited to Clubs/Forums, NCC, NSS etc.
Parameters to be used:
- Sports facilities area per student (A);
- Actual expenditure per student on Sports and EC activities (B); and
- Number of top positions in inter- college sports and EC events (C).
Each parameter to be evaluated on a percentile basis to obtain the parameters p(A), p(B) and p(C). Weights assigned to the 3 components are 0.5, 0.25 and 0.25 respectively.
p(C) = 1, if a college has at least 3 winners of a State or National level event.
Assessment Metric for Sports and Extracurricular Activities :
SEC = 10×[p(A)/2 + p(B)/4 + p(C)/4]
Data Collection:
To be obtained from the institutions.
Data Verification:
By Ranking Agency on a random sample basis.
A Methodology for Ranking of Architecture Institutions
Part - II : Parameters And Metrics for Category 'B' Institutions
2 Research, Professional Practice &
Collaborative Performance (RPC)
Research, Professional Practice & Collaborative Performance (RPC) – 100 Marks
Ranking Weight : 0.20
Overall Assessment Metric:
RPC = (PU + CI + IPR + CP + FPPP)
The component metrics are explained on the following pages.
A Methodology for Ranking of Architecture Institutions
Part - II : Parameters And Metrics for Category 'B' Institutions
2.a Combined Metric for Publications (PU) – 30 Marks
It is proposed that Publications indexed in Scopus, Web of Science, Google Scholar will be counted for assessment. An average value P for the previous three (3) years will be computed as detailed later in this item.
The Institution will submit faculty publication list as supporting information. However, the primary sources of information will be Scopus, Web of Science and Google Scholar.
Books/Monographs should have ISBN number and be published by reputed publishers.
Assessment Metric for Publications:
PU = 30× Percentile parameter (expressed as a fraction) on the basis of (P/F)
P is the number of publications = Weighted average of numbers given by Scopus, Web of Science and Google Scholar over the previous three years.
P = 0.2 PW + 0.3 PS + 0.5PG
Here,
PW: Number of publications reported in Web of Science.
PS: Number of publications reported in Scopus
PG: Number of publications reported in Google Scholar.
F is the number of regular faculty members as used in Item 1.

A Methodology for Ranking of Architecture Institutions
Part - II : Parameters And Metrics for Category 'B' Institutions
2.b Combined Metric for Citations (CI) – 20 Marks
The proposed assessment is based on the ratio of number of citations in the previous three (3) years to the number of papers published during this time. A weighted average of the numbers from the three popular Databases will be used.
Institutions will be asked to provide information in a tabular form giving relevant details. However, the primary sources will be the seven standard Databases Scopus, Web of Science and Google Scholar.
Assessment Metric for Citations:
CI = [20 × Percentile parameter (expressed as a fraction) on the basis of (CC/P) for Category A × Percentile parameter on the basis of P]
Here,
CC is Total Citation Count over previous 3 years, and
P is total number of publications over this period as computed for 2a.
CC is computed as follows
CC = (0.2 CCW + 0.3 CCS + 0.5 CCG)
Here,
CCW : Total Number of Citations reported in Web of Science.
CCS : Total Number of Citations reported in Scopus.
CCG : Total Number of Citations reported in Google Scholar.

A Methodology for Ranking of Architecture Institutions
Part - II : Parameters And Metrics for Category 'B' Institutions
2.c IPR and Patents/copy rights : Granted, Filed, Licensed (IPR) –15 Marks
Proposed Marks distribution :
Granted : 6 Marks,
Filed : 3 Marks,
Licensed : 6 Marks
IPR will be include broadly based on registered copyrights, designs and patents over the last three (3) years.
Assessment method will be identical for both category of institutions; however, the indicated percentile will be calculated for the two categories separately.
IPR = PF + PG + PL
Assessment of IPR on patents (including copyrights and designs) filed:
PF = 3× Percentile parameter (expressed as a fraction) on the basis of (PF/F )
Here,
PF is the number of patents, copyrights, designs filed.
F is the number of regular faculty members.
Assessment Metric for IPR on patents (including copyrights and designs) granted:
PG = 6× Percentile parameter (expressed as a fraction) on the basis of (PG/F )
Here,
PG is the number of patents, copyrights, designs granted/registered.
F is the number of regular faculty members.
A Methodology for Ranking of Architecture Institutions
Part - II : Parameters And Metrics for Category 'B' Institutions
Assessment Metric for IPR and Patents Licensed:
PL = 2 × I (P) + 4 × Percentile parameter (expressed as a fraction) based on (EP/F )
Here,
EP is the total earnings from patents etc. over the last 3 years.
I(P) = 1, if at least one patent was licensed in the previous 3 years ( or) at least one technology transferred during this period;
Otherwise,
I(P) = 0
F is the average number of regular faculty over this period.
Data Collection:
To be made available by the concerned institutes On-line.
Data Verification:
By Ranking Agency on a random sample basis.

A Methodology for Ranking of Architecture Institutions
Part - II : Parameters And Metrics for Category 'B' Institutions
2.d Percentage of Collaborative Publications, Projects And Patents (CP) – 15 Marks
Assessment Metric for Collaborative Publication and Patents:
CP = 15 × (Fraction of publications and projects jointly with outside collaborators + Fraction of patents jointly with outside collaborators)
In case this number turns out to be more than 2 0, the score will be restricted to this value.
Data Collection:
Mainly from Databases like Scopus, Web of Science and Google Scholar. Could be aided by information from the institute.
A Methodology for Ranking of Architecture Institutions
Part - II : Parameters And Metrics for Category 'B' Institutions
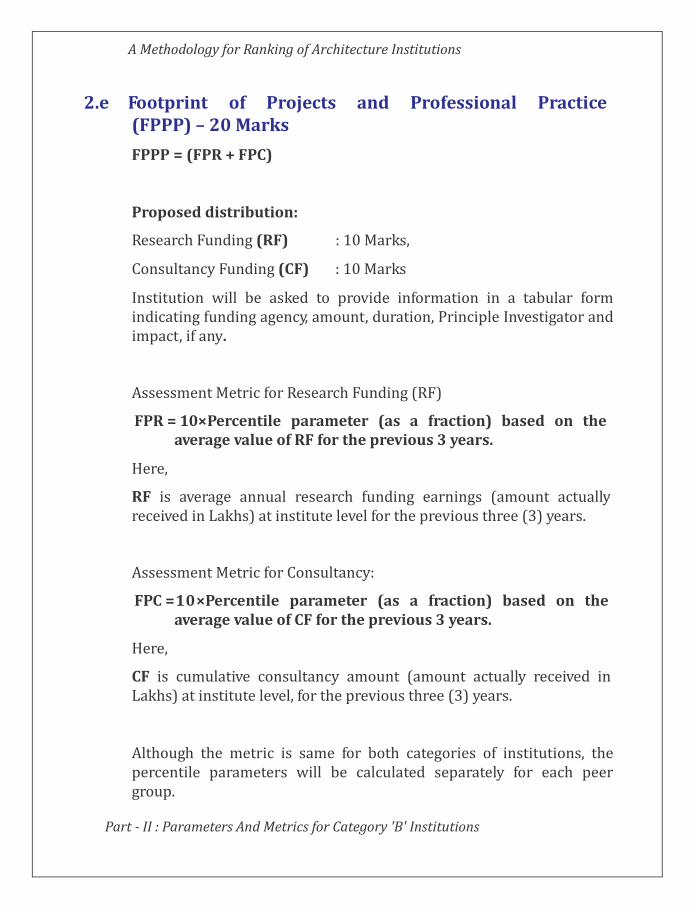
2.e Footprint of Projects and Professional Practice (FPPP) – 20 Marks
FPPP = (FPR + FPC)
Proposed distribution:
Research Funding (RF) : 10 Marks,
Consultancy Funding (CF) : 10 Marks
Institution will be asked to provide information in a tabular form indicating funding agency, amount, duration, Principle Investigator and impact, if any.
Assessment Metric for Research Funding (RF)
FPR = 10×Percentile parameter (as a fraction) based on the average value of RF for the previous 3 years.
Here,
RF is average annual research funding earnings (amount actually received in Lakhs) at institute level for the previous three (3) years.
Assessment Metric for Consultancy:
FPC =10×Percentile parameter (as a fraction) based on the average value of CF for the previous 3 years.
Here,
CF is cumulative consultancy amount (amount actually received in Lakhs) at institute level, for the previous three (3) years.
Although the metric is same for both categories of institutions, the percentile parameters will be calculated separately for each peer group.
A Methodology for Ranking of Architecture Institutions
Part - II : Parameters And Metrics for Category 'B' Institutions
3 Graduation Outcome (GO)
Graduation Outcome (GO) –100 Marks
Ranking Weight: 0.25
Overall Assessment Metric:
GO = (PUE + PHE + MS)
The component metrics are explained on the following pages.
A Methodology for Ranking of Architecture Institutions
Part - II : Parameters And Metrics for Category 'B' Institutions
i
i
i
i i
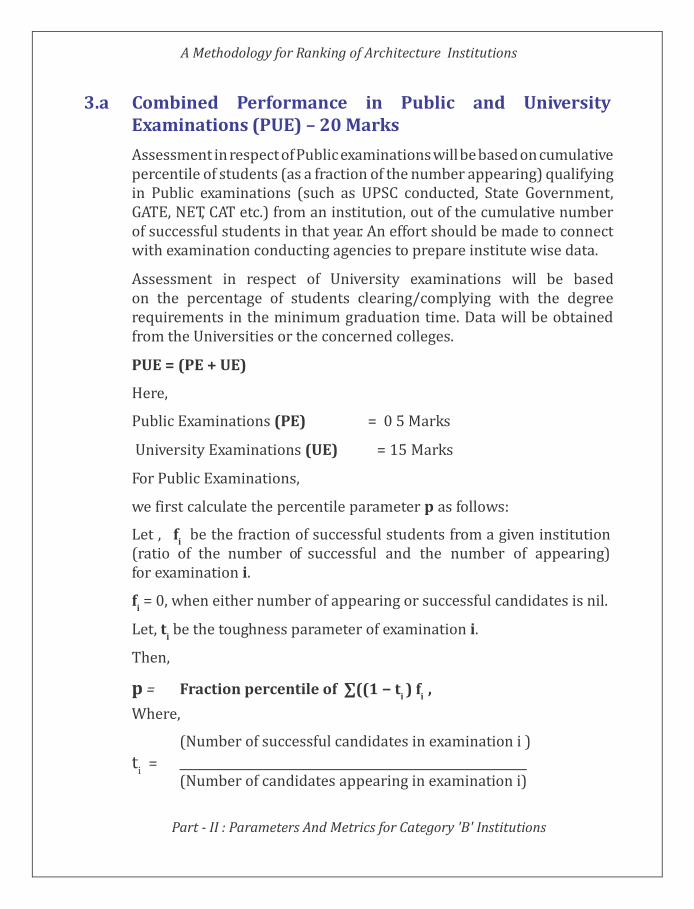
3.a Combined Performance in Public and University Examinations (PUE) – 20 Marks
Assessment in respect of Public examinations will be based on cumulative percentile of students (as a fraction of the number appearing) qualifying in Public examinations (such as UPSC conducted, State Government, GATE, NET, CAT etc.) from an institution, out of the cumulative number of successful students in that year. An effort should be made to connect with examination conducting agencies to prepare institute wise data.
Assessment in respect of University examinations will be based on the percentage of students clearing/complying with the degree requirements in the minimum graduation time. Data will be obtained from the Universities or the concerned colleges.
PUE = (PE + UE)
Here,
Public Examinations (PE) = 0 5 Marks
University Examinations (UE) = 15 Marks
For Public Examinations,
we first calculate the percentile parameter p as follows:
Let , f
be the fraction of successful students from a given institution(ratio of the number of successful and the number of appearing) for examination i.
f = 0, when either number of appearing or successful candidates is nil.
Let, t be the toughness parameter of examination i.
Then,
p = Fraction percentile of ∑((1 − t ) f ,
Where,
(Number of successful candidates in examination i )
t = i
(Number of candidates appearing in examination i)
A Methodology for Ranking of Architecture Institutions
Part - II : Parameters And Metrics for Category 'B' Institutions
Cumulative data is thus weighted across different examinations according to their toughness index, which is measured by the ratio of successful candidates to the total number appearing.
PE = 05 × Cumulative percentile of students from the institution in the cumulative data of Public Examination
UE = 15 × (N/80)
Here,
N is the percentage of Students (as a fraction of those admitted for the batch, averaged over the previous three (3) years) graduating in minimum time.
Benchmark:
At least 80% students should graduate in minimum time to score maximum Marks.
Data Collection:
PE data from Examination Boards and bodies.
UE data from institutions to be verified on a random sampling basis, but preferably directly from the University examination sections, if possible.
A Methodology for Ranking of Architecture Institutions
Part - II : Parameters And Metrics for Category 'B' Institutions
3
1
3 2
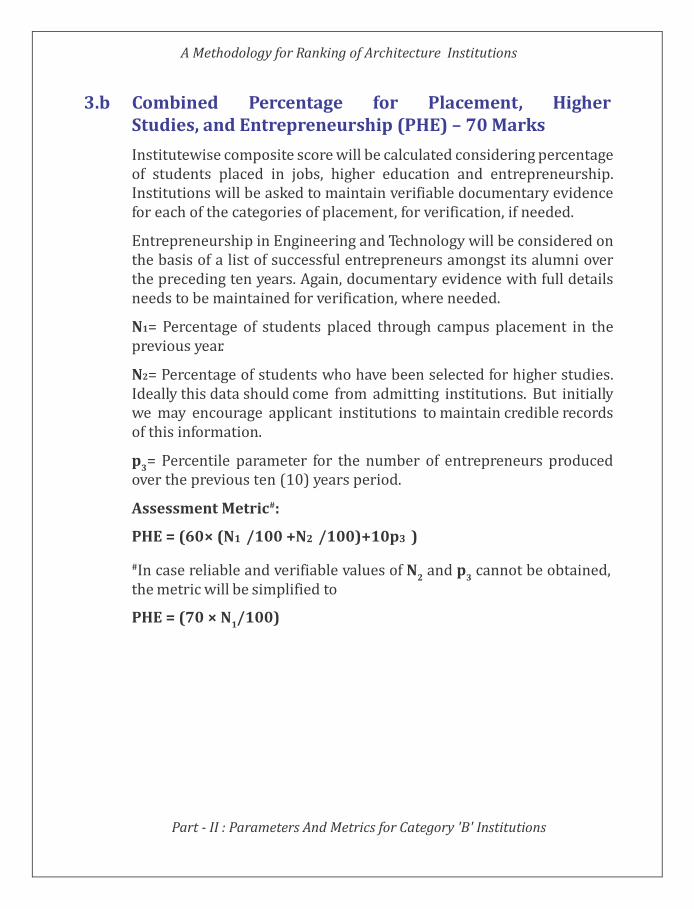
3.b Combined Percentage for Placement, Higher Studies, and Entrepreneurship (PHE) – 70 Marks
Institutewise composite score will be calculated considering percentage of students placed in jobs, higher education and entrepreneurship. Institutions will be asked to maintain verifiable documentary evidence for each of the categories of placement, for verification, if needed.
Entrepreneurship in Engineering and Technology will be considered on the basis of a list of successful entrepreneurs amongst its alumni over the preceding ten years. Again, documentary evidence with full details needs to be maintained for verification, where needed.
N1= Percentage of students placed through campus placement in the previous year.
N2= Percentage of students who have been selected for higher studies. Ideally this data should come from admitting institutions. But initially we may encourage applicant institutions to maintain credible records of this information.
p = Percentile parameter for the number of entrepreneurs produced over the previous ten (10) years period.
Assessment Metric#:
PHE = (60× (N1 /100 +N2 /100)+10p3 )
#In case reliable and verifiable values of N the metric will be simplified to
PHE = (70 × N /100)
and p cannot be obtained,
A Methodology for Ranking of Architecture Institutions
Part - II : Parameters And Metrics for Category 'B' Institutions
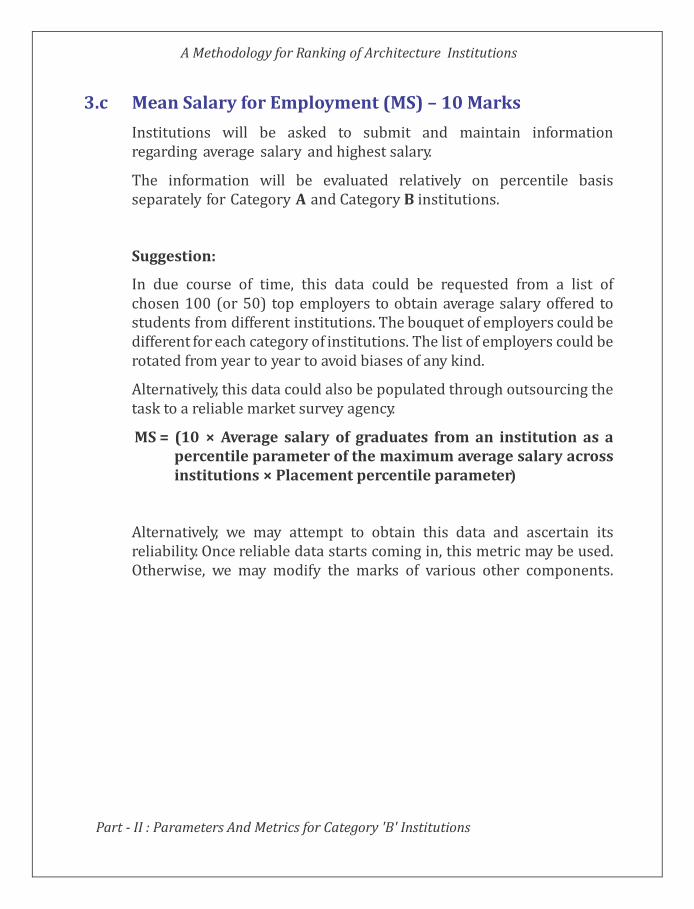
3.c Mean Salary for Employment (MS) – 10 Marks
Institutions will be asked to submit and maintain information regarding average salary and highest salary.
The information will be evaluated relatively on percentile basis separately for Category A and Category B institutions.
Suggestion:
In due course of time, this data could be requested from a list of chosen 100 (or 50) top employers to obtain average salary offered to students from different institutions. The bouquet of employers could be different for each category of institutions. The list of employers could be rotated from year to year to avoid biases of any kind.
Alternatively, this data could also be populated through outsourcing the task to a reliable market survey agency.
MS = (10 × Average salary of graduates from an institution as a percentile parameter of the maximum average salary across institutions × Placement percentile parameter)
Alternatively, we may attempt to obtain this data and ascertain its reliability. Once reliable data starts coming in, this metric may be used. Otherwise, we may modify the marks of various other components.

A Methodology for Ranking of Architecture Institutions
Part - II : Parameters And Metrics for Category 'B' Institutions
4 Outreach and Inclusivity (OI)
Outreach and Inclusivity (OI) – 100 Marks
Ranking Weight: 0.15
Overall Assessment Metric:
OI = (CES + WS +ESCS + PCS)
The component metrics are explained on the following pages.
A Methodology for Ranking of Architecture Institutions
Part - II : Parameters And Metrics for Category 'B' Institutions
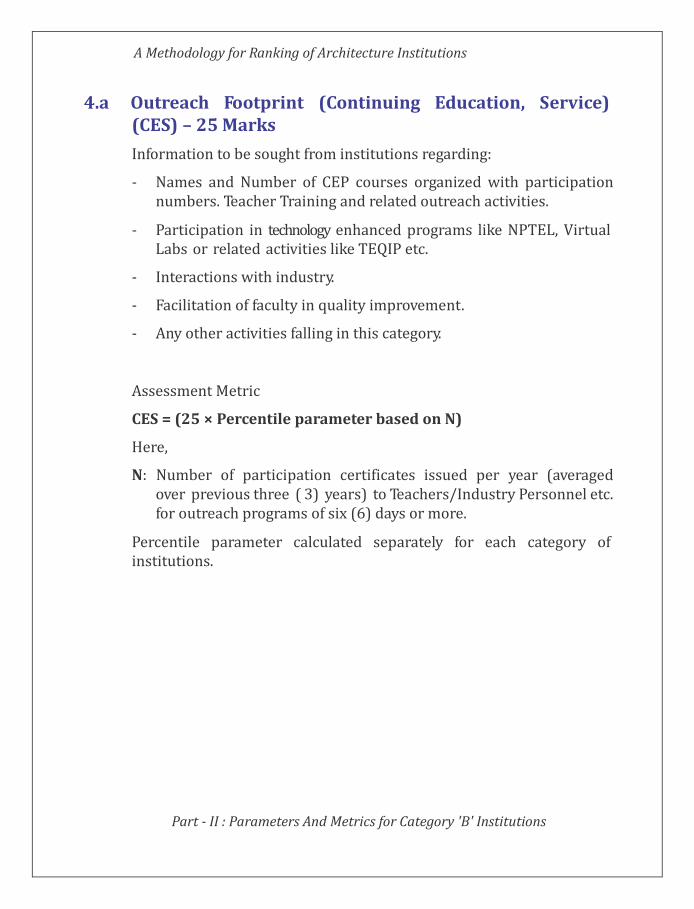
4.a Outreach Footprint (Continuing Education, Service) (CES) – 25 Marks
Information to be sought from institutions regarding:
- Names and Number of CEP courses organized with participation numbers. Teacher Training and related outreach activities.
- Participation in technology enhanced programs like NPTEL, Virtual Labs or related activities like TEQIP etc.
- Interactions with industry.
- Facilitation of faculty in quality improvement.
- Any other activities falling in this category.
Assessment Metric
CES = (25 × Percentile parameter based on N)
Here,
N: Number of participation certificates issued per year (averaged over previous three ( 3) years) to Teachers/Industry Personnel etc. for outreach programs of six (6) days or more.
Percentile parameter calculated separately for each category of institutions.
A Methodology for Ranking of Architecture Institutions
Part - II : Parameters And Metrics for Category 'B' Institutions
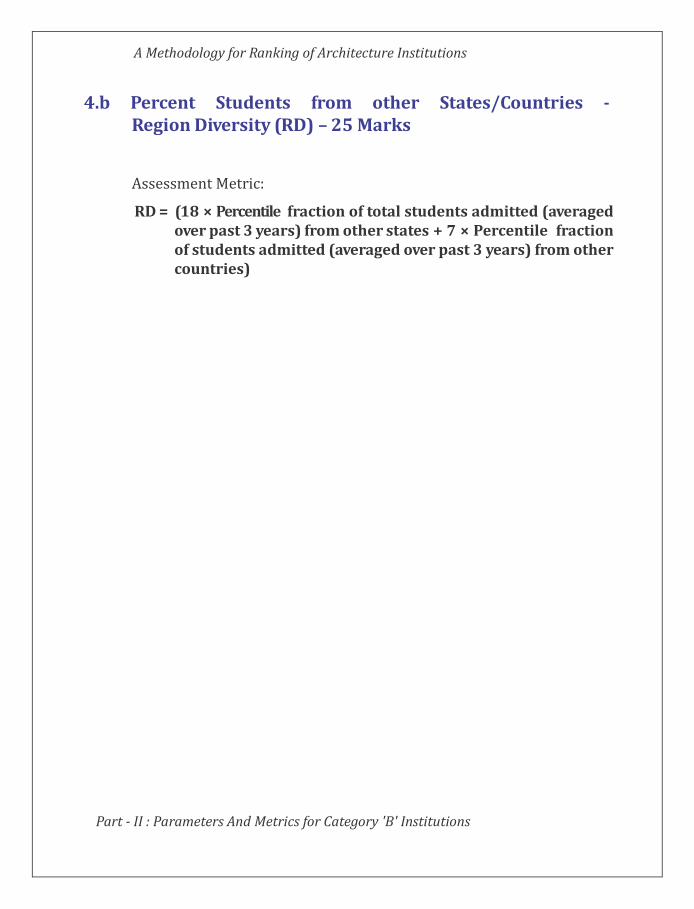
4.b Percent Students from other States/Countries - Region Diversity (RD) – 25 Marks
Assessment Metric:
RD = (18 × Percentile fraction of total students admitted (averaged over past 3 years) from other states + 7 × Percentile fraction of students admitted (averaged over past 3 years) from other countries)

A Methodology for Ranking of Architecture Institutions
Part - II : Parameters And Metrics for Category 'B' Institutions
3
N
1 2
N 1 2
3
4.c Percentage of Women Students and Faculty (WS) – 20 Marks
WS=8 × (N
Here,
/50) + 8 × (N /20)+(4 x N /2)
and N
are the percentage of Women Students and faculty respectively.
is the number of women members of eminence as Institute Head or on the Governing Board.
Bench Marks:
50% women students and 20% women faculty and 2 women as Institute Head or in the Governing Board expected to score maximum marks.
A Methodology for Ranking of Architecture Institutions
Part - II : Parameters And Metrics for Category 'B' Institutions
4.d Percentage of Economically and Socially Disadvantaged Students (ESDS) – 20 Marks
ESCS =20× (N/50)
Here,
N is the percentage of economically and socially disadvantaged Students averaged over the previous 3 years.
Benchmark:
50% economically and socially disadvantaged students should be admitted to score maximum marks.

A Methodology for Ranking of Architecture Institutions
Part - II : Parameters And Metrics for Category 'B' Institutions
4.e Facilities for Physically Challenged Students (PCS) –10 Marks
PCS = 10 Marks,
If the Institute provides full facilities for physically challenged students.
NAAC and NBA may be requested to provide their assessment, as possible.
A Methodology for Ranking of Architecture Institutions
5 Perception (PR)
Perception (PR) – 100 Marks
Ranking Weight: 0.1
Overall Assessment Metric:
P = PR
The component metrics are explained on the following pages.

A Methodology for Ranking of Architecture Institutions
Part - II : Parameters And Metrics for Category 'B' Institutions
5.a Process for Peer Rating in Category (PR) – 100 Marks
- This is to be done through a survey conducted over a large category of academics, institution heads, Architectural firms, HR head of employers, members of funding agencies in Government, Private sector, NGOs, etc.
- Lists may be obtained from institutions and a comprehensive list may be prepared taking into account various sectors, regions, etc.
- Lists to be rotated periodically.
- This will be an On-line survey carried out in a time-bound fashion