part ii - pages - fisd teacher web sitesteachers.fisd.org/fhsteachers/fhs-science/felps/chapter...
TRANSCRIPT
Sticky Question: How Do You Separate Molecules That Are Attracted to One Another? ■ Central Challenge The central challenge in this laboratory is for students to develop a method to separate three similar molecules.
■ Context For This Investigation You are working for a crime lab and a chemical residue has been turned in for analysis. To identify the chemicals in the residue, you will need to separate them from the mixture and identify them individually. Another lab technologist has made an attempt to separate the molecules but was not as successful as the boss would like. There was only one molecule separated from the mixture, but the boss suspects that there are at least three different molecules. Science is often a process, where a method is tried and then modified for a second attempt. The students’ job will be to propose a modification and attempt to improve the separation attained.
■ PreLab Guiding Questions/simulations
Part I 1. Observe a demonstration. Why does the water creep up the paper? Explain this. Draw the molecular
interactions associated with the macroscopic observation.
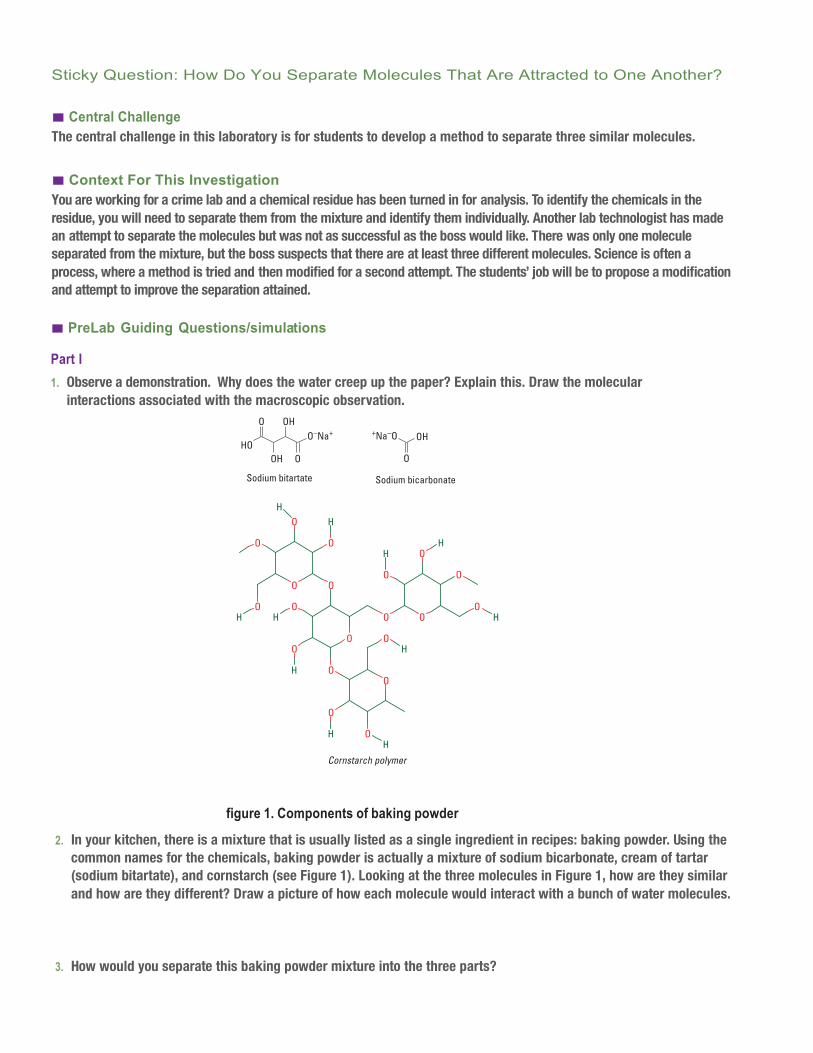
figure 1. Components of baking powder
2. In your kitchen, there is a mixture that is usually listed as a single ingredient in recipes: baking powder. Using the common names for the chemicals, baking powder is actually a mixture of sodium bicarbonate, cream of tartar (sodium bitartate), and cornstarch (see Figure 1). Looking at the three molecules in Figure 1, how are they similar and how are they different? Draw a picture of how each molecule would interact with a bunch of water molecules.
3. How would you separate this baking powder mixture into the three parts?
123CHROMATOGRAPHY
HOOH O
O–Na+O OH
Sodium bitartate Sodium bicarbonate
O
OH +Na–O
Cornstarch polymer
O
O
O
O
OO
O
O
OO
O
O
O
O
O
OH
OH
O
H
H
O
H
HH
OH
H
HH
Figure 1. Components of baking powder
2. In your kitchen, there is a mixture that is usually listed as a single ingredient in recipes: baking powder. Using the common names for the chemicals, baking powder is actually a mixture of sodium bicarbonate, cream of tartar (sodium bitartate), and cornstarch (see Figure 1). Looking at the three molecules in Figure 1, how are they similar and how are they different? Draw a picture of how each molecule would interact with a bunch of water molecules.
Student answers will vary.
3. How would you separate this baking powder mixture into the three parts?
Student answers will vary, and these answers should be revisited upon completing Part II of the prelab.
Part IIThe following simulation includes questions and animations that can be manipulated addressing all types of intermolecular attractions. When doing the simulation, make sure to remind students to take snapshots and answer all the questions. On the final page, there is a button: “Create a report of my work” that will include all word answers and snapshots. This computer simulation can be found at the Concord Consortium at http://mw.concord.org/modeler/ (Select ‘More’ at the bottom of Selected Curriculum Modules section and then, from the chemistry column, select “Intermolecular attractions.”)

Part II Computer simulation at the Concord Consortium: http://mw.concord.org/modeler/ Select “More’” at the bottom of “Selected Curriculum Modules” section and then, from the chemistry column, select “Intermolecular attractions.” The following simulation includes questions and animations that can be manipulated addressing all types of intermolecular attractions. When doing the simulation, make sure to take snapshots and answer all the questions. On the final page, there is a button: “Create a report of my work” that will include all word answers and snapshots.
1. How can molecules attract each other when they are in a mixture? Predict how ethanol would interact with those
molecules. Draw a picture illustrating the interactions between the components of the mixture and the solvent, ethanol.
2. What does the Rf value describe on a microscopic level? Why is this important?
3. If the molecule had a very high affinity for the stationary phase, how would this affect the Rf value? Explain.
4. What role does the mobile phase play in the distance a molecule travels in chromatography? What does the mobile phase describe?
5. If you combined a polar solvent with a molecule that has a carbonyl group (carbon with a double-bonded oxygen), would it have a high or low Rf value? Justify your answer with what you understand of intermolecular forces.
■ Explanation to Strengthen Student Understanding There are two phases in paper chromatography, a stationary phase (the paper) and a mobile phase (the solvent). A molecule can have a greater affinity for either the paper or for the solvent. The filter paper is made of cellulose, a polymer. Cellulose will attract water molecules to the exposed hydroxyl (OH) groups along the polymer. This interaction makes a thin layer of water on the paper that competes for the attraction of the molecules being separated. Alternately, the molecule can be attracted to the solvent and travel with the solvent up the paper. When doing chromatography, a small amount of solvent is placed in a sealed container. The mixture being separated is put on a piece of paper, the starting point is marked, and the paper is put into the solvent. The container must be sealed so the solvent saturates the paper and does not evaporate first. The level of separation is measured by a ratio that compares the distance that the molecule travels to the distance the solvent travels. This ratio is called the Rf value. To get the Rf value, the experimenter must identify the distance that the solvent traveled on the paper and measure the distance. Second, the experimenter must identify the distance that each molecule traveled and measure that distance. It is best to run the test more than once to reach the best separation values possible. The Rf value is a ratio of the distance of the molecule divided by the distance of the solvent. The greater the distance the molecule travels, the greater its affinity for the solvent and the greater the Rf value. In this experiment, you will have a choice of different solvents to use. When you propose the best solvent for separation of the mixture, you will also need to evaluate it in terms of “greenness.” In modern chemistry, chemists use principles of green chemistry to evaluate the solvents that are used in a chemical process for their level of toxicity to humans and the environment. Solvents are also evaluated in terms of their life cycle or how long the molecule remains in the environment and if the molecule breaks down to become more benign or more toxic. The overall focus of green chemistry is to be more efficient in chemical production, producing less waste, using fewer toxic molecules, and producing waste that biodegrades and does not pose a risk to the environment. See Tables 1 and 2 in the GSK solvent selection guide, available at http://pubs.rsc.org/en/content/articlelanding/2011/gc/c0gc00918k under “supplementary information,” for an evaluation of solvents based on these guidelines. To understand the differences between solvents, look up the green rating for hexane (found in chromatography solvent) and compare it to 2-propanol.

The food dyes that are in the mixture have their own green chemistry issues. For example, the molecules used may have a life cycle that is longer than previously anticipated and possibly increased toxicity. When scientists evaluate the toxicity of molecules based on the experimental data, efforts to understand the origins of toxicity often look at the molecular structure of the substance. A key strategy for looking at molecular structure is to identify functional groups that are present. There are specific functional groups that are known to create toxic by-products when they are metabolized in the human body, such as acetaminophen that can be converted to N-acetyl-p-benzoquinone imine. All three food dyes used in this lab are azo dyes, which means that they contain a double-bonded nitrogen connecting multiple aromatic carbons. While the molecules resemble one another, only red #40 has been linked to allergic reactions in some people, but the FDA has not found conclusive evidence that such a dye is unsafe. In Europe these food dyes are not used and natural pigments are used instead.
■ Preparation
Materials
Sample mixture to separate
100 mL graduated cylinders Tape to make labels
pencils Small (25–50 mL) cylindrical glass containers with lids
ethanol (C2H5OH)
2-propanol ((CH3)2CHOH) distilled water acetone ((CH3)2CO) Chromatography solvent (petroleum ether and acetone mixture)
metric rulers accurate to mm laboratory filter paper or chromatography paper (cut into strips narrow enough to fit into container and shorter than container)
126 INVESTIGATION 5
anticipated and possibly increased toxicity. When scientists evaluate the toxicity of molecules based on the experimental data, efforts to understand the origins of toxicity often look at the molecular structure of the substance. A key strategy for looking at molecular structure is to identify functional groups that are present. There are specific functional groups that are known to create toxic by-products when they are metabolized in the human body, such as acetaminophen that can be converted to N-acetyl-p-benzoquinone imine. All three food dyes used in this lab are azo dyes, which means that they contain a double-bonded nitrogen connecting multiple aromatic carbons. While the molecules resemble one another, only red #40 has been linked to allergic reactions in some people, but the FDA has not found conclusive evidence that such a dye is unsafe. In Europe these food dyes are not used and natural pigments are used instead.
Blue 1
N
S OOO
SO
O
O
N
SO
OO
A
NN
OH
O
S
SOO
O
OO
O
Red 40B Yellow 5
NN
NN
O
O S
O
O
O
S
O
O
O
O H
C
Figure 2. Molecular structure of food dyes
OHOH Ethanol
2-Propanol
HO
HO
Water
Acetone
Hexane
Figure 3. Molecular structure of typical solvents
Q INVESTIGATIONStudents will design an experiment that tests the solvents (from Figure 3) that they believe will provide the best separation of the food dyes (from Figure 2) in the mixture you provide. Students should propose the best solvent for separation of the mixture and also evaluate the use of the solvent in terms of “greenness.”
STUDENT DIRECTED

Safety and Disposal The mixture of food dyes is safe to dispose down the sink, as well as the distilled water. The other solvents — acetone, 2-propanol, ethanol, and chromatography solvent — should be collected and disposed of in an organic waste container. Teachers and students should take normal laboratory precautions, including wearing splash-proof goggles at all times. If solutions are spilled on skin, wash with copious amounts of water. For student-friendly MSDS, use the searchable index at the following link: http://www.ehso.com/msds.php
■ Investigation You will design an experiment that tests the solvents (from Figure 3) that you believe will provide the best separation of the food dyes (from Figure 2). There are five solvents listed as available for you to use in this experiment, including chromatography solvent (hexane/ether mix), acetone, ethanol, 2-propanol, and distilled water. If there are other materials that you would like to use, check with your teacher to see if they are available.
Procedure Develop a hypothesis as to what could lead to an effective separation of the three food dyes in the sample your teacher provided. Include intermolecular attractions in your hypothesis. You must test at least two of the solvents provided by your teacher (see Figure 3). You will need to write a step-by-step procedure and design a data table to record data. The procedure needs to be clear enough that someone else could repeat the experiment and get the same results. You teacher will have materials set out for you to choose from.
Data Collection and Computation
1. Why did you select the solvents that you tested? Did your data support your hypothesis or disprove your hypothesis?
2. What explanations can you provide for your separation of the three molecules? How was the choice of the solvent connected to the separation process?
3. What part of the chromatography setup did the molecules interact with, stationary or mobile phase? How would you explain this interaction using intermolecular forces? 4. Draw a picture of how the chromatography worked. Explain your picture using the following terms: stationary phase, mobile phase, and intermolecular forces. 5. Evaluate which solvent is the one with the best “green chemistry” rating (using the reference in the background section). What intermolecular forces would this solvent form with the three molecules in the mixture? 6. Which molecule spent the most time in the stationary phase and why?
7. Calculate the Rf values for each chromatography trial that you completed and include it in the data table.

Argumentation and documentation Write an explanation of how intermolecular forces and the molecular structures of the molecules being separated determine the ideal solvent for use in chromatographic separation. Be sure to cite specific evidence from this experiment to support their explanation.
■ Postlab assessment Write an explanation of what are the intermolecular forces that would explain why pyridine is soluble in water and benzene is not.
■ Supplemental Resources
Links “Chromatography Basics,” Science Spot. Accessed July 28, 2012. http://sciencespot.net/Media/FrnsScience/chromacard.pdf
“GSK Solvent Selection Guide.” RSC Publishing. Accessed July 28, 2012. http://pubs.rsc.org/en/content/articlelanding/2011/gc/c0gc00918k (under “supplemental resources”)
“Isolation of Plant Pigments by Column Chromatography.” Amrita. Accessed July 28, 2012. http://amrita.vlab.co.in/?sub=3&brch=64&sim=160&cnt=1 “Paper Chromatography of Plant Pigments.” Steve Marsden. Accessed July 28, 2012. http://www.chemtopics.com/unit06/pchrom.pdf References Borell, Brendan. “Where Does Blue Food Dye Come From?” Scientific American. Accessed July 28, 2012.
http://www.scientificamerican.com/article.cfm?id=where-does-blue-food-dye Fulton, April. “FDA Probes Link Between Food Dyes, Kids’ Behavior.” Morning Edition, NPR. Accessed July 28, 2012.
http://www.npr.org/2011/03/30/134962888/fda-probes-link-between-food-dyes- kids-behavior#chart Gilman, Victoria. “Food Coloring.” Chemical & Engineering News 81, no. 34 (2003): 34. Accessed July 28, 2012. http://pubs.acs.org/cen/whatstuff/stuff/8134foodcoloring.html
Murphy, Parvathi. “Molecular Handshake: Recognition through Weak Noncovalent Interactions.” Journal of Chemical Education 83, no. 7 (2006): 1010–1013.
Pendley, Bradford D. “Concept Maps as a Tool to Assess Learning in Chemistry.”Journal of Chemical Education 71, no. 1 (1994): 9–15.
Peterson, Raymond F., and David F. Treagust. “Grade-12 Students’ Misconceptions of Covalent Bonding and Structure.” Journal of Chemical Education 66, no. 6 (1989): 459–460.
Sanger, Michael J., and Steven M. Badger II. “Research: Science and Education — Chemical Education Research — Using Computer-Based Visualization Strategies to Improve Students’ Understanding of Molecular Polarity and Miscibility.” Journal of Chemical Education 78, no. 10 (2001): 1412.