part ii1: as part ii suggests, determinants, interactions, and reaction ... · determinants,...
TRANSCRIPT

Part II1: Determinants, Interactions, and Reaction Times in the Log Trade
In General
Log Demand
As Part II suggests, demand for wood products around the Pacific Rim can be attributed to a chain of causal factors: a country's general economic health and interest rates determine home building and con- struction activity, which draw wood products imports and manufacture. Within this chain are a number of significant factors. Similarly, log sup-
Photo N--A rack of export logs. Tags permit accounting for each log, per- haps throughout several transactions.
plies are affected by technical and economic factors. Demand and supply, their interconnections, and their relative dynamics are discussed here.
There is a tight link between economic changes in the United States and those in Japan. The general economies move together within a month or two of each other. Although housing activity differs in the short run, cyclic movements are similar. Thus U.S. and Japanese wood products demands generally move together. Lags between lumber prices and production changes in Japanese and U.S. export-log market change are on the order of a month.
Almost universally, a country's economic growth and industrial activity account for some fraction of wood consumption, quite aside from housing. Around much of the Pacific Rim, residential construction accounts for relatively little wood consumption because of traditional use of concrete, tile, and other earth-based materials. In the econometric analysis described later, it was found that GNP has been a highly sig- nificant determinant of import log demand in Japan, China, Korea, and Taiwan, which comprise all the softwood-log-consuming countries studied. In Japan, housing is a major user of wood. Industrial production, another component of GNP, accounts for substantial fractions of wood consumption and, therefore, log imports in all four coun- tries. Changes in industrial production therefore help to account for changes in wood imports.
Within the construction sector, housing starts have been a less important indicator of log imports than has the area of wood-based construction in Korea and Japan, where such data are available. The floor area of new wooden structures (houses plus busi- ness and industrial buildings) has been a more consistent explanatory factor than the area of wood-based houses alone. It is significant, though, that during the early 1980s, the floor area per dwelling unit declined in Japan for both wood and nonwood houses, with the average size of wooden homes stabilizing in the mid-1980s and turning slightly upward when the number of housing starts rose.
48

Monetary policy adopted to regulate the economy has a strong influence on housing in the log consuming countries of the Pacific Rim, as it does in the United States. There is great variation in that sensitivity, though, depending partly on the degree to which a nation's economy is subject to cyclic fluctuations. Fluctuations generally are associated with credit-oriented, advanced market economies and with countries closely tied to such nations. Sensitivity also depends on the degree to which mon- etary policy is used to regulate the economy and to which interest rates are allowed to fluctuate with those of the world.
Currency exchange rates have several short- and long-term effects on demand for imported timber. Although the industrialized countries of the world agreed in the early 1970s to let their currencies float relative to each other, in fact, most nations (includ- ing the United States) manage the value of their currency either by directly controlling its exchange value or by such indirect methods as regulating interest rates and buy- ing and selling their own or other nations' currency.
An abrupt increase in the value of a currency, such as happened to the yen.in 1985, has four effects on log trade.
1. A windfall is created for Japanese buyers holding contracts with the price specified in U.S. dollars, as is common in log transactions. The 12-percent gain in purchasing power of the yen in late 1985 benefitted buyers to that extent without injuring sellers.
2. Sellers are able to negotiate dollar prices upward by arguing that buyers should share their unearned gain. Between late 1985 and mid-1986, the yen gained 30 per- cent relative to the dollar, which suggests that dollar prices of logs would have risen about 15 percent had buyers and sellers "split the difference." From mid-1985 to mid-1986, log prices actually rose about 12 percent in U.S. dollars.
3. A third kind of effect is indirect but nonetheless important for forest products. These consequences are changes in the national economy at large. They are especially sig- nificant in countries heavily dependent on trade or deeply involved in international movements of capital. During 1986, Japan's economy was depressed significantly by the decline in the value of the UoS. dollar, because it reduced the capacity of the United States to buy goods offshore; Japan's exports are equivalent to about one- third of that country's GNP, and about half of those exports go to the United States. Reduced demand from the United States exacerbated for Japan the flat economy of the world at large. Japan's economic growth rate, which has been twice that of the United States, declined to the U.S. level. Housing starts fell and, thus, demand for imported logs.
4. A combination of price adjustments and a recession-induced plateau in the trend in the value of the yen allowed Japan's exports to recover. This occurred 18 months after the start of the dollar's sharp decline. For several reasons including Japan's renewed interest in timber imports, log prices in U.S. dollars were at near-record highs by then.
49

Log Supply
In other log-consuming countries of the Pacific Rim, the effects of the dollar's deval- uation were negligible because, for various reasons, their currencies fell at least as much as the U.S. dollar. China's currency declined because of foreign-exchange problems; Korea's because of monetary policy and the world recession.
Exchange rates are significant for the supply of logs from competing countries. During the U.S. dollar's rapid decline (1985-86), Canada's monetary policy regulated the value of the Canadian dollar. With adjustment of interest rates and some buying and selling of currency, Canada's central bank held the value of the Canadian dollar within a percentage point or two of its former position relative to the U.S. dollar. Over the 18 months, the number of Chilean pesos per U.S. dollar doubled; however, half of this change was attributable to inflation. Only 50 percent of the change represented a real improvement in the competitive position of Chile relative to the United States in offering logs to Pacific Rim customers. A sharp increase in purchases of Chilean logs and other wood products followed. On the other hand, New Zealand (which competes with Chile in supplying radiata pine) experienced an increase in the value of its cur- rency relative to the U.S. dollar, thus reducing its capacity to compete in the log market. Purchases declined.
On the supply side, the economic availability of timber for cutting is clearly a supply determinant over the long term. Year to year, the volume of economically mature timber available on the stump represents only a ceiling on roundwood supply. In supply countries like Canada and the United States, this ceiling is very high. Along the British Columbia coast, for example, there are more than 200 billion board feet (a trillion cubic meters) of timber that is economically available during periods of strong markets (Flora 1986, Morrison and others 1985, Williams and Gasson 1986).
In Chile, New Zealand, and Japan, log supply is distinctly related to the amount of timber reaching economic maturity. For Chile, the area of plantations reaching age 23 is useful in explaining export supply; in that country, exports are based primarily on their 3 million acres of radiata pine plantations. The same is true of New Zealand, where the total plantation area is slightly less than that in Chile. In Japan, domestic forests provide only about one-third of domestic log consumption. Natural stands, heavily depleted during World War II, have been replaced by about 25 million acres of plantations, mostly softwoods. Management plans were largely frustrated by labor costs that were higher than expected, which sharply limited the amount of precom- mercial thinning done. A result has been dense, heavily stocked stands slow to reach merchantable diameters. It is not surprising, then, that Japan's use of domestic logs (and therefore its log-import demand) is strongly correlated with the acreage of plantations reaching age 40.
For various reasons, including promotion of domestic economic development and employment~ several nations have let domestic demand take precedence over export sales. Canada and New Zealand are notable among softwood suppliers, Indonesia and the Philippines among hardwood producers.
50

Interactions Among Trade-Related Economic Elements
We mentioned earlier that U.S. domestic demand does not seem to dominate export supplies. The export industry has become a sector unto itself, thereby reflecting (1) its magnitude (equal to the private harvest in Washington State, principal source of log exports); (2) the passage of time, with 25 years having passed since the export in- dustry became important in the early 1960s; (3) growing product differentiation in ex- port merchandising and movement; and (4) product specialization with distinct species preferences, use-specific grades, and special scaling and bucking practices.
Year-to-year U.S. export activity is correlated with westem Washington harvest levels (Flora and Vlosky 1986). Detailed analysis of the causality involved (see footnote 4) shows that exports apparently are not propelled by Northwest cutting levels; rather, cutting and shipments respond to export log prices.
Recent cyclic behavior of the world's economy has produced the widespread impres- sion that major perturbations are most apt to occur in the United States, the wodd's largest economy, home of the most active financial markets, and site of the largest amount of credit and debt. Increasing trade connections among industrialized nations in general, and Pacific Rim countries in particular, raise questions about the dynam- ics of trading in raw materials. Do demand changes in Japan, the principal consum- ing country follow or coincide with similar changes in the United States? Can U.S. export prices and fluctuations in export volumes be explained by Japanese demand factors? Do economic trends create an echo across the Pacific, with the demand for wood products responding weeks or months later to drive log prices along the Pacific Northwest coast? If so, how long are the lags? Are they reliable enough for market forecasting? Within Japan, are stable relations found among the basic drivers: wood- product demand, log prices, and log consumption? This section and the next will deal with these questions.
Photo O--A China-bound deck of second-growth logs.
51

The tabulation below shows the degree of correlation among major determinants of timber activity in the United States and Japan. The first entry, for example, shows that GNP in the United States has a correlation of 0.99 with GNP in Japan. The nu- merical entry is the simple correlation coefficient, known to statistidans as R or r, which ranges between 0 and 1.0. The validity of this measure depends on the amount of data represented. Twenty-four units of annual data are reflected in this table. With that number of observations, any r less than 0.40 is not significant. Also important is that the coefficient, however high, does not measure causality, just correlation. The following tabulation compares Japan with the United States:
Economic factor Correlation (r)
GNP 0 .99 Industrial production .78 Interest rates .88 Housing activity .57
The entries for annual data show strong correlation between major economic drivers in the two countries. A further reservation is in order, however: The strong correlation is attributable to the economies of Japan and the United States having moved to- gether in multiyear, cyclic waves (figs. 25-27). Shorter term fluctuations may be quite different between the two economies. Some economic factors, such as housing, are quite seasonal, as discussed later. Seasonality aside, the U.S. timber economy may experience short-term stimuli or depressants, such as regional building booms or work stoppages, not affecting Japan, and vice versa. The cross-dynamics of several- month phenomena, of intense interest to market analysts doing quarterly and annual forecasting, can be studied with monthly or quarterly data; quarterly data are used here to avoid the static that appears in monthly economic numbers. The tabulation below shows the relation of quarterly changes in the economies of Japan and the United States:
Economic factor Correlation (r)
GNP 0.26 Industrial production .42 Interest rate .28 Housing activity .68
These correlations are much smaller than in the previous tabulation; two are not significantly better than zero. Quarterly changes in housing construction are more closely related than are annual levels. The generally lower correlations mean that, while one can expect large waves to move together, ripples may differ in their timing and intensity considerably.
52

5000
4000
L _
0
• 3000
o~ 2000
c O . m
. i
I~ 1000
1so
..°'" ."
. . . . . '"" °.o......""
I I I I I I I I I I I I I I I I I I I I I I I I I I I I I I I I I I I I I I I I I I I I I I I
55 57 59 61 63 65 67 69 71 73 75 77 79 81 83 85 87
Y e a r
100(- United States A i " , ." i ~
.~ :': ~ i i i
so
o
?,
-100
1980 1981 1982 1983 . 1984 1985 1986 1987"
Y e a r
4O0
3)O
e-
200 ,,. t- O . i
, I t , .
l - 100
10
6 c 3~
4 Qo o~ V I
c 2 .2
I- 0
-2
-4
Figure 25--Gross national product of the United States and Japan, 1955-88
Figure 26--Quarterly changes in ~e gross national product of the United States and Japan, 1980-88 Gross national prod uct was seasonally adjusted at annual rates
53

O
II ¢O O~
x" "10 ¢- i
160
140
120
100
80
,.o ."'
. . , : : " , : " : :" \ .
. . . ~ Un i ted S t a t e s
I I l l I I I I I I I I I I I { t l I I I I I I I I l l I I I I I I I I I l l l l l l l l l l I I I l l t l l l I I t t l l l I I I I I I I11 I11 I I I I I l l l l I I I I f t I I I I I l J l l l l l l l I I I I I I I I I
1980 1981 1982 1983 1984 1985 1986 1987 1988
Figure 27--Industrial produc- tion in the United States and Japan, by month, 1980-88.
Year
The next tabulation deals with Japan alone. With quarterly data for 1975 through 1987, correlations were estimated between presumably closely related pairs of economic indicators; for example, GNP and industrial production, or interest rates and housing:
This Indicator: And this one: Have this
correlation:
GNP Industrial production 0.99 Yen-dollar exchange Industrial production -.72 Industrial production Interest rate , -.73 Interest rate Housing (area) -.67 Housing (area) Lumber production .89 Housing (area) Lumber price .71 Housing (area) Log price .81 Lumber production Log price .82 Lumber price Log price .87 Lumber production Log volume from
United States .61 Lumber productio n Import log price .81 Lumber price Log volume from
' United States .79 Lumber price Import price. .84 Housing (area) Log volume from
United States .69 Housing (area) Import log price .78
54

Reaction Times Among Log Supply and Demand Factors
Prices used in the estimates are real (inflation corrected). !mports pertain to softwood logs from the United States and their prices in dollars. Dollar prices were adjusted for U.S. inflation.
Although it is tempting to impute a serial chain of cause and effect to these relatively high correlations (with 52 observations, any r over 0.27 is significant), it can be said only that these elements move together and not all the time. Analysis of quarter-to- quarter changes produces somewhat lower correlations. Quarterly changes in housing starts, for example, have a 0.48 correlation with changes in lumber prices, because even though long-term movements of these measures are generally in concert, there are short discordant passages.
Strong correlations among log-trade determinants raise questions about their relations over time. This section focuses on lags between changes in economic variables con- sidered to have a cause-effect relation. The section concentrates on Japan's ties with the United States. It is assumed that conclusions also pertain to Canada, but an analysis of that assumption will be published later.
The broadest measure of national economic activity is GNP. Cycles in GNP, com- monly several years long, are felt more or less concurrently in all countries having market economies. Figure 25 compares GNP, adjusted for inflation to 1987 dollars, in Japan and the United States since 1955. With quarterly instead of annual data, figure 26 highlights GNP changes since 1980, a time in which both countries experi- enced the most significant recession since the 1930s and a recovery that produced the highest U.S. Pacific coast log prices on record. Changes in GNP in the United States have led those in Japan by about 3 months.
Figures 15 and 27 show industrial production in the two countries for the same time frame. This measure is shown because GNP data are available only quarterly, but industrial production is obtained monthly; the two are closely correlated. Industrial production is interesting in its own right, because it is an index of physical output rather than the total value of goods and services produced; significant amounts of wood products are consumed by the manufacturing sector. The finer resolution of monthly data shows that industrial activity in Japan lags that in the United States by about 2 months, with Japanese industrial activity more volatile from month to month than that in the United States. Implications of data in figures 26 and 27 are that econ- omic cycles undulate outward from the United States, a country dominating world consumption of goods and services and having an economy especially sensitive to changes in the supply and demand of credit.
Willingness to lend and borrow is particularly important to the timber industry, because interest rates are a primary determinant of fluctuations in housing activity. Figures 28 and 29 portray interest rates in Japan and the United States. Other things equal, a change in interest rates in one country is mirrored almost at once in other nations. Reality is that rigidity in interest rates causes mass movements of capital toward the higher rates, with even a few hundredths of a percentage point in rates making a difference.
55

r- O) ~J i . _
o) n
C O) 0
O) n
20
15
10
0
14
12
10
ii Housing starts, seasonally adjusted at annual rates
'"'i.' :"'"..
Federal funds Interest rate
I [ [ I t i I I I I l i l t I I I I I I I I l l I I I I I I I I I l f l l l I I I I I I I I I I I I I I I I I l l l l l l l I I I I I I I I I I l l I I I I I I I t I I I I I I I I I I I I I i i i I I I I I I I I I I I I I
1980 1981 1982 1983 1984 1985 1986 1987 1988
Year
8
6
f , . . o
\ /
i .o=no =n ==on,,~ .d~=,~ / - ; : "'", ...:'' - ,........ :: '. :..." .: ..... ...
I I t I I I i l l I I I I I I I I I I I I I I I I I t I I I I I I I I I I l l I I i I I I I I i l I I I I I I I I I I I I I I I I I I I I I I I I l l t l l I I I I l l I I I I I I I I I I I I I I I I I I I I I I I I I
1980 1981 1982 1983 1984 1985 1986 1987 1988
Y e a r
2500
2000
1500
1000
500
180
160
140
120
100
80
60
40
20
0
Figure 28--Interest rates and housing starts in the United States, by month, 1980-88.
(/) 1::
(/)
"0
u~ :3 0 t-
F-
Figure 29~ln terest rates and housing starts in Japan, by month, 1980-88.
1::
¢3)
e-
:3 0
.1£: I--
56

The levels of interest rates differ greatly among countries for several reasons; per- haps the most significant is inflation. As rising prices reduce the purchasing power of money, lenders require a premium for postponing the purchasing power of their money, because they recognize its dilution over time. Thus, long-term interest rates in otherwise stable countries tend to be 3-4 percent above the expected rate of in- flation. Another reason for international'differences in interest rates is that interest rates are used by central banks as a primary tool of monetary policy, both to regulate the domestic economy and to influence the international value of currencies. A dif- ficult tradeoff sometimes must be made between, say, lowering interest rates to stim- ulate the domestic economy and raising them to improve the value of that country's currency. Currency values are stimulated by high rates because of the resulting capital flows mentioned earlier, which increase the demand for financial instruments denominated in the appreciating currency. Finally, interest rates in any country are influenced by the government's need to borrow, the unwillingness of lenders to part with financial resources during times of stress, perceptions of credit worthiness, and political and economic risks peculiar to particular nations.
With all these factors changing from time to time, it is not surprising that considerable variance occurs between U.S. and Japanese interest rates (figs. 28 and 29). Since 1978, Japan's rates for both borrowers and lenders have been relatively low. Individ- ual savers in Japan have been accustomed to rates of about 3 percent, and business borrowers have obtained funds from banks at about 5 percent; these are comparable to rates in the United States in the 1950s. But in real (inflation-compensated) terms, Japan's rates have been comparable to those in the United States since the mid- 1960s. F!gures 28 and 29 show that interest-rate policy and flux in Japan have lagged those of the United States by about 2 months, but not consistently. In any case, Japan's interest rates have changed less month to month and year to year than have comparable U.S. rates.
Recent relations between housing activity and wood construction in the United States and Japan are shown in figure 30. Because most residential construction in Japan is not wood based, and because the average size of wood-based homes has varied greatly in Japan with business cycles, the floor area of all wood-based structures is shown for Japan rather than the number of housing starts.
The monthly housing data do not indicate any close correspondence between housing in the United States and that in Japan during the relatively stable period since 1982. Short-term reactions of housing to interest-rate changes in the United States are well known (Throop 1986). Figure 28 suggests a lag of 2 to 6 months between interest-rate changes and housing shifts in the United States, although the causal relation is more apparent in a multiyear than in a multimonth display. In Japan (fig. 29), housing responds to general economic and demographic conditions and government funding programs, with little apparent connection to interest rates.
57

200
150
U) 1:: o~ (/)
• 1~ 100 ¢:
u)
0 ¢.- l - -
50
12
10
P
g
, m
, m
t
/ ~ U . S . h o u s i n g s t a r t s
11 I I I I I I I I t I I I I I I I I l l I I I I I I I I I I I I I I I I I I I I I I I I I I I I I I I I I I I I I I I I I I I I I I I I I I I l Z l I I I I t I I I I I I J i l l I I I I I I I I I I I I I I I I I I I I ( I
1980 1981 1982 1983 1984 1985 1986 1987 1988
Year
W o o d f l o o r a r e a L u m b e r p r o d u c t i o n . . . . . . . . . . . . . D o m e s t i c l u m b e r
i n d e x W P I
I 1 1 1 I } 1 1 [ L I 1 I I I I I L I I I I I J I I t i l l I I I l i l l I I I I I l l I l l I i I I I I I L I I I I I I I I I I ~ I I I I I I I I I I I I I I I I l l l I I I I I I I I I I ~ I I I I I I I I I I l I I I
1980 1981 1982 1983 1984 1985 1986 1987 1988
Y e a r
12
lO
6 g
P, 4 . - .
2
160
140
120
80
6o ff
40 ~
20
Figure 30---United States housing starts and floor area of Japanese woodbased con- struction, by month, 1980-88.
Figure 31--Wood-based con- sb'uction and indexes of lumber production and wholesale lumber price for Japan, by month, 1980- 88.
58

Figure 31 compares Japan's lumber production, lumber prices, and wood-based con- struction. Swings in lumber production coincide with multiyear movements in con- struction. Japan clearly did not share either the great U.S. market decline of 1978-81 or the abrupt recovery of 1982-83. Lumber prices in Japan have been much steadier than those in the United States (figs. 31 and 32) and tracked lumber production close, ly until the sharp rise in housing starts in 1987. Oscillations in lumber prices may be more common in the future as U.S. and Soviet supplies increase and contribute to a (perhaps) less orderly market. In any case, it is not apparent that construction leads lumber manufacture from month to month.
Japanese wholesale prices for North American hemlock logs and an index of prices for domestic logs are shown with monthly wood-construction activity in figure 33. Like lumber prices, log prices in Japan move with construction; changes in the latter are mirrored at once in prices. As with lumber, price movements have been modest rela- tive to price fluctuations for U.S. logs.
Figure 34 shows monthly U.S. softwood log exports to Japan. Changes in log ship- ments have lagged Japanese lumber production by about a month; this is a remark- ably tight performance considering trans-Pacific shipping time of about 2 weeks plus the additional time required to assemble cargoes in response to rising demand. Although there are seasonal drops in U.S. log exports, notably from Alaska, they do not seem as pronounced as the seasonal declines in Japanese lumber production.
120
110
100
90
80
70
60
II
oo O)
x "
l o ¢-
so '' ' '~'' ' '~'' '~'' ' ' ' ' '~'' ' ' ' '` ' ' ' '~`' ' ' ' ' ' ' ' '~'' ' ' ' ' ' ' '` '~''``' ' ' ' ' ' '~'' ' ' ' ' ' ' ' ' ' '`~'' ' i ' ' ' ' '~ ' ' ' ' ' ' ' ' ' 1980 1981 1982 1 1983 1984 1985 1986 ~ 1987 1988
'. Year Figure 32--United States wholesale lumber priqe index, by month, 1980-88.
59

In
03 ,,k,,l o,I E 03
o" 09
10 I - ra 09
o t.- +.-
03 03
10
m O
.1:3 t - O ° ~
10000
8OO0
6000
4000
2000
350
300
250
200
150
100
50
Area of wooden constuctlon, //~ A
"", ..... , .......... ?~i.~..:~..'ii,lr.'~,.'.i~.il .......... i,.+...~.,. A, ~ ~ Domestlc log pdces, WPI
I I I I I III IIIIIIi l q l l l l l l l l t l l l l l l II l l l l l l l l f l l l i lI l l l l l i l I f l l l IIIIIIIIII I t l l l l i l i l l l l l l l l l l I I I I I I I II IIIIII II I t l
1980 1981 1982 1983 1984 1985 1986 1987 1988
Year
250
2OO
150
100
50
O O
II
¢O O>
03 t -
- . j
x" 03 10
I I I t I I I I I I I I I I I I I I I I I I I I I I I I I I I I I I I L L I I I I I I I I l l l l l l l l l l l l l l l l l l l l i l l l I t I l t l I I I I I I l l I I I Z I I I l i i I I I I I I I I l l l l I I l l I f I I
1980 198i 1982 1983 1984 1985 1986 1987 1988
Year
Figure 33--Wholesale log prices and building activity in Japan, by month, 1980-88.
t -
Figure a4--United States softwood log exports to Japan, by month, 1980-88.
60
(9
o .o '1o t -
u)
o t -
O~ Q.
¢ _
o
700
6O0
5O0
400
3O0
200
' . . ". .
" , : ....:.... . , -
-.....,.. ... " "
! I t~IIJ~[ILLL~JIJJ.Lt[.[LHLLLILI~I|LLLLLLLLLtlLIJJ.tlI.LIJtlL[LI.| tJ l_ l l } l l l l l lJ t i l l [ l lJ . l l - [HILL} l l lJ l l l i lL 1980 1981 1982 1983 1984 1985 1986 1987 1988
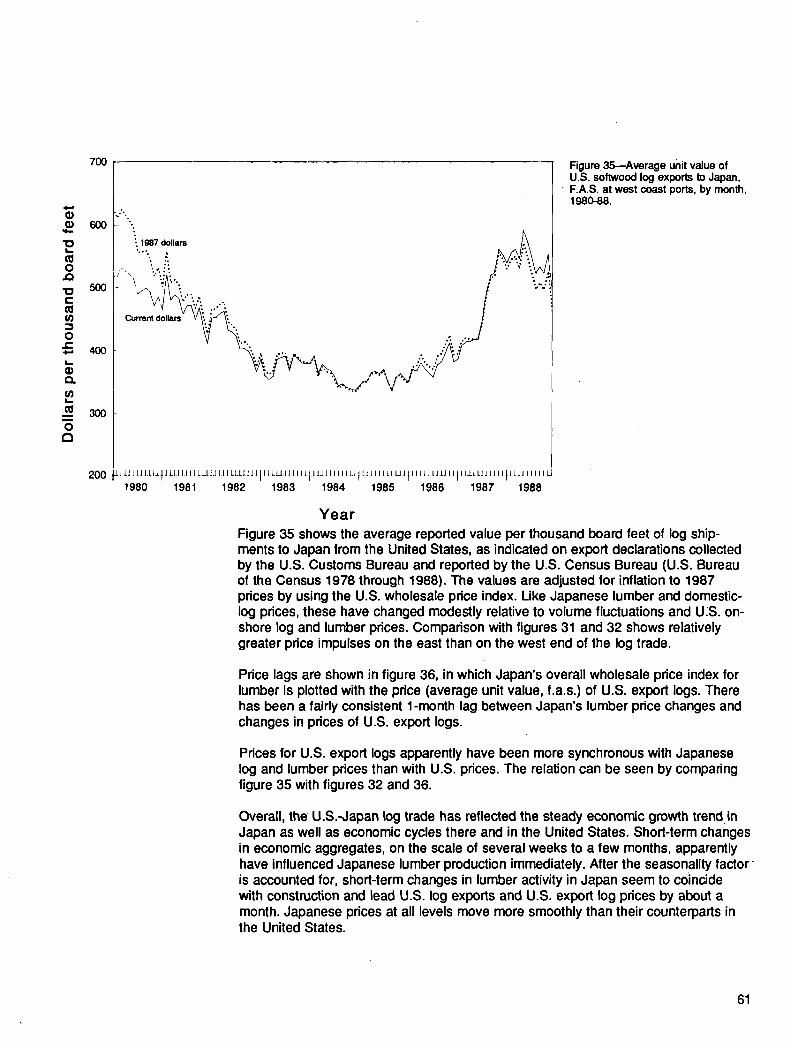
Figure 35~Average unit value of U.S. softwood log exports to Japan,
• F.A.S. at west coast ports, by month, 1980-88.
Y e a r Figure 35 shows the average reported value per thousand board feet of log ship- ments to Japan from the United States, as indicated on export declarations collected by the U.S. Customs Bureau and reported by the U.S. Census Bureau (U.S. Bureau of the Census 1978 through 1988). The values are adjusted for inflation to 1987 prices by using the U.S. wholesale price index. Like Japanese lumber and domestic- log prices, these have changed modestly relative to volume fluctuations and U:S. on- shore log and lumber prices. Comparison with figures 31 and 32 shows relatively greater price impulses on the east than on the west end of the log trade.
Price lags are shown in figure 36, in which Japan's overall wholesale price index for lumber is plotted with the price (average unit value, f.a.s.) of U.S. export logs. There has been a fairly consistent 1-month lag between Japan's lumber price changes and changes in prices of U.S. export logs.
Prices for U.S. export logs apparently have been more synchronous with Japanese log and lumber prices than with U.S. prices. The relation can be seen by comparing figure 35 with figures 32 and 36.
Overall, the U.S.-Japan log trade has reflected the steady economic growth trend in Japan as well as economic cycles there and in the United States. Short-term changes in economic aggregates, on the scale of several weeks to a few months, apparently have influenced Japanese lumber production immediately. After the seasonality factor" is accounted for, short-term changes in lumber activity in Japan seem to coincide with construction and lead U.S. log exports and U.S. export log prices by about a month. Japanese prices at all levels move more smoothly than their counterparts in the United States.
61

• Seasonality of the Log Trade
A
0 0
II
¢-
X
" 0 i -
l -
e-
t -
O
15
10
-5
-10
i i iJ "i
. ;:. J
:: ii , . :. : :
"2
. . . . . . . . . . . U.S logs to Japan - - Japan lumber, wpl price Index (softwood and hardwood)
- 1 5 ~ . . U I I I I I I I I I : I I I ~ t ~ [ ~ ~ ~ ~ i ~ ~ ~ I I I I I I I
1980 1984 1982 1983 1984 1985 1986 1987 1988
Year
Figure 36--Japan lumber pdce'indexes and unit value of U.S. softwood log exports to Japan, by month, 1980-88.
Summer highs and winter lows are major features of U.S. and Japanese construction (figs. 30 and 31). In Japan, wood-based construction and lumber production decline sharply three times each year, once in mid-summer and twice more within a 4-month span bracketing the end of the calendar year.
Figure 37 gives monthly data on softwood log exports from the United States to Japan, Korea, and China. The figure pertains to the month of departure from West Coast ports; another month or more may be required for transit, unloading, and (in some cases) waiting for vacant slips or visiting multiple destinations. Distinct sea- sonality is apparent, with winter departures well below those of other seasons. On average, first-quarter shipments are 25 percent below averages for May through July. The winter drop corresponds to poor Iogg!ng weather, short days, and the slow winter building season in Asia.
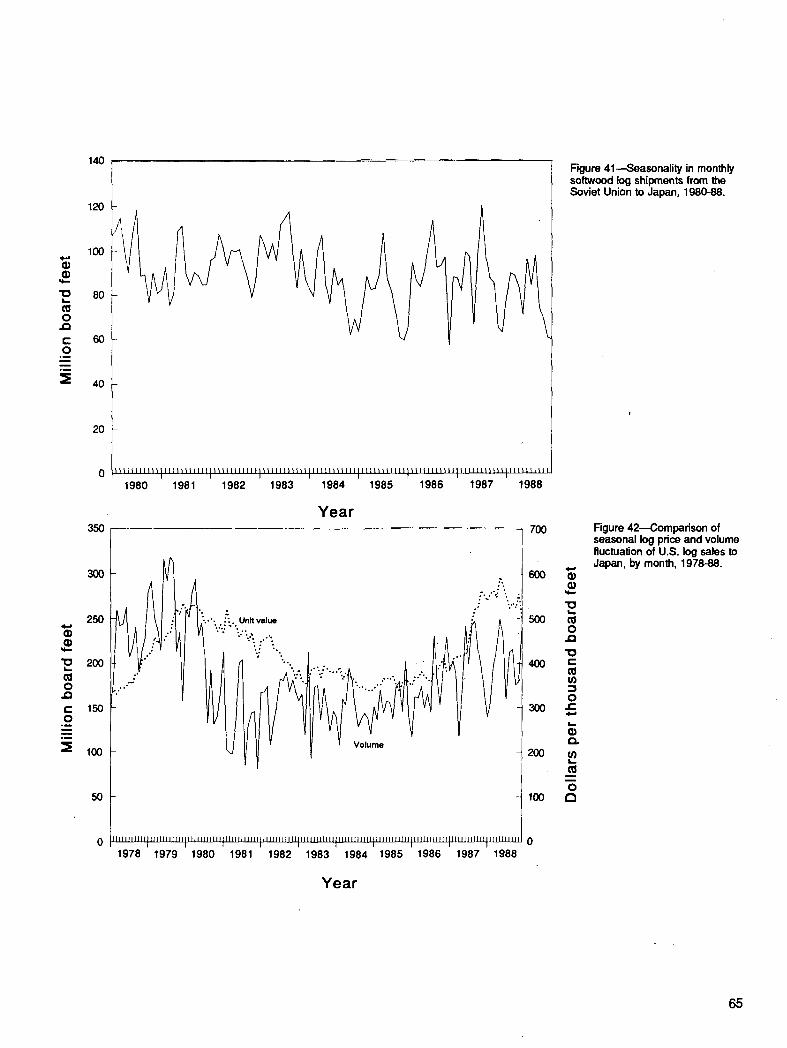
An extreme example of the winter effect is given in figure 38, which shows monthly export totals from Alaska. The difference in seasonal patterns between Alaska and the alI-U.S, flows is fully attributable to difficult winter conditions along Alaska's south- eastern panhandle, the source of almost all Alaska export logs. Seasonal difficulties at the source are as significant in Canada as in the United States (fig. 39). Winter problems are less pronounced in Chile and New Zealand (fig. 40), but Soviet exports to Japan fluctuate significantly (fig. 41).
62

"1o 1 = -
0
t- O
° ~
, m
m
q) (9
2 0 JO t- o
o ~
° ~
=Z
5OO
4OO
3OO
200
100
70
60
50
40
30
20
10
1980 1981 1982 1983 1984 1985 1986 1987 1988
Year
l l l l l l l l l l l l l l l l i l l J l l l l l I I
I I I I I I I I I I I I I I I I I I I I I I
1980 1981 1982 1983 I I J I I I I I I V l l l l l l l l l l l l l l l l l l l l l J J l l l l l l l l l l l t l l l l l Z l l l
I I I 1984 1985 1986 1987 1988
Year
Figure 37--United States softwood log exports to Japan, Korea, and mainland China, by month, 1980-88.
Figure 38--Seasonality of monthly softwood log exports from Alaska, 1980-88.
63

80
70
60
~- 50 "10
0 a~ 40
C 0 --- 3O , ~
20
10
25
20
15 £
o ,,Q
lO
i
J l f f l 1980
r f l ~ ' ~ ~ l l l l l l l ~ i l l l l l l l l l l i l l l l l J l l l l l l l l l l i i l l l l l l l l l l I 1981 1982 1983 1984 1985 1986 1987 1988
Year
IIIIIIII11111111111111 I 1980 1981
l l l l l l l l l l l l l l l l l l t l ] | l l l l l l l l l l l l l l l l l l l l l l l l l l l l l l l l l l l l l l l l l l l l l l l l l l l l l l I I I I I I I l l l I
1982 1983 1984 1985 1986 1987 1988
Year
Figure 39--Seasonality of monthly softwood log exports to Japan from Canada, 1980-88.
Figure 40--Seasonality in monthly softwood log shipments from New
' Zealand to Japan, 1980-88.
64
120
"10 t~ m 0 .43
c 0
o ~
~E
A
100
80
60
40
20
350
140
A
~ t~lIIII iIliltIII~ II~IIItblt If II It It If Ill t ~ ~Ittlt It ItIIIttItlI IIIttItttl it it l l IS It fill lltI~l ilIII~lIitl I I I I I T I
1980 1981 1982 1983 1984 1985 1986 1987 1988
Year
. . o.-,. ;
250 .'...: ~... Unlt va lue i
200150 lOO
50
II I r l l l l l l I H I I I I [ r l l l l i l l l l r l l l l l l l l l l l l l l l l l l I l l l J l l l l l l l l l i l + l l l l l N l l I11111 l l l l l l l l l l l l l l l l l I L L J J J J J J J J J ~ U J.l l I I I I I l I l I I I I I I I I I I I I I I I I
1978 1979 1980 1981 1982 1983 1984 1985 1986 1987 1988
Year
Figure 41---Seasonality in monthly softwood log shipments from the Soviet Union to Japan, 1980-88.
700
<.e
400
200
m
o 1oo t~
Figure 42--Comparison of seasonal log pdce and volume fluctuation of U.S. log sales to Japan, by month, 1978-88.
65

Literature Cited
Log prices, which in theory convey the signals regulating log shipments, move less vigorously across the seasons than do volumes (fig. 42). This reflects the smoothing effects of supplies from the Southern Hemisphere, somewhat slower seasonal demand when supplies are low, and cross-seasonal anticipations.
Anderson, Erlk T.; Bagger, Daniel W. 1989. Washington State forest products trade directory, 1989-1990 edition. Tacoma: The Evergreen Partnership; Seattle: University of Washington, College of Forest Resources, Center for International Trade in Forest Products. 120 p.
Austin, John W. 1969. Log export restrictions of the Western States and British Columbia. Res. Pap. PNW-91. Portland, OR: U.S. Department of Agriculture, Forest Service, Pacific Northwest Forest and Range Exper- iment Station. 13 p.
I
Photo P--Topping off a load.
Austin, John W. 1973. The Morse Amendment and Federal timber sales. Forest Industries. June: 38-41.
Bagger, D.W.; Waggener, T.R. 1985. Overview: Washington State forest products industry and international trade. Working Pap. 5. Seattle: Center for International Trade in Forest Products, University of Washington College of Forest Resources. [Not paged].
Barnett, Harold J.; Morse, Chandler. 1963. Scarcity and growth; the economics of natural resource availability. Baltimore: Johns Hopkins University Press. 288 p.
Baskervllle, David D. 1986. Meeting Japanese product requirements: observations from a management perspective. In: Schreuder, Gerard F., ed. World trade in forest products 2: Proceedings, 2d international symposium on world trade in forest products; 1985 March 19-21; Seattle, WA. Seattle: University of Washing- ton Press: 75-97.
Boston Consulting Group. 1968. Penetrating the Japanese market for softwood lumber and plywood products. Boston. 57 p.
Cooper, Richard N.; Lawrence, Robert Z. 1975. The 1972-75 commodity boom. Brookings Papers on Economic Activity. 3:671-711.
66

Cox, Thomas R. 1974. Mills and markets, a history of the Pacific coast lumber industry to 1900. Seattle: University of Washington Press. 332 p.
Darr, David R. 1975. U.S. forest products trade policies: what are the options? Gen. Tech. Rep. PNW-41. Portland, OR: U.S. Department of Agriculture, Forest Service, Pacific Northwest Forest and Range Experiment Station. 36 p.
Darr, David R. 1981. Interactions between domestic and export markets for softwood lumber and plywood: tests of six hypotheses. Res. Pap. PNW-293. Portland, OR: U.S. Department of Agriculture, Forest Service, Pacific Northwest Forest and Range Experiment Station. 22 p.
Darr, David R. 1984a. Conversion factors can affect forest products trade policies. Journal of Forestry. 82(8): 489-491.
Darr, David R. 1984b. U.S. trade in timber products: a background report. Wash- ington, DC: U.S. Department of Agriculture, Forest Service. [Not paged].
Darr, David R.; Haynes, R!chard W.; Adams, Darius M. 1980. The impact of the export and import of raw logs on domestic timber supplies-and prices. Res. Pap. PNW-277. Portland, OR: U.S. Department of Agriculture, Forest Service, Pacific Northwest Forest and Range Experiment Station. 38 p.
Drake, Peter. 1984. Prospects and problems for North American exports to Pacific Rim countries. In: International forest products trade: resources and market op- portunities: Proceedings of a conference; 1983 November 7-9; [Arlington, VA]. Madison, Wh Forest Products Research Society: 135-139.
Elchlbegoff, Ivan M. 1949. United States international timber trade in the Pacific area. Stanford, CA: Stanford University Press. 302 p.
Fenton, R.T. 1984. Sawn timber in Japan, and New Zealand prospects: progress report. Rotorua, New Zealand: New Zealand Forest Research Institute. 67 p.
Fenton, R.T.; Maplesden, F.M. 1986. The eastern USSR: forest resources and forest products exports to Japan. FRI Bull. 123. Rotorua, New Zealand: New ZealandForest Research Institute. 93 p.
Fisher, W. Halder. 1964. Report on analysis of the relationship of softwood log exports to the economy of the State of Washington. Columbus, OH: Battelle Memorial Institute; report to Washington Department of Natural Resources. 66 p.
Flora, Donald F. 1986. Markets for radiata pine as seen from that other softwood region. New Zealand Forestry. 31(1): 19-22.
• Flora Donald F. 1988. USA: trade channels for its forest products. In: Nagy, Andras, ed. International tradein forest products. Oxon, Great Britain: A B Academic Publishers: 171-182.
67

Flora, Donald F.; McGInnls, Wendy J. 1989. Embargoes on and off: some effects of ending the export ban on federal logs and halting exports of state-owned logs. Western Journal of Applied Forestry. 4(3): 77-79.
Flora, Donald F.; Vlosky, RichardP. 1986. Potential Pacific Rim demand for construction-grade softwood logs. Res. Pap. PNW-RP-364. Portland, OR: U.S. Department of Agriculture, Forest Service, Pacific Northwest Research Station; Seattle: University of Washington, College of Forest Resources, Center for International Trade in Forest Products. 29 p.
Food and Agriculture Organization. 1971-72. Yearbook of forest products. Rome: United Nations.
Food and Agriculture Organization. 1988. Yearbook of forest products. Rome: United Nations.
Francescon, A.; Nagy, A. 1988. Historical analysis: international trade in forest products. In: Nagy, Andras, ed. International trade in forest products. Oxon, Great Britain: A B Academic Publishers: 197-256.
GUlls, R. Peter; Roach, Thomas R. 1986. Lost initiatives, Canada's forest indus- tries, forest policy and forest conservation. Contributions in economics and econ- omic history 69. New York: Greenwood Press. 326 p.
Hamilton, Thomas E. 1971. Log export Policy: theory vs. reality. Journal of Forestry. 68(8): 494-497.
Haynes, Richard W. 1976. Price impacts Of log export restrictions under alternative assumptions. Res. Pap. PNW-212. Portland, OR: U.S. Department of Agriculture, Forest Service, Pacific Northwest Forest and Range Experiment Station. 25 p.
Hines, Judith A., 1987. Log export restrictions of the Western States and British Columbia. Gen. Tech. Rep. PNW-GTR-208. Portland, OR: U.S. Department of Agriculture, Forest Service, Pacific Northwest Research Station. 13 p.
Ingram, Robert M., III. 1983. Financing export sales for the small- and medium-size forest products firm. In: Bethel, James S., ed. World trade in forest products. Seattle: University of Washington Press: 425-531.
International Monetary Fund. 1987. Primary commodities; market developments and outlook. Washington, DC. 91 p.
International Monetary Fund. 1988. International financial statistics; yearbook. Eng. ed. Washington, DC. 764 p.
Irland, Lloyd C. 1974. Is timber scarce? The economics of a renewable resource. Yale University School of Forestry and Environmental Studies Bull. 83. New Haven, CT: Yale University. 97 p.
68
Johnston, Verle B. 1986. Adjusting the focus. FRBSF Weekly Letter. San Francisco: Federal Reserve Bank of San Francisco. April 25: 1-3.
Ku, Timothy T.; Guldin, James M.; Beasley, R. Scott. 1989. Management shift embraces nontimber values; contemporary forestry on the island of Taiwan: a report. Journal of Forestry. 87(6): 16-18.
Larsen, David N.; Bearden, Donald Ao 1986. 1984 Washington mill survey, wood consumption and mill characteristics. Series Rep. 9. Olympia, WA: Washington State Department of Natural Resources. 28 p.
Larsen, David N.; Bearden, Donald A. [In press]. 1986 Washington mill survey. Olympia, WA: Washington State Department of Natural Resources.
Lawton, Donald P.; Glsh, Elden M., hearing officers. 1969, Prevention of Federal timber substitution for nonfedera! log exports: Transcript of proceedings of a hearing; 1969 September 26; Portland, OR: U.S. Department of Agriculture, Forest Service; U.S. Department of the Interior, Bureau of Land Management. 94 p.
LIndell, Gary R. 1978. Log export restrictions of the Western States and British Columbia. Gen. Tech. Rep. PNW-63. Portland, OR: U.S. Department of Agriculture, Forest Service, Pacific Northwest Forest and Range Experiment Station. 14 p.
Llndell, Gary R. 1980. Substitution and the USDA Forest Service log export restrictions. Res. Note PNW-355. Portland, OR: U.S. Department of Agriculture, Forest Service, Pacific Northwest Forest and Range Experiment Station. 6 p.
Manthy, Robert S. 1978. Natural resource comrnodities--a century of statistics; prices, output, consumption, foreign trade, and employment in the United States, 1870-1973. Baltimore: Johns Hopkins University Press. 240 p.
Morrlson, Peter; Gasson, Rob; Armstrong, Glen; Williams, Douglas. 1985. The recovery cost of the merchantable timber in coastal British Columbia. Forest Economics and Policy Analysis Project Information Rep. 85-8. Vancouver, BC: [University of British Columbia], Forest Economics and Policy Analysis Project. 48p.
Nagy, A.; Anderson, A. 1988. Introduction. In: Nagy, Andras, ed. International trade in forest products. Oxon, Great Britain: A B Academic Publishers: 1-16.
Nippon Mokuzal Bichiku Klko. 1983. Wood supply and demand in ,Japan. Tokyo: Nippon Mokuzai Bichiku Kiko; supervised by Forestry Agency. 53 p.
Nomura, Isamu. 1988. Japan: the timber trade and its problems. In: Nagy, Andras, ed. International trade in forest products. Oxon, Great Britain: A B Academic Publishers: 115-134.
Pacific Power & Light Company. 1968. Log exports, their impact upon the forest products industry and the Oregon economy. Portland, OR. 10 p.
69

Plcornell, Pedro M. 1983. The market for wood-based products as seen by a Southeast Asian producer. In: Bethel, James S., ed. World trade in forest products. Seattle: University of Washington Press: 262-268.
Province of British Columbia. 1981. Forest Act, chapter 140 [Act administered by the Ministry of Forests] [Consolidated August 11, 1981]. Victoria: Queen's Printer, 69 p.
Radcliffe, Samuel J. 1981. U.S. forest products trade and the multilateral trade negotiations. In: Sedjo, Roger A., ed. Issues in U.S. international forest products trade: Proceedings of a workshop; 1980 March 6-7; Washington, DC. Washington, DC: Resources for the Future: 136-168.
Rakestraw, Lawrence W. 1981. A history of the United States Forest Service in Alaska. Anchorage: Alaska Historical Society. 221 p.
Relfenberg, Arno, hearing officer. 1979. In the matter of third party substitution: Transcript of proceedings of hearings; 1979 August 15-16. Portland, OR; Seattle, WA: U.S. Department of Agriculture. 200 p.
Ruderman, Florence K. 1975. Production, prices, employment and trade in Northwest forest industries, fourth quarter 1974. Portland, OR: U.S. Department of Agriculture, Forest Service, Pacific Northwest Forest and Range Experiment Station. 52 p.
Schreuder, Gerard F.; Vlosky, Richard P. 1986. Indonesia as an exporter and importer of forest products. In: Schreuder Gerard F., ed. World trade in forest products 2. Seattle: University of Washington Press: 168-190.
Sherk, Donald R. 1970. The United States and the Pacific trade basin. San Francisco: Federal Reserve Bank of San Francisco. 64 p.
Simpson, Thomas E. 1973. Kauri to radiata, origin and expansion of the timber industry of New Zealand. Aukland, New Zealand: Hodder and Stoughton. 442 p.
Smith, Charles. 1988. On the verge of a splurge. Far Eastern Economic Review. October 13: 47-49.
Smith, V. Kerry, ed. 1979. Scarcity and growth reconsidered. Baltimore: Johns Hopkins University Press. 298 p.
Stanford Research Institute. 1974. Benefits and costs of alternative log export policies: Phase I report. Menlo Park, CA: Stanford Research Institute; prepared for Pacific Northwest Regional Commission. 193 p.
Takeuchl, Kenji. Market prospects for tropical hardwoods from Southeast Asia. In: Bethel, James S., ed. World trade in forest products. Seattle: University of Washington press: 432-447.
70

Throop, Adrian W. 1986. Slight moderation in the housing cycle. FRBSF Weekly Letter. San Francisco: FederalReserve Bank of San Francisco. [Issue unknown]: 1-3.
Ueda, Mlchlhiko; Darr, David R. 1980. The outlook for housing in Japan to the year 2000. Res. Pap. PNW-276. Portland, OR: U.S. Department O f Agriculture, Forest Service, Pacific Northwest Forest and Range Experiment Station. 25 p.
Ulrich, Alice H. 1988. U.S. timber production, trade, consumption, and price statistics 1950-86. Misc. Publ. 1460. Washington, DC: U.S. Department of Agriculture, Forest Service, Demand, Price, and Trade Analysis Group. 81 p.
United Kingdom-Japan 2000 Group. 1988. Excerpts from papers at January, 1988 meeting. The Economist. January 23: 63.
United Nations Industrial Development Organization. 1983. Tariff and non-tariff measures in the world trade of wood and wood products (prepared by the UNCTAD secretariat). Sectoral Studies Branch, Division for Industrial Studies, Sectoral Working Paper Series, Number 6. Vienna: United Nations Industrial Development Organization. 61 p. [limited edition].
U.S. Bureau of the Census. 1978-88. U.S. exports; schedule E, commodity by country; Series FT410. Washington, DC: U.S. Government Printing Office. Monthly and annual.
U.S. Bureau of the Census. 1975. Historical statistics of the United States; colonial times to 1970. Washington, DC: U.S. Government Printing Office. 2 vol.
U.S. Bureau of Economic Analysis. 1983. Business statistics 1982; a supplement to the Survey of Current Business. Washington, DC: U.S. Government Printing Office. 221 p.
U.S. Bureau of International Commerce. 1964. The Japanese market for softwood logs and lumber. Washington, DC. 33 p.
U.S. Department of Commerce. 1967. Business statistics 1967; the biennial sup- plement to the Survey of Current Business. Washington, DC. 262 p.
U.S. Department of State. 1977a. The trade debate. Department of State Publ. 8942. Washington, DC. 32 p.
U.S. Department of State. 1977b. Update on the forest industry in Japan. Unclas- sifted airgram A-346, 15 November. Tokyo: American Embassy. 14 p.
U.S. Department of the Treasury.' 1968. Treasury Department staff report on the Pacific Northwest log export problem. Washington, DC. 20 p.
U.S. General Accounting Office. 1985. Potential impacts of tighter Forest Service log export restrictions. GAO/RCED-85-17. Washington, DC. 34 p.
71

U.S. Senate. 1968. Log-exporting problems. Hearings before the Subcommittee on Retailing, Distribution, and Marketing Practices of the Select Committee on Small Business, January 22, and 23, 1968. Washington, DC. 3 vol.
U.S. Senate. 1972. Log export controls. Hearings before the Subcommittee on Inter- national Finance of the Committee on Banking, Housing and Urban Affairs, June 1972. Washington, DC. 454 p.
Wadsworth, John. 1983. International wood markets: a European view. In: Bethel, James S., edo World trade in forest products. Seattle: University of Washington Press: 402-415.
Warren, Debra D.' 1988. Production, prices, employment and trade in northwest forest industries, fourth quarter 1987. Resour. Bull. PNW-RB-154. Portland, OR: U.S. Department of Agriculture, Forest Service, Pacific Northwest Research Station. 74 p.
Washington Department of Natural Resources. 1965. Report on log export problem. Olympia, WA. 19 p.
Williams, D.H.; Gasson, R. 1986. The economic stock of timber in the coastal region of British Columbia. Forest Economics and Policy Analysis Project Inf. Rep. 86-11. Vancouver, BC: [University of British Columbia], Forest Economics and Policy Analysis Project. 20 p.
Wolf, Robert E. 1975. The Douglas fir region timber supply situation and log export regulation as proposed by H.R. 5544. Washington, DC: The Library of Congress Congressional Research Service. 26 p.
World Bank. 1982 and 1988. Wodd development report. New York: Oxford Uni- versity Press.
72 lkU.S GOVERNMENT PRINTING OFFICE:1991-591-001~I40021
Flora, Donald F.; Anderson, Andrea L ; McGInnlm, Wendy J. 1991. Pacific Rim soft- wood log trade: determinants and trends. Res. Pap. PNW-RP-432. Portland, OR: U.S. Department of Agriculture, Forest Service, Pacific Northwest Research Station. 72 p.
Pacific Rim trade in softwood logs amounts to about $3 billion annually, of which the U.S. share is about $2 billion. Log exporting is a significant part of the forest economy in the Pacific Northwest. The 10 major Pacific Rim log-trading client and competitor countries differ widely in their roles in trade and in their policies affecting the industry.
Keywords: Markets (external), supply and demand (forest products), trade (Pacific Rim), log exports.
The Forest Service of the U.S. Department of Agriculture is dedicated to the principle of multiple use management of the Nation's forest resources for sustained yields of wood, water, forage, wildlife, and recreation. Through forestry research, cooperation with the States and private forest owners, and management of the National Forests and National Grasslands, it stdves~as directed by Congress--to provide increasingly greater service to a growing Nation.
The U.S. Department of Agriculture is an Equal Opportunity Employer. Applicants for all Department programs will be given equal consideration without regard to age, race, color, sex, religion, or national origin.
Pacific Northwest Research Station 319 S.W. Pine St. P.O. Box 3890 Portland, Oregon 97208-3890

U.S. Department of Agriculture Pacific Northwest Research Station 319 S.W. Pine Street P.O. Box 3890 Portland, Oregon 97208
BULK RATE POSTAGE + FEES PAID USDA-FS
PERMIT No. G-40
Official Business Penalty for Private Use, $300
do NOT detach label