part one - history of ceylon tea beckoning to be exploited, and small wonder that nations all over...
TRANSCRIPT

1
THESIS ON THE HISTORY OF CEYLON
TEA MONTE HOLSINGER (2002)
History of Ceylon Tea is delighted to present an essay on the history of Ceylon tea
written by former tea planter Monte Holsinger as a thesis for his Bachelor’s Degree in
Management in 2002. This well-researched document comprehensively captures the
history of the plantation industry while also touching on the country’s colonial past.
HOCT is indeed grateful to Mr Holsinger for making it available to us and our
readership.
PART ONE

2
OUTLINE OF RECENT HISTORY
The Island of Sri Lanka has a heritage rich in culture and rife with conflict. The
aborigines of the country bear no relevance in this study and are of more interest to
anthropologists and paleontologists, who have postulated that Homo sapiens possibly first
set foot on the isle about 500,000 years ago.
The more recent history, which is pertinent to this paper, is unfortunately, a combination
of myth, legend, folklore, epigraphics and historical records. The historical records do
not necessarily embody an unbiased or objective narration of historical events, and may
well reflect the historian’s perception, or even be a valediction of the kings and rulers of a
given period. Much research has however been done by the students of history in their
assiduous search for the truth, and we are the beneficiaries of their diligence. We can
now safely assume that these scholarly dissertations have unraveled the past with
reasonable accuracy, and we can now rely on this historical perspective on which to
predicate this thesis.
Sri Lanka, known as Seilan or Ceylon in the days gone by, occupies an enviable
geographic location. Like a tear drop shed by India, Sri Lanka lies below the southern tip
of the mainland, about 8 degrees above the equator. This is directly in the path of the
ancient trade routes and therefore the country has been a haven for seafarers and mariners
from time immemorial. Although the island is now separated from the mainland by the
Palk Straits, (a distance of only 40 kilometres), it was undoubtedly connected with
mainland India at some point in prehistory. These factors have rendered the island, so
rich in natural resources and bio diversity, vulnerable to invaders on the one hand and
inviting to travelers, on the other. Sri Lanka was truly a tropical Paradise, ripe for the
picking, beckoning to be exploited, and small wonder that nations all over the world vied
for this prize.
The history of man in Sri Lanka, in recent times as can be gathered from that
indispensable record, the ‘Mahawamsa’ begins with the arrival of Vijaya, the legendary
founding father of the Sinhalese (Sinhala). According to legend, Vijaya was banished for
misconduct by his father, Sinhabahu, the ruler of the North Indian kingdom of Sinhapura.
Vijaya and his disorderly group of cohorts numbering about 700 in all reached the
Northwestern shores of Sri Lanka, near Puttalam and gained foothold in the country.
The ‘Mahawamsa’ and its sequel, the Culawamsa were literary works of buddhistic
chroniclers and quite naturally, liberally interspersed with miracles, supernatural
interventions and fanciful inventions, all evincing a strong religious bias. While the
cursory reader may go along with the story and its contrivances, the true historian will
view this against the backdrop of world history, in piecing together the puzzle of the past.
3
Suffice it to say that the advent of Vijaya to the island as per the Mahawamsa coincides
with the colonisation of Sri Lanka, by Indo-Aryan tribes from Northern India. A Later
immigration from Bengal and Orissa is also strongly indicated.
Although the sub continent exerted a great pressure in the shaping of Sri Lanka, its
strategic location athwart the main sea routes, led inevitably to other equally important
influences being brought to bear in this metamorphosis.
Whilst the archeologists continue their scholarly research into the cradle of human
civilisation, we are here mainly concerned in establishing with reasonable accuracy, a
historical basis for the ethnic diversity in the demography of Sri Lanka.
Anthropological postulations place the arrival of ‘Home Sapiens’ on the island, to around
500,000 thousand years, but there is very little evidence to go on about subsequent
cultures in Paleolithic terms.
Comparatively recent stone cultures show up around 10,000 BC and probably lasted up to
around 1000 BC or less, when the metal ages surfaced.
Traces of Mesolithic man have been found and these continue into proto-historic periods,
via the ‘Balangoda Man” and ‘Balangoda Cultures’ which were submerged by the
pressures exerted by the early Indo-Aryan colonisers, probably in the period 500 BC to
the Christian era. The aboriginal of Sri Lanka has now disappeared. The Veddah tribes
found today in the jungles of the Vanni are the descendants of the Balangoda Man
intermixed with the Sinhalese and the Tamils. However, even this questionable ethnic
integrity has been highly diluted and it is now not very long before the remnants of the
Veddah ‘race’ will cease to exist being totally assimilated into the predominant ethnic
groups.
The early settlers were romantically portrayed as warrior nobility building new empires
by conquest. However, more realistically, seafarers and traders of both West and East
Asia found the country and its wealth of natural resources incentive enough to found their
own settlements, in the Maritime Provinces.
The Indo Aryan immigrants settled in various provinces of the island especially along the
west coast and the banks of the Malwatu Oya River. Some settled on the East and moved
inland along the Mahaweli River. Still later, a new wave of immigration settled in the
Ruhunu Province along the Walawe River. These settlers were of various clans, the
foremost among them being the Sinhalas, and the settlements were in the dry zone. By
now the metal age had revolutionized archetypal existence.
By the end of the Pre Christian era, Buddhism had gained ascendancy over other forms of
religion and was under the patronage of the rulers. An agrarian economy was well
established and self-sufficient and self-governing villages (settlements) began to flourish.
The picture of this proto historical period is completed by the Dravidian incursions to the
island. There was already a strong Dravidian Civilisation in South India, which relied
substantially on international trading. Quite naturally therefore, Dravidians entered Sri
Lanka either for trading by peaceful means or through more bellicose invasions. All
historical evidence would tend to support the hypothesis that the Dravidians entry to Sri
Lanka was preceded by the Indo Aryans. However, by the beginning of the Christian era,

4
they were firmly established in the country, in several settlements in the North and the
East.
Evidence also suggests that Sri Lanka, a multi ethnic society, lived in tolerance and racial
harmony when under a unified polity, rather than a pluralistic one where ethnic tensions
are a prime feature.
The truth as to the actual conditions obtaining under a single polity is rather obscure.
Myth and legend portray all their kings since the (mythical) Vijaya as rulers of the entire
island, but this was not so. There were several kingdoms in the island during this period,
with the strongest among them having hegemonic notions over the others. Even during
the reigns of the few powerful kings who held sway over the entire island, there was no
highly centralised autocratic power structure in the heyday of the Sinhala era, but one
where the “Balance of political forces incorporated a tolerance of particularism,
charactistic of most feudal polities”. (K M de Silva). This was mainly due to practical
difficulties in administering far-flung lesser “kingdoms”.
Although centripetally may have been the aspiration of several of the Sinhala kings, very
few achieved it. The Anuradhapura period (250 BC –1050 AD) and Polonnaruwa period
(1050 AD – 1250 AD) are fraught with accounts of invasion from India. By the turn of
the 11thcentury Cola invaders from India overthrew the Sinhala regime and a Cola king
was installed. The Sinhalese then retreated to Polonnaruwa from where a protracted war
was waged upon the usurping Colas, the country liberated and the Sinhala monarchy
restored.
Although there are two periods of unified rule during the Polonnaruwa period, very often
stability in the country deteriorated into bloody squabbles among motley congeries.
Moreover, relentless invasions mounted by the Colas and Pandyans always accompanied
by an orgy of destruction and desecration and led to the fragmentation of power and
polity.
Other factors, which precipitated the downfall of the Polonnaruwa kingdom, were firstly
the highly centralised governance of the era, which proved unable to maintain, much less
develop the mainstay of the economy – agriculture. Secondly the malaria epidemic,
which gripped the country, ravaged the population. The malaria epidemic could well be a
direct consequence of the latter day centralised authority’s failure in agriculture. The
extensive and intricate network of reservoirs and channels fell into disuse and offered
excellent breeding grounds for the dreaded Anopheles mosquito.
The Sinhala kings and kingdoms continued their retreat Southward to Dambulla,
Kurunegala, Gampola, Dedigama, Kotte and Sitawaka.
A parallel kingdom was established in Kandy, in the mid 15th century and shortly, the
kingdom of Jaffna was also established by the Tamils in the North.
The fragmentation of the country was complete with the Sitawaka Kingdom making its
appearance around 1520 AD.
Thus, when the Portuguese first set foot in Sri Lanka, the country was governed by at
least 4 kingdoms, whilst in the thickly forested and almost impenetrable Vanni Province
there may have been several chieftains or Vanniars holding sway over smaller tracts of
the province.

5
The Portuguese, whose first entry to the country was in 1505/6, was by accident returned
12 years later, with the intention of opening up a trading post.
The Sinhalese and, more importantly, the Moors who had long established themselves as
the major trading community in the country regarded this new development with great
suspicion and hostility.
The Portuguese era in Sri Lanka is studded with fierce fighting throughout their 135 year
colonization of Sri Lanka. Their primary aim was to set up trading posts in the maritime
regions of the country, but frequent outbreaks of hostility from the natives, fanned by the
Moors, apprehensive of their position as the prime trading community, resulted in their
several unsuccessful forays into the Kandyan stronghold.
The status quo of the country’s social structure at this point of time is of vital importance
in this study. The basic elements in the demographic make up were Sinhalese, Tamils,
Moors and Veddahs, in that order. However due to the continual invasions mounted by
the Colas and Pandyans and other South Indian interlopers, the ethnic purity of the Indo
Aryan Sinhala must have surely been adulterated considerably. It is also worthy of note
that even in times of peace with the mainland, whenever succession of the monarchy was
in question (a lack of an heir apparent) the Kandyans resorted to a Tamil pretender to the
throne, or more often, a Tamil queen.
The culture of the inhabitants had evolved to a high degree but was concentrated in the
hands of the hierarchy. Literacy was developing rapidly and literature began to blossom.
Architecture had evolved from its Indian origins and assumed a discrete identity though it
retained the original influences.
A system of barter prevailed, but monetisation was making headway in commerce and
commercial transactions. International trade flourished and Spices, Gems, Areca,
Cinnamon, and even elephants, were traded for Cloth, Salt and luxuries.
Craftsmanship in metals and wood reached new heights. More sophisticated armament
and weaponry developed with the acquisition of these skills.
The social structure of the two main ethnic groups had by now stratified in rigid caste
systems.
The great Sinhala hydraulic society suffered under the continual Cola and Pandyan
onslaughts, the centralisation of authority in latter times of peace and the ravages of
malaria. At the time of Portuguese occupation a feudal system went hand in hand with
the religio-political governance that prevailed in the Sinhala kingdom. In the North, in
Jaffna too, feudalism and the caste system buttressed a religion biased monarchical
administration.
Feudalism imposed fairly heavy taxes on tenants and peasantry alike. Private owner ship
of land was mainly through privilege. The Monasteries received great patronage from the
rulers of the day and these soon became the largest holders of private land. Taxes for use
of land and water (water was all held solely by the kings) were either by labour or
produce or both.

6
There was also a tenurial system whereby those who worked temple lands were given a
share of the produce, unless of course they were slaves. Slavery is however, unimportant
to the central theme of this paper and also drew no significant interest from the historians.
Therefore, it can be safely assumed that the country was at this time undergoing
fragmentation with the decline of the Sinhala Empire. The various Monarchies governed
their territories in a religio-political system with strong feudal underpinnings. A cast
system was firmly established and a system of compulsory service (Rajakariya) was in
force.
The upper strata of society, namely the Royal Family members, the Aristocracy and State
and Army officials enjoyed a comfortable, if not luxurious life style. They were the
beneficiaries of the rich culture of the times. The peasant masses lived in much different
circumstances. Condemned to live in mud and wattle houses and subjugated by to the
upper classes, they were fettered by the deep-seated caste system.
The Portuguese occupation of Sri Lanka is punctuated by a continual warfare with both
the low country and Kandyan kingdoms. Never at any time did they have complete
control over the land. Their main objectives were trade and proselytism and so they did
not interfere much with the native administrative machinery of the time. The Sinhala in
the Hill Country never actually capitulated to the Portuguese and entered into treaties
only when expedient. The low country kingdoms on the contrary, being more vulnerable,
were more often than not subservient to the Portuguese.
The Portuguese were bent on religious conversion apart from exploiting the resources of
the country and they gradually established monopolies in trading especially in Cinnamon.
They used the caste system to further their ends with clever innovations, which stopped
just short of altering its basic structure.
Local produce was purchased compulsorily, at prices which did not reflect market
conditions, to the detriment of peasant farmers. Areca nut was the primary commodity
purchased and this was bartered for rice in India. Gradually, commercial activity and
monetisation gained momentum and the economy began to prosper, through this
prosperity did not percolate down to all levels.
The greatest contribution made by the Portuguese during their occupation of Sri Lanka
was the introduction of Roman Catholicism. The administration and the missionaries
pursued the conversion of the natives with furious zeal. Temples, both Buddhist and
Hindu were ruthlessly destroyed and temple lands handed over to Roman Catholic clergy.
Proselytisation went all the way up to the monarchy and Roman Catholicism acquired an
inquisitorial tinge. Where enticement failed coercion prevailed. The Tamils in the North
and other littoral areas suffered more than the Sinhalese, whose clergy found refuge in
Kandy.
Religious persecution was not a new phenomenon in Sri Lanka, but by the 16th century
religious tolerance was an ensconced Buddhist precept.
Nevertheless, the influence of Roman Catholicism wasn’t all bad. The concepts of
monogamy and the sanctity of wedlock went a long way towards eradicating polygamy
and polyandry in the littoral.

7
The Portuguese also influenced the construction of permanent dwelling houses, in
contrast to the mud and wattle shelters of the masses. Portuguese language and attire too
found acceptance among the people of the Maritime Provinces.
The Dutch finally ousted the Portuguese from Sri Lanka. The Kandyan King Rajasingha
II, after a prolonged negotiation with the Dutch formed an alliance for the purpose of
overthrowing the Portuguese. The Dutch defeated the Portuguese and captured the
important sea ports of Trincomalee, Galle and Negombo
The VOC or Vereenidge Oost-Indische Campagnie that was formed in 1602 grew into
what was to become the greatest commercial company in the world. The Dutch
colonisation of the Asian subcontinent was coordinated by the VOC who set up head
quarters in Batavia (now Djakarta) in 1610. Batavia became the capital of the Dutch East
Indies and their superiority in the region made things very difficult for the Portuguese,
who had no recourse but to withdraw entirely from the island.
In 1639, the port of Trincomalee was handed back to the Sinhalese, but not Galle and
Negombo. In 1640, these were retained under Dutch control on contrived grounds, in
violation of the treaty.
In the meanwhile, European politics also took a dramatic turn vis a vis its impact on Sri
Lanka’s future, which led to a cessation of hostilities between the Dutch and Portuguese
and rendered the succession of the Dutch, as the new rulers of the island, much easier.
The V.O.C., like the Portuguese before them, adapted the indigenous administrative
system to suit their needs and left it much as found.
With the abdication of the Portuguese, the local administrative power lay in the hands of
Sinhala Christians in the south and Tamil Christians in the north. These officials were not
retrenched provided they proved their loyalty to the V.O.C. and eschewed Catholicism in
favour of Calvinism.
The Dutch, by necessity had to place much trust in these officials who proved corrupt in
general, and deprived the VOC of much revenue. These indigenous officials acquired
power and wealth over the years from blatant maladministration and abuse of authority
over their own countrymen.
The cast system was refined and used to the advantage of the company, and village chiefs
(headmen) were appointed on a caste basis i.e., a single Head-Man for single-caste
villages, and several for multi-caste villages.
These Headmen, and higher officials too exploited the dependence the Dutch had on
them to further their own ends and amass wealth.
The Dutch, on the other hand, in their efforts to ensure receipt of their rightful revenue,
adapted a Portuguese method of Cadastral Survey for this purpose.
This project was long drawn out and rendered extremely difficult and frustrating by the
non- cooperation of the Sinhala headmen. However, in 1770 this arduous task was
completed and owed much to the victory of the Dutch against the Kandyan kingdom
in1766 and their recognition of Dutch sovereignty.

8
Sri Lanka (Ceylon) under early Dutch rule suffered from corruption and
maladministration, and even misrule. This untenable situation reached a peak in 1732
when Governor Petrus Van Vuyst was tried and found guilty of excesses and executed in
Batavia.
Thereafter, the reforms introduced by Van Imhoff restored responsible administration that
prevailed until the latter years of the 18th century.
An important aspect of Dutch governance was their discrimination against Muslims.
Muslims were debarred from renting lands – an early manifestation of anti
fundamentalism perhaps.
The most durable residue of Dutch rule was their introduction of Roman-Dutch law in the
land. Roman Dutch law was designed to upgrade and complement indigenous laws.
Where these were unclear or unreasonable, Roman Dutch law supplemented justice and
fair play. It also consolidated the Portuguese introduced concepts of monogamy and
sanctity of marriage and gave legitimacy to land holdings and land transactions – the
greatest beneficiaries of which were the local chiefs or headmen.
When it came to religious persecution the Dutch were not second to the Portuguese and
they proscribed Roman Catholic worship under severe penalty. Although this engendered
many conversions, a large proportion of the converts embraced Calvinism merely for
convenience or other venal reasons. The harried Roman Catholic clergy and faithful
disciples found a safe haven in which to profess their faith in the Kandyan kingdom.
However, the Dutch were more tolerant of the indigenous religions than the Portuguese.
The link between conversion and education forged by the Portuguese was maintained. By
the end of the 18th century a practice of sending a few of the brighter students for higher
studies in the Netherlands had commenced.
Living standards in the littoral improved marginally except in the upper classes who
began acquiring Dutch traits in dress, housing and even food and drink. In the Kandyan
Kingdom though, this influence was much less felt, due to the resistance of the Kandans
to foreign occupation. The Kandyans kept up regular incursions into the lowlands causing
unrest and even rebellion among their low country counterparts. This led to frequent
interruptions in the commercial activity of harvesting and exporting Cinnamon abroad
and extracting tenurial toll from tenant farmers.
The latter day Dutch Governors, notably Van Gollonese, preferred the use of flattery
bribery and cajolery, to force or coercion, but their ever-increasing cupidity exerted
enormous pressure on the Sinhalese to meet stiff quotas and arbitrary taxation.
Unfortunately for the Dutch, the struggle against their trade monopoly intensified with
the increasing number of Indian settlers who arrived at a time which coincided with the
establishment of a lucrative smuggling trade through the Kandyan ports, courtesy of the
Kandyan King, Kirthie Sri Rajasingham, and his Indian “Nayakkar” connexion. This led
to renewed intrusion of the Kandyans into Dutch controlled territories and these
hostilities culminated in open warfare again, after a cessation of over a century.
Thus the political scenario when the British made their appearance in these waters, in
1762 was one of great ferment. The English East India Co. sent their first diplomatic

9
mission under John Pybus. Their intentions were merely reconnaissance and intelligence
related.
The Kandyans on the other hand were desperate to form an alliance with which to drive
away the Dutch, and vigorously pressed their proposals. The English were not prepared to
antagonize the Dutch who were neutral in the SEVEN YEARS WAR and were merely
testing the waters.
The discovery that the Pybus Mission was conducting negotiations in Kandy greatly
surprised the Dutch, who were at war with the Kandyans and served to strengthen their
resolve to conquer Kandy and reverse their earlier policy of bilateral relations.
After an initial setback, they finally captured Kandy and extracted a harsh treaty from the
Kandyans in 1766.The Dutch were finally the paramount power over the island and the
Kandyan Kingdom reduced to a land locked dependency.
The hard reality of enforcing the treaty was soon evident to the Dutch. The recalcitrant
kandyans began flouting the terms of the treaty often with impunity. In their desperation
to avenge their defeat at the hands of the Dutch, they sought the assistance of the French
against the VOC. These were times of great turmoil in the world. In America there began
a colonial revolt against the British, which led to the declaration of independence of July
1766. The French role in this episode is possibly a part of a master plan to displace the
British Empire from the lucrative Asian region.
Trincomalee was no longer available to the British as in the past, and the possibility of
France upstaging them in the waters of the Indian Oceans was not lost upon them. The
British therefore seized the port from the Dutch in 1781 but subsequently lost it to the
French in 1782. This was a great blow to British prestige in the war that lasted until 1793.
A consequence of the French Revolution was the defection of the Dutch Stadholder to
Britain. The French occupation of Dutch Territory resulted in the famous “Kew Letter” in
which the Dutch Stadholder agreed to cede all forts under their command to the British –
until Dutch independence was regained from the French.
When the French were finally defeated by the British in the waters of the Indian Ocean,
the British then sought enactment of the terms of the “Kew Letter” by the use of force if
necessary. However, the Dutch showed only token resistance. The kandyans were once
again inveigled into accepting a treaty with the British, precipitated by their own desire
and policy, of seeking foreign assistance to oust an already established power.
Nonetheless, the position now was that their new ally was much more powerful and
potentially more dangerous to them than either the Portuguese or the Dutch.
EARLY BRITISH OCCUPATION
The coastal provinces of Sri Lanka that fell into the hands of the English were proclaimed
English territory in 1796. The administration of the colony was jointly with the English
East India Company, who took over the cinnamon trade by a payment of Sterling Pounds
60,000 to the Crown.
The English East India Company began its administration following their usual practice
of allowing the laws, customs and institutions to continue in the former Dutch colony.
Except for officials who held very high positions, the services of others of the VOC who

10
chose to remain were all retained by the EEIC, in this period of uncertainty as regards the
restoration of Dutch rule in Ceylon. There was also disagreement on policy matters with
the Company Presidency in Madras, which eventually led to the vesting of Sri Lanka
(Ceylon) as a British crown colony in 1802.
The policy of the English in the brief interim of uncertainty was to woo the native
population and ingratiate themselves with them. They did so by rescinding Dutch taboos
on Roman Catholic worship and restrictions on Muslims in matters of trade.
The full extent of the reforms of 1796 introduced by Andrews unfortunately resulted in
wide spread opposition and rebellion, which was quelled finally by a withdrawal of the
reforms. Thereby, ‘Rajakariya’ and ‘Uliyam’ were reintroduced. The caste system was
craftily maintained and manipulated to their advantage. Nevertheless under this system
the highest posts were restricted to persons of the highest caste – in this case, the
Goigama (Sinhalese) and Vellala (Tamil) castes. The many administrative ‘faux pas’
made by the East India Company and the frequent disagreements between the Presidency
in Madras and the Governor in Sri Lanka (Ceylon) also caused unnecessary unrest in the
country, all which alarmed Whitehall.
When the former Dutch possessions in Sri Lanka were formally ceded to the British at the
‘Peace of Amens’ in March 1802, Sri Lanka (Ceylon) had already been declared a crown
colony (Jan 1802) with Hon. Frederick North as its first Governor. The English East India
Company were relieved of their political power by Whitehall, but they were allowed to
retain their monopoly on trade and they wielded a strong influence in shaping the
colony’s economy.
In the early years succeeding the formal British acquisition of the Sri Lanka littoral the
East India Company actually determined the economic policy and production. They were
in total control. Cinnamon was the king of commodities and revenue from this source was
the mainstay of colonial finances. The vast profit made by the English East India
Company was no secret and led, finally, to cinnamon export coming directly under
government control.
In 1815, the English finally captured Kandy through a conspiracy with Kandyan chiefs
disenchanted with the king, notable among whom was Ehelapola whose family was
executed by the king, a ruthless despot. Kandy was formally ceded to the British with the
signing of the Kandyan Convention on March 2, 1815. This by no means gave the British
total command. It was only after the Great Rebellion of 1817 – 18 was broken that they
finally became masters of the whole of Sri Lanka. In these early stages of British
occupation they ran two separate administrative systems, one for the littoral and another
for the Kandyan high lands in acknowledgement of the fractious and volatile nature of the
Kandyans as compared with the lowland Sinhalese who seemed more complaisant.
Although the British ousted the Dutch in 1796, the areas of the country under the Dutch
were ceded to them only 1802. Kandy was still an independent kingdom and finally
captured by the British in 1815. A brief lull in hostilities preceded several uprisings and
revolts of the natives against their new rulers, which went on till 1848. However, except
for the revolt of 1817 – 18, the others were of lesser magnitude and did not disrupt the
steady formulation and implementation of British governance and policy.
The British also showed greater perspicacity and sagacity than either the Dutch or
Portuguese and acknowledged the fundamental importance of developing infra-structure.

11
Very quickly all possible energies and resources were deployed into construction of
roadways to link all cities, towns and villages. Military mobility was thus greatly
enhanced and travel and communication gave an added impetus to commerce.
THE BEGINNING OF THE PLANTATION ENTERPRISE
The glorious days of Cinnamon were drawing to a close. There was also less interest in
other spices and commodities such as chanks, pepper, cardamom, arecanut etc. Cinnamon
prices plummeted from a high of 9 s. 9 d to 1s. 3d. Foreigners sold out to locals who
rescued the trade, but it did not regain its premier status.
A new glamour crop had emerged. It was coffee. Coffee, which was introduced into the
island by the Arabs in early medieval times, survived as a garden crop, proliferated and
grew wild over most of the human inhabitations in the country. The renewed interest in
the crop led to more methodical cultivation of it and ere long, coffee displaced cinnamon
as the primary export. Not since the 1730s was there such a boom in coffee as in the
1830’s. Of course, in the eighteenth century, large-scale plantations were rare and the
production of coffee was more or less a cottage industry.
The pretty, white, heavily scented flower of the coffee tree was extensively used in
religious offerings and ceremonies, and temple lands usually had an abundance of coffee
growing wild in their extensive premises. Even though George Bird is generally
acknowledged as the father of the ‘plantation enterprise’ in Ceylon, the success of large-
scale coffee growing was largely due to the energetic, even aggressive initiative of Sir
Edward Barnes. He was a most picturesque character himself, who was obsessed with the
commercial exploitation of the crop. He granted George Bird, (brother of Col. H.C.
Byrde) 400 acres and a tax-free loan of 4000 Rix dollars with which to commence work
on the coffee project. Bird experimented in various locations and finally settled on the
slopes of the Sinhapitiya hill at Gampola. Here he, in his meticulous way evolved a
technique for jungle clearing and planting operations, and a style of management of
seasonal immigrant labour from South India, all of which was adopted later, as standard
procedure, by the Planting Community.
The British fell with a will to planting up virgin jungle land with coffee. Successful
coffee plantations were in operation by 1825 in the midlands of the country, especially
Kandy and the surrounding regions.
So successful was the coffee industry in Sri Lanka that by 1860, it had become the
world’s largest producer of coffee, but this happy situation was not to last for very long.
In 1868, coffee export reached its zenith, but the euphoria of the coffee planting fraternity
was effectively destroyed by the arrival of Haemelia Vastatrix in 1869. Haemelia
Vastatrix, or coffee rust, as the fungus is commonly known, proved to be so deadly that in
two short decades, it had wiped out almost 250,000 acres of coffee.
The land area under coffee cultivation was about 334,686 acres according to British
governmental statistics of 1878. Crops had already exceeded 1,000,000 cwt and prices
had risen as high as 109s per cwt. However, the ravages of “Coffee Rust” proved lethal
and the decline of the industry was exacerbated by sharply falling prices in the wake of
global overproduction. By the year 1900, the statistics recorded only 11,392 acres under
coffee cultivation.

12
During the reign of coffee as the supreme crop, tea cultivation was insignificant, and it
was grown as an experimental or home garden crop, from 1839 onwards. It was also
found in the Peradeniya Botanical Gardens in Kandy.
In India, however, tea was by now, a thriving industry.
The beverage of tea was a gift to the world from China, several hundred years ago. Its
cultivation and processing was a well-guarded secret. If legend were to be given credence
here, tea was consumed in China as a beverage as far back as 2737 BC, during the reign
of Emperor Chen Nung. This is about parallel to the time that Noah was casting off in his
Ark of Biblical fame.
The British later discovered that tea grew in the wild, at elevations ranging from 2500 to
6000 feet, in the Northern Districts of India, running from Nepal, eastward along the lofty
escarpments bordering India and onward through Assam into the Chinese provinces of
Sechuan and Yunan where the best China tea was cultivated. The similarity of climate in
the Chinese and Indian districts where this tea grew, was quite striking.
Although this discovery was made as early as 1788, nothing much was done about it for
nearly half a century. When the East India Company’s monopoly of the tea trade was
abolished by parliament in 1833, the company turned its attention to India as a possible
tea producer to rival China. So it was in 1834 that Lord Bentinck set up a committee to
investigate the viability of commercial scale manufacture of tea in India.
Later, during the same year, G.J. Gordon, on the instructions of the committee proceeded
to China on a mission to purvey as much tea seed as possible and also purloin the closely
guarded secrets of tea manufacture (or processing). The wily Britisher was successful in
both and returned with a large quantity of China tea seed. However, it was
simultaneously found that the indigenous Assamese variety was superior in many ways to
the Chinese tea, but by then it was too late to halt the planting out of this Chinese seed.
Nevertheless Gordon’s trip to China was a resounding success in terms of the expertise
he returned with, in the form of tea cultivators and tea makers recruited from China. Tea
seeds of both Chinese and Assamese variety reached Sri Lanka in the succeeding years
but its commercial exploitation did not commence until 1867.
The first commercial plot of tea was planted in 1867, on Loolcondera estate, in the
Hewaheta mountain range, South of Kandy, by James Taylor. The writer has had the
good fortune to see this tea field himself about 20 years ago. From all accounts these tea
bushes are still alive and are regularly cultivated and harvested. This is immutable
testimony to the indestructibility of this exceedingly hardy perennial.
POLITICAL CHANGES
In order to better appreciate and understand the situation in the country vis-à-vis its
economy and political structure and governmental policy a brief look back to the early
days of colonisation and the activities of English East India Company is essential.
Although the political mandate of the English East India Company was withdrawn in
1802, they still retained a monopoly on trade that lasted over two decades. Their activities
ranged over the whole field of the island’s external commerce as Sri Lanka lay within the
area in which the company enjoyed charter privileges.
13
The free trade aspect of the country was slow to develop, being hampered by the lack of
capital and the English East India Company’s monopoly. It was only after Sir Edward
Barnes (Governor) withdrew government involvement in importation that free trade
slowly established itself.
In those early days the favoured position of the English East India Company resulted in
the continual agitation of the emerging business community in Sri Lanka, against it.
However, the influence of the English East India Company prevailed and it was only the
aspect of trade with the south East Asian Countries that were unaffected by the interests
of the English East India Company.
The British government was, at the time, far from being the proponent of liberalised trade
it pretended to be. It resisted both this indigenous and European spirit of individualism
and enterprise that was blossoming in the country in every venture save the export of
coffee.
There was also, in Whitehall, about this time, the thinking that Sri Lanka (Ceylon) should
not be modelled on the West Indian ‘plantation’ prototype. Europeans were prohibited
from owning lands outside the vicinity of the cities. Early governors adopted the view
that this new British outpost was a military station containing a commercial economy.
This created much ill feeling with the European residents in Sri Lanka who applied
sufficient pressure to have this law rescinded. Nevertheless, during this period, more
virgin land was acquired, by British military personnel, especially those who were posted
in the outstations, and paid scant regard to this edict.
During the stewardship of Thomas Maitland, governor, (1805 – 1811), the embargo on
ownership of land was withdrawn. This however did not signal the end of the
governments’ ambivalence in its economic policies.
Sri Lanka became an attractive proposition for investment and for settlement by
Europeans. Cinnamon was still the prized commodity but the English East India
Company had government-sponsored monopoly on this trade, and new investors turned
their attention to other crops. In a relatively short period, coffee emerged as the crop of
great promise.
As from 1812, ownership of land by Europeans was permitted and British subjects could
purchase or receive grants of land of up to 4000 acres in extent. Land auctions and sales
were regularly conducted and the going price of an acre of virgin jungle was only five
shillings! The succession of Sir Edward Barnes as governor in 1824 saw a surge of
activity in plantation enterprise. New government policy espoused the cause of the coffee
plantation entrepreneur. Investors in coffee were favoured with loans, waste land grants
and tax exemptions. Even the duty on coffee exports was abolished. The govt. itself
opened an experimental coffee plantation in Peradeniya (Kandy) adjacent to the botanical
garden. It is worthy of mention the Military, Clergy and Civil Service and in many an
instance, Governors themselves acquired large tracts of land for themselves by “Special
Preference”, most of it in the highlands of Kandy.
By and by, the success of coffee engendered more success and, as mentioned earlier, Sri
Lanka rose to the position of the world’s largest producer of coffee in the 1860’s.
Approximately 250,000 acres of land had come under coffee cultivation by this time,
excluding the existing “Garden Coffee” and indigenous small-holdings.

14
Earlier it was mentioned, that shortly after the coffee industry reached such supreme
heights in the 1860s, over production led to a fall in prices and ‘Coffee Rust’ proved far
too lethal, and snuffed out the life of a thriving industry in short order.
SOCIAL AND ECONOMIC CHANGES
The British unified the administration of the entire island in 1832, before which the two
tier system, one for the littoral and another for the Kandyan provinces, prevailed, since
the unification of rule in 1815. The Colebrook - Cameron reforms of 1832 provided the
framework for the unification of the island’s governance. The reforms provided
legislative and administrative framework including that of the judicial as well. The
success of the plantation agriculture provided a bulwark for the consolidation of this
unification.
These reforms were in many ways a radical departure from the existing administration.
They introduced a true “Laissez-faire” element, which was hitherto conspicuous by its
absence. The Cinnamon monopoly was abolished and private enterprise, encouraged. The
‘Rajakariya system’ of compulsory labour was also abolished. Education was given a
much-needed fillip.
Opportunity for economic advancement and education sparked social change in the 19th
century, but those who profited most were the upper castes, the social and administrative
hierarchy – the headmen belonging to the Goigama (farmer) caste. They also had
accumulated fortunes by manipulation of the compulsory labour system. In this new
environment of opportunity and enterprise, these headmen and their families were able to
consolidate their position in society.
The liberal attitude of the British towards Religion was a boon to Buddhism, which had
suffered under previous colonisations. Roman Catholicism also benefited from the
religious freedom and gradually, after the catholic emancipation act in Britain, recovered
from the near desperation in the Dutch era.
Be that as it may, the British Protestant missions were possessed of much greater vigour
than other Christian religions. The Protestant Missionary was therefore a very important
factor in the changing nature of the colony and was indeed an agent of change through
the impulsive evangelism of their ministers.
The Dutch, as well as the British Christian missions used the mission school system as a
tool for evangelism. The legacy of the Dutch in this regard was not allowed to deteriorate.
Governor North, Rev. James Cordinor and later governor Maitland were instrumental in
pressurizing the powers at White Hall into recognizing the necessity of the survival of the
parish schools, whose existence owed much to the missionary societies and also to Sir
Alexander Johnson, chief Justice of Ceylon at the time.
Succeeding Governors showed a disinclination to persevere with the parish schools
(governors Brownrigg and Barnes) but missionary zeal prevailed, and from their
experience emerged a system of denominational schools, which lasted for over a century.
The 1831 Colebrooke - Cameron reforms ensured that state intervention in education
gradually entered the islands administration

15
The Judicial Charter of 1801 established the Supreme Court and the English language
was the medium of law giving. This Anglicisation of the judicial process set in motion
two centuries ago, persists to this day!!
There were of course skirmishes of the governors with the judiciary and they were
resentful of the independence of the Supreme Court.
An important aspect of the British administrative policy was the europeanisation of the
higher echelons. This resulted in a heavy increase in administrative costs, which in turn
caused recurrent budget deficits. The upshot of all this was the creation of the Ceylon
Civil Service, an elite corps of highly paid covenanted officers. The next rungs of
bureaucracy were also manned by a host of British immigrants. The clerical services
went to Burghers and Eurasians, who embraced it as their traditional occupation.
Local village headmen lost their judicial powers and were paid a salary instead of
accomodessans (land grants)
The administrative process was continually refined and powers and functions crystallized.
The administration of the British was manifest at local level by the Collector. Each
province had a Collector who collected revenue through the village headmen. The
Collector held all administrative, revenue and fiscal powers of the provincial
administration. With the passage of time the British developed quite a comprehensive
administration of the colony of Sri Lanka (Ceylon).
1 A Commissioner of Revenue (installed by Governor Maitland) supervised the
Provincial Collectors.
2. A Cinnamon Department was created modelled on the “Mahabadda,” of old.
3. A Registrar General’s department looked to births, baptisms, marriages and
deaths.
4. There was also a Surveyor General’s Department combined with a Civil
Engineers Department.
5. A Registrar of Lands was also put in place.
6. The separate Kandyan administration was in 1932 finally abrogated except where
inheritance, caste marriage, land tenure, and personal services were concerned.
In contrast, the Portuguese and Dutch had occupied only the maritime provinces of Sri
Lanka. Their administration did not greatly affect the Kandyan regions that were still
under the Kandyan Monarchy. The Portuguese were bent on proselytism and the Dutch,
on commerce. The Dutch, who used the cinnamon Peeler caste or ‘Salagama’ for this
purpose, exploited the Cinnamon trade. Barter was the main instrument of trade and
compulsory service. (Rajakariya) was used to liquidate other debts, such as land tenure.
The Sinhalese were traditionally farmers, and trade was in the hands of the moors, other
itinerant traders, and some of the Ceylon Tamils.
The Urbanisation was concentrated in and around the Dutch Forts in Colombo, Galle,
Jaffna, Matara etc.

16
The Dutch administration had extracted taxes in the form of Rajakariya and had revived
the Portuguese ‘Thombo’ or registration of individual dues to the state.
The Dutch had introduced private ownership of land via the Roman Dutch law, which
persists in the present day.
Roman Catholicism was banned and so also was Hinduism and Islam in the cities.
Muslims were debarred from the lucrative appointments as renters of land.
Dutch preoccupation with Cinnamon extraction made heavy demands on the cinnamon
peeler caste (Salagama) and later led to their favoured status during their regime, which
in turn provoked rivalry with the higher castes.
To cap it all, the VOC’s administration was inefficient and expensive due to the high
degree of corruption in its officials, which eventually led to the strengthening of the local
Headmen’s influence and the increasing of their wealth.
The Dutch legacy was, in addition to the Mission School System, their Roman Dutch
Law, Dutch Architecture, Dutch Forts and the famous Dutch transport canals in the West
of the Island
It was The British administration of the colony of Ceylon (Sri Lanka) that made a truly
lasting impression.
01. In 1801 a supreme court of Judicature and a court of appeal were set up by the
Special Judicial Charter.
02. A nascent legislative authority could be perceived in the advisory council of 1802.
03 The use of English in the courts was also established.
04. Europeanisation of the Higher Bureaucracy was a conspicuous feature of their
administration – leading to elitism – viz; The Ceylon Civil Service - the highest
paid officers in the British Empire outside of India.
05. Although prohibited, they engaged in plantation and other commerce.
06. In 1815 with the capture of Kandy, the British unified rule in the country for the
first time since the time of King Parakramabahu VI in the 15th century AD.
07. They introduced the Provincial collector, begun with revenue in mind, but
evolving into a decentralized administration over all departments (except the
military) and responsible to the commissioner of revenue under the Governor.
08. Religious tolerance permitted freedom of worship.
09. A comprehensive administration, on the lines of the Indian Model was set in
place.
10. Roads and Railways proliferated
11. The Colebrooke-Cameron reforms of 1832 took on substance.

17
a. The new legislative council was formed
b. Provincial boundaries were redrawn and 5 new provinces were created.
c. The separate Kandyan administration was abrogated.
d. An Education Policy was implemented
This new administration and new economy not only caused the dichotomy of society in
the plantation districts, but also led to the polarization of the peoples in the other areas.
The new occupation also influenced the emerging social order. The high caste Goigama
had consolidated their position at the top of the social pyramid with the Karawes coming
in next.
The English Language created a further rift in the indigenous peoples, especially the rural
population who had no access to the missionary schools
18
PART TWO

19
THE BIRTH OF THE TEA ENTERPRISE
The first signs of the coffee rust were observed in 1869, by which time James Taylor’s
first commercial plot of tea was already in existence. James Taylor is acknowledged as
the father of the Tea Industry in Ceylon (Sri Lanka now) and it is only fitting that he is
given due recognition in this study.
He was born in 1835 in a cottage, “Moss Park” in Monboddo Estate near Laurence Kirk
in Kincardineshire in Scotland. He came to Ceylon in 1852 along with the Blacklaws and
was initially cared for by the Mackwood Family, who were already firmly established in
this colonial outpost. Plantation colossus, R. B. Tytler, who maintained a close liaison
with the Laurence Kirk Parish in Scotland, was instrumental in bringing Young Taylor to
Ceylon, as well scores of other Scottish immigrants of “good stock” who were
traditionally in the farming business.
Taylor worked as a planter, first on Naranghena Estate and very shortly moved to Waloya
Division of Loolecondera estate, Hewaheta, a new coffee estate owned by J.J. McKenzie.
Although ownership of the estate changed hands, (Anglo Ceylon and General Estates Co)
he remained on it until his death in 1892.
He was reclusive by nature and rough hewn, gauche and uncomfortable in the company
of the opposite sex and died a bachelor. Nevertheless his contribution to the development
of the Tea Industry is almost without parallel. A workaholic with an enquiring scientific
mind he wrote and published results of his work and experiments in the journals of those
pioneer days. Legend also has it that he was the biggest and strongest man in the land at
the time and one whose brain was not second to his brawn. It took a dozen men two days
to carry his body down to the Kandy (Maiyawa) cemetery for burial.
Although Taylor is credited as the father of the tea industry, it is a little known fact that it
was H. K. Thwaites, the curator of the Kandy (Peradeniya) Botanical Gardens, who gave
him the first tea seeds of the Assam variety and encouraged him to plant them.
Unfortunately his place in the sun has been overshadowed by succeeding events.
In 1872 the first break of Ceylon tea was exported. It consisted of 2 small packs
containing 23 lbs of tea from Loolecondera estate and was sold for Rs. 58.00 (valued at
3.s. 9.d., per lb)
New coffee plantations continued to develop even in the 1880’s in certain districts, but
the inexorable advance of the coffee rust sent alarm bells ringing in the minds of the more
perspicacious planters who then turned to tea as a replacement crop.
With typical vigour these planters soon had tea plantations going where the coffee had
been. Although there was an initial lack of expertise in this new crop, the vast experience
gained by their Indian counterparts was freely given to the Ceylon tea planters, who
proved apt students.
The results achieved by these first tea estates did not pass unnoticed, and the
transformation of coffee plantations into tea gained momentum.
THE DEVELOPMENT OF THE TEA INDUSTRY & ATTENDANT SOCIO-
ECONOMIC CHANGES

20
In the 1880’s and 1890’s more land came under tea than any period thereafter. The
tremendous increase in crop production placed a great burden on the processing facilities,
which were struggling to cope with the high intakes of green leaf. It was clearly evident
that the present largely manual manufacturing process was most inadequate, and that an
efficient mechanised process was necessary.
The first Tea House or factory was built in 1873 by James Taylor, bolstered by the
success of his initial experimentation with converting green leaf in to black tea. It was of
wattle and daub and had hessian lofts in which to wither the leaf. He invented a tea leaf
roller, which was he powered by a 20ft. water wheel, as he realized that manual rolling
was not only inefficient, but also expensive.
The demand for mechanisation created by the burgeoning tea production was a golden
opportunity for enterprising inventors and engineers. In a relatively short time clever
machines that mimicked manual operations, albeit at much higher speed and efficiency
were invented and became mandatory in a tea factory.
Thus a new ancillary industry, for producing tea-processing machinery, was born.
The first successful tea-rolling machine was invented by the Walker brothers in 1880, and
manufactured by their firm, John Walker & Co.
In 1884, John Walker helped build the first central tea factory in Fairyland estate (Mount
Pedro). The factory belonged to J. A. Rossiter who opened up tea estates in the foothills
of mount Pedro.
In 1893, the first tea auction in Sri Lanka was held by Somerville and Co, when the
annual production had reached 2,000,000. lbs.
1894 also saw the formation of the Colombo Tea Traders Association
Around the same time, Wharran Megginson of Carolina Plantation, in the Watawala area,
also commissioned Walker to build what was to become the proptotype factory of the
time. It was 100 feet long and 42 feet high and had 3 floors. It cost Rs. 35,000, a
substantial amount in those days. Power was by steam generated by firewood. The
design stood the test of time and was little changed over the next half century
John Brown was another canny British inventor and entrepreneur whose Triple Action
Roller eclipsed the Walker Economic Roller. Brown went on to found The Colombo
Commercial Co. that has survived to the present day.
This new ancillary engineering industry however, was concentrated in the hands of
British firms and helped further consolidate British influence in this colonial outpost.
In the years 1883 to 1889, the export of Ceylon tea grew from 1,000,000 pounds to
28,500,000 pounds. Indian exports too had shot up from 58,000,000 lbs to 96,000,000
lbs. The production of tea outstripped that of all other crops and the value of tea exported
was far greater than that of any other crop. In 1900 tea accounted for Rs. 53.7 million
while coconut contributed 16.3 million of a total export earning of Rs. 90.8 million.
The Chinese found it impossible to compete with the efficient British enterprise. Theirs
was one of smallholdings, making tea the traditional way. These archaic methods,

21
coupled with bad agricultural practices led to the decline of Chinese tea. Chinese exports
that were as much as 111,780,000 lb in 1883 dwindled to 61,000,000 lb by 1889. Chinese
tea lost its dominance in the major world markets. Indian and Ceylon teas virtually wiped
out China tea in the succeeding decades and with the passage of time Ceylon Tea
emerged as the prized beverage of the day.
Ceylon became synonymous with good tea and Ceylon rose to prominence in the world at
large as the producer of superior quality tea.
Tea was the major export of the country and accounted for the greater part of its foreign
exchange earnings. Rubber, Coconut, cocoa and other crops taken together could not
match the income generated by tea.
The bustling activity of the British Planter wrought several changes in Sri Lanka, Some
of it good, and some not. Be that as it may, these changes must be viewed against the
larger backdrop of history and not taken in isolation.
Prior to European occupation, Sri Lanka was a hydraulic society with entrenched
monarchical governance, which could be ruthless and absolutely autocratic. The elite
were the scholars and monks, the warriors and the hierarchy of chieftains and petty
chiefs, who dominated the commoner and overlooked the collection of dues and
enforcement of Compulsory Service to the king. The material benefits of an advanced
culture and civilization did not trickle down in any appreciable way to the common folk.
For example, permanent dwellings were the privilege of the exalted ranks and the rest
were consigned to live in semi permanent dwellings.
Urban and rural populations were as yet concentrated in the traditionally occupied areas,
with the vast hill country virtually devoid of human habitation. The large-scale opening
up of estates in the uplands required massive inputs in logistical support and
infrastructure.
The arrival of such a large immigrant labour force in the country, especially the
highlands, made great demands on several supply centres. Food, housing, clothing and
other necessities and even luxury items were required to satisfy the needs of this surging
population.
The extensive road network and the new railroad system built by the British rendered
passage and transport easy. The agrarian style economy of the country and the traditional
feudal system of land tenure and tenancy, subsistence farming and slash and burn
cultivation were gradually usurped by the new wave of industry and commerce, as well as
the new British legislation.
The production and export of tea (and earlier, coffee) in itself necessitated several
ancillary support services such as packaging, transport, warehousing facilities, seaports,
vessels – and - as always - labour and more labour. An extensive administration was also
necessary in order to coordinate sale of produce. This resulted in the emergence of
Agency Houses, Brokerage Houses, Buying Offices, Planters Associations and a
Chamber of commerce. Consequentially, there also arose Employers Federations and
Trade Unions.
The prosperity generated by the success of the Tea Industry meant an unfettered and
liberal import policy of the government. Businesses sprang up in the metropolis of

22
Colombo and also in Kandy. The Kandyans who had looked askance at the feverish
British economic activity, in surly suspicion, slowly changed their attitudes and fell in
with this new approach to commerce when they discovered that their lowland
counterparts had much earlier embraced this British philosophy of industry. There were
several wealthy estate owners among littoral Sinhalese, by the time the Kandyans decided
to follow suit.
British influence was now changing the face of the country. Although Government
policy was slanted towards their own subjects, (naturally) the peaceful environment
required by the British in which they could ply their trades profitably, meant addressing
the new issues which were brought about by the British occupation in general.
The denudation of the highlands did not seem to bother the British unduly, although even
in those times, the Sinhalese Monarchy had recognised the importance of the luxuriant
forest cover and had declared all highland rain forests as strict natural reserves.
Several important waterways originated in these Central Mountains and the country
whose economy was agrarian based depended on their bounty. The British were either
ignorant or oblivious as to these considerations in their haste to make hay while the sun
shone. The reprehensible Waste Lands Act of 1824, allowed the purchase of vast tracts
of Virgin Forest Lands by British subjects and their local lackeys at the give away price
of 5 shillings per acre!
Whilst it is true that the tea industry rose from the ashes of that of coffee, there was little
similarity between the two. Coffee was basically a seasonal crop, which required far less
input in terms of materials and manpower, than did tea. In the heyday of the coffee
industry, the labour requirement was obtained from South India. The harvesting period
was from November to April and this resulted in a seasonal influx of immigrant workers
from South India who would make the long trek back and forth each year, to work the
coffee plantations in Ceylon. Having said that, it must be mentioned that in the latter
boom years, the demand for more permanent labour by the Coffee Industry, resulted in a
resident immigrant Tamil population of about 100,000, in the central hill country.
Only a small resident labour force was necessary in order to maintain the plantations
during the rest of the year, and each estate or plantation had its complement of resident
labour.
With tea, the situation was very different. By the turn of the 19th century about 380
thousand acres had come under tea, an extent far greater than was in coffee ever. Tea was
not only a labour intensive crop, it was also perennially in production. Harvesting
continued right throughout the year, with seasonal fluctuations in intake patterns. These
factors demanded a much higher labour input than in the case of coffee, which meant the
recruitment of more and more immigrant labour from South India.
With the dawn of the twentieth century, Cocoa and Rubber estates were also being
opened up in the lower elevations (below 2000’). Several thousands of Indian Tamils
found employment in these estates as well. It had been estimated that there were over
500,000 Indian Tamils employed on British owned estates in Sri Lanka in the year 1900.
It had been suggested that the immigrant population enjoyed a more contented living than
their earlier hardship-filled existence in their native country. Whilst this averment will be
discussed at greater length subsequently, it goes without saying that the plantations could

23
not have succeeded without the immigrant Tamil labour, since as mentioned earlier, the
indigenous population were generally averse to plantation work which they considered
menial.
THE RECRUITMENT OF INDIAN LABOUR
With the influx of the South Indian immigrant labour, the British dependence on
indigenous labour was reduced to a minimum. Thus, in the uplands, the indigenous
population, which was scattered over the land in their traditional archetypal village
existence, became distanced from the mainstream of economic activity and their place in
the new established order of things looked more tenuous than ever. Gradually, their
religion and culture and traditional methods of farming and cultivation began to wither in
the face of this new establishment and this new economy.
The British community in Sri Lanka gradually settled into their new existence in the new
colony and quite naturally, with the passage of time, a sub culture emerged and spread
across the land – the culture (referred to in derogatory terms) of the Pukka Sahib. This
emerging culture had its origins in the Indian Sub Continent, where Tea was a thriving
industry
While most of these Britishers, had probably led quite pedestrian lives back home, they
lived lives of undreamed of grandeur in Ceylon. Each Plantation was an enclave in it self
with its own separate set of rules, within the general frame work of the law at the time.
There indeed were rules and customs peculiar to each property, instituted at the whim and
fancy of the landowner, the British Planter. The Tamil labour on these estates were
treated little better than slaves, and they lived in the most abominable of conditions, in
their barrack type “Line Room” accommodation. Vestiges of the subservience instilled in
them by the British linger to this day, and “Master Suh” can still be heard in some of the
up country plantations.
The British way of life took root in the hills (as well as elsewhere) and even the local
gentry began to emulate these British. The typical British sports, Cricket and Soccer,
Horse Racing and Polo, Golf and Croquet, Shooting and Fishing spread like a rash across
the country. Gentlemen Planters lost no time in establishing that peculiar British
Institution, the Club, in every sub-district of the Up Country. There were gun clubs,
tennis clubs, cricket clubs and golf clubs, men only clubs, turf clubs and even a fishing
club.
The well-being and prosperity enjoyed by the expatriate British Community was
extracted at a price – a price that was paid for by the indigenous population in more ways
than one.
Over a million acres of virgin rain forest cover had fallen to the rapacious axe of the
British and was replaced with (coffee) tea & rubber plantations. Many highland
watersheds were destroyed forever, and spelled disaster for Kandyan peasantry. Soil
erosion was of mind-boggling proportions, and ruined subsistence farmlands and rice
paddies.
The inexorable encroachment into the pristine rain forest canopy was catastrophic, and
would result in micro climatic changes. Rainfall declined noticeably. The relentless
denudation of the forests also disturbed ecological equilibrium for the worse. Pests and
diseases would surface and cause severe depredations in flora and fauna alike.

24
The firmly established Tea Plantation Industry being labour intensive in nature demanded
an ever-increasing resident labour population.
In 1827 the Indian Tamil population was only about 10,000 out of a total population of
1,000,000. By 1850 this figure had risen to about 40,000 of an estimated population of
1,700,000.
Europeans 500
Plantation enclaves 40,000
Urban enclaves 59,500
Village population 1,600,000
Total 1,700,000
In 1871 the demographic distribution in the Plantation areas is given below:
Total Population No. of estates Estate Population
Kandy District 258,432 625 81,476
Badulla District 129,000 130 15,555
Matale District 71,724 111 13,052
Kegalle District 105,287 40 3,790
Sabaragamuwa 92,277 37 3,227
Nuwara Eliya 36,184 21 308
Kurunegala 207,885 21 2,393
Matara 143,379 11 1,072
Total 1,044,168 996 123,654
The total population in the country according to the census of 1871 was 2,584,780.
Proportions of above census
Sinhalese 69%
Tamils 22% -- Plantation Tamils as well as Ceylon Tamils
Muslims 6.7%
Burghers 24%
Europeans & others 2.16%
The plantation Tamil population (South Indian Origin) at this point had risen to 123,654.
The earlier seasonal migration pattern began to change with the demand for more and
more resident labour. The Indian immigrant workers formed a segment of the general
movements of Indians across the seas to man the plantations of this Second British
Empire. It differed from that of other plantation colonies, being seasonal. This seasonal
requirement of labour suited the migrant work force, which was able to return to their
homeland in time for their next harvest.
Agitation from tea plantation owners for more labour resulted in state sponsored and state
subsidized immigration on the model of Mauritius and the West Indies.

25
The Government left the actual indenturing of labour to the planters, and they in turn
gave over the business to private recruiting agents. This system of recruitments was not
only insufficient but also resulted in a high fatality rate. This was largely due to the
rigours of the journey through the barren inhospitable reaches of the Northern Province
trekking through swampy malaria infested jungles and on to the heavy rain forests
infested with a plethora of wild animals. The journey took about 2 weeks, and amenities
along the way were inadequate and this posed more risks to the immigrant worker.
Fatality reached an alarming 40%, which finally prompted the Government to implement
measures to ameliorate the hardships of the journey.
When the 19th century was drawing to a close, immigration from India, propelled by
demand in the tea industry, was significantly more than emigration of repatriating
workers. Health ordinances such as quarantine were now established and ensured a more
disease free complement of immigrant labour. Several rest houses and wells now
punctuated the overland journey of the immigrant, reducing the incidence of fatalities and
illness.
The recruiting agent (Head Kangany) was an important integer in the plantation enclave.
He was solely responsible to the management for the supply of daily labour and also for
peaceful relations between management and labour .The Head Kangany was also a
paternal figurehead for the resident labour on an estate. The management in turn
remunerated the Head Kangany in proportion to the labour supplied, on an agreed rate per
head. This was referred to as “Head Pence.”
Whilst the Head Kangany lived in relative luxury, the labourers themselves were herded
in barracks of 10’ x 12’ rooms, one per family. Normally 2 or 3 workers would occupy a
“line room” but it was not unusual for a family of six to inhabit and cohabit in these
meagre quarters.
Abysmal living conditions – sans basic sanitary facilities and even running water
extracted a heavy toll of these plantation resident labourers. Mortality was high and life
expectancy low. Wages were extremely low, and stood at cents 40 per day for males and
cents 34 for females. An objective assessment indicates that conditions were little better
than slavery.
The inadequate income also effectively fettered these workers to their respective
plantations and also to the local moneylenders.
Moneylenders were invariably of the Moor and Muslim communities, who gravitated to
the hill country from the littoral, to take advantage of the new business opportunities.
Ceylon Tamils (as well as a few low country Sinhalese) who were generally engaged in
trading, opened shops in the various bazaars that sprang up to serve the needs of the
inhabitants among the various clusters of estates.
Thus the upcountry or ‘Kandyan’ Sinhalese native of the country was excluded from this
environment and was not a part of this new and prosperous tea plantation economy. In
point of fact, estates were generally out of bounds for the Kandyan who could venture
within, only with the consent of the colonial plantation master.
26
This dichotomy of the population, was intensified by the colonials who not only gobbled
up the land available under the horrendous waste-lands act of 1824, but also began
encroaching on patrimonial and traditional communal lands.
As a consequence of such impositions, the Kandyans, who refused to subscribe to Anglo
Saxon discipline and routine, found themselves sidelined from mainstream activities and
cheated of traditional lands, while erosion due to denudation of the rain forest canopy,
limited subsistence agriculture.
As for the littoral population the situation was vastly different. Though Sinhalese in the
main, the sustained occupation of the country by invading foreigners, and traders from
alien lands had vastly diluted their ethnic origins, and also established several ‘minority’
communities all over the littoral.
For example:
1 Low country Sinhalese
2 Ceylon Tamils
3 Burghers
4 Eurasians
5 Muslims
6 Malays
In the upcountry there were the Kandyan Sinhala and the Indian Tamils, and the
sprinkling of British planters and polyglot traders.
The low country Sinhalese, who having had to live ‘cheek by jowl’ as it were, with
various foreign colonialists and itinerant traders, over the centuries, acquired a great
resilience and adaptability to the changing environment. Being also more venal and
opportunistic than their upcountry counterparts, they took advantage of the opportunities
for advancement. The high proportion of Christians among them was also an important
factor in their upward mobility.
The British proved to be better rulers than either the Portuguese or Dutch, and
appreciated that a peaceful environment had to go hand in hand with infrastructure
development that was necessary for the success of commercial agriculture. Road and Rail
penetrated the heartland of the country providing an excellent network of transport.
Telegraphic (and later telephonic) communication provided an important adjunct to
business and leisure needs.
Their rule was not without incident nevertheless, and they had to quell at least 3 major
rebellions. The first in 1797 was due to the British administration’s attempts to change
existing customs and regulations such as compulsory service, (Rajakariya), and residence
taxes on Muslims and Chettties, (Uliyam), and capitation taxes on slave castes in Jaffna.
The capitulation of Kandy to the British in 1815 was succeeded by the rebellion of 1817
– 1818, when the Kandyans awoke to the unpalatable reality of British rule. This is
despite the two-tier administration adopted by the British, in deference to the traditions of
the Kandyan provinces. The rebellion was finally crushed when crack regiments from
India entered the fray. It was the most formidable uprising against the British.
The rebellion of 1848 was centered in Colombo and the Kandyan provinces of Matale
and Kurunegala. The fervid plantation activity aided and abetted by partisan British

27
legislature resulted in a veritable closure movement, causing disintegration of peasant
economy and landlessness among the peasantry. Broadly, the juxtaposition of the
commercial economy of the plantations with the traditional subsistence, or peasant
economy accelerated the breakdown of traditional society.
The malaise of the Kandyan region showed in the increase of crime and lawlessness,
which was spurred on by the influx of low country Sinhalese and Ceylon Tamils, who
came to exploit the pecuniary opportunities afforded by the new plantation economy.
British self-interest and neglect of peasant agriculture and infrastructure was as much to
blame for the Kandyan dilemma, as were the Kandyan village Headmen whose venality
was capitalized upon by the British. It was only with their connivance that the British
declared village lands crown property and sold them.
Despite a prolonged slump in the Tea trade, in the 1890s, the industry kept expanding and
the immigrant labour force swelled to satisfy the demand for more labour of a resident
nature. With the workers on the plantations now becoming permanent residents, rather
than migrant labour, a new element of plurality was introduced into the country’s multi
ethnic populace, a situation that was to have profound consequences for the future.
The industry had come a long way since the first shipment of 23 lbs of tea in 1873 from
Loolecondera estate in James Taylor’s day. Coffee was now relegated to near obscurity
with only 11,932 acres in production in the year 1900, whereas there were 417,448 acres
in tea. The early elation in the fledgling Tea industry was dampened by the slump that
came about as a result of global over production. The industry was however, vibrant
enough to withstand this depression, which lasted until 1905. A crisis point was reached
in 1897, when new planting was completely halted. The depression was to have far
reaching consequences. In the early aftermath of the depression the industry began to
take on a more organized and professional semblance. It was an evolution of survival.
Most of the proprietary plantations could not hold their ground through these long and
difficult years and were either sold, amalgamated with other properties or assigned in
charge of Agency Houses.
The Tea Industry spurred immigration from the Malabar States (South Indian) and the
statistics for 1887 given below show the demographics of the time.
RETURN OF THE POPULATION OF CEYLON FOR THE YEAR 1887
English European Sinhalese Malabar Other Races Total
4,639 17,886 1,848,842 687,248 200,179 2,758,794
During these latter decades of the 19th century immigration increase could surpass natural
increase in the census polls.
Year Total Intercensus Natural Immigrant
Population Increase Increase Increase
1871 2,400,380 359,358 119,792 239,566
1881 2,759,738 248,051 144,260 103,791
1891 3,007,789 558,165 225,406 332,759
1901 3,565,954 540,396 356,147 184,249
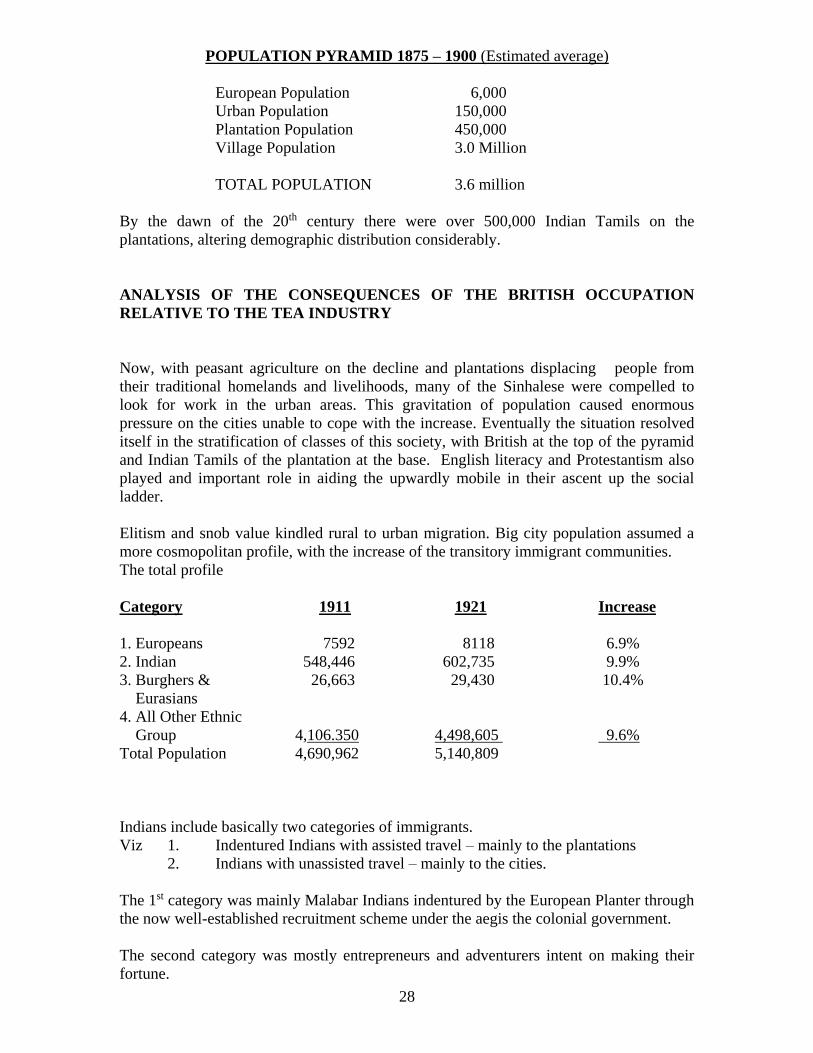
28
POPULATION PYRAMID 1875 – 1900 (Estimated average)
European Population 6,000
Urban Population 150,000
Plantation Population 450,000
Village Population 3.0 Million
TOTAL POPULATION 3.6 million
By the dawn of the 20th century there were over 500,000 Indian Tamils on the
plantations, altering demographic distribution considerably.
ANALYSIS OF THE CONSEQUENCES OF THE BRITISH OCCUPATION
RELATIVE TO THE TEA INDUSTRY
Now, with peasant agriculture on the decline and plantations displacing people from
their traditional homelands and livelihoods, many of the Sinhalese were compelled to
look for work in the urban areas. This gravitation of population caused enormous
pressure on the cities unable to cope with the increase. Eventually the situation resolved
itself in the stratification of classes of this society, with British at the top of the pyramid
and Indian Tamils of the plantation at the base. English literacy and Protestantism also
played and important role in aiding the upwardly mobile in their ascent up the social
ladder.
Elitism and snob value kindled rural to urban migration. Big city population assumed a
more cosmopolitan profile, with the increase of the transitory immigrant communities.
The total profile
Category 1911 1921 Increase
1. Europeans 7592 8118 6.9%
2. Indian 548,446 602,735 9.9%
3. Burghers & 26,663 29,430 10.4%
Eurasians
4. All Other Ethnic
Group 4,106.350 4,498,605 9.6%
Total Population 4,690,962 5,140,809
Indians include basically two categories of immigrants.
Viz 1. Indentured Indians with assisted travel – mainly to the plantations
2. Indians with unassisted travel – mainly to the cities.
The 1st category was mainly Malabar Indians indentured by the European Planter through
the now well-established recruitment scheme under the aegis the colonial government.
The second category was mostly entrepreneurs and adventurers intent on making their
fortune.

29
Urbanisation meant more conventional trade and encouraged shop keeping, which was
foreign to the indigenous Sinhalese.
On the other hand the British (dubbed a nation of shop keepers), exploited the upper end
of consumer needs, while from India arrived a hodge-podge of merchant tribes, such as
the Sindhi, Borah, Parsee, Chetty, Reddy and Afghan, among other North and South
Indian arrivals, to supply the various demands of these burgeoning urbanite populations.
In 1921, the population-density of Colombo was 1142 persons per square mile and those
of Kandy, Matale Galle and Kalutara increased to 450. Jaffna, which was detached from
plantation enterprise had a population density of 331 persons to the square mile.
Monetisation was now well established. British law and order governed a plural society.
The enlightened government of the British made concessions to the natives, and granted
redress for punitive colonial edicts of the past. Governmental paternalism was extended
through a host of civil servants in the various government services.
Through necessity and also by demand, the lower ranks of the civil service were filled
with Eurasians, Burghers, upwardly mobile Sinhalese and Ceylon Tamils. On the
plantations and in the plantation related businesses such as the agency houses and
engineering and supply firms too, Ceylonese found acceptance in the subordinate cadres.
This English speaking middle class, drawn from all local communities were not slow in
shedding their traditional customs, garb and even religion in favour of the glamorous
British dress and lifestyle. White Drill suits and pith helmets, top hats and tails and other
haberdashery were in. Other debatable accoutrements and appurtenances were also
embraced in shameless emulation. The ritual of Tea became a popular social grace. Tea
even became the refreshment drink of choice even in the working classes. Tea and Tea-
time became part of the new culture. Tiffin acquired glamour of its own. Scones,
crumpets, waffles, dainty sandwiches, pastries and cakes taken in the evening were
washed down with Ceylon Tea, religiously prepared and served in ornate china tea sets,
in the gracious living rooms of the wealthy, while plain tea was drunk off a cheap glass or
tin mug by the blue collar types, in their canteens.
A retinue of servants helped maintain genteel life in the British households as well as in
those of their local emulators. Even the most modest of aspiring households would have
at least one servitor to attend to the so-called menial tasks.
The employment of servants assumed great social significance and was a symbol of
success and social standing. On the other hand the dignity of labour received a mortal
blow and relegated blue-collar workers to the bottom of the social ladder thus retarding
the disintegration of the iniquitous caste system of social order.
The dependency on servants persists even to this day in the upper and middle classes,
though, interestingly, viewed as a luxury by their counterparts in other countries,
especially in the west.
Enlightened and paternalistic they may have been, but British supremacy in the island
was never in doubt. It was a long time before prejudice, bias and racism was openly
addressed.

30
The polarization of the country’s population seemed to have reached a culmination; the
urban/suburban sector, the estate enclaves and the rural villages.
The estate enclaves encompass tea, rubber, and now, coconut, but this study is primarily
concerned with the tea plantation scenario.
With the growth of urban population, services provided by the govt. increased in volume
creating more government jobs, much sought after and held in prestige by the native
population. In addition to the earlier mentioned services, there was now a government
railway, postal and clerical services and a civil medical department.
This department succeeded in controlling various epidemics including Cholera, Small
Pox, Bubonic Plague and Typhoid.
Life expectancy, which was 35 years, rose to 48 by the 1920s. Infant mortality was also
significantly reduced. The Department was indeed a boon to the country.
Education, that ‘sine qua non’ for upward mobility was concentrated in the cities, thus
excluding the vast majority of the rural population from benefiting from it. A command
of the English language ensured a high social standing in the community,
As mentioned earlier there was Western garb at one end and sarong and singlet at the
other end of the social spectrum. This caused an inferiority complex in the rural folk in
general which would give rise to more socio-political problems in the future.
The Kandyans who had at first looked askance at the activity of their low country
counterpart later looked with interest, into the economic and social activity that was
surely changing the face of the country. The Goigama caste which enjoyed positions of
importance began entering main-stream activities such as buying land and engaging in
plantation agriculture and related business fields.
The economy of the country has picked up by the end of the 1st quarter of the twentieth
century. There was over one million acres planted in tea rubber and coconut, of which tea
accounted for approximately half. (557,284 acres)
In 1890 Ceylon produced 34.1 million lb of tea and this rose to 240 million lbs by 1930.
Year 1890 Year 1933
India 96.5 million lbs India 359 million lbs
China 92.5 million lbs Ceylon 243 million lbs
Ceylon 34.1 million lbs Indonesia 158.7 million lbs
China 92 million lbs
Japan 18.1 million lbs
British Africa 1.9 million lbs
Indochina 1.2 million lbs
Export income hovered close to the Rs. 500,000,000 mark before the great depression of
1932, caused by over supply, which had a drastic impact on tea as well as rubber and

31
coconut. Tea export revenue plummeted below the Rs. 200,000,000 mark when, who but
the country’s former conquistadors, the Dutch, should come to the rescue, in a trade
agreement with the British, to curtail production levels of relevant commodities by 15
percent
It must be mentioned that during this watershed period of the early 20th century,
plantation enterprise accounted for about 90% of the export by way of commercial
agricultural products
Tea was always the major contributor with around 50% of these exports.
In 1915 tea accounted for 45% of the Islands exports
Acreage under Cultivation % of Export Trade
1. Tea 426,816 44.8%
2. Rubber 198,588 30.5%
3. Coconut 997,701 14.4%
4. Cocoa 41,538 1.1%
--------------------- --------
Total 1,664,643 acres 90.8%
== =========== =====
Tea survived the slump of the late 19th/ early 20th century by transforming from sole
proprietor ownership to company ownership and agency house management. The most
important of these agency houses and companies are worthy of mention.
1. George Steuart & Company - established in 1884
2. Whittall Boustead Company - established circa 1890
(Whittall amalgamated with Boustead & Company in 1957)
3. Consolidated Commercial Company - established circa 1885
4. Mackwood Company - established circa 1880
5. Carson Cumberbatch & Company - established circa 1885
6. Harrison Crossfield & Company - established circa 1895
Except in the case of George Steuart & company, agency houses not only managed other
tea companies and proprietary Holdings, but also estates of their won.
Other notable agency houses
Shaw Wallace & Hedges Ltd.,
Gordon Frazer & Company
Leechman & Company
James Finlay & Company
Agency houses were the intermediaries between the estates and the markets and became
part of a complicated chain of marketing, together with the produce brokers in the trade.
Some important tea companies of yesteryear
I. Over 10,000 acres each
1. Eastern Produce Estates Co (G. Nicholson, N.W. Grieve, R.A.
Cameron and David Reid)

32
2. Ceylon Tea Plantations Co (H.K. Rutherford, Reid, Talbot)
3. Anglo Ceylon and General Estates Co (Quintin Hogg)
4. Ceylon and Oriental Estate Co (H.A. Hancock, H.C. Smith)
II. Over 5000 acres
1. Caledonean Ceylon Tea Co (G.H.D. Elphinstone, James Ross)
2. Ceylon Land and Produce Co (James Wilson)
3. Ceylon Proprietary Tea Estates (R.A. Cameron Wiggin)
4. The Scottish Tea & Land Co. of Ceylon
III. Over 3000 acres
1. Central Province Ceylon Tea Co (Mackwood, Powell)
2. Carolina Tea Co (Hopkinson, C.A.W. Cameron)
3. Galaha Ceylon Tea Co (C.E.Strachan, W.L. Strachan)
4. Associated Tea Estate of Ceylon (Alexander Wilson)
IV. Over 1000 acres
1. Bandarapola Ceylon Co (Hugh Frazer, G.W. Paine)
2. Burnside Tea Co (G.A. Pilkington, G.W. Paine)
3. Kandapola Tea Co (R.A. Bosanquet, J.H. Alexander)
4. Poonagalle Tea Co (G.A. Pilkinton, G.A. Anderson)
5. Scottish Ceylon Tea Co H.L. Forbes, Donald Andrews)
6. Nuwara Eliya Tea Estates (C.A. Cameron, C.R. Robinson)
7. Lanka Plantations Co (Hendy Bois, George Allen)
Ceylon Tea first aroused interest in London in 1878, gaining ingress to the hallowed
Mincing Lane hub of the tea market, established earlier by the East India Co for the
distribution of China Tea.
The Low Country Products Association, formed in 1860, a bastion of the Sinhala Planters
gained strength with the passage of time and became a potent force to reckon with. They
clamoured for equal status and opportunity in the European dominated plantations.
In the early to mid 20th century there emerged new rivals to the LCPA in the form of
Indian and Muslim traders. They had accumulated fortunes by servicing the industry and
began buying the properties of departing British planters.
Finally, some of the more enterprising Kandyans too bought into the Tea plantations, in
and around the Kandyan province, where they had begun venturing into the tea industry,
with homestead plots and smallholdings.
In the early 20th century, area in tea had increased to around 498,000 acres (Blue Book
1916), coffee, down to 830 acres.
The other principal crops in the island had also extended their cultivation, viz;
Rubber - 380,000 acres
Coconut - 968,500 “
Paddy - 770,000 “
The tea industry, having now evolved into a highly organized thriving industry acquired
the appurtenances of a fully-fledged business. The planters association was already in

33
place and was a powerful lobby for the plantation industry. Plantation ownership had
layered into the Agency Houses and limited liability companies, private companies
(proprietorships) and smallholdings
The Tea Research Institute was founded in 1925. R.G. Coombe, a pre eminent planter
(Poonagalla estate) and Sir Edward Rosling of the Anglo Ceylon Tea Co are credited
with mooting this very important project, which became a widely acclaimed scientific
body, paving the way for the scientific approach to tea cultivation. The results, seen in the
tremendous increase in productivity spoke for the great contribution of this institute, to
the entire Tea Plantation enterprise.
In 1932, the Ceylon Tea Propaganda Board was established as a government sponsored
unit, to promote the cause of Ceylon tea. With the reins of British rule being slowly
slackened, Sri Lankans entered the political arena first, through the advisory council of
1802, which had evolved into the Legislative council in 1833. By the late 19th century it
had come to be regarded as a local parliament.
The Ceylon National Congress superseded a ‘toothless’ Ceylon National Association in
1916. A Ceylon Labour Association followed in 1922, and on its heels, in 1926, a Ceylon
Estate Labour Federation.
In 1928, the Donoughmore commission initiated constitutional reform and the conferring
of universal adult franchise. This caused destabilization of society due to the demarcation
of electorates impinging on plantation land and the denying of franchise to the Tamil
immigrant labour.
The Agency House style of management provided the incentive for planters to ascend the
rungs of this ‘Plantocracy.’ Diligent senior planters became directors of companies or
agency houses, or visiting agents who held sway over estate managers. This led to a
separation of estate level executives into a Ceylon Planters Society. There was also an
Estate Proprietors Association harking back to 1923. Then in 1939 The Ceylon Workers
Congress, was established by the astute Indian Tamil Proprietary Planter, S. Thondaman
Its formation owed much to the Ceylon Indian congress.
The unionisation of the of the working classes was not only a result of a harsh foreign
administration, but also a natural consequence of an enlightened indigenous population
voicing their demands, and the push pull effects of the administration which tended to
reflect the personal dogma of the governor at a given time.
The bulk of the estates came under Agency House management where meticulous and
exacting procedures were now well established.
British companies accounted for about 50% of tea estates while local companies and
smallholdings held the rest
The success of tea continued unabated despite the ripples of periodic price slumps. In
times of adversity, plantations overcame crises with various economies including
repatriation of workers to India. Such cavalier action contributed to labour unrest.
Labour militancy was gaining momentum, and also caused considerable losses of
production. Nevertheless, sound economic management prevailed over unpredictable

34
market situations. The increase in volume of tea resulted in the Colombo Auctions
processing a much greater quantity of tea than that of London.
The Tea Research Institute began experimenting with vegetative propagation of tea in
1938, and heralded a new era in the Tea Plantation Industry. While the success of the
industry was based on solid management and innovative marketing, the inculcation of the
scientific methods pioneered by the TRI gave that much needed boost to production. The
intensive monoculture of tea itself spawned severe depredations in the form of pests,
diseases, microclimatic changes, soil erosion, soil deficiencies, and diseases. The TRI
played a vital role in instilling a broader sense of awareness and appreciation of applied
science.
The cultivated acreage of tea reached about 560,000 acres, but uneconomical units were
abandoned or diversified and the acreage stabilized around 490,000 acres.
The process of Tea manufacture was also refined by the scientific approach. The
uniqueness of Ceylon Tea was emphasized in the various marketing campaign.
Tea estates were catergorised by their elevation
Estates below 2000’ amsl were Low Grown or Low Country
Estates above 2000’ and below 4000 amsl were ‘Mid Grown or Mid Country
Estates above 4000’ amsl were High Grown or Up Country.
The taste and aroma generating compounds of tea varied at these different elevations.
Generally, low country Teas were devoid of aromatic compounds and were described as
plain and/ or strong. Upcountry Teas had that special prized Ceylon flavour, a product of
the elevation and climate. Mid country Teas reflected an admixture of the former two –
again in general terms.
High grown tea was a truly fine, delectable beverage, which (undeservedly) encouraged a
superiority complex in the upcountry planter towards his low and or mid country
colleagues.
The quality of the finished tea depended on the proper harvesting. Since the tender shoots
contained more of the desirable compounds, it was essential that the harvesting was
restricted as far as possible to the apical bud and the first two or three leaves and the
harvesting intervals controlled to optimize this. The Tea manufacture process, i.e.
Plucking, withering, rolling, fermentation and firing was complemented by the grading
operation. The rolling process partly broke up the leaves by abrasion, and therefore the
fired product was not uniform but contained particles of different sizes and also fibre.
Suffice it to say that the grading process employed machinery of increasing sophistication
to grade the Tea according to particle size, and to extract fibre and mature stalk.
The normal grades are,
Main Grades Orange Pekoe – soft stem
Pekoe – leaf of shot like appearance
Broken Orange Pekoe – (BOP) broken leaf of good quality
Broken Orange pekoe Fannings – smaller type of the BOP
Dust No. 1

35
Inferior Grades Dust No. 2
Broken Pekoe
B.P. Fannings
There contain fibre and hard Stalk.
The best drinking quality Tea is the BOP, which mainly comprises the particles that
separate early in the manufacture process. BOP fannings come next. O.P and Pekoe are
light liquoring, large leaf teas preferred by certain countries such as from the Middle
East.
While the actual marketing process may be outside the scope of this study it must be
mentioned that the various preferences of the various markets were of great significance
in evolving marketing strategy.
FLOW CHART OF THE ORTHODOX TEA MANUFACTURING PROCESS.
Plucking (harvesting)
Withering (partial desiccation) 10-24 Hrs.
Rolling / Roll-breaking (maceration/separation)
1-3 Hrs.
Fermentation (oxidation)
20-25 Mts.
Firing (drying)
_______________________________________________________________________
Grading (sorting)
Storing/Packing No Critical Time Limit
In 1955, the first of the vegetative-propagated tea came into bearing. The new method of
contour planting (as apposed to row planting) ensured a higher stand of bushes per acre
and helped prevent soil erosion. The implication of the homogeneity of plants achieved
by this clonal (V.P.) propagation was not lost upon the planting community. Now it was
possible to develop tea plants to suit a gamut of needs, such as high yielding types,
quality manufacturing types, drought resistant types, borer resistant and root disease
resistant varieties and so on. With time the T.R.I. developed a portfolio of specialized tea
clones.
In 1958, the State entered the industry with the formation of the state plantations
corporation.

36
By 1961, Sri Lanka’s registered extent of tea lands once again exceeded 200,000 hectares
or 500,000 acres, and tea exports exceeded 2,000,000 metric tons (440,000,000 lb).
In 1963, the first-ever instant teas were produced and exported. This development
addressed a notable shortcoming in tea as compared with its rival coffee
Sri Lanka became the world’s largest tea exporter for the first time, (in 1965) surpassing
India. Further development in field techniques as well as that of the factory continued.
The National Yield approached the 1000 lb/acre mark, which was reflected in the
increase of gross production on a more or less static acreage. (See table Nos. 1 & 2)
New innovative machinery augmented the orthodox manufacturing process, and helped
produce better liquoring teas.
The withering process of the leaves (partial desiccating) was radically changed when
withering troughs replaced the traditional loft. Nearly 75% of the space in a tea factory
was occupied with leaf withering lofts. The new invention reduced the space requirement
of a factory by over 50%.
Rotorvanes now preceded the rollers in the rolling and separating operations and the all-
important tea drying machine or drier was now automatic. Still later the ‘Fluid Bed
Drier’ arrived, and superseded these automatic endless chain types.
In the grading room too, automation made its way in via conveyors, automatic stalk
extractors (as opposed to the manual, labour intensive method), density separators and
automatic bulking chambers. The traditional method of Black Tea Manufacture continued
to refine and develop and was known as Orthodox Manufacture in the argot of the tea
trade. In the 1980’s a new process of Black Tea Manufacture, which had received wide
acceptance in India and Kenya, was experimented with this was the CTC type of
manufacture where the early stages or orthodox manufacture are replaced by a “Cutting
Tearing and curling” process. This did not prove very popular and accounts for only
about 7% of national production. (See Table No. 3) Green Teas (unoxidised or
unfermented teas) were of relative unimportance as can be seen.
(See Table No. 4)
Instant Tea is slowly making headway along with other valued added tea exports.
(See table No.5)
It is recalled that the exodus of the proprietary British planter ended in the aftermath of
the great depression of 1933, leaving a new style company management under the
umbrella of agency houses, to run the tea estates. The new management proved very
successful. Besides, they now began assimilating a considerable proportion of the
indigenous groups, such as the Eurasians, Burghers and upper caste Kandyan and Low
Country Sinhalese. The new entrants who were from ‘Public School’ type background
fell in with the British ethos, like the proverbial duck taking to water. However, in
general the recruitment of Tamils to managerial positions at this point of time was
regarded as untenable probably due to the predominantly Tamil resident estate labour.
The British approach to the appropriation of profits differed as compared with that of the
earlier conquistadors who never really governed a unified (Ceylon) Sri Lanka. In the
interests of objectivity, it must be recalled that in the latter stages of the British

37
occupation they did practice a degree of enlightened governance, introduce the rudiments
of self-determination and loosen the reins of power.
The Portuguese, as noted earlier were more preoccupied with proselytism than trading
which the Dutch pursued avidly. Whilst the Dutch cashed in on Cinnamon, they were
only exploiting a natural resource. They left their mark mainly in the littoral.
The British, on the contrary, quite remarkably, were able to unify rule of the Island after
the capture of the Kandyan Kingdom, for only the third time in the millennium. They
introduced large-scale commercial agriculture in the form of Coffee and later, Tea
plantations. In the process of engaging in this agricultural enterprise, several factors
came into play, which no doubt, altered the course of history. This study has earlier
detailed the activities of the British, vis-a-vis their agricultural enterprise culminating in
the Tea phase.
If one were to make a broad review of the Tea Industry begun by the British over 125
years ago, the first impression is that it is the best thing that ever happened to Sri Lanka.
Today, the single largest contributor to the GNP is Tea. What has to be ascertained is
whether the prize beverage is worth the cost.
When Tea took over from Coffee as the main agricultural crop, it did so primarily from
the lands of the erstwhile Coffee plantations. Therefore in this regard much of the felling
of forests had been done earlier. Still about 250,000 acres of forest were later cleared to
make way for tea. It was seen that ecological or social considerations were not on the
British agenda in regard to expansion of plantation activity. Heavy soil erosion, damage
to indigenous agriculture, and traditional subsistence farming and even micro climatic
changes were wrought by unbridled expansion. Of course, some of the negative aspects
of Tea Plantation Agriculture could be ascribed to a learning process.
The heinous Waste Lands Act of 1824 resulted in virtual denudation of the Kandyan
District. Outright grants and sale of traditionally held village communal forests caused
severe hardship to the Kandyan population. The introduction of Indian Immigrant
Labour further sidelined the native Kandyan from mainstream activities – especially in
the early years of the industry. The imported Tamil labour also introduced a new
dimension in ethnic plurality to the country that was to have far reaching effects.
In the early 20th century, Governance had evolved from being Governor and Civil Servant
oriented to one where planters held sway, and this paved the way to planter and
communal representation. This later took on a territorial aspect with the course of time, in
the post WW1 era. In 1948 Sri Lanka gained independence and government changed
from State Council to Parliamentary Democracy. The more liberal and enlightened rule
of the British in the latter years saw a trickle down effect of the economy to a segment of
the indigenous population. The British also encouraged education, but this did not
percolate down in a meaningful way to the tea plantations and outlying rural areas. The
inequitable distribution of wealth and opportunities for upward social mobility would
cause discontent and agitation in a multi ethnic demographic mix. The British
administration, though by far the best of the three occupying powers in the recent history
of the island, was not without fault or favour and there was a more than perceptible
preference for the minority communities, in recruitment to the lower rungs of the
administration. The British also generally looked upon the Sinhalese majority as lazy by
nature. Though several governors disparaged the idle nature of the Sinhalese, they had,
much earlier, acquired a philosophy of their own – Materialism was demonic to culture

38
and acquisition of riches, not valued. Contentment within a simple pastoral life was their
goal.
Historically, Dravidians (the Tamils of the North and the South Indians) and the
Sinhalese have been through phases of war and peace, confrontation and collaboration,
separation and assimilation, for well over two millennia. It was the sporadic invasions of
the Dravidians that necessitated the retreat of the Sinhalese from Anuradhapura to
Polonaruwa to Dambadeniya to Yapahuwa, Kurunegala, Gampola, Kotte and the
Kandyan Hill Country. The imported Indian Tamil Labour were also unwelcome as they
represented a force which had changed the nature of their existence for the worse. The
other minorities, though possibly favoured, like the Burghers, Eurasians, Muslims and
Malays, seemed to have integrated well with this multi-ethnic population.
Whilst the British were in Sri Lanka, they were able to create and maintain a
socioeconomic environment in a plantation dominated scenario and submerge differences
and rivalries and hold them together. British custom and tradition also gained acceptance
in the land beginning with the Burghers, Eurasians and Upper Crust Sinhalese and
Tamils. However, with the departure of the British, the pressures of race, ethnicity and
even religion quickly destroyed the tenuous unification they had fashioned.
Looking back on British Governance of over one and a half centuries in the island, a
steady pattern of evolution can be seen. The Autocratic Governor, the Legislative
Council, The Civil Administration, Adult Franchise and State Council, culminating in the
Soulbury Constitution espousing Dominion Status. The 19th century dynamics of
governance was for the greater part, cohesion of the Civil Service with the British
Planting Community and later with the Ceylonese Planters as well. Communal
representation was expanded to include more ethnic groups through Universal Adult
Franchise. Government had to cater to historic mobility of ethnic groups brought about
by plantation growth. This is manifest in the Burgher/Eurasian dominance in the cities,
the organized movement of Indian Tamils to the estates, the regulated influx of Ceylon
Tamils to the Capital, the convergence of Muslims in urban – rural commerce and to a
lesser degree, Malays in the Police and Excise Departments. The vast majority of
Sinhalese however continued their existence in their traditional subsistence agriculture
environment. Though the stability of the country during this period owes much to British
direction, the general contentment and spirit of tolerance of the majority Sinhala towards
other races and religions is an equally important factor. But this status quo would change
in the post independence era.
Some Salient Features of the British Legacy;
A viable economy based on the Plantation System in which Tea features most
prominently.
Infra Structure of administration and commerce in nine provinces with three employment
sectors – the plantation – mercantile, the government service and trade.
Adjuncts for the administration of the law:
The network of Police Stations
The pyramid of Law Courts
Mechanism for Representative Government:
A Constitution ensuring political rights
A parliament elected by Universal Adult Franchise.

39
Cartography, Census and Statistics:
The Surveyor General’s Department
The Department of Census and Statistics.
Infra structure/facilities:
Roads, Railways, Telecommunication.
Hospitals, Public Health services
A tiered educational system paralleling international standards
Via the English Language
On the other side of the coin, initially, only a modicum of benefits from the Tea Industry,
reached the Sinhala rural population directly. The subsidized life of food rations housing
and clothing and medical benefits available to plantation workers were denied to the
native population, which survived on subsistence agriculture, village labour and available
employment. Only health care was provided and education was but partially subsidized.
Taxation on Tea and other Plantation products filled the coffers from which general
services were provided by the government. Despite this, there was a general impression
that the benefits of the plantation economy, in which Tea figured most prominently, were
siphoned off by immigrants and minority groups. With World War II, came food and
textile rationing, more equitably distributed. This model of state welfare-ism became
standard in the immediate post-colonial era. This was funded entirely by the plantation
economy to which tea contributed a hefty 68% (Export – Import Balance Sheet, 1948) It
can therefore be acknowledged that there was an appreciable trickle down effect from the
Tea Plantations to the population at large in the latter years.
In the post independence era, the tea enterprise continued to develop, with British owned
companies, Sri Lankan owned companies and small-holdings integrating well with each
other, for nearly 2 decades. In the hustings of 1970, the capitalist regime of the UNP was
rejected by the masses in favour of the socialist SLFP. Attempts at social reform, by a
government now concentrated in the hands of the Kandyan Sinhala caused havoc with the
economy and the stability of the country in general. The threat of Land Reform, which
had hung in the air for a few years, became reality in 1975. The ceiling on land ownership
was slashed to 50 acres per individual. Private companies and British companies were
the first to be vested in the government. Shortly after, it was the turn of the Ceylonese
owned public companies. The exodus of the British planter which had already begun in
the late 1960s, accelerated. After 1975 only a handful of die-hard Britishers remained in
the island. Agency Houses continued to manage the estates for a brief period as trustees
to the government. Had the then government continued with this arrangement, the story
of tea today would have been far different, but political agitation instigated by various
factions ended in the tea estates being handed over to the direct management of several
hastily instituted Boards of Management. The only exception to this was the State
Plantation Corporation, which was formed in 1958.
The Plantation Industry received a severe setback during this period of expediency-
oriented governance. High yielding Tea lands, among others were alienated for village
expansion, rural housing and other hastily mooted projects. The Plantations, themselves,
were controlled by the various politically instituted boards, which were grossly
incompetent to manage them. The Sri Lankan Planter, successor to the British Plantation
Raj was subject to persecution by the Kandyan Sinhala regime. The Indian Tamils were
also at the receiving end of draconian reforms, which denied them citizenship. An

40
unrealistic Repatriation Policy had left the fate of 950,000 Indian Tamils in the balance,
exacerbating the situation created by the Citizenship Legislation of 1948/49. Indian
Premier Nehru was intransigent in his stance against repatriation, but his successor,
Shasthri conceded moral responsibility towards these Indian Tamil Immigrants and an
unwieldy, unrealistic policy was hammered out with Mrs. Bandaranaike, the Sri Lankan
premier at the time. This resulted in only a fraction of the 525,000 Tamils eligible for
repatriation being repatriated. This statelessness dilemma was finally resolved in 1988 by
President R. Premadasa, by special ordinance.
An overview of British Tea Planters attitude toward their wards, the Indian Tamils,
indicates a cavalier manner and a lack of concern in general. The prejudices and racial
bias of the times led to their perception of the Indian Tamils as an inferior race. The all-
important aspect of education received only token attention on the plantations. More
over, the Tamil Labour who eked a precarious existence on the Tea estates could only
make ends meet as a family unit. Tea estates labour wages was another thorny issue and
figured prominently in plantation disputes. The cost of labour was the single largest
expense item of an estate, the industry being quite labour intensive. Nevertheless, wage
increases were conceded by both private owners and the State from time to time and
analysis of nominal tea plantation wages and the consumer price index indicates that
nominal wages have moved in harmony with the CPI. Real wages too, have generally
being maintained except during the period 1996 /1997. In comparison with other wages
boards shows that tea wages have actually enjoyed a premier status. The current tea
estate labour wages is Rs. 120/- per diem. Adjustments to the basic wage rate were
effected in 1967, 1982, 1984, 1988, 1993, 1998 & 2001. (See Table 16)
Tea plantation workers generally function as family units of 2 to 3 members whose
collective income in addition to free housing and other benefits, enable them to get by a
larger family naturally had better disposable income .
Therefore, it was pure expediency as far as a parent was concerned, for a child to help
augment the meagre family coffers than be sent to the estate school, which offered only
rudimentary education. This short-term benefit only rendered the child unfit for a life
anywhere except on the plantations. This dependency on the estate as an inexhaustible
source of employment would also contribute to aggravate an already seething situation.
Thus, the plight of the Indian Tamils, shunned by the Indigenous Sinhala and harshly
regimented on the plantations, became a thorny issue indeed, in Sri Lankan politics.
The plantation sector was operated by the private sector until the 1970’s. In the early
1970’s the then Government nationalized the plantation sector with the introduction of
Land Reform Laws in 1972 and 1975. This resulted in the Government acquisition of
502 tea, rubber and coconut estates and vesting them with two State Corporations,
Janatha Estates Development Board (JEDB) and Sri Lanka State Plantation Corporation
(SLSPC). By 1990, JEDB and SLSPC accounted for approximately, 51% of tea
production, 32% of rubber production and 2% of coconut production in the country.
The plantation sector in the 2 decades under State ownership and management had not
performed all too well.
During the 15 year period 1978-1990, JEDB reported losses in 12 years and the SLSPC,
reported losses in 9 years.

41
Between 1978 and 1992 JEDB and SLSPC had accumulated losses of approximately Rs.
3.0 billion. They were in debt to the tune of Rs. 5.0 billion primarily to State Banks, as a
result of sustained losses.
The Asian Development Bank report identified the following reasons as the primary
contributors to the decline.
1. Nationalization of Plantations
2. Adverse Fiscal and Monetary Policies
3. Haphazard Regulatory Policies
Faced with this situation, the government had no option but to turn to the private sector to
rescue the plantations. In 1994, most of the state owned plantations were privatized in 23
groups or companies, in which the government retained an ownership interest. This
strategy has worked well and the Tea, the ailing giant, is now healthy and vibrantly alive.
Today, Sri Lanka is once again, the biggest exporter of tea in the world (22% of World
exports) and ranks third in World Tea Production. Yields, which had sunk to around 800
kg/ha in 1970’s and 1980’s improved to around 1000 Kg/ha by 1990 and since
privatization has climbed steadily to reach 1600 Kg/ha mark, as recorded in the statistics.
A more realistic figure is probably 1500 Kg/ha since it is no longer mandatory to register
all tea lands with the Tea Commissioner. The analysis of yield figures appear quite lop
sided with small holdings, showing 2216 Kg/ha as against larger estates’ 1151 kg/ha.
These results, though remarkable are no grounds for complacency, as the average yield of
Indian Tea Plantations hover around the 2000kg/ha mark and that of Kenyan tea yields
almost touched 2500 Kg/ha in 1998. (See table Nos. 6, 7 & 8)
History will judge the occupying powers by the legacies they left behind. All such
legacies contain both the positive and the negative aspects. The Portuguese, Dutch and
British, each occupied the country for a similar period of time. The legacies of the others
pale into insignificance in comparison with that of the British. Perhaps it was fortunate
that they were the last of the Colonial Masters of the Island and that historians will tend
to be biased towards them in the chronicles. The writer has attempted to analyse the pros
and cons by a juxtaposition of the Tea Plantation Enterprise, that singularly outstanding
feature of the British legacy, as the most salient point of reference.
One can only speculate on the turn of events an alternate course of history would have
taken. However the reality of it all is that in over half a century of independence, the
country has not seen adequate economic progress or upward mobility in its peoples, the
reasons for which go beyond the scope of this study. What is relevant though, is the fact
that the economy of the country is still greatly dependent on the Tea Industry.
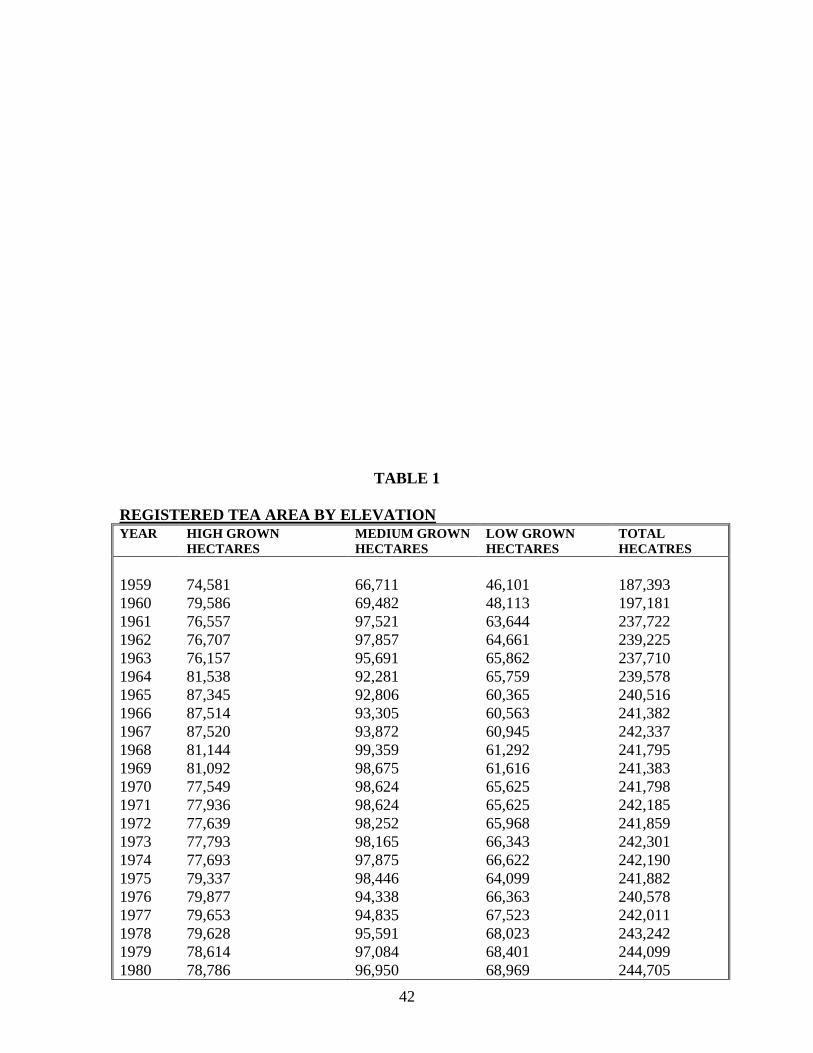
42
TABLE 1
REGISTERED TEA AREA BY ELEVATION
YEAR HIGH GROWN
HECTARES
MEDIUM GROWN
HECTARES
LOW GROWN
HECTARES
TOTAL
HECATRES
1959
1960
1961
1962
1963
1964
1965
1966
1967
1968
1969
1970
1971
1972
1973
1974
1975
1976
1977
1978
1979
1980
74,581
79,586
76,557
76,707
76,157
81,538
87,345
87,514
87,520
81,144
81,092
77,549
77,936
77,639
77,793
77,693
79,337
79,877
79,653
79,628
78,614
78,786
66,711
69,482
97,521
97,857
95,691
92,281
92,806
93,305
93,872
99,359
98,675
98,624
98,624
98,252
98,165
97,875
98,446
94,338
94,835
95,591
97,084
96,950
46,101
48,113
63,644
64,661
65,862
65,759
60,365
60,563
60,945
61,292
61,616
65,625
65,625
65,968
66,343
66,622
64,099
66,363
67,523
68,023
68,401
68,969
187,393
197,181
237,722
239,225
237,710
239,578
240,516
241,382
242,337
241,795
241,383
241,798
242,185
241,859
242,301
242,190
241,882
240,578
242,011
243,242
244,099
244,705

43
1981
1982
1983
1984
1985
1986
1987
1988
1989
1990
1991
1992
1994
78,621
77,769
71,959
74,157
74,706
73,206
72,773
72,901
73,110
73,138
73,331
74,141
51,443
96,853
96,644
90,272
90,203
89,175
85,216
84,445
84,227
84,062
83,223
82,467
85,510
56,155
69,444
67,728
67,834
63,514
67,769
64,483
64,280
64,555
64,938
65,397
65,893
62,185
79,711
244,918
242,141
230,065
227,874
231,650
222,905
221,498
221,683
222,110
221,758
221,691
221,836
187,309
1995 51,443 56,155 79,711 187,309
1996
1997
1998
2000
52,272
51,444
51,444
52,272
56,863
58,155
58,155
56,863
79,836
79,711
79,711
79,836
188,971
189,310
189,310
188,971
Note: 1. The statutory requirement that owners should register their Tea Lands with the Tea
Commissioner was repealed at the end of 1992
2. Data from the Land Use survey is indicated for 1994/95.
TABLE 2
BLACK TEA PRODUCTION BY ELEVATION – TIME SERIES DATA UNITS: KILOGRAMS
YEAR HIGH
GROWN
QUANTITY
%
MEDIUM
GROWN
%
LOW
GROWN
%
TOTAL

44
66,711,302
69,481,551
73,894,059
73,532,203
77,465,673
75,692,090
78,799,420
73,555,871
79,061,967
80,927,492
77,520,222
72,199,523
75,958,177
74,921,969
70,422,600
70,510,017
73,079,031
64,455,442
66,627,985
61,143,498
62,450,564
55,563,799
59,345,037
51,644,626
48,458,228
54,660,319
55,195,393
53,314,398
53,538,286
54,306,232
50,013,524
51,925,202
51,270,463
37,855,362
47,165,593
47,427,931
50,632,962
48,048,111
57,084,621
52,356,979
53,531,151
56,208,061
74,580,857
79,586,340
81,378,652
85,747,607
88,473,215
87,378,593
91,340,878
88,846,801
84,774,325
86,022,316
84,910,563
81,110,217
84,568,971
81,393,196
80,570,660
80,285,984
80,160,075
75,917,845
78,675,129
71,815,883
76,540,849
72,569,840
80,492,171
71,664,582
67,761,155
79,330,706
78,755,063
77,068,281
73,410,187
76,828,940
74,080,836
76,115,685
73,246,871
53,726,602
72,582,221
76,726,405
73,486,667
72,229,829
83,772,322
77,390,476
81,299,489
83,488,933
39.8
40.4
39.4
40.5
40.3
40.0
40.0
40.0
38.4
38.3
38.7
38.2
38.8
38.1
38.1
39.3
37.5
38.6
37.7
36.1
37.1
37.9
38.3
38.2
37.8
38.1
36.8
36.5
34.4
33.9
35.8
32.6
30.4
30.0
31.3
31.7
29.9
27.9
30.3
27.6
28.7
27.3
35.6
35.2
35.8
34.7
35.2
34.6
34.5
33.1
35.8
36.0
35.3
34.0
34.9
35.1
33.3
34.6
34.2
32.8
31.9
30.7
30.3
29.0
28.2
27.5
27.0
26.3
25.8
25.2
25.1
23.9
24.2
22.3
21.3
21.2
20.3
19.6
20.6
18.6
20.6
18.7
18.9
18.4
46,100,606
48,113,117
51,215,791
52,570,333
53,859,268
55,442,509
58,096,014
59,910,210
56,905,763
57,853,234
57,208,864
58,900,342
57,246,025
57,159,933
60,277,694
53,242,427
60,439,660
56,232,688
63,268,730
66,021,202
67,425,776
63,241,742
70,310,710
64,506,354
63,067,661
74,067,114
80,143,646
80,895,038
86,378,939
95,816,861
82,893,320
105,124,399
116,229,702
87,288,319
112,122,934
118,059,738
121,841,143
138,149,467
136,003,696
150,308,542
148,930,542
166,146,767
24.6
24.4
24.8
24.8
24.5
25.4
25.5
26.9
25.8
25.7
26.0
27.8
26.3
26.8
28.5
26.1
28.3
28.6
30.3
33.2
32.7
33.0
33.5
34.3
35.2
35.6
37.4
38.3
40.5
42.2
40.0
45.1
48.3
48.8
48.4
48.7
49.5
53.5
49.1
53.7
52.5
58.6
187,392,765
197,181,008
206,488,502
211,850,143
219,798,156
218,513,192
228,236,312
222,312,882
220,742,055
224,803,042
219,639,649
212,210,082
217,773,173
213,475,098
211,270,954
204,038,428
213,678,766
196,605,975
208,571,844
198,980,583
206,417,189
191,375,381
210,147,918
187,815,562
179,287,044
208,058,139
214,094,102
211,277,717
213,327,412
226,952,033
206,987,680
233,165,286
240,747,036
178,870,283
231,870,748
242,214,074
245,960,772
258,427,407
276,860,639
280,055,997
283,761,182
305,843,761

45
TABLE 3
TEA PRODUCTION IN MAJOR PRODUCING COUNTRIES
1998-2000 (MILLION KGS)
COUNTRY 1998 1999 2000
Mn. Kgs. Mn. Kgs. Mn. Kgs
India – North 669.0 604.3 618.9
South 201.4 201.3 204.5
Total-India 870.4 805.6 823.4
China 665.0 675.8 680.0
Sri Lanka 280.7 284.0 306.0
Kenya 294.2 248.8 236.3
Indonesia 166.8 165.4 168.6
Bangladesh 56.2 47.4 54.0
Malawi 40.4 38.5 42.1
Uganda 26.4 24.7 29.3
Zimbabwe 17.8 17.0 22.5
-------- ---------- -----------
Total 2,417.9 2,307.2 2,362.20
===== ====== =======
TABLE 4

46
TEA PRODUCTION – ORTHODOX/GREEN TEA – TIME SEIRES DATA
YEAR
ORTHODOX
Kg.
CTC
Kg.
TOTAL BLACK
TEA (kg.)
GREEN
TEA
Kg.
TOTAL
BLACK &
GREEN TEA
kg.
1980
1981
1982
1983
1984
1985
1986
1987
1988
1989
1990
1991
1992
1993
1994
1995
1996
1997
1998
1999
2000
191,375,381
210,147,918
187,815,562
178,539,902
207,522,918
213,400,242
210,184,428
212,224,982
225,732,764
202,804,009
227,501,683
234,285,432
173,718,704
223,946,702
231,033,767
226,168,077
241,604,910
257,414,010
262,764,762
265,454,712
288,332,654
-
-
-
747,142
535,221
693,860
1,093,289
1,102,430
1,219,269
4,183,761
5,663,603
6,461,604
5,151,579
7,924,046
11,180,307
19,792,695
16,822,497
19,446,629
17,291,235
18,306,071
17,511,107
191,375,381
210,147,918
187,815,562
179,287,044
208,058,139
214,094,102
211,277,717
213,327,412
226,952,033
206,987,680
233,165,286
240,747,036
178,870,283
231,870,748
242,214,074
245,960,772
285,427,407
276,860,639
280,055,997
283,760,783
305,843,761
-
-
814,727
673,204
1,158,425
1,210,721
1,427,765
1,274,785
1,238,284
963,930
909,173
805,054
744,606
1,403,842
1,351,582
464,197
542,375
567,155
617,619
429,861
945,071
191,375,381
210,147,918
188,630,289
179,960,248
209,216,564
215,304,823
212,705,482
214,602,197
228,190,317
207,951,610
234,074,459
241,552,090
179,614,889
233,274,590
243,565,656
246,424,969
258,969,782
277,427,794
280,673,616
284,190,644
306,788,832
TABLE 5
TEA EXPORTS – TIME SERIES DATA (1962-2000)
UNITS: METRIC TONS

47
YEAR BULK
TEA
PACKETED
TEA
TEA
BAGS
INSTANT
TEA
GREEN
TEA
OTHER
TEA
TOTAL
EXPORTS
1962
1963
1964
1965
1966
1968
1969
1970
1971
1972
1973
1974
1975
1976
1977
1978
1979
1980
1981
1982
1983
1984
1985
1986
1987
1988
1989
1990
1991
1992
1993
1994
1995
1996
1997
1998
1999
2000
199,163
204,518
202,065
212,237
198,516
197,929
182,160
202,931
190,519
175,514
191,597
165,930
195,426
182,496
171,364
167,265
163,790
153,043
150,615
146,635
115,001
156,958
138,862
137,605
120,192
139,720
128,601
133,435
136,306
117,699
129,003
152,175
132,145
129,727
148,274
160,116
171,638
182,836
1,704
1,672
1,496
2,064
1,674
4,261
7,027
7,720
10,281
14,574
13,918
9,196
17,033
17,210
14,066
25,177
24,336
31,132
32,018
32,993
41,688
45,602
56,132
66,334
77,644
75,790
72,400
76,327
69,783
55,033
74,857
64,386
93,877
93,715
94,825
86,746
73,216
74,668
-
-
-
-
-
-
-
-
-
-
-
-
-
31
111
36
62
281
603
1,075
936
1,122
2,126
2,055
2,425
3,309
2,710
4,781
4,318
4,541
5,138
6,819
7,541
9,246
10,781
11,946
11,250
12,134
-
20
6
12
33
128
132
114
165
101
227
279
252
223
217
147
188
203
114
163
152
252
409
262
346
200
436
361
377
413
733
851
709
736
832
859
991
1,218
-
-
-
-
-
-
-
-
-
-
-
-
-
-
-
-
-
-
-
173
53
252
253
8
-
751
21
418
36
400
690
744
799
399
473
475
556
643
-
-
-
-
-
-
-
-
-
-
-
-
-
-
-
-
-
-
11
4
6
39
56
1,573
514
141
30
292
336
129
252
112
679
484
2,479
5,163
6,291
9,852
200,867
206,210
203,567
214,313
200,223
202,317
189,318
210,765
200,965
190,189
205,742
175,405
212,711
199,960
185,758
192,625
188,377
184,659
183,362
181,043
157,837
204,226
197,837
207,837
201,120
219,911
204,198
215,615
211,206
178,215
210,673
225,087
235,750
234,307
257,664
265,305
263,942
281,351
TABLE 6
AVERAGE YIELD – TIME SERIES DATA
UNITS: Kg/He
YEAR HIGH GROWN
QUANTITY
MEDIUM
GROWN
QUANTITY
LOW GROWN
QUANTITY
TOTAL
QUANTITY
1961 1,063 758 805 869

48
1962
1963
1964
1965
1966
1967
1968
1969
1970
1971
1972
1973
1974
1975
1976
1977
1978
1979
1980
1981
1982
1983
1984
1985
1986
1987
1988
1989
1990
1991
1992
1993
1994 #
1995 #
1996 #
1997 #
1998 #
1999 #
2000 #
1,118
1,162
1,072
1,046
1,015
969
1,060
1,047
1,046
1,085
1,048
1,036
1,033
1,010
950
988
902
974
921
1,024
922
942
1,070
1,054
1,053
1,009
1,054
1,013
1,041
999
725
979
1,491
1,428
1,382
1,603
1,504
1,580
1,597
751
810
820
849
788
842
814
786
732
770
763
717
720
742
683
703
640
643
573
613
534
537
606
619
626
634
645
595
624
622
443
979
846
902
845
1,004
932
953
988
813
818
843
962
989
934
944
928
898
872
866
909
799
943
847
937
971
986
917
1,012
952
930
1,166
1,183
1,255
1,344
1,484
1,276
1,607
1,764
1,404
979
1,481
1,529
1,730
1,704
1,836
1,868
2,081
886
925
912
949
921
911
930
910
878
899
883
872
842
883
817
862
818
846
782
858
776
779
913
924
948
963
1,024
932
1,051
1,086
806
979
1,293
1,313
1,368
1,465
1,495
1,515
1,618
Note: Estimated using extent registered.
(Not using extent bearing)
# Using 1992 registered Area
TABLE 7
AVERAGE YIELD IN MAIN PRODUCING COUNTRIES – TIME SERIES DATA
UNITS: kg/he
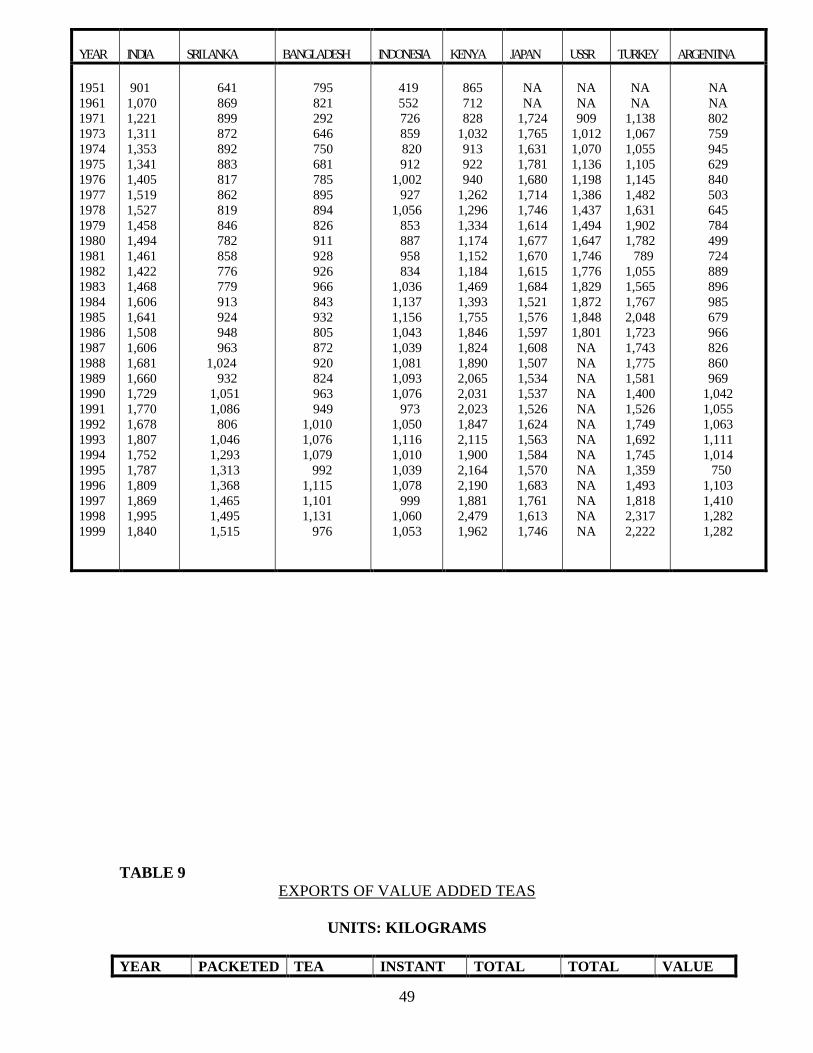
49
YEAR
INDIA
SRI LANKA
BANGLADESH
INDONESIA
KENYA
JAPAN
USSR
TURKEY
ARGENTINA
1951
1961
1971
1973
1974
1975
1976
1977
1978
1979
1980
1981
1982
1983
1984
1985
1986
1987
1988
1989
1990
1991
1992
1993
1994
1995
1996
1997
1998
1999
901
1,070
1,221
1,311
1,353
1,341
1,405
1,519
1,527
1,458
1,494
1,461
1,422
1,468
1,606
1,641
1,508
1,606
1,681
1,660
1,729
1,770
1,678
1,807
1,752
1,787
1,809
1,869
1,995
1,840
641
869
899
872
892
883
817
862
819
846
782
858
776
779
913
924
948
963
1,024
932
1,051
1,086
806
1,046
1,293
1,313
1,368
1,465
1,495
1,515
795
821
292
646
750
681
785
895
894
826
911
928
926
966
843
932
805
872
920
824
963
949
1,010
1,076
1,079
992
1,115
1,101
1,131
976
419
552
726
859
820
912
1,002
927
1,056
853
887
958
834
1,036
1,137
1,156
1,043
1,039
1,081
1,093
1,076
973
1,050
1,116
1,010
1,039
1,078
999
1,060
1,053
865
712
828
1,032
913
922
940
1,262
1,296
1,334
1,174
1,152
1,184
1,469
1,393
1,755
1,846
1,824
1,890
2,065
2,031
2,023
1,847
2,115
1,900
2,164
2,190
1,881
2,479
1,962
NA
NA
1,724
1,765
1,631
1,781
1,680
1,714
1,746
1,614
1,677
1,670
1,615
1,684
1,521
1,576
1,597
1,608
1,507
1,534
1,537
1,526
1,624
1,563
1,584
1,570
1,683
1,761
1,613
1,746
NA
NA
909
1,012
1,070
1,136
1,198
1,386
1,437
1,494
1,647
1,746
1,776
1,829
1,872
1,848
1,801
NA
NA
NA
NA
NA
NA
NA
NA
NA
NA
NA
NA
NA
NA
NA
1,138
1,067
1,055
1,105
1,145
1,482
1,631
1,902
1,782
789
1,055
1,565
1,767
2,048
1,723
1,743
1,775
1,581
1,400
1,526
1,749
1,692
1,745
1,359
1,493
1,818
2,317
2,222
NA
NA
802
759
945
629
840
503
645
784
499
724
889
896
985
679
966
826
860
969
1,042
1,055
1,063
1,111
1,014
750
1,103
1,410
1,282
1,282
TABLE 9
EXPORTS OF VALUE ADDED TEAS
UNITS: KILOGRAMS
YEAR PACKETED TEA INSTANT TOTAL TOTAL VALUE
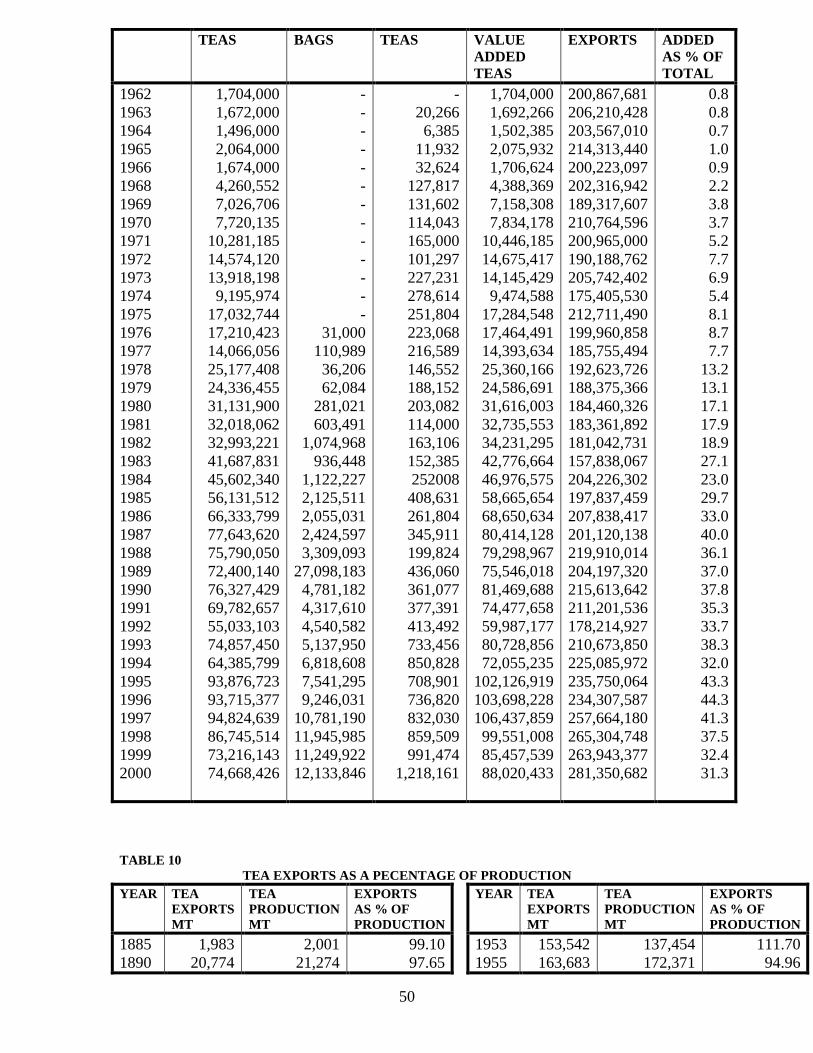
50
TEAS BAGS TEAS VALUE
ADDED
TEAS
EXPORTS ADDED
AS % OF
TOTAL
1962
1963
1964
1965
1966
1968
1969
1970
1971
1972
1973
1974
1975
1976
1977
1978
1979
1980
1981
1982
1983
1984
1985
1986
1987
1988
1989
1990
1991
1992
1993
1994
1995
1996
1997
1998
1999
2000
1,704,000
1,672,000
1,496,000
2,064,000
1,674,000
4,260,552
7,026,706
7,720,135
10,281,185
14,574,120
13,918,198
9,195,974
17,032,744
17,210,423
14,066,056
25,177,408
24,336,455
31,131,900
32,018,062
32,993,221
41,687,831
45,602,340
56,131,512
66,333,799
77,643,620
75,790,050
72,400,140
76,327,429
69,782,657
55,033,103
74,857,450
64,385,799
93,876,723
93,715,377
94,824,639
86,745,514
73,216,143
74,668,426
-
-
-
-
-
-
-
-
-
-
-
-
-
31,000
110,989
36,206
62,084
281,021
603,491
1,074,968
936,448
1,122,227
2,125,511
2,055,031
2,424,597
3,309,093
27,098,183
4,781,182
4,317,610
4,540,582
5,137,950
6,818,608
7,541,295
9,246,031
10,781,190
11,945,985
11,249,922
12,133,846
-
20,266
6,385
11,932
32,624
127,817
131,602
114,043
165,000
101,297
227,231
278,614
251,804
223,068
216,589
146,552
188,152
203,082
114,000
163,106
152,385
252008
408,631
261,804
345,911
199,824
436,060
361,077
377,391
413,492
733,456
850,828
708,901
736,820
832,030
859,509
991,474
1,218,161
1,704,000
1,692,266
1,502,385
2,075,932
1,706,624
4,388,369
7,158,308
7,834,178
10,446,185
14,675,417
14,145,429
9,474,588
17,284,548
17,464,491
14,393,634
25,360,166
24,586,691
31,616,003
32,735,553
34,231,295
42,776,664
46,976,575
58,665,654
68,650,634
80,414,128
79,298,967
75,546,018
81,469,688
74,477,658
59,987,177
80,728,856
72,055,235
102,126,919
103,698,228
106,437,859
99,551,008
85,457,539
88,020,433
200,867,681
206,210,428
203,567,010
214,313,440
200,223,097
202,316,942
189,317,607
210,764,596
200,965,000
190,188,762
205,742,402
175,405,530
212,711,490
199,960,858
185,755,494
192,623,726
188,375,366
184,460,326
183,361,892
181,042,731
157,838,067
204,226,302
197,837,459
207,838,417
201,120,138
219,910,014
204,197,320
215,613,642
211,201,536
178,214,927
210,673,850
225,085,972
235,750,064
234,307,587
257,664,180
265,304,748
263,943,377
281,350,682
0.8
0.8
0.7
1.0
0.9
2.2
3.8
3.7
5.2
7.7
6.9
5.4
8.1
8.7
7.7
13.2
13.1
17.1
17.9
18.9
27.1
23.0
29.7
33.0
40.0
36.1
37.0
37.8
35.3
33.7
38.3
32.0
43.3
44.3
41.3
37.5
32.4
31.3
TABLE 10
TEA EXPORTS AS A PECENTAGE OF PRODUCTION
YEAR TEA
EXPORTS
MT
TEA
PRODUCTION
MT
EXPORTS
AS % OF
PRODUCTION
YEAR TEA
EXPORTS
MT
TEA
PRODUCTION
MT
EXPORTS
AS % OF
PRODUCTION
1885
1890
1,983
20,774
2,001
21,274
99.10
97.65
1953
1955
153,542
163,683
137,454
172,371
111.70
94.96

51
1900
1905
1910
1911
1912
1913
1914
1915
1916
1917
1918
1919
1920
1921
1922
1923
1924
1925
1926
1927
1928
1929
1930
1931
1932
1933
1934
1935
1936
1937
1938
1939
1940
1941
1942
1943
1944
1945
1946
1947
1948
1949
1950
1951
1952
67,844
NA
82,585
84,638
87,098
86,868
87,808
97,809
92,195
87,556
81,936
94,602
83,810
73,305
77,931
82,527
92,955
95,160
98,513
102,983
107,374
110,118
110,271
110,663
114,679
98,004
98,847
95,943
99,150
96,354
106,640
104,361
116,097
107,109
120,508
119,492
124,036
110,108
132,256
128,029
134,280
138,985
132,840
142,036
141,603
67,327
78,304
82,410
85,128
86,649
87,170
88,549
95,994
91,845
87,559
82,018
94,541
83,845
73,630
77,742
83,235
92,388
95,025
98,016
103,007
107,265
111,000
111,000
111,000
115,585
100,126
101,913
100,181
102,673
102,560
112,006
107,625
120,247
112,432
132,177
121,925
134,650
125,601
128,326
135,409
135,529
135,424
138,897
147,998
143,717
100.77
NA
100.21
99.42
100.52
99.65
99.16
101.89
100.38
100.00
99.90
100.06
99.96
99.56
100.24
99.15
100.61
100.14
100.51
99.98
100.10
99.21
99.34
99.70
99.22
97.88
96.99
95.77
96.57
93.95
95.21
96.97
96.55
95.27
91.17
98.00
92.12
87.66
103.06
94.55
99.08
102.63
95.64
95.97
98.53
1956
1957
1958
1959
1960
1961
1962
1963
1964
1965
1966
1967
1968
1969
1970
1971
1972
1973
1974
1975
1976
1977
1978
1979
1980
1981
1982
1983
1984
1985
1986
1987
1988
1989
1990
1991
1992
1993
1994
1995
1996
1997
1998
1999
2000
162,286
160,082
171,155
178,723
181,622
193,658
200,868
206,210
203,567
214,313
200,223
217,546
202,317
189,318
210,765
200,965
190,189
205,742
175,406
212,711
199,961
185,755
192,624
188,375
184,460
183,362
181,043
157,838
204,226
197,837
207,838
201,120
219,910
204,197
215,614
211,202
178,215
210,674
225,086
235,747
234,308
257,664
265,305
263,943
281,351
170,360
180,428
187,404
187,393
197,181
206,489
211,850
219,798
218,513
228,236
222,313
220,742
224,803
219,640
212,210
217,773
213,475
211,271
204,038
213,679
196,606
208,572
198,981
206,417
191,375
210,148
187,816
179,287
208,058
214,094
211,278
213,327
226,952
206,988
233,165
240,747
178,870
231,871
242,214
245,961
258,427
276,861
280,056
283,761
305,843
95.26
88.72
91.33
95.37
92.11
93.79
94.82
93.82
93.16
93.90
90.06
98.55
90.00
86.19
99.32
92.28
89.09
97.38
85.97
99.55
101.71
89.06
96.81
91.26
96.39
87.25
96.39
88.04
98.16
92.41
98.37
94.28
96.90
98.65
92.47
87.73
99.63
90.86
92.93
95.85
90.67
93.07
94.73
93.02
91.99 Source upto 1933 estimates by ITC. Others extracted from Annual reports of Tea Commissioner/Tea Board.

52
TABLE 11
TEA EXPORTS VALUES – TIME SERIES DATA
YEAR
QUANTITY
KILOGRAMS
VALUE
RS.
US $
FOB
PRICE
RS/KG
US $ /KG
1962
1963
1964
1965
1967
1968
1969
1970
1971
1972
1973
1974
1975
1976
1977
1978
1979
1980
1981
1982
1983
1984
1985
1986
1987
1988
1989
1990
1991
1992
1993
1994
1995
1996
1997
1998
1999
2000
200,867,681
206,210,428
203,567,010
214,313,440
217,545,713
202,316,942
189,317,607
210,764,596
200,965,000
190,188,762
205,742,402
175,405,530
212,711,490
199,960,858
185,758,298
192,697,528
187,641,329
184,695,855
183,361,892
181,039,731
157,937,618
204,226,302
197,998,971
207,828,826
201,120,138
219,910,039
204,197,320
215,253,307
211,201,536
178,214,927
210,673,850
225,085,972
235,750,064
234,307,587
257,664,180
265,304,748
263,943,377
281,350,682
1,124,859,014
1,136,219,458
1,125,725,565
1,155,149,442
1,063,798,537
1,124,882,198
997,703,789
1,133,913,526
1,139,471,550
1,162,053,336
1,261,200,924
1,361,146,913
1,933,547,444
2,097,589,400
3,503,401,500
6,401,411,880
5,724,936,948
6,170,688,516
6,314,359,665
6,342,547,452
8,295,824,300
15,766,671,624
12,002,765,700
9,252,754,921
10,653,466,670
12,305,539,878
13,663,678,814
19,797,015,560
17,747,414,094
14,536,398,578
19,177,708,807
20,528,714,705
23,991,187,106
32,536,487,964
40,424,530,264
48,204,106,811
42,072,795,478
51,042,874,099
236,215,669
238,601,314
236,397,641
242,576,531
218,843,558
188,992,305
167,624,965
190,509,665
191,991,837
194,648,800
196,970,315
204,652,971
275,945,118
249,356,800
382,885,410
410,084,041
367,690,234
373,302,391
328,018,684
304,783,635
352,563,719
619,759,105
441,928,045
330,219,662
361,747,595
386,845,013
379,020,217
494,184,113
428,992,364
331,654,086
397,630,288
415,392,851
468,120,724
588,662,376
685,277,679
746,309,132
597,709,838
673,566,562
5.60
5.51
5.53
5.39
4.89
5.56
5.27
5.38
5.67
6.11
6.13
7.76
9.09
10.49
18.86
33.22
30.51
33.41
34.44
35.03
52.53
77.20
60.62
44.52
52.97
55.96
66.91
91.97
84.03
81.57
91.03
91.20
101.77
138.86
156.89
181.69
159.40
181.42
1.18
1.16
1.16
1.13
1.01
0.93
0.89
0.90
0.96
1.02
0.96
1.17
1.30
1.25
2.06
2.13
1.96
2.02
1.79
1.68
2.23
3.03
2.23
1.59
1.80
1.76
1.86
2.30
2.03
1.86
1.89
1.85
1.99
2.51
2.66
2.81
2.47
2.58
Table 14 shows comparative export figures for 1999 and 2000.

53
TABLE 14
VOLUME OF SRI LANKAN EXPORTS OF TEA
1999-2000 (Mn Kgs)
________________________________________________________________________
CATEGORY 1999 2000 % CHANGE
________________________________________________________________________
Black Tea in Bulk 171.6 182.8 6.5%
Black Tea in Packets 79.9 85.2 6.6%
Black Tea in Bags 11.3 12.1 7.0%
Others 6.2 7.9 27.4%
------ ------- --------
Total 269.0 288.0 7%
==== ==== =====
________________________________________________________________________ (Source: Sri Lanka Customs)
MAIN DESTINATIONS OF SRI LANKA TEAS
TABLE 15
EXPORTS OF TEA TO MAJOR IMPORTING COUNTRIES
1999-2000 (Mn Kgs)
_______________________________________________________________________
COUNTRY 1999 2000 % CHANGE
________________________________________________________________________
CIS Countries 48.1 57.6 +20 %
UAE 41.5 40.2 -03%
Turkey 25.2 20.3 -19%
Syria 19.4 21.5 +11%
Russia 37.1 46.1 +24%
United Kingdom 10.6 10.2 +04%
Libya 5.8 10.0 +72%
Japan 5.9 8.3 +41%
Germany 6.1 5.0 -18%
Iraq 8.9 11.1 +25%
Saudi Arabia 9.9 11.4 -15%
Egypt 7.6 10.1 +33%
Iran 9.8 12.5 +28%
Others 33.1 23.7 -28%
------ ------ -------
Total 269.0 288.0 +07%
==== ===== =====
________________________________________________________________________ (Source: Sri Lanka Customs)

54
TABLE 16
PLANTATION SECTOR WAGES
(TEA ONLY)
PERIOD
RPC RATE
RS. PER DAY
WAGES BOARD
RATE
RS. PER DAY
PREMIUM RS.
PER DAY
1992 January
1992 October
1993 January
1994 December
1996 May
1996 June
1996 July
1996 August
1996 December
1997 June
1997 December
57.08
60.24
72.24
72.24
73.80
77.28
83.00
83.00
83.00
83.00
83.00
49.08
52.24
55.68
61.10
73.80
77.28
80.52
83.00
83.00
83.00
83.00
8.00
8.00
16.56
11.14
0.00
0.00
2.48
0.00
0.00
0.00
0.00
(Source: Employers’ Federation of Ceylon)

55
PART III

56
RESEARCH
1. The Tea Research Institute
2. The Employer’s Federation of Sri Lanka
3. The Sri Lanka Tea Board
4. The Ceylon Chamber of Commerce
5. The Planters Association of Ceylon
6. The Ceylon Planter’s Society.
7. The Ceylon Workers Congress
8. The Dept. Of Archives of Sri Lanka
9. The Sri Lanka Museum Library
REFERENCES
(a) An Historical Relation of Ceylon
An account of the Island of Ceylon (1803) – by Robert Knox
(b) Ceylon (vol. 1) - by Sir James Emerson Tennent
© Ceylon (Vol.2) - by Sir James Emerson Tennent
(d) Golden Tips - by H.W. Cave
(e) The pioneers (early British Tea & Coffee Planters and their way of life)
by John Weatherstone.
(f) Tea & Politics - by S. Thondaman
(g) Sri Lanka Plantations (The Flavour gets sweeter) - Jardine Fleming Research -
Plantations – by Isuru Gunassekera
(h) Plantations Sector wage increase 1998 – An assessment – by Ernst & Young
(Chartered Accountants)
(i) Tea Plantations in Crisis – An overview by P.P. Manickam
(j) A Hundred years of Ceylon Tea – D.M. Forrest
(k) The Hills of Paradise– S.N. Breckenridge