part Ⅲ : recommendations and summaries
TRANSCRIPT

PART Ⅲ : RECOMMENDATIONS AND
SUMMARIES

CHAPTER 16 COUNTERMEASURES FOR THE AIR POLLUTION
16 - 1
CHAPTER 16 COUNTERMEASURES FOR THE AIR POLLUTION 16.1 Selection of Mitigation Measure Principal air pollutants emitted are SO2 and particulate matter from the processes. The constituents of the particulate matter include copper, iron, zinc, arsenic, cadmium, lead and mercury. Mitigation measures by emitting gases through tall stacks were traditionally applied to reduce ground-level air pollutant concentrations. Since this method does not address the problem of long-range transport and deposition of sulfur and merely disperses the pollutant, reliance on this strategy is no longer recommended. Therefore, the objective must be to reduce total emissions. Emission control technologies can be classified into solvent injection and flue gas desulfurization. 16.1.1 Sorbent Injection Sorbent injection involves adding an alkali compound to the combustion gases for reaction with the sulfur dioxide. Typical calcium sorbents include lime and variants of this compound. Sodium-based compounds are also used. Sorbent injection processes remove 30 to 60 % of sulfur oxide emissions. 16.1.2 F lue Gas Desulfurization Flue gas desulfurization (FGD) may be carried out by two basic systems: regenerable and throwaway. Both methods may include wet or dry processes. Currently, more than 90 % of utility FGD systems use a wet throwaway system process. Throwaway systems use inexpensive scrubbing mediums which are cheaper to replace than to regenerate. Regenerable systems, on the other hand, use expensive solvents which are recovered by stripping sulfur oxides from the scrubbing medium. These produce useful byproducts including sulfur, sulfuric acid, and gypsum. Regenerable FGD’s generally have higher capital costs than throwaway systems but lower waste disposal requirements and costs. In wet FGD processes, flue gases are scrubbed in a liquid or liquid/solid slurry of lime or limestone. Wet processes are highly efficient, and can achieve SOx removal of 90 % or more. With dry scrubbing, solid sorbents capture the sulfur dioxide. Dry systems have 70-90 % SOx removal efficiencies and often have lower capital and operating costs, less energy and water requirements, lower maintenance requirements, and elimination of the need to handle sludge. However, the economics of the wet and dry (including “semi-dry” spray absorber) FGD processes vary considerably from site to site. In addition, wet processes are available for producing gypsum as a byproduct. Currently, more than 90 % of utility FGD systems use wet scrubbers followed by spray dry scrubbers and solvent injection systems in the FGD market throughout the world. Wet scrubbers are the most
16 - 2
widely used FGD technology for SO2 control. The preferred solvent in operating wet scrubbers is limestone followed by lime. These are favored because of their availability and relative low cost. Wet processes are highly efficient, and can achieve SO2 removal of 90 % or more. Therefore, a wet limestone/gypsum scrubber FGD system is recommended to reduce SO2 emissions from OMCO. 16.2 Basic Design The basic design of FGD system for OMCO plant is based on the following condition derived from the analysis of process flow diagrams and mass balance data provided by OMCO.
- Flow rate: 185,500 m3/hr - SO2: 4,416 kg/hr - Dust: 62.5 kg/hr taken as average (1~2 t/day) - Other components
1) O2: 3.0 % 2) CO2: 12.0 % 3) H2O: 5.0 % 4) N2: Balance
- Inlet pressure: 20 mmAq take - Inlet temperature: 523 K
JICA Study Team prepared two options for the basic design of OMCO’s FGD system as follows.
- Option 1: 90 % SO2 removal rate; to achieve ambient air quality standard presently applied to OMCO plant site (EEC standard: 120 µg/m3)
- Option2: 98 % SO2 removal rate; to comply with the World Bank emission guidelines for copper smelting (1,000 mg/Nm3)
Process, necessary equipment and installation cost for these 2 options are almost same excluding minor aspects such as detailed specifications of equipment. Then, the following description applied to both two options. It is needless to say that the process, equipment and cost have possibility to be changed if detailed design is made. 16.2.1 Process and Necessary Equipment Figure 16.1 shows process flow diagram of the wet limestone/gypsum scrubber FGD system for OMCO plant. The desulferization process is consisted of major 5 sections, namely, flue gas ducting section, SO2 removal section, limestone feed and handling section, gypsum handling section, and wastewater treatment facility. Process and necessary equipment of these 5 sections are summarized as follows;


16 - 4
(1) Flue Gas-ducting Section
a. Process At first, flue gas is introduced into EP (electrostatic precipitator) to eliminate dust. Over 90 % of dust is eliminated here. Then, the flue gas is transported into gas cooling section by booster fan. The gas is cooled until the saturation temperature at gas cooling section. Then, the flue gas is introduced into the SO2 removal section. b. Equipment EP, booster fan and gas cooling pump.
(2) SO2 Removal Section
a. Process The flue gas from gas cooling section is introduced into absorber where it is violently mixed in a scrubbing liquid made up of limestone/gypsum slurry of 20~30 wt% solids and oxidation air. SO2 absorption, oxidation, neutralization and crystallization occur simultaneously in absorber. SO2 removal occurs in a large gas-liquid interfacial area in absorber. The flue gas is dispersed into the scrubbing liquid through multiple gas sparging tubes, creating small bubbles, which are broken by the liquid’s motion. The oxidation, neutralization and crystallization occur in the main area for the liquid phase of the absorber. Air and limestone are dissolved into the liquid through bubbling and agitation. After sufficient residence time (12~18 hours), the gypsum crystals grow to desired size. The clean gas eliminated SO2 and dust passes through a mist eliminator. Then, the clean gas released to the atmosphere through the stack. b. Equipment Absorber (Jet Bubbling Reactor), oxidation air blower, agitator and mist eliminator
(3) Limestone Feed and Handling Section
a. Process Limestone will be received in pneumatic truck trailers and pneumatically loaded into limestone storage silos. Then the limestone is introduced into lime slurry pit in which it is mixed with gypsum filtrate to make lime slurry. The adjusted lime slurry is fed into the SO2 removal section.
16 - 5
b. Equipment Limestone storage silo, lime slurry pit and lime slurry pump
(4) Gypsum Handling Section
a. Process Gypsum slurry drawn off from the SO2 removal section is introduced into dehydrator in which it is separated into gypsum and gypsum filtrate. The gypsum is transferred to a storage area. Part of the gypsum filtrate is returned into the SO2 removal section for purpose of process water. The remaining gypsum filtrate is sent to the wastewater treatment facility. b. Equipment Dehydrator, gypsum bleeds pump and pond water return pump
(5) Wastewater Treatment Facility This facility should be designed to achieve regulatory requirement. 16.2.2 Estimated Installation Cost The total installation cost of the wet limestone/gypsum scrubber FGD system into OMCO plant is estimated approximately US$ 20 million. 16.3 Air Dispersion Simulation for the Case with Mitigation Measure JICA Study Team executed air dispersion simulation for the case that OMCO installs the FGD system (90 % SO2 removal option) in order to evaluate the effectiveness of the mitigation measure recommended by JICA Study Team. In order to enable to compare the simulation results after and before mitigation measure, ISCST3 model was selected to perform the air dispersion modeling. Based on the FGD system design, the following SO2 emission data were prepared.
- Physical stack height (m) : 100.85 m - Stack exit inner diameter : 1.872 m - Stack gas exit velocity : 17.1 m/sec - Stack gas exit temperature : 363 K - SO2 emission rate : 122.66 g/sec

16 - 6
Figures 16.2 and 16.3 summarize the predicted results of 90 % SO2 removal operation over 20 km x 20 km area surrounding OMCO plant. These figures indicate that ambient air quality standard is not violated in the area over 20km x 20km surrounding OMCO plant if 90 % SO2 removal FGD system is installed.


CHAPTER 17 ENVIRONMENTAL MONITORING SYSTEM
17 - 1
CHAPTER 17 ENVIRONMENTAL MONITORING SYSTEM 17.1 Recommendations for Water Quality Monitoring System 17.1.1 Ongoing Water Quality Monitoring System This section presents the JICA Team’s recommendations for ongoing water quality monitoring within the Sohar Mine area. As described in Chapter 7, a network of water monitoring points is now established. The current monitoring network is deemed adequate for conducting ongoing water quality evaluations to meet the following objectives:
- Continuing to monitor contaminant migration in Wadi Suq and Wadi Bani Umar al Gharbi - Collecting water quality data to evaluate the effectiveness of countermeasures undertaken to
control contaminant migration; - Providing data needed to improve modeling of groundwater flow and contaminant transport; - Collecting geochemical data needed to identify contaminant sources and design groundwater
treatment systems. This section describes the JICA Team’s recommended water quality monitoring system, including the following recommendations:
- Preparing a sampling and analysis plan (SAP) - Identifying specific monitoring locations - Improving existing monitoring wells - Setting the monitoring frequency - Specifying field and laboratory parameters - Establishing uniform field procedures - Specifying field and laboratory quality assurance methods - Identifying record keeping methods - Identifying data analysis techniques
17.1.2 Preparing a Sampling and Analysis Plan (SAP) The primary objective any water quality monitoring program is to obtain water samples that are representative of existing groundwater or surface water conditions and to handle the samples in such a manner that they retain their ambient physical and chemical properties until laboratory testing is completed. The SAP is a critical tool for meeting this objective because it defines the objectives, factors, criteria, and protocols for the monitoring program. For this reason, it is strongly recommended that a detailed SAP be prepared as guidance for field, laboratory, and management personnel in performing ongoing water quality monitoring activities in the Sohar mine area. The SAP is also vital for providing continuity to the monitoring program when changes in personnel occur.
17 - 2
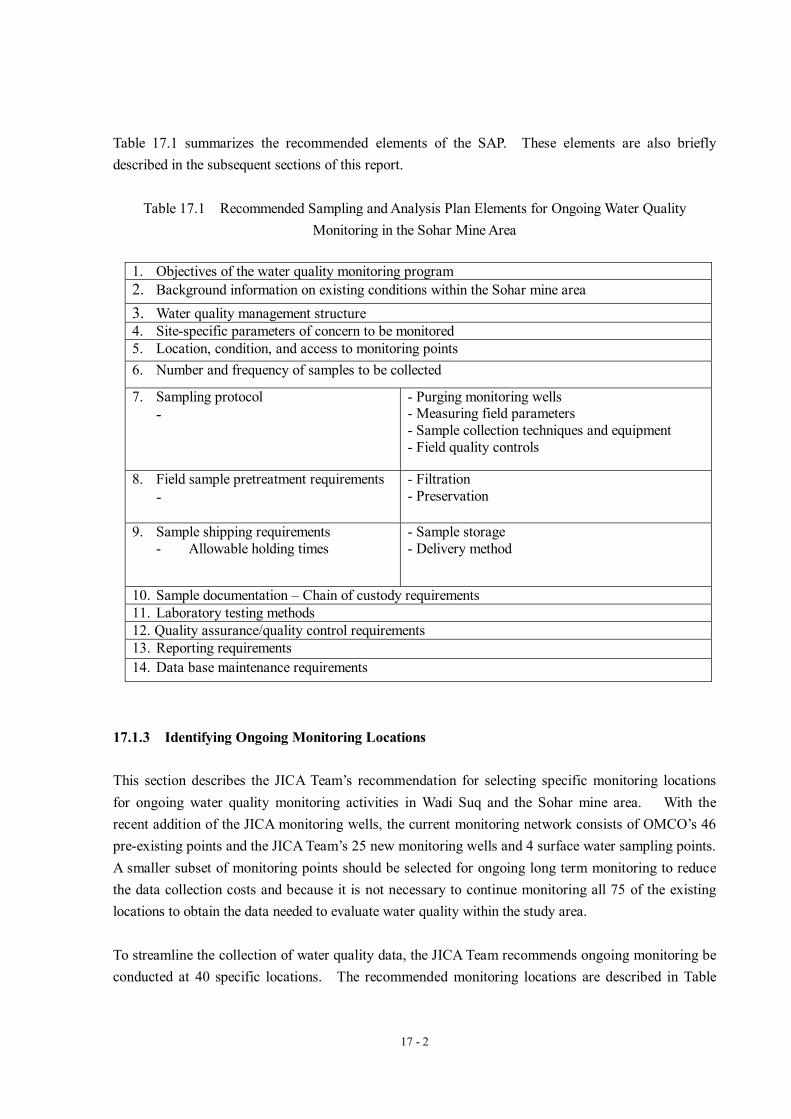
Table 17.1 summarizes the recommended elements of the SAP. These elements are also briefly described in the subsequent sections of this report.
Table 17.1 Recommended Sampling and Analysis Plan Elements for Ongoing Water Quality Monitoring in the Sohar Mine Area
1. Objectives of the water quality monitoring program 2. Background information on existing conditions within the Sohar mine area 3. Water quality management structure 4. Site-specific parameters of concern to be monitored 5. Location, condition, and access to monitoring points 6. Number and frequency of samples to be collected
7. Sampling protocol -
- Purging monitoring wells - Measuring field parameters - Sample collection techniques and equipment - Field quality controls
8. Field sample pretreatment requirements -
- Filtration - Preservation
9. Sample shipping requirements - Allowable holding times
- Sample storage - Delivery method
10. Sample documentation – Chain of custody requirements 11. Laboratory testing methods 12. Quality assurance/quality control requirements 13. Reporting requirements 14. Data base maintenance requirements
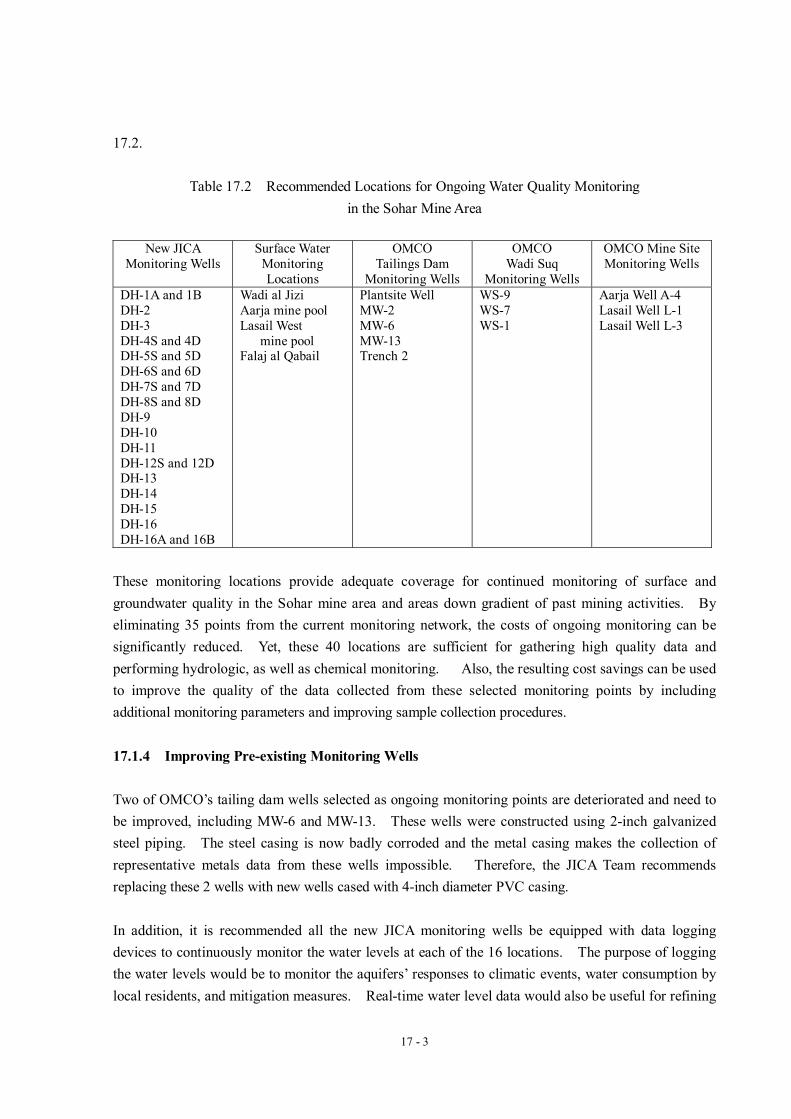
17.1.3 Identifying Ongoing Monitoring Locations This section describes the JICA Team’s recommendation for selecting specific monitoring locations for ongoing water quality monitoring activities in Wadi Suq and the Sohar mine area. With the recent addition of the JICA monitoring wells, the current monitoring network consists of OMCO’s 46 pre-existing points and the JICA Team’s 25 new monitoring wells and 4 surface water sampling points. A smaller subset of monitoring points should be selected for ongoing long term monitoring to reduce the data collection costs and because it is not necessary to continue monitoring all 75 of the existing locations to obtain the data needed to evaluate water quality within the study area. To streamline the collection of water quality data, the JICA Team recommends ongoing monitoring be conducted at 40 specific locations. The recommended monitoring locations are described in Table
17 - 3
17.2.
Table 17.2 Recommended Locations for Ongoing Water Quality Monitoring in the Sohar Mine Area
New JICA
Monitoring Wells Surface Water
Monitoring Locations
OMCO Tailings Dam
Monitoring Wells
OMCO Wadi Suq
Monitoring Wells
OMCO Mine Site Monitoring Wells
DH-1A and 1B DH-2 DH-3 DH-4S and 4D DH-5S and 5D DH-6S and 6D DH-7S and 7D DH-8S and 8D DH-9 DH-10 DH-11 DH-12S and 12D DH-13 DH-14 DH-15 DH-16 DH-16A and 16B
Wadi al Jizi Aarja mine pool Lasail West
mine pool Falaj al Qabail
Plantsite Well MW-2 MW-6 MW-13 Trench 2
WS-9 WS-7 WS-1
Aarja Well A-4 Lasail Well L-1 Lasail Well L-3
These monitoring locations provide adequate coverage for continued monitoring of surface and groundwater quality in the Sohar mine area and areas down gradient of past mining activities. By eliminating 35 points from the current monitoring network, the costs of ongoing monitoring can be significantly reduced. Yet, these 40 locations are sufficient for gathering high quality data and performing hydrologic, as well as chemical monitoring. Also, the resulting cost savings can be used to improve the quality of the data collected from these selected monitoring points by including additional monitoring parameters and improving sample collection procedures. 17.1.4 Improving Pre-existing Monitoring Wells Two of OMCO’s tailing dam wells selected as ongoing monitoring points are deteriorated and need to be improved, including MW-6 and MW-13. These wells were constructed using 2-inch galvanized steel piping. The steel casing is now badly corroded and the metal casing makes the collection of representative metals data from these wells impossible. Therefore, the JICA Team recommends replacing these 2 wells with new wells cased with 4-inch diameter PVC casing. In addition, it is recommended all the new JICA monitoring wells be equipped with data logging devices to continuously monitor the water levels at each of the 16 locations. The purpose of logging the water levels would be to monitor the aquifers’ responses to climatic events, water consumption by local residents, and mitigation measures. Real-time water level data would also be useful for refining
17 - 4
and validating hydrologeologic models. 17.1.5 Establishing Monitoring Frequency In addition to eliminating some monitoring points, the JICA Team also recommends that the frequency of monitoring the selected points be reduced. Again, this recommendation is made to reduce costs. More importantly, however, the current weekly or monthly monitoring schedule is not needed for detecting water quality tends. Rather, it is recommended that the monitoring frequency for the selected wells be reduced to quarterly or biennial. Biennial monitoring is probably more than adequate for detecting significant trends in water quality in the Sohar Mining areas. A biennial sampling plan should, at a minimum, include collecting dry season and wet season samples. 17.1.6 Specifying Field and Laboratory Parameters A uniform list of field and laboratory should be established for all monitoring points. Table C summarizes the JICA Team’s recommendations for a standardized list of monitoring parameters. It is recommended that these same parameters be monitored at all locations during each sampling event, except as noted. Suggested parameters to be analyzed in the laboratory include general geochemical parameters, as well as contaminant indicators. The list of recommended field and laboratory parameters includes the following: (1) Field Parameters Field water quality or pollution indicators include the following:
- Field pH - Temperature - Electrical Conductivity - Oxidation/Reduction Potential - Static Water Level
(2) General Quality Indicators The general water quality or pollution indicators include the following:
- Biochemical oxygen demand (BOD) (tailing dam wells only) - Total dissolved solids (TDS) - Hardness - Total alkalinity - Acidity (for tailing dam and mine pool samples only)

17 - 5
(3) Major Cations It is important to gather data on the concentrations of major cations in order to perform geochemical modeling, help identify contaminant sources, compare water quality against regulatory standards, and design water treatment systems. The major cations to be analyzed by the laboratory include the following:
- Calcium - Magnesium - Sodium
(4) Major Anions Gathering data on the major anions is important because some are pollutants of concern in the Sohar mine area, as well as being needed for performing geochemical modeling, helping to identify contaminant sources, comparing water quality against regulatory standards, and designing water treatment systems. The major anions to be analyzed by the laboratory include the following:
- Bicarbonate/carbonate - Chloride - Fluoride - Nitrate - Nitrite - Phosphate - Silicate - Sulfate - Sulfide
(5) Dissolved Metals Analysis for dissolved metals in groundwater is important not only because they are pollutants of concern, but because they are also indicators of pollution sources and sources of natural mineralization. “Dissolved metals” is the analytical method that provides the most representative indication of pollutant levels in groundwater. “Total metals” results may not be representative of true aquifer characteristics because total metals analyses include the metals contained in sediments that might be suspended in the sample. Sediments in groundwater samples result from precipitates that may form in stagnant water in the well casing or from drilling and well construction activities. To obtain water sample that are truly representative of aquifer conditions, it is recommended samples to be analyzed for metals be filtered at the time of collection. The list of metals to be analyzed include the following:
1) Aluminum

17 - 6
2) Arsenic 3) Cadmium 4) Chromium 5) Copper 6) Iron 7) Lead 8) Manganese 9) Mercury 10) Nickel 11) Silver 12) Zinc
17.1.7 Establishing Standard Operating Procedures for Collecting Water Samples The objective of any sampling and analysis plan is to obtain a sample of water that is representative of actual groundwater quality and to handle and transport the sample to the laboratory without inadvertently changing the chemistry of the sample. Every action taken by field technicians in collecting, handling, and transporting water samples has the capability to affect the reliability, accuracy, and precision of the water quality monitoring results. To ensure the uniformity of monitoring activities conducted by the various interested parties, it is strongly recommended that standard operating procedures (SOPs) be established. These SOPs should include the following minimum standard practices: (1) Identifying, Communicating, and Preventing Worker Health and Safety Risks Preventing injuries to field personnel involved in the water quality monitoring program should be of paramount concern of management personnel. For this reason, a SOPs should be prepared to identify and address worker protection issues that may arise during field monitoring events. This SOPs should address the following issues at a minimum:
1) Avoiding worker exposure to hazardous materials, such as acid tailings 2) Preventing and treating heat stress in field personnel 3) Training field personnel in safe handling of acid preservatives 4) Training personnel in the identification and avoidance of dangerous animals 5) Communicating health and safety information to field personnel 6) Identifying emergency routes to medical facilities in advance of field activities.
(2) Measuring Static Water Levels Prior to purging the wells or collecting any water samples, the static water levels of all wells should be measured. Water levels in each well should always be measured from the same datum, i.e. a

17 - 7
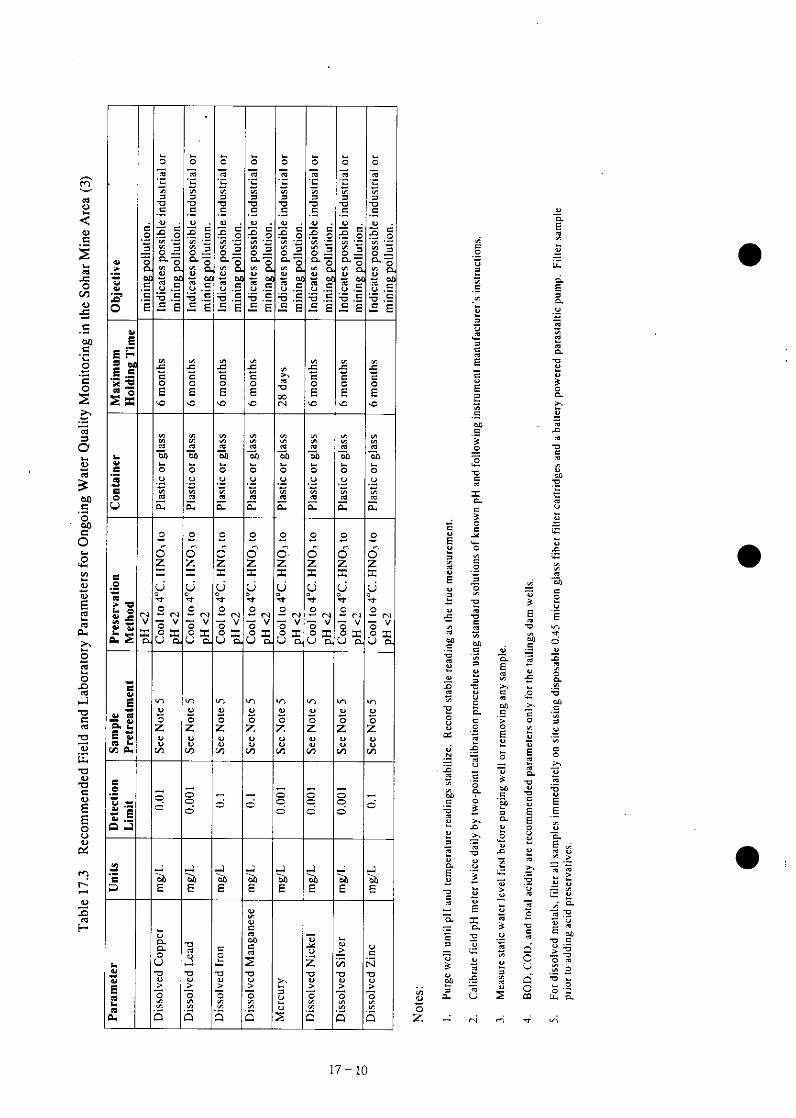
permanently established point at the top of the well casing. Water levels should be measured with an electronic water level indicator that produces an audible tone when the probe end makes contact with the water surface. The indicator should be capable of making measurements accurate to within 0.01 m. (3) Purging Drilled Monitoring Wells Drilled monitoring wells should be purged prior to each sampling event to ensure the samples collected are representative of water quality in the formation, instead of the quality of water in the casing. Stagnant water that has been standing in the casing above the well screen is not free to interact with formation water, is in contact with casing materials for long periods of time, is in direct contact with the atmosphere, and is subjected to different chemical equilibrium forces. This stagnant water may be different in many respects to the water in the formation, i.e. temperature, pH, ORP, TDS, etc. Failure to adequately purge monitoring wells is the single most dominant factor affecting the accuracy, precision, and reliability of groundwater monitoring data. All wells should be pumped or bailed until the pH and temperature of the water stabilizes. It is recommended that the relatively shallow wells be purged by hand bailing. However, the deep large diameter JICA monitoring wells may require the use of submersible bladder pumps to efficient purging. (4) Making Field Measurements After purging the wells, field parameters should be measured using direct-reading field instruments. As described in Table C, the field parameters include pH, electrical conductivity, temperature, and oxidation/reduction potential. These field parameters should be monitored throughout the purging process. When the pH and temperature become stable, a final reading should be taken and recorded as the value most representative of aquifer conditions. (5) Selecting and Preparing Sample Containers Sample containers should be selected and prepared in advance of each monitoring event. To analyze each sample for the parameters listed in Table 17.3, three separate 500 mL plastic sample bottles should be filled and transported to the laboratory. One bottle should contain unfiltered water with no preservative, one container should be acidified with sulfuric acid (H2SO4) but not filtered, and one container should be filtered and acidified with nitric acid (HNO3). Cooler boxes filled with ice must be taken to the field to cool the sample bottles to 4℃, and adequate amounts of acid preservatives should be obtained from the laboratory prior to departing for the field. Arrangements for preservatives, filters, and ice must be made well in advance of each monitoring event.


17 - 11
(6) Collecting Representative Water Samples All groundwater samples should be collected using a PVC or Teflon bailer, which is lowered into the well by means of a clean nylon or plastic cable. Significant errors may occur during the sample collection process. Turbulence, changes in pressure, and exposure to the atmosphere can readily affect the pH and ORP of the sample, which in turn may cause metals to precipitate or be co-precipitated with iron and manganese. For this reason, field technicians must exercise care to avoid excessive turbulence or mixing with air during sample collection. Care must also be taken to avoid mixing air into sample as the sample containers are filled. Sample containers should be completely filled leaving no headspace in the containers and air bubbles should be purged to the greatest extent possible. Prior to collecting the sample, the bailer should be thorough decontaminated by triple rinsing with deionized water. Before filling the sample containers, they should be triple rinsed with water from the monitoring well or surface water being monitored. (7) Decontaminating Sampling Equipment Sampling equipment should be thoroughly decontaminated prior to collecting each sample. For collecting samples for inorganic analysis with a plastic or Teflon bailer, the bailer should be triple rinsed with deionized water. Periodically, or as needed, the bailer should be washed with inorganic detergent and thoroughly rinsed to remove any precipitated metals or dirt. Also, care should be taken to decontaminate the bailer cable and avoid contaminating it while collecting the sample. The cord should be made of materials that resist adsorbing dirt or water to limit cross-contamination from one well to another. (8) Filtering Water Samples It is strongly recommended that one 500 mL sample bottle from each location contain water that has been filtered in the field to remove suspended colloidal particles. This sample should be filtered through a 0.45 micron glass fiber filter cartridge using a paristaltic pump powered by a 12 V. automobile battery. The filtered sample should be preserved with concentrated nitric acid only after filtering. The filtered sample should be used for analyzing dissolved metals. Acidifying the samples prior filtering may dissolve suspended soil or clay particles from the drilling and well construction processes, thereby providing analytical test results that are not representative of actual conditions in the aquifer. (9) Preserving Water Samples To preserve the collected samples, the filtered bottle should be acidified with concentrated nitric acid and one unfiltered bottle should be acidified with concentrated sulfuric acid. One sample bottle

17 - 12
should be unfiltered and unacidified. The laboratory should provide small vials of acid preservatives with each sample bottle order. Only about 5 mL of concentrated acid is need to reduce the pH of the sample to less than 2 standard units. All samples should be placed in a cooler box and cooled to 4oC. The samples should be held at this temperature until they arrive at the laboratory and can be placed in a refrigerator. The purpose of keeping the samples at a low temperature is to retard the activity of microorganisms that could alter the samples’ chemistry. (10) Transporting Samples Samples should be transported to the analytical laboratory in cooler boxes to prevent being exposed to heat or sunlight. The sample chain-of-custody form should accompany the samples. This form must be signed and dated by each person who relinquishes and receives the samples on the trip to the laboratory. (11) Documenting Sample Collection Procedures Thorough and accurate documentation of all field monitoring activities is an important component of the monitoring program. Without adequate field documentation, it may be difficult or impossible to interpret and validate the laboratory data. All field records should be contained in a duplicating field book with numbered pages. Table 17.4 summarizes the minimum information that should be recorded in the field book for each monitoring event and sample collected. 17.1.8 Field and Laboratory Quality Assurance Methods Ensuring the quality of the collected data is a critical function of any water quality monitoring system. Therefore, it is important that a uniform quality assurance/quality control (QA/QC) procedure be followed during all field and laboratory activities. The required QA/QC protocols should be written into the SAP to ensure continuity. Effective QA/QC procedures are essential for interpreting and validating the data collected in the field and laboratory, as well as for ensuring the data are accurate and truly representative of environmental conditions. Implementing an effective QA/QC program requires that field technicians be properly trained in all sampling and decontamination methods. In addition, only those analytical testing laboratories with certified QA/QC programs in place should be used for analyzing the collected samples. The minimum recommended QA/QC procedures are summarized in Table E and are described in more detail as follows:

17 - 13
Table 17.4 Data Required for Documenting Field Activities For the Water Quality Monitoring Program in the Sohar Mine Area
General Information Sample-Specific Information
Date and time of all activities Names of field personnel Names of visitors or people contacted Description of location Weather conditions Instrument calibrations performed General field observations Deviations from SOPs, if any Chain-of-custody records
Date and time of sample collection Description of specific monitoring location Condition of monitoring location Well purging data
1) Type of equipment used 2) Volume of water purged 3) Criteria or purging
Sample collection data 4) Sampling equipment 5) Field identification number or code
Field-measured parameters 6) pH 7) Temperature 8) ORP 9) EC 10) Static water level
Sample appearance 11) Sample color 12) Turbidity 13) Visible sediments
Sample odors Sample containers
14) Number of containers collected 15) Type of containers 16) Size of containers
Sample filtration methods used Preservatives used Decontamination procedures performed Quality control samples or procedures
17) Field blanks 18) Trip blanks 19) Field duplicates
(1) Collecting Equipment Blank Samples At least one equipment blank sample should be collected for each day of field activities. To obtain an equipment blank sample, decontaminated sampling equipment is rinsed with de-ionized water and the rinsate is collected in sample bottles. The purpose of equipment blanks is to evaluate the effectiveness of field decontamination procedures performed by field personnel. Because de-ionized water contains no impurities, equipment blank samples should also contain no detectable impurities unless the equipment is improperly decontaminated. The blank sample is filtered, preserved, and transported to the laboratory in the same manner as all other samples. The equipment blank samples
17 - 14
should be labeled with a pre-determined code name to hide the fact from laboratory technicians that it is a blank sample. (2) Collecting Trip Blank Samples At least one trip blank sample should be submitted for laboratory analysis for each round of sampling. A trip blank is simply sample de-ionized water prepared in the laboratory and carried by the field personnel throughout the field sampling activities. The purpose of a trip blank is to evaluate any potential contamination that might occur during transport of the samples from the field to the laboratory. The equipment blank samples should be labeled with a pre-determined code name to hide the fact from laboratory technicians that it is a blank sample. (3) Collecting Field Duplicate Samples At least 1 duplicate sample should be submitted to the laboratory for every 20 samples collected in the field. The purpose of submitting duplicate samples is to check the accuracy and precision of laboratory analytical techniques by comparing the test results from two identical samples. A statistically significant difference in laboratory values between duplicate samples is an indicator of laboratory errors or imprecision. A statistically significant difference between two samples is defined as relative percent difference greater than some predetermined value, say 5 percent or 10 percent. Relative percent difference is defined, as follows: Relative percent difference = Sample A result – Sample B result x 100
Average of Sample A and Sample B (4) Analyzing Laboratory Blank Samples Laboratory blank samples are simply samples of deionized water that is handled, prepared, and analyzed the same as the actual samples. A laboratory blank is run to detect possible laboratory contamination. Analytical results from a good blank sample should indicate no detectable concentrations of the constituents of concern. At least one laboratory blank sample should be run for each batch of samples tested by the laboratory. If contaminants are detected in the blank sample, the source of contamination should be identified and remedied and all samples should be retested. (5) Analyzing Laboratory Duplicate Samples A laboratory duplicate is like a field duplicate, but is prepared in the laboratory by splitting a randomly selected field sample into two separate aliquots. The purpose of the laboratory duplicate is to allow the laboratory to self-monitor the precision or reproducibility of their analytical techniques. The test

17 - 15
results from duplicate samples should agree within an established tolerance. As with field duplicate samples, the relative percent difference is used to evaluate laboratory duplicates. (6) Analyzing Laboratory Spike Samples A spike sample is a sample to which known quantity of particular elements or compounds have been added. Spike samples are prepared and tested by the laboratory to evaluate the accuracy and precision of the laboratory’s testing methods and instruments. The test results from spike samples are evaluated in terms of the percentage of spiking compound that is recovered during analysis. The percent recovery for a spike sample is defined, as follows:
Percent Recovery = Spike result – Unspiked sample result x 100 Quantity of chemical added
(7) Validating Analytical Data Both field and laboratory data must be validated to ensure their quality by carefully examining and evaluating the QA/QC testing results. Generally, testing laboratories employ personnel trained in the evaluation of QA/QC results. Laboratory data validation personnel should be senior level chemists in charge of maintaining the quality of laboratory testing. The testing laboratory should provide a QA/QC report along with their report on the analytical testing results to allow the client to perform their own data validation procedures. Similarly, the ministries in charge of receiving the data and maintaining their quality should validate the data prior to entering the data into the database. Data that for one reason or another fail to meet QA/QC criteria should be identified by data qualifiers to inform subsequent analysts of possible problems with the data. 17.1.9 Establishing Record Keeping Protocols The SAP should establish strict and uniform record keeping protocols to ensure the integrity, accessibility, and usefulness of the data collected through the water quality monitoring program for the Sohar mine area. Table 17.5 summarizes the minimum recommended record keeping requirements.

17 - 16
Table 17.5 Recommended QA/QC Samples for Ongoing Water Quality Monitoring in the Sohar Mine Area
QA/QC Sample
Description Recommended
Frequency Purpose Evaluation
Method Validation Criterion
Trip Blank Samples
1 per day Detecting potential problems in handling and transporting samples in the field
Presence or absence of contaminants
No contaminants should be detected
Equipment Blank Samples
1 per day Detecting inadequacies in decontaminating field sampling equipment.
Presence or absence of contaminants.
No contaminants should be detected.
Field Duplicate Samples
1:20 or 5% Checking the precision of field and laboratory methods.
Relative percent
difference
Should be 5 % or less
Laboratory Duplicate Samples
1:10 or 10 %
Checking the precision of field and laboratory methods.
Relative percent difference
Should be 5 % or less
Laboratory Blank Samples
1 per sample batch
Detecting laboratory contamination.
Presence or absence of contaminants.
No contaminants should be detected.
Laboratory Spike Samples
1 per sample batch
Checking the accuracy and precision of laboratory methods.
Percent recovery
Should be between 90% and 110%.
17.1.10 Identifying Data Analysis and Interpretation Techniques Analyzing and interpreting water quality data is a complex subject requiring years of training and experience. For this reason, analysis and interpretation of the groundwater monitoring results should be performed by geochemists or engineers trained in the art and science of interpreting water quality data (Table 17.6). Some of the suggested techniques that could be used to analyze and interpret the groundwater quality data collected from the Sohar mine area include the following:
- Preparing various types of tabular presentations of the data for inspection and comparison; - Preparing iso-concentration maps to visually display the magnitude and extent of various
parameters; - Preparing time series displays for detecting trends and monitoring fate and transport of constituents
of concern using X-Y plots or histograms; - Creating displays of constituent concentrations as a function of distance from known sources or
relative to spatial milestones within the study area using X-Y plots or histograms; - Constructing tri-linear diagrams to compare waters from different locations or at different
times in order to evaluate similarities or dissimilarities between samples, i.e. to identify waters from different sources or to identify contaminated waters from natural waters.
- Conducting various statistical analyses to compare samples over time and space and to identify contaminated waters from non-contaminated. The subject of statistical analysis of water quality data is high complex and is beyond the scope of this report.

17 - 17
Table 17.6 Minimum Recommended Record Keeping Requirements for Ongoing Water Quality Monitoring in the Sohar Mine Area
Record Keeping Task Description Responsible Person
1. Establish a secure program filing system in the program managers office, including both paper and electronic filing systems and indexes. Files should be organized to facilitate record location by date, subject, and author.
Assistant program manager
2. Log all field notes and trip reports into the filing system, including field books and chain of custody forms.
Field manager
3. Receive and log in all analytical testing results from the laboratories.
Senior water quality specialist
4. Validate the analytical testing results and assign appropriate qualifiers to each datum.
Senior water quality specialist
5. Check and approve data validation results. Program manager 6. Enter qualified data into the existing water quality database. Assistant water quality
specialist 7. Check and approve data entry process. Senior water quality specialist8. File paper copies and electronic files containing laboratory data.
Assistant program manager
9. Prepare summary reports documenting the monitoring activities and results.
Senior water quality specialist
10. Check, approve and disseminate summary reports to other ministries and interested parties.
Program manager
11. Provide controlled access to monitoring data upon request from the public, water quality managers, and investigators.
Assistant program manager
17.2 Recommendations for Air Quality Monitoring System MMEW has established national ambient air quality monitoring stations in Oman, and OMCO has ten monitoring stations for ambient air quality within 10 km radius of the OMCO plant. 17.2.1 Current Monitoring System (1) MMEW MMEW has deployed monitoring stations for ambient air quality and meteorological parameters as shown in Table 17.7. MMEW has an on-line monitoring system for gaseous parameters consisting of continuous analyzers, power supply unit, telephone lines, transmitter and receiver. This equipment is installed in an air-conditioned housing. The monitoring results of 1999 are shown in Table 17.8. In the area surrounding the Sohar Mine sites, one monitoring point is located in Sohar Industrial Estate. This station was established in 1997. Monitored parameters at the station are SO2, wind speed, wind direction, air temperature and humidity. SO2 is monitored by an ultra violet fluorescent analyzer. The results of 24-hour average SO2 monitoring in 1999 at Sohar Industrial Estate Station were in the

17 - 18
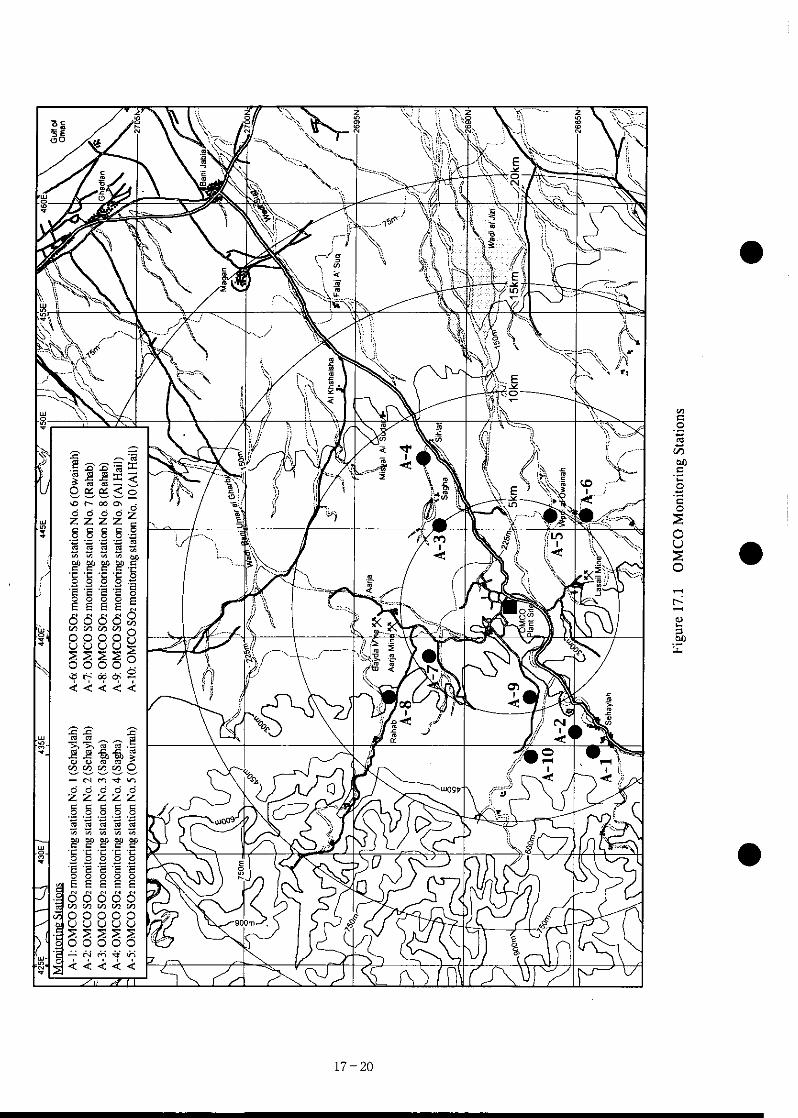
range of 0.024 ppm to 0.025 ppm. These concentrations are well below the US EPA ambient air quality standards (0.14 ppm) adopted as national ambient air quality standards of Oman. (2) OMCO OMCO has been conducting ambient SO2 monitoring on a regular basis at the following ten monitoring stations. The location of the ten monitoring stations is shown in Figure 17.1.
- No.1 : Suhaylah (10 km southwest from OMCO); - No.2 : Suhaylah (8 km southwest from OMCO); - No.3 : Sagha (5 km northeast from OMCO); - No.4 : Sagha (8 km northeast from OMCO); - No.5 : Wadi al Owainah (4 km southeast from OMCO); - No.6 : Wadi al Owainah (8 km south east from OMCO); - No.7 : Rahab (4 km north northwest from OMCO); - No.8 : Rahab (8 km north-northwest from OMCO); - No.9 : Al Hail (4 km southwest from OMCO); - No.10 : Al Hail (8 km southwest from OMCO).
SO2 concentrations in the ambient air are measured by using a sulfur dioxide sampler consisting air inlet, air outlet and electrolyte cell. An electrolyte solution made of analytical grade sulfuric acid (H2SO4), hydrogen peroxide (H2O2) and demineralized water fills the electrolyte cell. The SO2 concentration in the air passing through the solution is calculated based on the change in conductivity of the electrolyte after 24-hour air sampling. The results of 24-hour average SO2 monitoring from November of 1998 to October of 1999 were in the range of 11µg/m3 to 90 µg/m3 as shown in Table 17.9. These concentrations are well below the EEC ambient air quality standards (120 µg/m3) applied to OMCO.

17 - 19
Table 17.7 Monitoring Parameters Measured by MMEW
Monitored parameter Station Name /Location
SO2 NO2 HC PM10 Wind Speed
Wind Dir.
Air Temp. Humidity Others
MINA AL FAHAL X X X X X X O3
RUSAYL INDUSTRIAL ESTATE X X X X X X
SOHAR INDUSTRIAL ESTATE X X X X X
PM10 STATION AT RUWI X
PM10 STATION AT RUSAYL INDUSTRIAL ESTATE
PM10 STATON AT SUR X
PM10 STATION AT SALALAH X
SO2 Monitor API, U.S.A
NO2 Monitor API, U.S.A
HC Monitor HC51, FRANCE
PM10 Monitor GRASBY, U.S.A
O3 Monitor API, U.S.A
Table 17.8 Monitoring Result of 1999 Measured by MMEW
SO2 Concentration (PPB) PM10 Concentration(μg/m3) 1-hour Average 24-hour Average 1-hour Average 24-hour Average
Station Name / Location
Min. Max. Ave. Min. Max. Ave.
Annual Average Min. Max. Ave. Min. Max. Ave.
Annual Average
MINA AL FAHAL 24 25 24
RUSAYL INDUSTRIAL ESTATE(R.I.E)
SOHAR INDUSTRIAL ESTATE
7 32 20
PM10 STATION AT RUWI 34 178 106 PM10 STATION AT R.I.E 38 252 145
PM10 STATION AT SUR PM10 STATION AT SALALAH

17 - 21
Table 17.9 SO2 Monitoring Result by OMCO (1st November 1998 ~ 31st October 1999) (1) SO2:μg/m3
Site Number of Tests No.
Site A B C D E F G H I J K L M N O
1 10km SW Suhaylah 22 36 35 37 39 32 39 39 39 39 43 48 40 29 4
2 08km SW Suhaylah 25 40 35 36 39 30 39 39 39 39 45 48 36 31 18
3 05km NE Sagaha 29 47 34 37 37 36 39 39 43 36 47 46 39 34 21
4 08km NE Sagaha 31 53 31 35 37 37 38 39 43 36 45 45 40 32 5
5 04km SE Owainah 33 39 3 11 23
6 08km SE Owainah 33 38 3 9 6
7 04km NNW Rahab 18 30 45 44 44 36 38 41 39 38 45 49 37 27 21
8 08km NW Rahab 20 38 37 44 44 33 38 42 39 38 38 49 36 26 4
9 04km SW Al Hail 22 29 53 42 38 40 39 39 30 15
10 08km SW Al Hail 22 40 52 42 38 38 38 37 21 15
(2)
Site Arithmetric Average
No. Site
A B C D E F G H I J K L M N O 1 10km SW
Suhaylah 35 32 46 37 25 35 38 20 36 44 20 19 11 16 29
2 08km SW Suhaylah 41 43 51 63 43 46 43 34 55 70 43 49 43 47 21
3 05km NE Sagaha 69 61 39 46 53 48 43 34 68 65 69 62 59 45 36
4 08km NE Sagaha 26 41 40 39 26 39 35 18 35 42 47 46 51 38 33
5 04km SE Owainah 62 53 48 37 24
6 08km SE Owainah 29 24 25 27 15
7 04km NNW Rahab 28 30 60 56 44 38 49 38 63 66 58 59 59 46 37
8 08km NW Rahab 28 32 56 36 30 26 28 15 33 30 25 26 22 18 23
9 04km SW Al Hail 90 57 72 66 42 59 62 50 61 52
10 08km SW Al Hail 65 48 66 59 26 48 47 26 24 20
A 1985 (MAY 1985-FEB.1986) F 1st NOV. 1989-31st OCT.1990 K 1st NOV.1994-31st OCT.1995
B 1st NOV. 1985-31st OCT.1986 F 1st NOV. 1990-31st OCT.1991 K 1st NOV.1995-31st OCT.1996
C 1st NOV. 1986-31st OCT.1987 F 1st NOV. 1991-31st OCT.1992 K 1st NOV.1996-31st OCT.1997
D 1st NOV. 1987-31st OCT.1988 F 1st NOV. 1992-31st OCT.1993 K 1st NOV.1997-31st OCT.1998
E 1st NOV. 1988-31st OCT.1989 F 1st NOV. 1993-31st OCT.1994 K 1st NOV.1998-31st OCT.1999

17 - 22
17.2.2 Air Quality Monitoring Requirements This chapter presents requirements for air quality monitoring system of MMEW and OMCO based on the information obtained through the Study. At present, MMEW and OMCO have independent monitoring system within Sohar mine area. To accomplish ultimate goal of air quality monitoring, MMEW and OMCO have to not only fulfill their own role and responsibility sufficiently, but cooperate each other. In this chapter, air quality monitoring requirements for each body discussed separately as follows;
- Air quality monitoring requirements for MMEW - Air quality monitoring requirements for OMCO - Effective use of data monitored by MMEW and OMCO
(1) Air Quality Monitoring Requirements for MMEW a. Installation of New National Ambient Air Quality Monitoring Station MMEW has one (1) national ambient air quality station in Sohar mine area. It is located at inside of Sohar Industrial Estate, approximately more than 30km far from OMCO. The basic objective of this monitoring station is to monitor ambient air quality conditions possibly affected by emission from the existing factories/plants in the Industrial Estate. Therefore, another national ambient air quality monitoring station would be necessary in order to monitor impact of stack emission from OMCO. Based on the study results, the JICA team recommends installation of another national ambient air quality monitoring station as follows:
1) Location Location of monitoring station strongly influences successful ambient air quality monitoring. Generally, ambient air quality monitoring station is necessary to represent air quality condition in target area and contributes to protect human health of residents. To satisfy these requirements, the following items are necessary to be taken into consideration for the selection of the additional national ambient air quality monitoring stations in Sohar mine area. i) Condition of emission: location of emission source, emission condition of air pollutants,
meteorology ii) Condition of receptor: location of residential areas, location of sensitive receptors, presently
recognized air quality deterioration iii) Condition of maintenance: accessibility, sustainability, prevention of vandalism The consideration of above conditions on OMCO plant site is summarized as follows;
17 - 23
i) Condition of emission Air dispersion simulation of Sohar mine area was performed as part of the Study by using ISCST3. The results of air dispersion simulation model deemed to be the most appropriate indicator of emission conditions because the results of the simulation reflect emission source condition of OMCO stack and site-specific meteorology of the Sohar mine area. Therefore, ground level air pollutant concentration predicted by the ISCST3 simulation model is used as basic data of emission condition. ii) Condition of receptor There are 5 major residential areas within a 10 km radius of OMCO, e.g., Sagha, Aarja, Rahab and Suhaylah. Population of these residential areas is rather small, less than 100 people live in Sagha, Aarja, Rahab each. And approximately 360 people live in Suhaylah. Beside this, there is a school in Rahab and Suhaylah. Now, considering presently recognized air quality conditions, Interview survey carried out in November 2000 as part of the Study indicated that some residents living in Sohar mine area recognized kind of air quality conditions including difficulty in breathing, cough and respiratory problems. Especially, it is recognized that some residents (especially women and children) living in Aarja, Rahab and Suhaylah suffered asthma and respiratory symptom. iii) Condition of maintenance Condition of maintenance is necessary to be considered unless it does not influence on monitoring data quality. In Sohar mine area, accessibility deems important because traffic road condition is not so good. There are narrow unpaved roads connecting residential areas excluding one highway from Faraj al Qabail. Hence, in order to retain easy accessibility, the monitoring station should be installed in residential area. As too much proximity to housings, risk of vandalism should be avoided to reduce. As a conclusion, either of the following is recommended for an appropriate location;
- Aarja; - Rahab; and - Suhaylah.
2) Parameter Monitoring parameters of national ambient air quality monitoring station should be selected based on the national regulation and objective of the monitoring station. Regarding regulations, Oman has not yet established national ambient air quality standards. Hence,
17 - 24
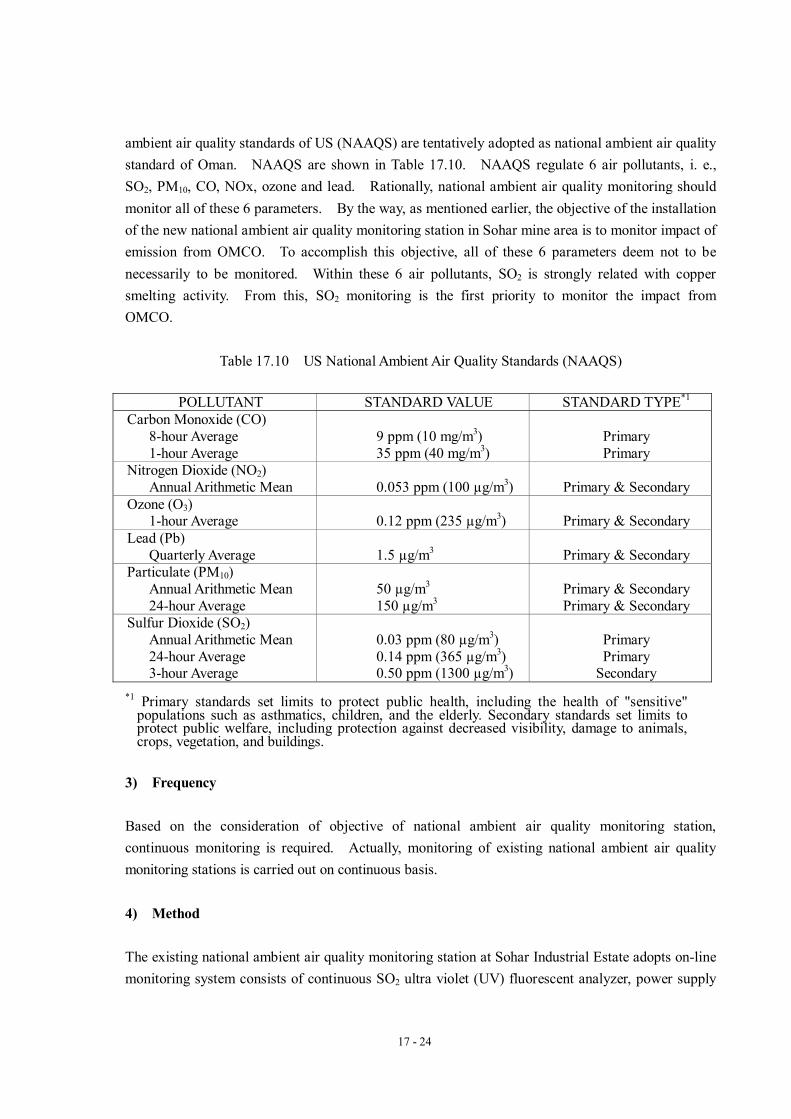
ambient air quality standards of US (NAAQS) are tentatively adopted as national ambient air quality standard of Oman. NAAQS are shown in Table 17.10. NAAQS regulate 6 air pollutants, i. e., SO2, PM10, CO, NOx, ozone and lead. Rationally, national ambient air quality monitoring should monitor all of these 6 parameters. By the way, as mentioned earlier, the objective of the installation of the new national ambient air quality monitoring station in Sohar mine area is to monitor impact of emission from OMCO. To accomplish this objective, all of these 6 parameters deem not to be necessarily to be monitored. Within these 6 air pollutants, SO2 is strongly related with copper smelting activity. From this, SO2 monitoring is the first priority to monitor the impact from OMCO.
Table 17.10 US National Ambient Air Quality Standards (NAAQS)
POLLUTANT STANDARD VALUE STANDARD TYPE*1 Carbon Monoxide (CO) 8-hour Average 1-hour Average
9 ppm (10 mg/m3) 35 ppm (40 mg/m3)
Primary Primary
Nitrogen Dioxide (NO2) Annual Arithmetic Mean
0.053 ppm (100 µg/m3)
Primary & Secondary
Ozone (O3) 1-hour Average
0.12 ppm (235 µg/m3)
Primary & Secondary
Lead (Pb) Quarterly Average
1.5 µg/m3
Primary & Secondary
Particulate (PM10) Annual Arithmetic Mean 24-hour Average
50 µg/m3 150 µg/m3
Primary & Secondary Primary & Secondary
Sulfur Dioxide (SO2) Annual Arithmetic Mean 24-hour Average 3-hour Average
0.03 ppm (80 µg/m3) 0.14 ppm (365 µg/m3) 0.50 ppm (1300 µg/m3)
Primary Primary
Secondary *1 Primary standards set limits to protect public health, including the health of "sensitive"
populations such as asthmatics, children, and the elderly. Secondary standards set limits to protect public welfare, including protection against decreased visibility, damage to animals, crops, vegetation, and buildings.
3) Frequency Based on the consideration of objective of national ambient air quality monitoring station, continuous monitoring is required. Actually, monitoring of existing national ambient air quality monitoring stations is carried out on continuous basis. 4) Method The existing national ambient air quality monitoring station at Sohar Industrial Estate adopts on-line monitoring system consists of continuous SO2 ultra violet (UV) fluorescent analyzer, power supply

17 - 25
unit, telephone line, transmitter and receiver. Ambient SO2 are automatically monitored and collected data are sent to MMEW head office by on-line system. Similar system of Sohar Industrial Estate should be adopted for the newly installed ambient air quality monitoring station in Sohar mine area because the system is latest and familiar to MMEW.
b. Installation of New Meteorological Monitoring Station Meteorological condition strongly influences on dispersion of air pollutants. Therefore, local meteorological condition is necessary to be monitored. Besides this role of basic information, meteorological data have the following usage;
- Prediction of alert day: some meteorological condition, e.g. inversion layer, brings incredibly high ground level air pollutant concentration. Such high level of air pollutant concentration may cause health impairment to local residents. To protect human health and alert residents, it is necessary to understand the correlation between meteorological condition and ground level air pollution concentration in residential area.
- Construction of air dispersion simulation model: air dispersion simulation model is an effective tool for air pollution dispersion prediction.
- To construct simulation model specified to target area, local meteorological data area.
1) Location Meteorological monitoring should be performed at the location adjacent to air quality monitoring station because meteorological data are necessary to be analyzed on correlation with air quality monitoring data. In addition, the following factors should be taken into consideration;
- Topography/obstacles: meteorological data must reflect general meteorological condition of the target area. For this reason, locations having unusual topography or adjacent obstacle are inadequate for meteorological monitoring station.
- Accessibility: Good accessibility to monitoring station makes maintenance easy. - Protection against vandalism
National ambient air quality station in Sohar Industrial Estate not only monitor air pollutant, but meteorological parameters. This system is one of the best systems because of availability of good correlation between air quality data and meteorological data, and convenience of management. As a conclusion, meteorological monitoring should be carried out at same location as the new national ambient air quality monitoring station in Sohar mine area. 2) Parameter Within meteorological parameters, wind speed and direction are most important ones since it
17 - 26
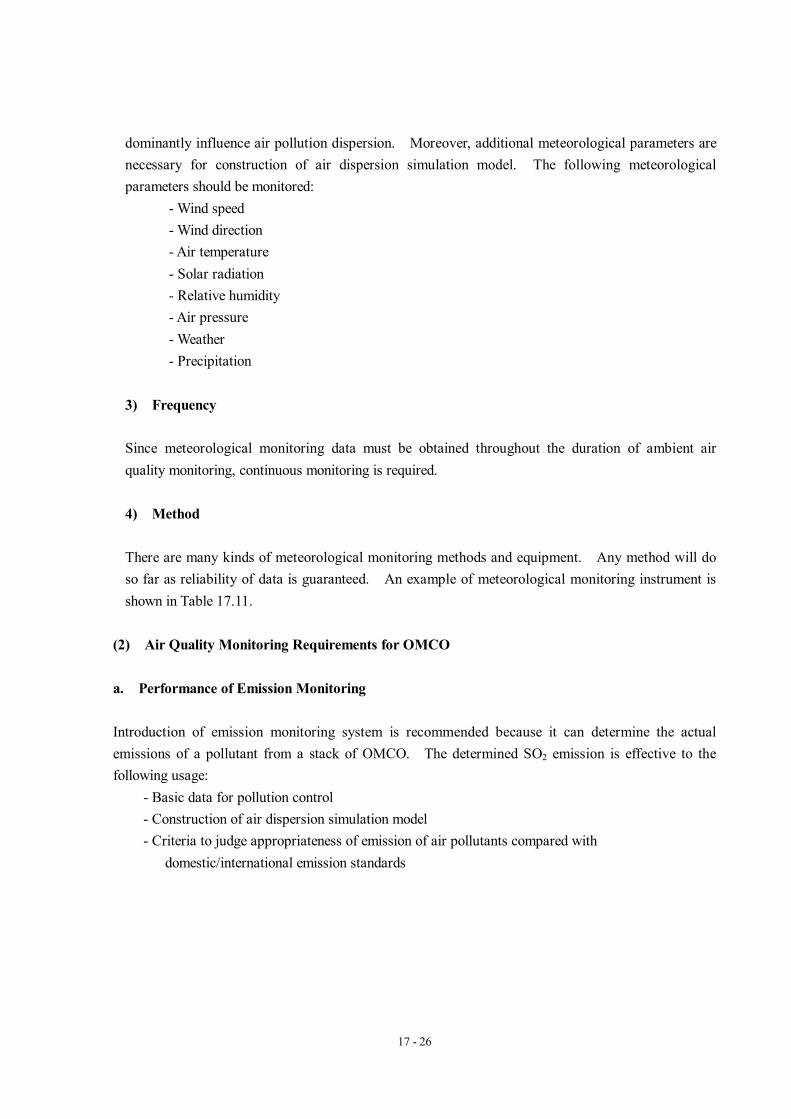
dominantly influence air pollution dispersion. Moreover, additional meteorological parameters are necessary for construction of air dispersion simulation model. The following meteorological parameters should be monitored:
- Wind speed - Wind direction - Air temperature - Solar radiation - Relative humidity - Air pressure - Weather - Precipitation
3) Frequency Since meteorological monitoring data must be obtained throughout the duration of ambient air quality monitoring, continuous monitoring is required. 4) Method There are many kinds of meteorological monitoring methods and equipment. Any method will do so far as reliability of data is guaranteed. An example of meteorological monitoring instrument is shown in Table 17.11.
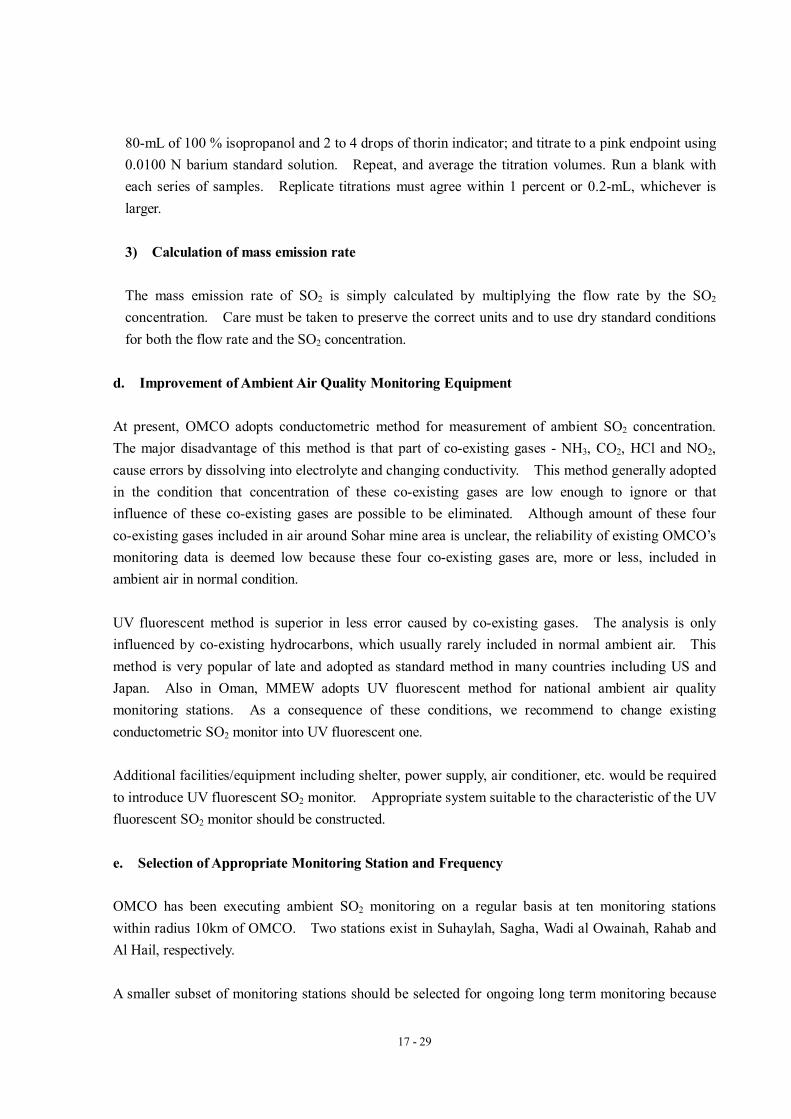
(2) Air Quality Monitoring Requirements for OMCO a. Performance of Emission Monitoring Introduction of emission monitoring system is recommended because it can determine the actual emissions of a pollutant from a stack of OMCO. The determined SO2 emission is effective to the following usage:
- Basic data for pollution control - Construction of air dispersion simulation model - Criteria to judge appropriateness of emission of air pollutants compared with
domestic/international emission standards

17 - 27
Table 17.11 Example of Meteorological Monitoring Instrument
Meteorological Parameter Monitoring Instrument Wind speed - cup anemometer
- wind mill anemometer - combined recording wind vane and fan-anemograph
Wind direction - wind vane - combined recording wind vane and fan-anemograph
Air temperature - platinum resistance thermometer - double tube thermometer - bimetal thermograph
Solar radiation - thermopile pyrholimeter - bimetallic pyranometer
Relative humidity - polymer resister sensor - ventilated psychrometer - hair hygrometer
Air pressure - fortan marcury barometer - aneroid barometer
Weather N/A Precipitation - tipping bucket rain gauge
- reserving rain gauge Actual SO2 emission monitoring is performed by stack test. The stack test includes three main parts: determination of stack gas flow rate, determination of constituent concentration, and calculation of mass emission rate. Each of these parts is explained below, which is mainly based on USEPA method: Appendix A of Chapter 40, subpart 60, of the Code of Federal Regulations (CFR). b. Determination of stack gas flow rate The flow rate of stack gas is calculated from the continuity equation Q = VA, where Q is the flow rate, V is the velocity of the stack gas, and A is the cross-sectional area of the stack. The velocity of the stack gas is calculated from the average velocity pressure using Bernoulli’s equation in the form VP = ρV2/(2g), where VP is the velocity pressure, ρ is the stack gas density, and V is the velocity. The velocity pressure is measured with Pitit tube at several locations in the cross section of the stack. These measurements are used to determine the average velocity pressure. The stack gas density is calculated from the volumetric percentage of oxygen, carbon monoxide, carbon dioxide, and nitrogen present in the stack gas. These constituents make up the vast majority of the volume of most stack gases, and they can therefore be used to determine a weighted-average molecular weight. The molecular weight of the stack gas is converted to density by using the perfect gas relationship that mole of any gas occupies the same volume at standard conditions. The velocity pressure and density are then substituted into the above equation to calculate the velocity of the stack gas. The velocity and cross-sectional area are

17 - 28
then substituted into the continuity equation to obtain the actual volumetric flow rate. c. Determination of Constituent Concentration SO2 concentration can be determined by analyzer method and wet method. The analyzer method produces a volumetric concentration by drawing stack gas into analyzer. Whereas, wet method are characterized by scrubbing constituent gases out of a known volume of stack gas. The mass of constituent collected is then measured by chemical analysis. The outline of each method is described below.
1) Analyzer Method (Method 6C) i) Principle
A gas sample is continuously extracted from a stack, and a portion of the sample is continuously extracted from a stack, and a portion of the sample is conveyed to an instrumental analyzer for determination of SO2 gas concentration using an ultraviolet, nondispersive infrared (NDIR), or fluorescence analyzer.
ii) Apparatus iii) Gas analyzer
an UV or NRIR absorption or fluorescence analyzer is used to determine continuously the SO2 concentration in the sample gas stream. A means of controlling the analyzer flow rate and device for determining proper sample flow rate (e.g., precision rotameter, pressure gauge downstream of all flow controls, etc.) shall be provided at the analyzer.
iv) Data recorder A strip-chart recorder, analog computer, or digital recorder is needed for recording measurement data. The data recorder resolution (i.e., readability) shall be 0.5 percent of span. Alternatively, a digital or analog meter having a resolution of 0.5 percent of span may be used to obtain the analyzer responses, and the readings shall be obtained at equally spaced intervals over the duration of the sampling ran.
2) Wet Method (Method 6) - Principle:
A gas sample is extracted from the sampling point in the stack. The sulfuric acid mist (including sulfur trioxide) and the SO2 are separated. The SO2 fraction is measured by the barium-titration method.
- Sample analysis procedure Transfer the contents of the storage container to a 100-mL volmetric flask, and dilute to exactly 100 mL with water. Pipette a 20-mL aliquot of this solution into a 250-mL Elrenmeyer flask; add
17 - 29
80-mL of 100 % isopropanol and 2 to 4 drops of thorin indicator; and titrate to a pink endpoint using 0.0100 N barium standard solution. Repeat, and average the titration volumes. Run a blank with each series of samples. Replicate titrations must agree within 1 percent or 0.2-mL, whichever is larger. 3) Calculation of mass emission rate The mass emission rate of SO2 is simply calculated by multiplying the flow rate by the SO2 concentration. Care must be taken to preserve the correct units and to use dry standard conditions for both the flow rate and the SO2 concentration.
d. Improvement of Ambient Air Quality Monitoring Equipment At present, OMCO adopts conductometric method for measurement of ambient SO2 concentration. The major disadvantage of this method is that part of co-existing gases - NH3, CO2, HCl and NO2, cause errors by dissolving into electrolyte and changing conductivity. This method generally adopted in the condition that concentration of these co-existing gases are low enough to ignore or that influence of these co-existing gases are possible to be eliminated. Although amount of these four co-existing gases included in air around Sohar mine area is unclear, the reliability of existing OMCO’s monitoring data is deemed low because these four co-existing gases are, more or less, included in ambient air in normal condition. UV fluorescent method is superior in less error caused by co-existing gases. The analysis is only influenced by co-existing hydrocarbons, which usually rarely included in normal ambient air. This method is very popular of late and adopted as standard method in many countries including US and Japan. Also in Oman, MMEW adopts UV fluorescent method for national ambient air quality monitoring stations. As a consequence of these conditions, we recommend to change existing conductometric SO2 monitor into UV fluorescent one. Additional facilities/equipment including shelter, power supply, air conditioner, etc. would be required to introduce UV fluorescent SO2 monitor. Appropriate system suitable to the characteristic of the UV fluorescent SO2 monitor should be constructed. e. Selection of Appropriate Monitoring Station and Frequency OMCO has been executing ambient SO2 monitoring on a regular basis at ten monitoring stations within radius 10km of OMCO. Two stations exist in Suhaylah, Sagha, Wadi al Owainah, Rahab and Al Hail, respectively. A smaller subset of monitoring stations should be selected for ongoing long term monitoring because
17 - 30
the Study indicated that northeastern area of OMCO, which identified with windward of locally dominant wind, scarcely influenced by stack emission from OMCO. The reduction of monitoring station also contributes to reduce monitoring cost. We recommend OMCO execute air quality monitoring at the following 3 stations;
- Rahab (A-8) - Suhaylah (A-2) - Magan
Rahab and Suhaylah, which located southwest of OMCO plant (leeward of locally dominant wind), deem to be best monitoring station to monitor the influence of stack emission from OMCO on ambient air. Whereas, Magan, which located 20km far from OMCO plant, plays the role of background air quality monitoring station. On the other hand, OMCO is executing monitoring on regular basis, i.e., once or twice a month (continuous 24 hours). We recommend monitoring should be executed on continuous basis since dispersion of air pollutant apt to be influenced by wind direction and wind speed, which change easily every moment. In order to understand air dispersion mechanism in Oman mining area and make up effective measure for protection of human health and environment, continuous monitoring is deemed necessary. (3) Effective Use of Data Monitored by MMEW and OMCO In the above sections, we discussed requirement of monitoring system of MMEW and OMCO. In this section, we consider some way to the best use of ambient air quality monitoring data measured by MMEW and OMCO. The main objective of ambient air quality monitoring of MMEW is lookout emission from OMCO. MMEW has legal power to give instruction and impose penalty if OMCO’s activity concerning air emission is deemed inappropriate. Whereas, OMCO’s main objective of ambient air quality monitoring is self-check of emission so as not to violate regulatory requirement. Because of this difference of monitoring objective, the monitoring of MMEW and OMCO should be carried out independently and in a state of tension. Nevertheless, Sharing of data monitored surely produce much more advantage about air pollution control. Combination of air quality monitoring data makes it possible to clarify detailed air dispersion mechanism. It naturally contributes to improvement of emission control measure of OMCO, and review and improvement regulatory requirement of MMEW. In future planning of monitoring system, both MMEW and OMCO should take into consideration mutual use of monitoring data.

CHAPTER 18 ENVIRONMENTAL MANAGEMENT SYSTEM

18 - 1
CHAPTER 18 ENVIRONMENTAL MANAGEMENT SYSTEM 18.1 Recommendations for Water Quality Management System 18.1.1 Recommendations for Maintaining Current Water Quality Standards The JICA Team recommends no changes in Oman’s current wastewater discharge and drinking water standards. The current Omani standards are consistent with world standards and, in some cases, are more stringent that US Environmental Protection Agency (USEPA) standards. No changes to the current wastewater discharge limits are recommended because the current limits are technology-based and represent the best standards achievable using readily available treatment technology. Making these regulations more stringent may not be realistic because the treatment technology needed to achieve higher pollutant removal levels may not be available or may be too costly. Any changes made to the numerical discharge limits are likely to have an economic impact that should be thoroughly evaluated prior to changing the regulations. Likewise, the JICA Team recommends no changes to Oman’s drinking water standards. In the Team’s opinion, Oman’s current standards appear adequately protective of human health, are consistent with WHO standards, and are even more stringent that USEPA standards for some contaminants. Yet, the current standards are reasonably achievable using readily available water treatment technologies. 18.1.2 Recommendations for Strengthening Oman’s Water Quality Management System (1) Liaison Between DGM and MMEW The JICA Team’s work on the Wadi Suq water quality project revealed a desire on the part of the Directorate General of Minerals (DGM) in the Ministry of Commerce and Industry (MCI) to work and communicate more closely with MMEW on mineral development projects. Therefore, the JICA Team recommends that a permanent liaison position be created within DGM to foster coordination and cooperation between MCI and MMEW. The purpose of the liaison would be to address water quality concerns and other environmental issues on mineral development projects by working in close association with MMEW personnel. The liaison would facilitate better communication and solutions to environmental issues by being part of both MCI and MMEW staffs with the ultimate purpose of protecting scarce water resources during mineral development projects and preventing contamination, such as that now existing in Wadi Suq. It is recommended that the person chosen for the liaison position should have experience in both environmental and mineral development projects.

18 - 2
(2) Hazardous Waste Disposal Facilities To protect water quality, industrialized nations need secure facilities in which to dispose of hazardous wastes generated by industrial facilities. The generation, transport, storage, treatment, and disposal of hazardous wastes in Oman is governed by Ministerial Decision No. 18/93, entitled Regulations for the Management of Hazardous Wastes. However, according to MMEW personnel, Oman has no hazardous waste disposal facilities. If this is true, then Oman’s water resources may be at risk from improper disposal of hazardous wastes, i.e. disposal in unlined or otherwise insecure landfills. To prevent potential groundwater contamination from improper disposal of hazardous waste, the JICA Team recommends investigating the potential risks to water quality and human health and performing a feasibility study for constructing a national system of hazardous waste disposal sites. (3) National Contingency Plan The JICA Team’s study revealed no evidence of a regulatory framework for requiring companies to mitigate environmental contamination that occurred in Oman in the past. Groundwater pollution in the Sohar Mining District is an example of the impacts that past mining and industrial activities can have on water quality by releasing hazardous substances to the environment. In addition, Oman’s reliance on oil production, transport, and refining makes it essential to have a nation-wide system in place for responding to emergencies involving releases of oil or other hazardous substances. The USEPA’s National Oil and Hazardous Pollution Contingency Plan (NCP) could serve as a model for a similar plan for Oman. The NCP is authorized under the U.S. laws known as the Comprehensive Environmental Response, Compensation, and Liability Act (CERCLA) and the Clean Water Act (CWA). CERCLA regulations are presented in Title 40 of the U.S. Code of Federal Regulation, Part 300. For reference, a copy of the NCP is attached as an appendix to this report. The purpose of the NCP is to establish a plan for dealing with releases of oil or hazardous pollutants that has occurred either in the past or in the present. The provisions contained in these regulations include the following:
- The NCP spells out the duties, responsibilities, and authorities of governmental and non-governmental entities regarding oil or hazardous pollutant releases. CERCLA regulations require cooperation between government agencies and establish an organizational framework for planning and coordinating response operations. These regulations also authorize national, regional, and local response teams to prepare plans for coordinating a phased approach to releases of oil and hazardous pollutants.
- The NCP establishes a phased approach for responding to oil and hazardous pollutant emergencies.
- The separate phases of a response under CERCLA are as follows:

18 - 3
1) Phase I – Discovering or notifying the response centers of a release 2) Phase II – Performing a preliminary assessment of the release 3) Phase III – Implementing containment, countermeasures, clean up, and disposal of the
released materials 4) Phase IV – Documenting the actions taken and recovering costs.
- CERCLA requires any entity responsible for a release of oil or hazardous pollutant to report the
release to a regional or state response center. Failure to report releases is considered a criminal offense. The regulations contain specific definitions of what constitutes a reportable release for thousands of different chemicals.
- If a release is discovered, the NCP spells out a detailed procedures addressing the release, as follows:
1) assessing the release; 2) initiating time-critical or non-time critical removal actions; 3) evaluating the site for listing on a National Priorities List (NPL); 4) conducting remedial investigations and feasibility studies for clean up; 5) establishing criteria for site remediation; and 6) assessing the cost of clean up and paying for natural resource damages.
- Perhaps most importantly, the NCP assesses liability for oil and hazardous materials releases and
authorizes the USEPA to recover the cost of cleaning up the release from the responsible parties. In the U.S., these regulations have been used successfully to recover clean up costs for releases that occurred many years, even decades in the past.
MMEW has established national ambient air quality monitoring stations in Oman, and OMCO has ten monitoring stations for ambient air quality within 10 km radius of the OMCO plant.
18.2 Recommendations for Air Quality Management System 18.2.1 Current Management System (1) MMEW The government of Oman establishes emission standards for air pollutants under “Regulations for Air Pollution Control from Stationary Sources”. The regulations prescribe numerical emission standards for dirt and dust emitted from the scheduled works including copper works. The emission standards for copper works are as follows:
- Total particulates : 0.200 g/m3; - Copper compounds, as copper : 0.100 g/m3; - Zinc compounds, as zinc : 0.100 g/m3;

18 - 4
- Cadmium compounds, as cadmium: 0.020g/m3, the mass rate of emission from the site shall not exceed 1.0 kg/h calculated as cadmium;
- Lead or its compounds, as lead: 0.030 g/m3, the mass rate of emission from the site shall not exceed 3.0 kg/h calculated as lead.
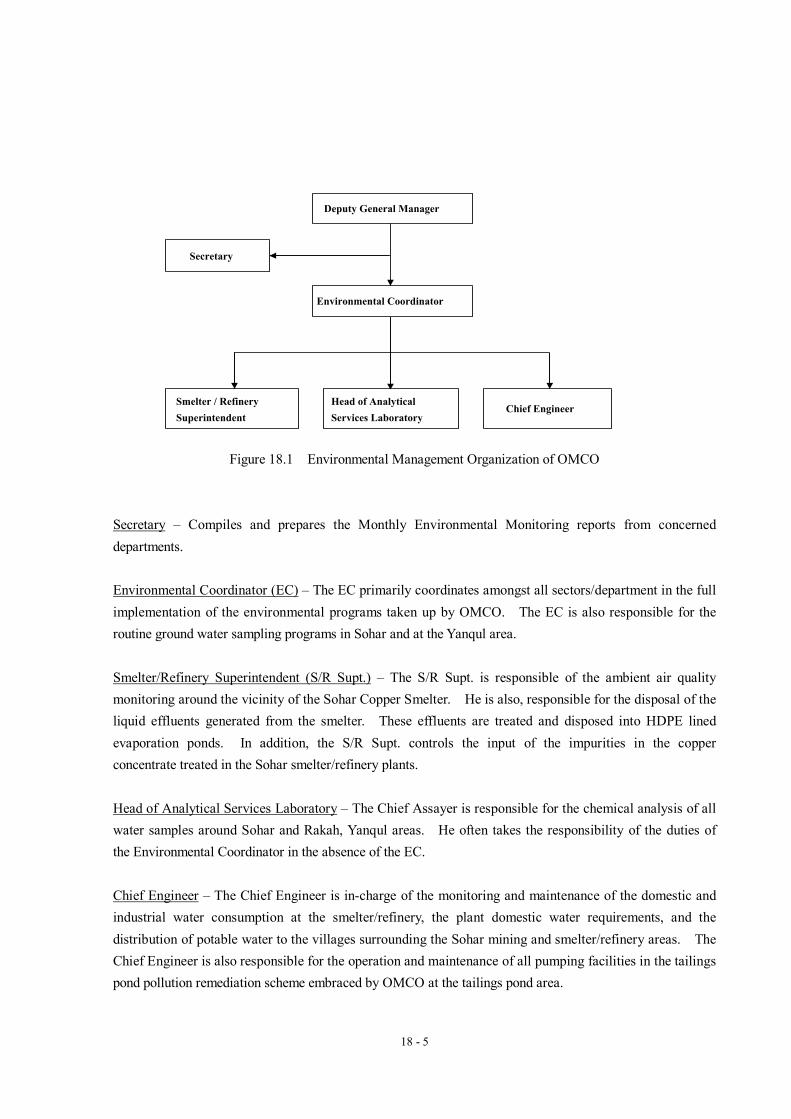
Regarding SO2 emission, the regulations prescribe that “Best Practicable Measures” approved the Ministry shall be used. However, ambient air quality standards have not yet been established. The US EPA ambient air quality standards are currently adopted for Oman ambient air quality standards. However, the more stringent EEC standard of SO2 is applied to OMCO. The Air & Noise Pollution Control Section of MMEW headquarters is responsible for all matters pertaining to air quality management. This section has a staff of seven people, one manager, five air & noise inspectors and one clerk. MMEW has seven regional offices; total number of staff is approximately 70 people. The roles and functions of the regional office are to deal with environmental problems including air, water, marine, soil and waste. The staff of the regional office assigned as a general environmental specialist performs these activities of the regional offices. An air quality specialist has not been assigned to the regional offices. MMEW make it obligatory for existing large scale factories having air pollution sources, such as OMCO and a lead-acid battery plant to monitor air quality. MMEW requests new facilities to submit an Environmental Impact Assessment (EIA) for new projects. The Air & Noise Pollution Control Section review the EIA to identify emission sources. Based on the review results, monitoring requirements including location, parameter, frequency, record keeping, report submittal are determined as conditions of permit of the new factory construction and operation. MMEW keep paper monitoring reports submitted from factories and data of national ambient air quality monitoring stations. MMEW do not publish an annual report on air quality. MMEW undertakes factory inspection to provide guidance, advice and recommendations for pollution control. In case violations are found, MMEW can punish the factory according to the penal regulations including a fine and suspension of operation. (2) OMCO OMCO has established an environmental management system to deal with environmental issues. The organization of environmental management is shown in Figure 18.1. The roles and responsibilities of each section are as follows: Deputy General Manager (DyGM) – Overall Head of the Environmental management at OMCO. DyGM defines the environmental concerns embraced by OMCO. The DyGM also sets-out the priorities of all environmental endeavors taken-up by OMCO and finally, he is the contact person deputed by OMCO on issues concerning the protection, monitoring and preservation of the environment.
18 - 5
Figure 18.1 Environmental Management Organization of OMCO Secretary – Compiles and prepares the Monthly Environmental Monitoring reports from concerned departments. Environmental Coordinator (EC) – The EC primarily coordinates amongst all sectors/department in the full implementation of the environmental programs taken up by OMCO. The EC is also responsible for the routine ground water sampling programs in Sohar and at the Yanqul area. Smelter/Refinery Superintendent (S/R Supt.) – The S/R Supt. is responsible of the ambient air quality monitoring around the vicinity of the Sohar Copper Smelter. He is also, responsible for the disposal of the liquid effluents generated from the smelter. These effluents are treated and disposed into HDPE lined evaporation ponds. In addition, the S/R Supt. controls the input of the impurities in the copper concentrate treated in the Sohar smelter/refinery plants. Head of Analytical Services Laboratory – The Chief Assayer is responsible for the chemical analysis of all water samples around Sohar and Rakah, Yanqul areas. He often takes the responsibility of the duties of the Environmental Coordinator in the absence of the EC. Chief Engineer – The Chief Engineer is in-charge of the monitoring and maintenance of the domestic and industrial water consumption at the smelter/refinery, the plant domestic water requirements, and the distribution of potable water to the villages surrounding the Sohar mining and smelter/refinery areas. The Chief Engineer is also responsible for the operation and maintenance of all pumping facilities in the tailings pond pollution remediation scheme embraced by OMCO at the tailings pond area.
Chief Engineer Smelter / Refinery Superintendent
Head of Analytical Services Laboratory
Secretary
Deputy General Manager
Environmental Coordinator
18 - 6
18.2.2 Requirement for Environmental Management System for Air Quality The JICA team reviewed existing air quality management system and activity of MMEW and OMCO as part of the Study. In order to improve existing system and to make it more appropriate and sufficient one, some recommendations to each body are described in the following sections; (1) MMEW a. Establishment of National Ambient Air Quality Standards The government of Oman has not yet established national ambient air quality standards. US EPA ambient air quality standards (NAAQS) are tentatively used as a substitute for ambient air quality standards of Oman. MMEW should prepare national ambient air quality standards because it is one of the most important bases of planning national policy for air quality management. The ambient air quality standards should satisfy mainly two factors, i.e., international acceptability and compliance with domestic environmental/socioeconomic conditions. For reference, regulatory ambient air quality standard of US and Japan and standard recommended in guideline of World Bank and WHO is shown in Table 18.1. b. Strengthen National Ambient Air Quality Monitoring Network At present, MMEW has total 7 national ambient air quality monitoring stations. The parameters monitored at each monitoring station are limited, and each parameter is monitored at less than 3 stations. A larger subset of monitoring stations should be equipped in order to understand national ambient air quality condition sufficiently, and to prepare necessary measure. The number of national ambient air quality monitoring station of US, Japan and UK is shown in Table 18.2 for reference. On the other hand, as mentioned above, NAAQS is tentatively used as a substitute for ambient air quality standards of Oman. The NAAQS provides 6 air pollutants, that is, SO2, PM10, CO, NOx, ozone and lead. Rationally, all of these 6 parameters should be measured at national ambient air quality monitoring stations. Nevertheless, existing national ambient air quality monitoring stations does not measure CO and lead among these 6 parameters. It is recommended CO and lead should be measured at national ambient air quality monitoring stations.


18 - 8
Table 18.2 Number of National Ambient Air Quality Monitoring Stations
of US, Japan and UK
Name of Country Number of National Ambient Air Quality Monitoring Stations
US 2,627 (Year 2000)
Japan 2,138 (Year 1998)
UK >1,500 (Year 1998) c. Improvement of National Emission Standards for Copper Smelter The government of Oman establishes emission standards of air pollutants under “Regulations for Air Pollution Control from Stationary Sources”. Table 18.3 shows comparison of copper smelter emission standard of Oman with ones of World Bank. From this comparison, all the standard values of Oman are higher than World Bank and Japan standards. This might indicate that the emission standards of Oman are not internationally acceptable level. It is recommended that MMEW make the national emission standard more stringent in the future. Furthermore, the government of Oman does not regulate SO2 standard for copper smelting work, which World Bank and Japan do. SO2 should be added to emission standard of Oman for copper smelter because usually much SO2 is emitted from copper smelting work. d. Development of Database System MMEW execute ambient air quality monitoring at national monitoring stations. In addition, MMEW has been receiving a great deal of monitoring reports from enterprises all over the country. At present, MMEW only reviews these monitoring data/reports and keep them by filing. Although, development of database system of the data/reports gathered in MMEW will certainly contribute to air quality management policy planning. The database system should include the following items:
- Ambient air quality data measured at national ambient air quality monitoring station - Statistic evaluation of monitoring data - Monitoring data measured by enterprises
Although development of database system usually requires relatively high initial cost, it deems to pay in the long run because the advantage derived from the database system becomes more and more great in accordance with accumulation of data.
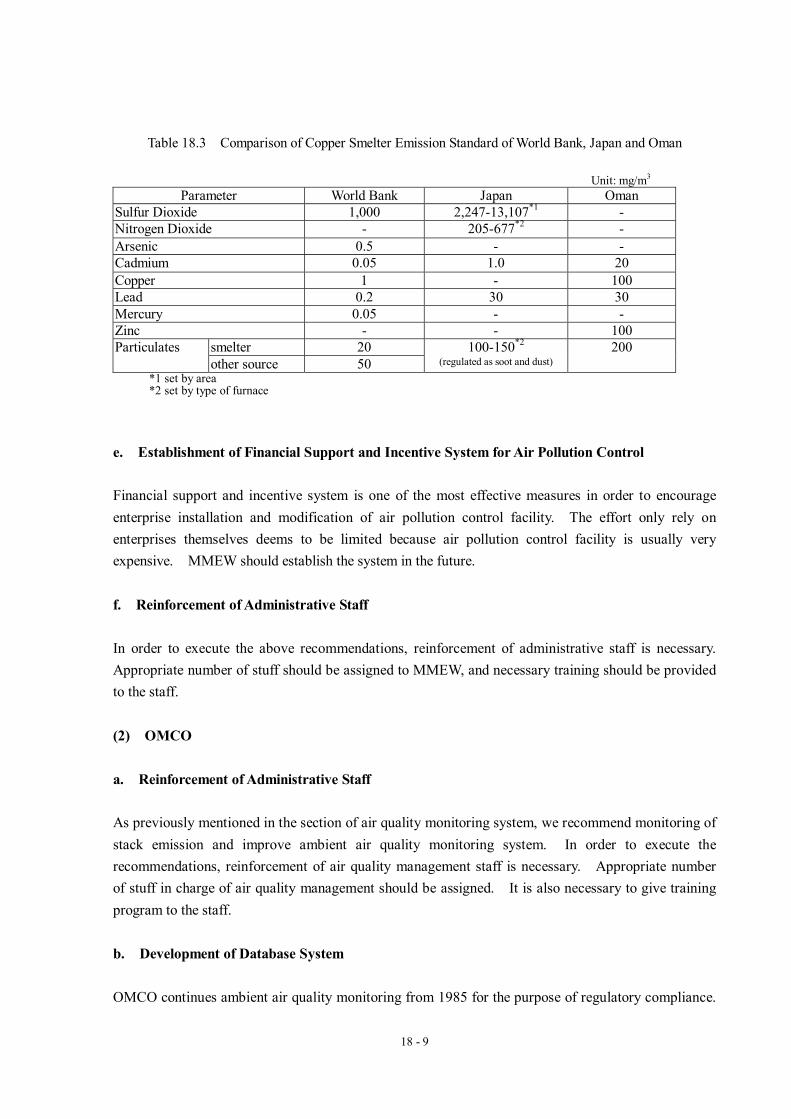
18 - 9
Table 18.3 Comparison of Copper Smelter Emission Standard of World Bank, Japan and Oman
Unit: mg/m3 Parameter World Bank Japan Oman
Sulfur Dioxide 1,000 2,247-13,107*1 - Nitrogen Dioxide - 205-677*2 - Arsenic 0.5 - - Cadmium 0.05 1.0 20 Copper 1 - 100 Lead 0.2 30 30 Mercury 0.05 - - Zinc - - 100
smelter 20 Particulates other source 50
100-150*2 (regulated as soot and dust)
200
*1 set by area *2 set by type of furnace
e. Establishment of Financial Support and Incentive System for Air Pollution Control Financial support and incentive system is one of the most effective measures in order to encourage enterprise installation and modification of air pollution control facility. The effort only rely on enterprises themselves deems to be limited because air pollution control facility is usually very expensive. MMEW should establish the system in the future. f. Reinforcement of Administrative Staff In order to execute the above recommendations, reinforcement of administrative staff is necessary. Appropriate number of stuff should be assigned to MMEW, and necessary training should be provided to the staff. (2) OMCO a. Reinforcement of Administrative Staff As previously mentioned in the section of air quality monitoring system, we recommend monitoring of stack emission and improve ambient air quality monitoring system. In order to execute the recommendations, reinforcement of air quality management staff is necessary. Appropriate number of stuff in charge of air quality management should be assigned. It is also necessary to give training program to the staff. b. Development of Database System OMCO continues ambient air quality monitoring from 1985 for the purpose of regulatory compliance.

18 - 10
The gathered monitoring data are regularly reported to MMEW. Although OMCO preserve its monitoring data measured from 1985, database system has not been established. OMCO should develop database system, as the database system is helpful to understand ambient air quality monitoring condition and trend around OMCO area, and effective to make and review air quality management plan.

CHAPTER 19 SUMMARIES

19 - 1
CHAPTER 19 SUMMARIES 19.1 Conclusions The conclusions of the Study are, as follows: (Topography, geology, hydrologeology investigation) - The topography of the Study area mainly consists of the moderate and low relief mountain, hilly land,
fans and terraces, alluvial plain and coastal plane. - Wadi Suq has a river length of 34 km with an average slope of 0.008 (1:125), 275 m in maximum
elevation of the wadi, 71 km2 as the catchment area, and of Wadi Suq, and the mountainous area of the basin occupies approximately 29 km2. The downstream portion has a gentle slope and forms wide floodplain.
- Wdi Suq is topographically divided into seven subareas, including Subarea 1 to 7. - The geology of the Study area consist of the Samail Nappe, which is composed of the Ophiolite and
Batinah Olistostromes of the Pre-Tertiary, Tertiary Deposits in the eastern part of the area, and Quaternary Deposits.
- The Quaternary Deposits consist of terrace deposits in diluvium, wadi sediments and screes. The Alluvial Terrace Deposits generally is almost consolidated by calcrete, and the permeability is relatively low.
- The dominant directions of faults are northeast to southwest and northwest to southeast. A narrow graven structure from 1 km to 1.5 km wide runs along Wadi al Jizi in an east-northeast to west-southwest direction.
(Geochemical investigation) - High concentration zones of Cd, Pb, Cu, Fe, Zn, and SO4, which are caused by the smelter and tailings
dam, were found by soil investigation and locally dispersed beyond 3 km. - Leakage of contaminated groundwater in a northwest direction from the tailing dam was confirmed
and its impact has reached downstream to Bayda village. - Leakage of seawater occurred out of pumping station PS-2, and there exists a high chloride
concentration zone approximately 400 m in length. (Geophysical survey) - In the tailing dam, the specific resistivity basement appears as an almost horizontal line about 30 m
under the ground surface with a layer of low specific resistivity spreading horizontally. - In the middle reach of Wadi Suq exist 50 to 100 m under ground surface, and it is deeper than upper
reach of the wadi. - In the upper and middle reaches, the depth of the basement is distributed almost horizontally from 5 to
10 m below the wadi ground surface. - In the middle and lower reaches, the basements exist at a slightly deeper depth of about 20 m. However,
their form is almost flat on the whole.
19 - 2
(Drilling investigation) - There exists an aquifer with very shallow groundwater level of –4m upstream of Sagha village. The
shallowness of the aquifer in this area is caused by a natural constriction in the topography that results in a damming effect on the groundwater.
- Deep groundwater in DH-4, DH-5 and DH-8 is slightly confined. Compact calcreted sand and gravel beds may act as confining beds.
- Permeability coefficients obtained by the field pumping tests ranged from 10-3 to 10-6 cm/sec. Permeability is lower in calcreted sand and gravel beds.
- Elevated concentrations of Cd and Pb were observed in seepage out of the tailing dam and slightly higher concentrations were observed in downstream areas until DH-5 and in mine water out of Aarja and Bayda mines. Other areas presented low concentration not exceeding Omani drinking water standards.
- Cl concentration ranged from 45 to 34,578 mg/L with the high concentrations obtained from seepage out of the tailing dam, including its downstream area near DH-5 and northwestern part of the tailing dam.
- All chemical constituents in the shallow and deep groundwater exhibited marked attenuation with distance from the sources. The concentrations generally decreased with distance downstream until approximately the area of borehole DH-5 is reached in Wadi Suq. The entire area form the tailing dam downstream to Sagha village is considered contaminated.
- There exist water quality differences between the deep layer groundwater and that of shallow layer. - Peak concentrations of Cd, Cr, Pb and Cu are observed at DH-5, while peak concentrations in Mn and
Fe were observed at DH-6. The presence of weak natural mineralization in area around DH-5 and -6 seems to be causing elevated concentrations of metals in this area.
- SO4 concentrations exhibit attenuation with distance downstream from the source and a peak was observed at DH-7 borehole. This sulfate peak may be the result of natural sulfate minerals in the area of DH-7.
- A high concentration peak of Cl was detected at DH-5. This chloride peak could be caused by leakage out of the seawater pipeline.
(Pollutant source investigation) - High salinity groundwater is flowing out from the tailing dam, and the tailings from the surface to the
tailing dam are scattered by wind. - Wastes were dumped in dumping areas, located in Lasail, Lasail West, Aarja, and Bayda mines. - Abandoned open pits of Lasail West and Aarja mines are filled by mine water. - Off-gas is directly discharged out of the main stack after simple dust collection without desulfurization. - Waste liquid out of tank house is neutralized by hydrated lime after liberating electrolysis to decopper,
and finally transported by tank truck to the evaporation ponds. - Tailings contain a great amount of sulfur, which might produce a lot of acidic water. But it is believed
the surplus lime in tailings; calcreted beds and basement rock might act as buffering agents to prevent the onset of acid drainage.
19 - 3
- Wastes of both Lasail and Aarja mines have high sulfur contents ranging between 10 and 13 %. Some of these wastes might produce acidic water with leached heavy metals in the future as oxidation progresses further.
- Aarja mine water contains high concentration of Hg, Na, Ca and Cl is different from shallow layer groundwater in the surrounding area. On the other hand, Lasail West mine water presents slightly low pH, but has some correlation with the groundwater in the surrounding area.
(Environmental (water quality) investigation) - pH values are almost neutral. - Electric Conductivity presented a high value of 7.66 S/m at the tailings impoundment and decreased
with distance downstream along Wadi Suq. - Cd, As, Pb, Cu, Zn, and SO4 presented higher values at the tailings impoundment, northwest of the
tailing dam, and mine water of Aarja and Lasail West. - Cl presented high concentration at the tailings impoundment, extending to the northwest, and
downstream along Wadi Suq. - Extent of water contamination impact in Sohar mine area is summarized, as follows:
- Cd, Pb, Cu, SO4 and Cl as pollutants originate from the tailing dam and are observed downwards along Wadi Suq. The extent of water contamination is limited from the tailing dam to the KM 14 point of Sagha Village along Wadi Suq.
- A high concentration zone of Cl in the area downstream of Wadi Suq could be influenced by old seawater based on the results of radioactive dating by tritium. The age of this water was estimated at 27 year and contains Cl contamination from before mine development.
- Contaminated groundwater is leaking toward the northwest out of the tailing dam and is impacting Wadi Bani Umar al Gharbi.
- The groundwater modeling of Wadi Suq was performed using Groundwater Modeling System (GMS) v3.0.
- Steady state simulation results of the Wadi Suq model presented excellent comparison with measured groundwater levels.
- Calculated simulation results of contaminated groundwater showed excellent correlation with measured concentrations obtained by monitoring. In the future, however, further study will be made.
(Air quality investigation) - The 1-hour average SO2 concentrations varied from 0.001 ppm (3 µg/m3) to 0.835 ppm (2,404 µg/m3). - The 24-hour average TSP concentrations varied from 49 µg/m3 to 332 µg/m3. - The 24-hour average PM10 concentrations varied from 33 µg/m3 to 205 µg/m3. - Measured dustfall masses varied from 0.42 t/km2/30days to 2.90 t/km2/30days. - 24-hour average SO2 ranged from 19 to 225 µg/m3, and exceeded the EEC standard at 2 points. - The predicted result of ground level concentrations in air showed relatively excellent comparison with
measured concentrations. The predicted SO2 concentration of the ground level for 24-hour is 120 µg/m3 as diluted value on west side of the OMCO smelter.
19 - 4
(Investigation on expansion program for smelter and refinery plant) - It has been stated that plans for expanding the annual production of OMCO’s smelter ranging from
40,000 to 100,000 t/year have been drafted. The JICA Team concluded there is no feasible plan for expansion of the plant at this time.
(Environmental impact investigation) - Environmental impact investigation was performed by personal interview with local residents, health
and medical facilities based on an environmental questionnaire. Consequently, diseases, such as respiratory symptom, decrease of livestock, and some impact on plants and insects were observed.
(Socio-economic survey) - Population in Sohar prefecture is estimated to be 104,169 persons. Agriculture and fishery are active
but industrialization has progressed rapidly in recent years. - There are 8 communities around Sohar mine with 119 families and 870 residents. - Areas around mine have suffered from salinization of groundwater and offensive odor etc. - The results of the interview investigation are, as follows:
- About half of the interviewee do not the situation of Sohar mine area. - Almost all persons who visited Sohar mine area know the existing environmental negative effects. - Some of persons think they do not use the land in Sohar mine area, but others may use it. - Their willingness-to-pay for improving the environmental condition in Sohar mine area is
considered to be reasonable. (Technical transfer) - Technology transfer was implemented through cooperative efforts during study, including the practice
of on-site training, the explanation of the analysis results with the counterparts, counterpart study and training in Japan and so on.
- Some of the problems experienced in implementing the technology transfer element of the study included a shortage of technical experts within MCI and MMEW and the differences in the social environments between Oman and Japan, but the anticipated object of the study was achieved sufficiently and the study was completed with the sincere attitude and efforts of Omani and Japanese study teams.
(Environmental countermeasures) - The environmental countermeasures in the Sohar mine area consist of the tailing dam and along Wadi
Suq. - The countermeasures between the tailing dam and Trenches -1 and -2 in Subarea 1 are examined by
OMCO. A part of construction of evaporation pond is commenced. The tailing dam will be capped with a bitumen liner material, and the contaminated groundwater at Trenches-1 and 2 will is pumped to and treated at the evaporation pond.
- The contamination countermeasures in Subarea 1, 3, 4, and 5 along Wadi Suq were examined and evaluated.

19 - 5
- The contaminated soil in Subarea 3 is necessary to be extracted by excavation, and the excavated zone should be replaced clean soil. The contaminated soil would be transported to seashore for use as fill material in the construction of seaport facilities.
- The countermeasure alternatives at KM 14 in the Subarea 4 consist of two alternatives, including cutoff trench and pumping wells. During construction of countermeasures at the Subarea 4, measures would be taken to protect the natural gas pipeline and seawater pipeline buried in the wadi gravel, and the highway would have to be temporarily rerouted during construction.
- The countermeasure in the Subarea 5 consists of the pumping wells. - The contaminated groundwater extracted from the Subarea 4 and/or 5 would be transported and
treated at the water treatment facility. - The contaminated groundwater will be removed the salt and heavy metals in the water treatment
system. The treatment system would use a membrane separation technology known as reverse osmosis (RO). The permeate stream would be suitable for domestic or agricultural uses. The permeate stream would either be re-injected into the wadi gravels downstream of KM 14, or provided to local residents for domestic or agricultural purposes.
- The condensed water will send to the evaporation ponds and evaporated at there, and finally will be stocked at warehouse after packed.
- Three assemblages of alternatives were selected based on the engineering judgment and cost evaluation, as 1) Countermeasures-A as thought to be the best overall, 2) Countermeasures-B as thought to be second best overall, and 3) Countermeasures-C as technically thought to be necessary minimum.
- The total cost for the Countermeasures-A are estimated at US$ 11,900,000. The total cost for the Countermeasures-B are estimated at US$ 5,300,000. The total cost for the Countermeasures-C are estimated at US$ 2,500,000. The construction period is 12 months.
(Economic analysis) - The economic cost of the Countermeasures-A was estimated at US$ 10,120,000, and the yearly
financial maintenance cost was estimated at US$ 170,000. - The value of land would fall since the quality of the dates deteriorates as contamination increases. If
the implementation of countermeasures can make the groundwater clean, the fall in land values will be stopped, and may even rise. The benefit for land is calculated at 59,700 R.O./year.
- The number of goats, etc. has dropped drastically. If countermeasures will be taken, the number of goats, etc. will increase. The estimated benefit is 37,500 R.O./year.
- If the countermeasures will be implemented, the cost-saving benefit for supplying with free drinking water by OMCO is calculated at 11,984 R.O./year.
- The estimated mean of willingness to pay was 7 R.O./year for Muscat city and 8 R.O./year for Sohar city. Using the estimated mean of willingness to pay, the total amounts of willingness to pay in Muscat were estimated at 800,000 to 1,000,000 R.O./year. That of Sohar was estimated at 350,000 to 450,000 R.O./year.
- As a result of the economic analysis, IRR is 14.0 %, the present net value is considerably large, and the cost benefit ratio is indicated to be greater than 3.0. Therefore, the recommended countermeasures can be judged to be sufficiently feasible.
19 - 6
- Other benefits, including improvement of existing orchard land, growing of trees in the “Al Ons Nature Reserve”, returning of honeybees to the mine area, increasing of tourists, etc. will be obtained after the countermeasures will be implemented.
(Countermeasure project implementation) - The government should burden for this project, which contributes to the improvement of regional
environment. In specialty since the construction cost is necessary for a large amount of money, the government is requested for giving its help to OMCO as much as possible by granting subsidy, borrowing soft loans, etc.
- Although it is desirable that the government should pay construction cost, the assignment of the government subsidy is desired to examine. It is necessary to negotiate on loan conditions for borrowing from domestic banks. In this case, repayment of capital and interest is sufficiently possible by assigning only 0.01 % of GDP to the projects.
- For the implementation of the countermeasure project, it is necessary to execute making of detailed implementation plans, detailed design works and the construction management and so on. After completion of the countermeasure project, operations and management of the water treatment facilities are very important. There is a good solution to use the technology support scheme by foreign countries as the means that cuts these expenses and moreover can receive technology transfer.
19.2 Recommendations The recommendations of the Study are, as follows: (Countermeasures for the air pollution) - Wet limestone/gypsum scrubber Flue gas desulfurization (FGD) system is recommended to reduce SO2
emissions from OMCO. SO2 removal is approximately 90 % or more. - If 90 % SO2 removal FGD system is installed in the OMCO plant, the ambient air quality standard is
not violated in the area over 20 km x 20 km surrounding OMCO plant. - The total installation cost of the wet limestone/gypsum scrubber FGD system into OMCO plant is
estimated approximately US$ 20,000,000. (Environmental monitoring system) - On the monitoring system in the Sohar mine area, total 40 monitoring locations including the existing
monitoring places and JICA Team’s 25 new monitoring wells are recommended. - On the monitoring work, establishing of the standard operating procedures (SOPs) for the water
sampling and treatment in the field, chemical analysis in the laboratory, data-analysis technique are recommended.
- Another national ambient air quality monitoring station would be necessary in order to monitor impact of stack emission from OMCO.
(Environmental management system)
19 - 7
- The JICA Team recommends no changes in Oman’s current wastewater discharge and drinking water standards. The current Omani standards are consistent with world standards.
- The JICA Team recommends that a permanent liaison position be created within DGM to foster coordination and cooperation between MCI and MMEW.
- The government of Oman has not yet established national ambient air quality standards. US EPA ambient air quality standards (NAAQS) are tentatively used as a substitute for ambient air quality standards of Oman.
- Although MMEW presently only reviews these monitoring data/reports and keep them by filing, development of database system of the data/reports gathered in MMEW will certainly contribute to air quality management policy planning.
- OMCO should develop database system, as the database system is helpful to understand ambient air quality monitoring condition and trend around OMCO area, and effective to make and review air quality management plan.
REFERENCES 1. Ministry of Commerce and Industry (1978): Omanian Standard No.8 Drinking Water, Sultanate of
Oman 2. U.S. Environmental Protection Agency (1978): Field and Laboratory Methods Applicable to
Overburdens and Mine Soils, EPA/600/2-78/054, US 3. Barnett, C. T. (1984): Simple Invesrsion of TDEM data, Geophysics, 49, 923-933. 4. Yamamoto S. (1983): Investigation Method of Groundwater, Kokon-Shoin 5. Chorley R. J., Schumm S. A., and Sugden D. E. (1985): Geomorphology, Thomson 6. Directorate General of Minerals (1987): Geological Map of Sohar and Explanatory Note, Ministry
of Petroleum and Minerals 7. Directorate General of Minerals (1987): Geological Map of Wadi Bani Umar and Explanatory
Note, Ministry of Petroleum and Minerals 8. Johansson, P. O. (1987): The economic theory and measurement of environmental Benefit,
Cambridge, New York and Sydney, Cambridge University Press 9. Corbitt R. A. (1989): Standard Handbook of Environmental Engineering, Mc-Grow Hill 10. British Columbia Acid Mine Drainage Task Force (1989): Draft Acid Drainage Technical Guide,
Prepared by Steffen Roberston and Kirsten, Inc. 11. Nielsen, D. M. (1991): Practical handbook of ground water monitoring, Publisher Chelsea, MI,
Lewis Publishers 12. Ministry of Regional Municipalities and Environment (1993): Regulations for Wastewater Re-use
and Discharge, Ministerial Decision 145/93 dated 13 June 1993, Sultanate of Oman 13. Ministry of Regional Municipalities and Environment (1993): Regulations for the Management of
Hazardous Waste, Ministerial Decision 18/93 dated 2 February 1993, Sultanate of Oman 14. Ministry of Regional Municipalities and Environment (1993): Issuing Regulations for Noise
Pollution Control in Working Environment Ministerial Decision 80/94 dated 20 March 1994, Sultanate of Oman
15. Ministry of Development (1993): General Census of Population, Housing and Establishments 1993, Sultanate of Oman
16. Arrow, K., Solow, R., Portney, P. R., Leamer, E. E., Radner, R. and Schman, H. (1993): Report on NOAA panel on contingent valuation, 58 Federal Register 4601
17. Oman Mining Company L.L.C. (1995-1999): Monthly Environmental Report June 1995 – March 1999, OMCO
18. Sengupta M. (1993): Environmental Impacts of Mining – Monitoring, Restoration, and Control, Lewis
19. Ministry of Development (1996): Basic Components and Main Indicators of the Fifth Five-year Plan 1996-2000, Sultanate of Oman
20. Ministry of Water Resources (1996): Groundwater Pollution and Remediation in Wadi Suq, Sultanate of Oman
21. American Water Works Association (1996): Water Treatment Membrane Processes, McGraw- Hill
Publishers. 22. Ministry of Development (1997): Statistical Year Book, Twenty Fifth Issue, Sultanate of Oman 23. Ministry of Development (1997): The Fifth Five-year Development Plan 1996-2000, Sultanate of
Oman 24. Ministry of Development (1997): The Investment Programme During the Fifth Five-year Plan
1996-2000, Sultanate of Oman 25. Suthersan, S.S. (1997), Remediation engineering: Design concepts. Lewis Publishers, Newyork 26. E. Roberts Alley & Associates, Inc. (1998); Air Quality Control Handbook, McGraw-Hill, New
York 27. Gavaskar, A. R., Gupta, N., Sass, B. M., Janosy, R.J., and Sullivan, D. (1998): Permeable Barriers
for groundwater remediation: Design, construction and monitoring, Battelle Press, Columbus, Richland
28. World Bank (1998): Pollution Prevention and Abatement Handbook 29. The Society of Exploration Geophysicists of Japan (1999): Handbook of Geophysical Exploration,
The Society of Exploration Geophysicists of Japan 30. Bedient, P. B., Rifai, H. S., and Newell, C.J. (1999): Groundwater Contamination: Transport and
Remediation, Prentice Hall PTR, NJ. 31. Groundwater and Soil cleanup: improving management of persistent contaminants (1999):
Committee on Technologies for Cleanup of subsurface Contaminants in the DOE Weapons Complex, Board on Radioactive Waste Management, Commission on Geosciences, Environment, and Resources, National Research Council, National Academy Press, Washington, D.C.
32. Hida N. (1999): Economic Evaluation of Environment and Administration, Keiso-shobo 33. Chiyoda Corporation (2000): Chiyoda Thoroughbred 121 Flue Gas Desulfurization Process, leaflet
of Chiyoda Corporation 34. WHO (2000): Guidelines for Air Quality, World Health Organization 35. Huang, P. M., and Iskandar, I. K. (2000), Soils and groundwater pollution and remediation: Asia,
Africa, and Oceania. Lewis Publishers, Newyork