part two price, quantity, and efficiency. chapter 3: demand, supply, and market equilibrium...
TRANSCRIPT

PART TWO
Price, Quantity, and Efficiency

Chapter 3: Demand, Supply, and Market
Equilibrium
Copyright © 2005 by The McGraw-Hill Companies, Inc. All rights reserved.

Markets
Markets bring together buyers (“demanders”) and sellers (“suppliers”).
Some markets are local while others are national or international.
Markets help to determine the prices and quantities bought and sold of millions of goods and services.
Copyright © 2005 by The McGraw-Hill Companies, Inc. All rights reserved.

Demand
Demand is a schedule or curve that shows the various amounts of a product that consumers will buy at each of a series of possible prices during a specific period.
The Law of Demand states that, all else equal, as price falls, the quantity demanded rises, and vice versa.
Copyright © 2005 by The McGraw-Hill Companies, Inc. All rights reserved.

Demand
A curve illustrating the inverse relationship between the price of a product and the quantity demanded of it, other things equal, is the demand curve. It slopes downward to reflect the Law of
Demand.
Copyright © 2005 by The McGraw-Hill Companies, Inc. All rights reserved.

Demand
Copyright © 2005 by The McGraw-Hill Companies, Inc. All rights reserved.

Demand
Individual demand is the demand schedule or curve of a single consumer.
Market demand is the sum of all the individual demands. By adding the individual quantities demanded
by all consumers at each of the various possible prices, we get the market demand.
Copyright © 2005 by The McGraw-Hill Companies, Inc. All rights reserved.

Demand
Copyright © 2005 by The McGraw-Hill Companies, Inc. All rights reserved.

Demand
When a demand curve is drawn, other factors, called determinants of demand, are held constant. Determinants of demand are factors other
than price that locate the position of a demand curve.
These include: (1) tastes, (2) number of buyers, (3) income, (4) prices of related goods, and (5) expected prices.
Copyright © 2005 by The McGraw-Hill Companies, Inc. All rights reserved.

Change in Demand
A change in one or more of the determinants will change the underlying demand data and the location of the demand curve.
Copyright © 2005 by The McGraw-Hill Companies, Inc. All rights reserved.

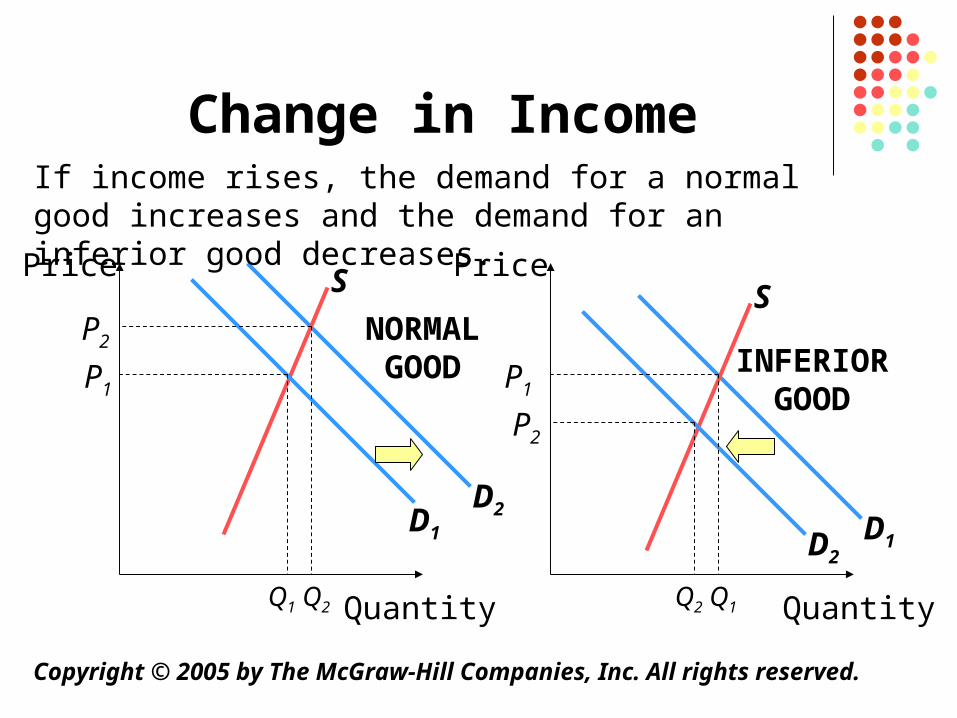
Change in Income
The effects of changes in income vary depending on the type of product demanded.
When income rises, all else equal, the demand for normal goods increases, while the demand for inferior goods decreases.
Copyright © 2005 by The McGraw-Hill Companies, Inc. All rights reserved.

Change in Income
Most goods are normal goods, or superior goods. The demand for these increases or decreases directly with changes in income.
The demand for inferior goods increases or decreases inversely with money income.
Copyright © 2005 by The McGraw-Hill Companies, Inc. All rights reserved.
Change in Income
Copyright © 2005 by The McGraw-Hill Companies, Inc. All rights reserved.
Price Price
Quantity Quantity
If income rises, the demand for a normal good increases and the demand for an inferior good decreases.
D1 D1
SS
NORMALGOOD INFERIOR
GOOD
D2
D2
P1
P2
P2
P1
Q1 Q2 Q2 Q1

Prices of Related Goods
When two goods are related (as substitutes or complements), a change in the price of one good may either increase or decrease the demand for the other product. A substitute good is one that can be used in
place of another good. A complementary good is one that is used
together with another good.Copyright © 2005 by The McGraw-Hill Companies, Inc. All rights reserved.

Prices of Related Goods
If two goods are substitutes, an increase in the price of one will increase the demand for the other.
If two goods are complements, an increase in the price of one will decrease the demand for the other.
Most goods are unrelated to one another. For these independent goods, a change in the price of one will have virtually no effect on the demand for the other.
Copyright © 2005 by The McGraw-Hill Companies, Inc. All rights reserved.

Changes inQuantity Demanded
A change in quantity demanded is a movement from one point to another point on a fixed demand curve. The cause of such change is an increase or
decrease in the price of the product under consideration.
Copyright © 2005 by The McGraw-Hill Companies, Inc. All rights reserved.

Changes in Demand
A change in demand is a shift of the demand curve to the right (an increase in demand), or to the left (a decrease in demand). Shifts are cause by a change in one or more
of the determinants of demand.
Copyright © 2005 by The McGraw-Hill Companies, Inc. All rights reserved.

Supply
Supply is a schedule or curve showing the amounts of a product that producers will make available for sale at each of a series of possible prices during a specific period.
The Law of Supply states that, all else equal, as price rises, the quantity supplied rises, and vice versa.
Copyright © 2005 by The McGraw-Hill Companies, Inc. All rights reserved.

Supply
A curve illustrating the positive, or direct relationship between the price of a product and the quantity supplied of it, other things equal, is the supply curve. It slopes downward to reflect the Law of
Demand.
Copyright © 2005 by The McGraw-Hill Companies, Inc. All rights reserved.

Supply
Copyright © 2005 by The McGraw-Hill Companies, Inc. All rights reserved.

Supply
Market supply is derived from individual supply by “horizontally adding” the supply curves of the individual producers.
Determinants of supply are those factors that cause supply to change. The basic determinants of supply are (1)
resources prices, (2) technology, (3) taxes and subsidies, (4) price of other goods, (5) expected prices, and (6) the number of sellers in the market.
Copyright © 2005 by The McGraw-Hill Companies, Inc. All rights reserved.

Changes inQuantity Supplied
A change in quantity supplied is a movement from one point to another point on a fixed supply curve. The cause of such a movement is a change in
the price of the product being considered.
Copyright © 2005 by The McGraw-Hill Companies, Inc. All rights reserved.

Changes in Supply
Because supply is a schedule or curve, a change in supply means a change in the schedule and a shift of the supply curve. Shifts are cause by a change in one or more of
the determinants of supply.
Copyright © 2005 by The McGraw-Hill Companies, Inc. All rights reserved.

Market Equilibrium
In competitive markets, buyers and sellers have no control over prices. When buyers and sellers interact in a free competitive market, the equilibrium price and equilibrium quantity is determined by the intersection of the demand and supply curves.
Copyright © 2005 by The McGraw-Hill Companies, Inc. All rights reserved.

Market Equilibrium
The equilibrium price, or market-clearing price, is the price at which the intentions of buyers and sellers match.
The equilibrium quantity is the quantity demanded and quantity supplied that occurs at the equilibrium price in a competitive market.
Copyright © 2005 by The McGraw-Hill Companies, Inc. All rights reserved.

Market Equilibrium
Any price above the equilibrium price would create a surplus, or excess supply; quantity supplied exceeds quantity demanded.
Surpluses drive prices down to equilibrium. As prices fall, the incentive to produce declines
and the incentive for consumers to buy increases.
Copyright © 2005 by The McGraw-Hill Companies, Inc. All rights reserved.
Market Equilibrium
Any price below the equilibrium price would create a shortage, or excess demand; quantity demanded exceeds quantity supplied.
Shortages push prices up equilibrium. As prices rise, the incentive to produce
increases and the incentive for consumers to buy decreases.
Copyright © 2005 by The McGraw-Hill Companies, Inc. All rights reserved.

Market Equilibrium
Copyright © 2005 by The McGraw-Hill Companies, Inc. All rights reserved.

Changes in Demand,Supply, and Equilibrium
Changes in Demand
When supply is constant, an increase in demand will result in a higher equilibrium price and quantity. If demand falls, equilibrium price and quantity decrease.
Copyright © 2005 by The McGraw-Hill Companies, Inc. All rights reserved.

Changes in Demand,Supply, and Equilibrium
Changes in Supply
With a constant demand, if supply increases, equilibrium price falls while equilibrium quantity rises. If supply decreases, equilibrium price rises, and equilibrium quantity falls.
Copyright © 2005 by The McGraw-Hill Companies, Inc. All rights reserved.

Changes in Demand,Supply, and Equilibrium
Copyright © 2005 by The McGraw-Hill Companies, Inc. All rights reserved.

Changes in Demand,Supply, and Equilibrium
Complex CasesWhen both supply and demand change, the effect is a combination of the individual effects.The relative sizes of the change in demand and supply will determine the effect on equilibrium price and quantity. In some cases, the effect is certain; in others
the effect depends on the size of the shifts.
Copyright © 2005 by The McGraw-Hill Companies, Inc. All rights reserved.

Changes in Demand,Supply, and Equilibrium
Example: Supply Increases, Demand Decreases
CASE 1 CASE 2
Copyright © 2005 by The McGraw-Hill Companies, Inc. All rights reserved.
S1
D1 D2
S1S2S2
D1
D2
P1
P2
P1
P2
Q1 Q2Q2 Q1
Price decreases, quantity decreases Price decreases, quantity increases
Changes in Demand,Supply, and Equilibrium
Example: Supply Increases, Demand Decreases
CASE 3
If the shift in the supply curve to the right (an increase) is equal to the shift in the demand curve to the left (a decrease), then the equilibrium price will decrease and the equilibrium quantity will not change.
Copyright © 2005 by The McGraw-Hill Companies, Inc. All rights reserved.

Changes in Demand,Supply, and Equilibrium
Copyright © 2005 by The McGraw-Hill Companies, Inc. All rights reserved.
Change in Supply
Change in Demand
Change in Price
Change in Quantity
Increases Decreases ↓↑, ↓, or no change
Decreases Increases ↑↑, ↓, or no change
Increases Increases↑, ↓, or no
change↑
Decreases Decreases↑, ↓, or no change
↓

Government-Set Prices
In most markets, prices are free to rise or fall with changes in demand and supply.
However, sometimes the resulting price in a market is “too high” or “too low”. Government may place legal limits on how
high or how low a price or prices may go. High prices may be unfair to buyers whereas
low prices may be unfair to sellers.
Copyright © 2005 by The McGraw-Hill Companies, Inc. All rights reserved.

Price Ceiling
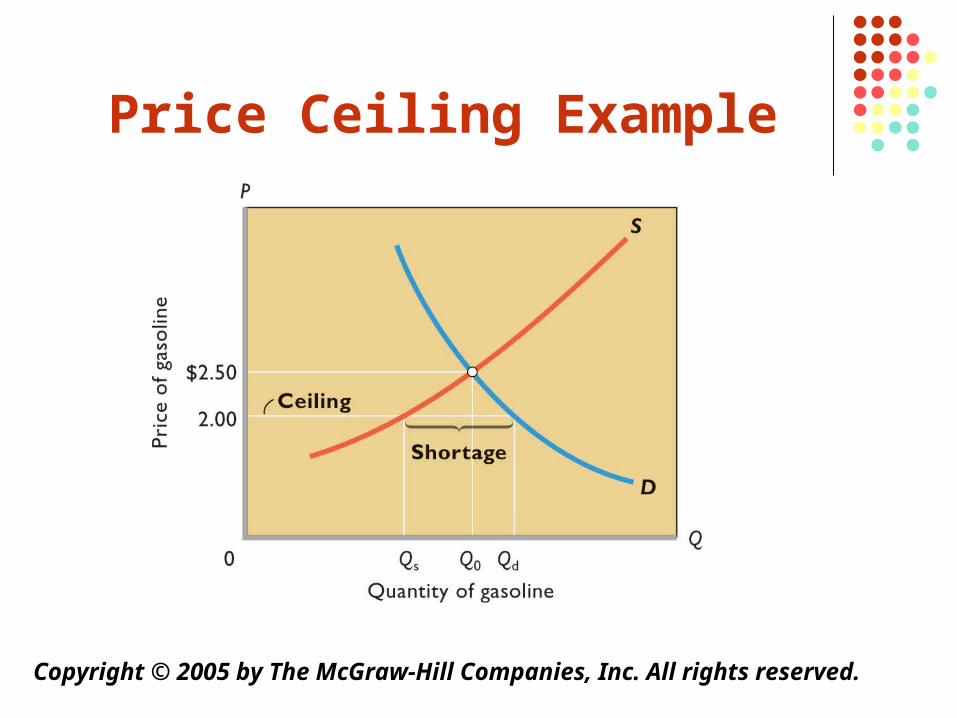
If the price of a product is unfairly high, the government can set a price ceiling, or a legal maximum price a seller may charge for a product.
This purportedly enables consumers to obtain some “essential” good or service that they could not afford at the equilibrium price; however, it also creates a shortage of the good.
Copyright © 2005 by The McGraw-Hill Companies, Inc. All rights reserved.
Price Ceiling Example
Copyright © 2005 by The McGraw-Hill Companies, Inc. All rights reserved.

Price Floor
When the price of a good or service is “too low”, the government can set a price floor, or a minimum fixed price that sellers can charge.
The goal is to provide a sufficient income for certain groups of resource suppliers, or producers who would otherwise receive very low incomes at the equilibrium price. However, a surplus of the good is created.
Copyright © 2005 by The McGraw-Hill Companies, Inc. All rights reserved.
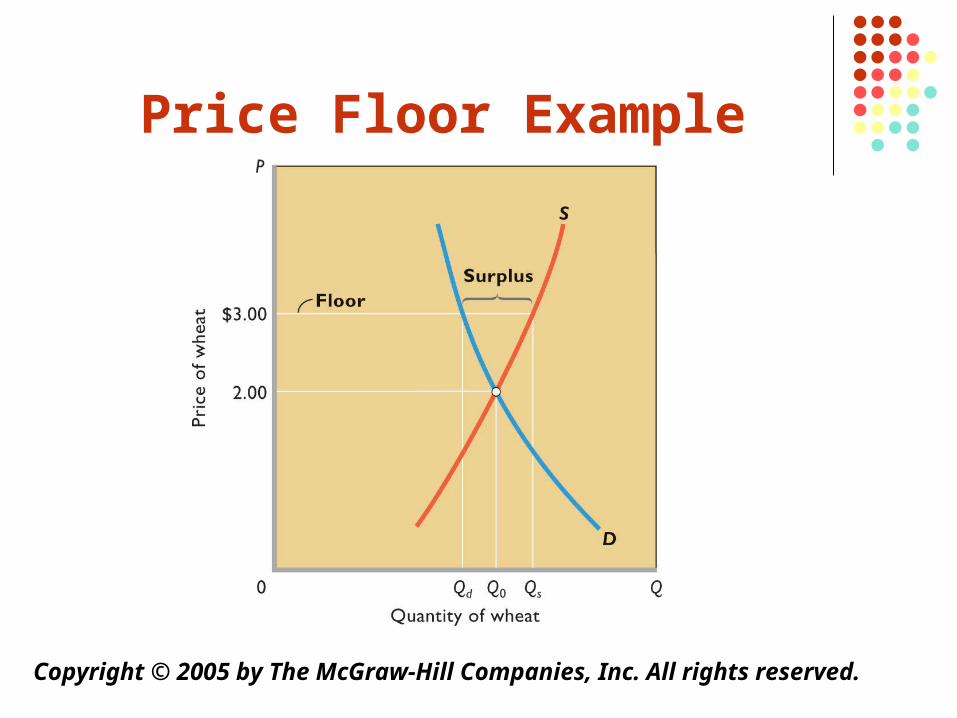
Price Floor Example
Copyright © 2005 by The McGraw-Hill Companies, Inc. All rights reserved.