part vii of a nera insights series credit crisis
TRANSCRIPT

4 June 2010
Part VII of a NERA Insights Series
Credit Crisis Litigation Revisited: Litigating the Alphabet of Structured Products*
Introduction
When we first examined the credit crisis and its subsequent litigation in July 2008, the related losses and lawsuits were in their early stages.1 Preliminary loss estimates were in the range of $125 billion to $945 billion and there were approximately 130 credit crisis lawsuits. As of 12 May 2010, total writedowns and losses stemming from the credit crisis have reached $1.8 trillion worldwide—or approximately 12.5% of US annual GDP—and the total number of credit crisis lawsuits has exceeded 400.2
We define the credit crisis lawsuits in this article as securities cases—cases in which the allegations relate to the purchase, ownership, or sale of securities. Our count of credit crisis lawsuits includes, among others, ERISA claims, shareholder derivative actions, individual state and federal cases, international cases, and state and federal shareholder class actions.3 We compiled the data from various sources including Bloomberg, Factiva, RiskMetrics Group/Securities Class Action Services, SEC filings, and case dockets from January 2007 to April 2010. Collectively, we will call these lawsuits “credit crisis lawsuits.” If any cases are consolidated, the duplicate filings are removed and the data are adjusted.
In this article, we examine the current trends in filings, settlements, recent decisions, and the changing nature of allegations in credit crisis lawsuits. The lawsuits, just like the credit crisis, have evolved towards more complex financial products and the trends in allegations, defendants, and plaintiffs have shifted accordingly.
First, we will discuss trends in filings and Director and Officer (D&O) liability. Next, we will examine the types of claims alleged in the lawsuits and review both the types of defendants facing these claims and the plaintiffs asserting them. We will then assess the types of products involved, review trends in bankruptcies, and finally conclude with a discussion of recent decisions.
By Dr. Faten Sabry,Anmol Sinha,Jesse Mark,and Sungi Lee
Previous topics in this subprime lending series include:
n The Subprime Meltdown:
A Primer
n Understanding Accounting-
Related Allegations
n Subprime Securities Litigation:
Key Players, Rising Stakes,
and Emerging Trends
n The Use of Economic Analysis
in Predatory Lending Cases:
Application to Subprime Loans
n How Did We Get Here?
The Story of the Credit Crisis
n An Update on the Credit Crisis
Litigation: A Turn Towards
Structured Products and Asset
Management Firms

www.nera.com 2
Exhibit 1. Total Credit Crisis Losses and Writedowns
0 200 400 600 800 1,000 1,200 1,400 1,600 1,800 2,000
Losses ($ billions)
$ 1,784 billion
$ 146 billion
Source: Bloomberg, L.P. and FDIC.
Credit Costs / Loan Chargeoffs / Increased Provisions Revaluation Reserve / Other Comprehensive IncomeSubsidiaries / Investments in Other Firms / Corporate Debt Mortgage-Related Securities Backed by Subprime
Other Uncategorized Mortgages / Securities Uncategorized Residential Mortgage Asset WritedownsCMBS and Commercial Real Estate Non-Mortgage ABS
CDO CDS and Other DerivativesRemainder
S&L
Cri
sis
Tota
l Cre
dit
Cri
sis
Loss
es &
Wri
ted
ow
ns
(5/1
2/2
01
0)
As of April 2010, there are conflicting signals regarding the future of the litigation. On one hand, credit crisis filings have declined and almost half of the decisions to date have been dismissals. However, the types of allegations, products, and defendants continue to shift, and the cases against some defendants, most notably the rating agencies, have survived several motions to dismiss and will proceed. In addition, the regulatory investigations, such as the recent Securities and Exchange Commission (SEC) lawsuit against Goldman Sachs, add to the uncertainty surrounding the direction and focus of the litigation.
Our analysis indicates that credit crisis filings involving 10b-5 and ERISA allegations have declined markedly since 2007, while breach of contract cases are on the rise. The types of defendants have also shifted since we started tracking the credit-related litigation. In 2007, mortgage lenders, home builders, and REITs were named as defendants in about half of the cases, but they were named in only 5% of cases in 2009 and in none of the cases in 2010 (through 30 April). Instead, issuers and underwriters have been increasingly targeted as defendants and were named in 60% of the filings thus far in 2010. The filings in 2009 and 2010 focus mainly on collateralized debt obligations (CDOs), swaps, and mortgage-related securities, in contrast to the initial focus of filings on mortgage loans. Finally, we have recorded over $2.1 billion in credit crisis settlements through 30 April 2010, of which 82% have arisen from class action settlements.
The Litigation Roadmap: Follow the Losses
Before we examine the trends in filings, we will review the losses sustained in the crisis thus far. Exhibit 1 presents the worldwide value of writedowns and credit losses for the financial sector from 2007 until 12 May 2010. Writedowns include losses related to holdings in mortgages, structured finance, and derivatives and include those that directly reduce income, as well as value reductions that only decrease equity and are excluded by the financial institutions from their earnings figures.4

www.nera.com 3
As shown in Exhibit 1, the largest component of the writedowns and losses has been loan charge-offs and increased loss provisions, accounting for 36%, or $641.9 billion. Firms that engage in loan origination, securitization, or maintenance typically provide for credit losses or loan losses as part of their normal operations. As delinquencies and foreclosures increased both in the US and internationally, firms have had to increase their charge-offs and loan loss provisions—the latter related to future charge-offs of impaired loans. The loans in question include mortgages, credit cards, student loans, and auto loans, among others.
Another $112.5 billion of losses are attributable to CDOs, $71.4 billion are attributed to mortgage-related securities backed by subprime, $59.0 billion are attributed to commercial mortgage-backed securities (CMBS), and $65.1 billion are due to credit default swaps (CDS) and other derivatives.
As we have discussed in previous articles, as the crisis has encompassed market participants beyond the primary mortgage markets and losses have stemmed from financial products beyond just mortgage loans, the litigation has also followed suit. In 2009 and the first quarter of 2010, the credit crisis lawsuits have increasingly focused on asset-backed securities and complex financial products such as CDOs and derivatives. This move has been in tandem with regulatory investigations focusing on the role of structured products in the crisis. In fact, in 2010, at least six investment banks are being investigated by the SEC over the securitization of CDOs.5 During the same time period, litigation against originators involving losses of mortgage loans has declined. We will discuss these trends in more detail below.
The Filings: The Initial Surge Has Passed but Lawsuits Continue
From 1 January 2007 until 30 April 2010, we recorded 402 credit crisis filings. Filings peaked in the second quarter of 2008 and decreased in every quarter of 2009. There were 69 lawsuits in 2007, 170 in 2008, and 136 in 2009. Between January 2010 and 30 April 2010, we recorded 27 credit crisis filings, or 81 filings annualized. Quarterly filings separated into securities class action lawsuits and other types of suits, such as ERISA claims, shareholder derivative actions, and individual state and federal cases, are shown below in Exhibit 2.
The Percentage of Credit Crisis Filings Naming Directors and Officers Decreased in the Second Half of 2009
The percentage of credit crisis filings that name D&O defendants decreased to 52% in 2009, down from 70% in 2007 and 61% in 2008. Early filings in 2010, however, show an increased filing rate against D&O defendants, with 67% naming D&O. Exhibit 3 presents the share of credit crisis filings that have D&O exposure.

www.nera.com 4
Exhibit 2. Credit Crisis Filings by Quarter
6 3
15 14
24
38
25 24 26
1713
9 114
1
26
19
10
9
21 20
24
14
1316
0
10
20
30
40
50
60
70
80
1Q 2Q 3Q 4Q 1Q 2Q 3Q 4Q 1Q 2Q 3Q 4Q YTD*
2007 2008 2009 2010
Class Actions Other Cases
Notes and Sources: Filings for 2010 are as of 30 April.NERA collected lawsuits from various sources, including Factiva, Bloomberg, AP News, Securities Law360, The Wall Street Journal, and BusinessWeek. Counts include ERISA claims, shareholder derivative actions, individual state and federal cases, international cases, state and federal shareholder class actions, and other types of cases.
2007: 69 2008: 170 2009: 136
Filin
gs
50%
67%44%
41%67%58%
65%
53%53%
100%
71%100%
68%
Exhibit 3. Percentage of Credit Crisis Filings Naming Directors and Officers
0
10
20
30
40
50
60
70
80
1Q 2Q 3Q 4Q 1Q 2Q 3Q 4Q 1Q 2Q 3Q 4Q YTD*
2007 2008 2009 2010
D&O Non-D&O
Notes and Sources: Filings for 2010 are as of 30 April.NERA collected lawsuits from various sources, including Factiva, Bloomberg, AP News, Securities Law360, The Wall Street Journal, and BusinessWeek. Counts include ERISA claims, shareholder derivative actions, individual state and federal cases, international cases, state and federal shareholder class actions, and other types of cases.
2007: 70% 2008: 61% 2009: 52%
Filin
gs
www.nera.com 5
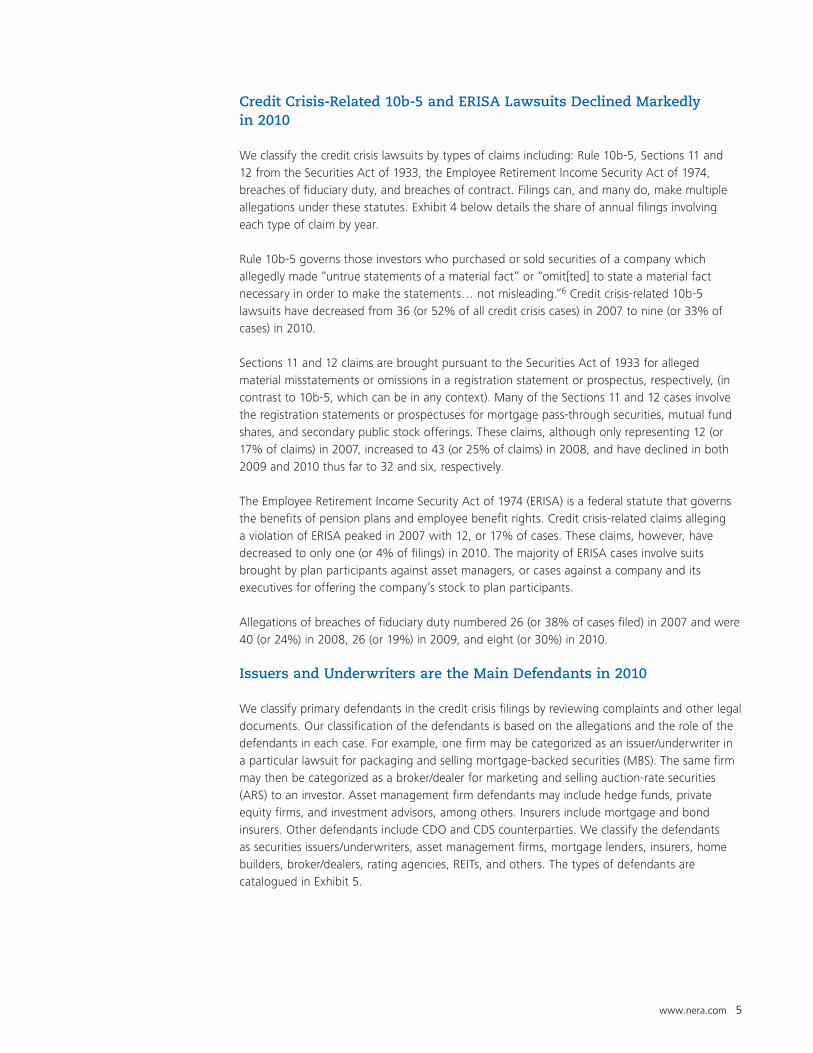
Credit Crisis-Related 10b-5 and ERISA Lawsuits Declined Markedly in 2010
We classify the credit crisis lawsuits by types of claims including: Rule 10b-5, Sections 11 and 12 from the Securities Act of 1933, the Employee Retirement Income Security Act of 1974, breaches of fiduciary duty, and breaches of contract. Filings can, and many do, make multiple allegations under these statutes. Exhibit 4 below details the share of annual filings involving each type of claim by year.
Rule 10b-5 governs those investors who purchased or sold securities of a company which allegedly made “untrue statements of a material fact” or “omit[ted] to state a material fact necessary in order to make the statements… not misleading.”6 Credit crisis-related 10b-5 lawsuits have decreased from 36 (or 52% of all credit crisis cases) in 2007 to nine (or 33% of cases) in 2010.
Sections 11 and 12 claims are brought pursuant to the Securities Act of 1933 for alleged material misstatements or omissions in a registration statement or prospectus, respectively, (in contrast to 10b-5, which can be in any context). Many of the Sections 11 and 12 cases involve the registration statements or prospectuses for mortgage pass-through securities, mutual fund shares, and secondary public stock offerings. These claims, although only representing 12 (or 17% of claims) in 2007, increased to 43 (or 25% of claims) in 2008, and have declined in both 2009 and 2010 thus far to 32 and six, respectively.
The Employee Retirement Income Security Act of 1974 (ERISA) is a federal statute that governs the benefits of pension plans and employee benefit rights. Credit crisis-related claims alleging a violation of ERISA peaked in 2007 with 12, or 17% of cases. These claims, however, have decreased to only one (or 4% of filings) in 2010. The majority of ERISA cases involve suits brought by plan participants against asset managers, or cases against a company and its executives for offering the company’s stock to plan participants.
Allegations of breaches of fiduciary duty numbered 26 (or 38% of cases filed) in 2007 and were 40 (or 24%) in 2008, 26 (or 19%) in 2009, and eight (or 30%) in 2010.
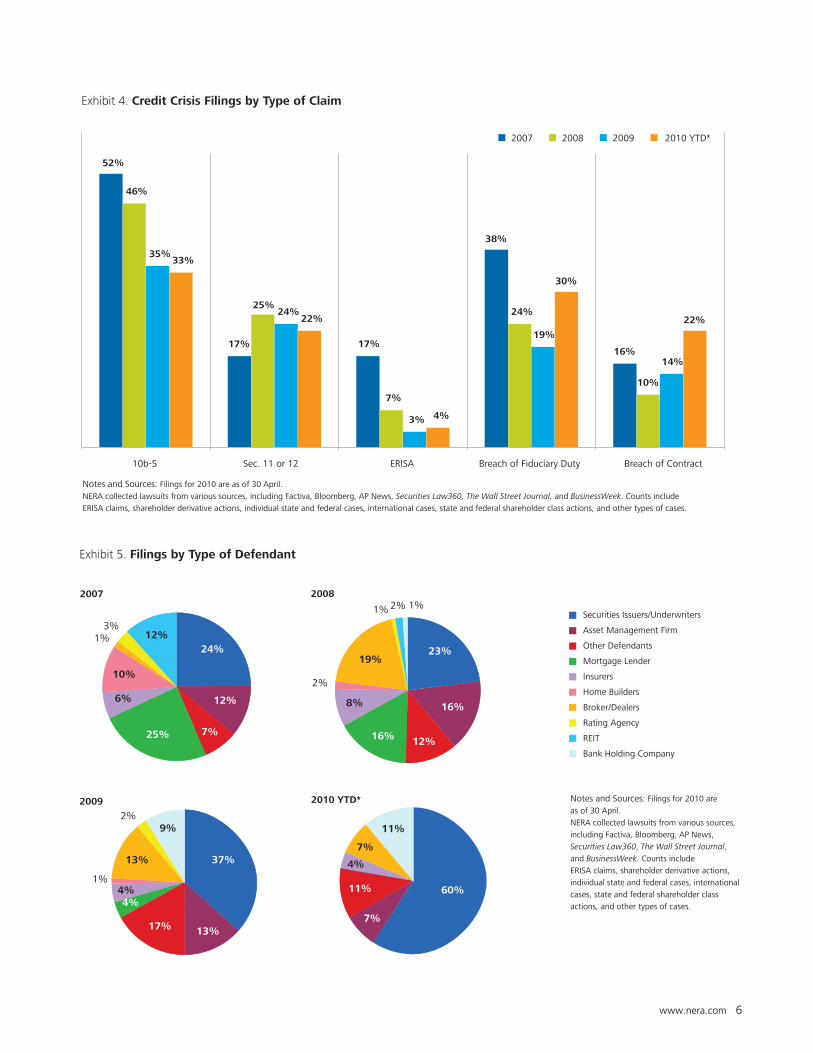
Issuers and Underwriters are the Main Defendants in 2010
We classify primary defendants in the credit crisis filings by reviewing complaints and other legal documents. Our classification of the defendants is based on the allegations and the role of the defendants in each case. For example, one firm may be categorized as an issuer/underwriter in a particular lawsuit for packaging and selling mortgage-backed securities (MBS). The same firm may then be categorized as a broker/dealer for marketing and selling auction-rate securities (ARS) to an investor. Asset management firm defendants may include hedge funds, private equity firms, and investment advisors, among others. Insurers include mortgage and bond insurers. Other defendants include CDO and CDS counterparties. We classify the defendants as securities issuers/underwriters, asset management firms, mortgage lenders, insurers, home builders, broker/dealers, rating agencies, REITs, and others. The types of defendants are catalogued in Exhibit 5.
www.nera.com 6
Exhibit 4. Credit Crisis Filings by Type of Claim
Notes and Sources: Filings for 2010 are as of 30 April.NERA collected lawsuits from various sources, including Factiva, Bloomberg, AP News, Securities Law360, The Wall Street Journal, and BusinessWeek. Counts include ERISA claims, shareholder derivative actions, individual state and federal cases, international cases, state and federal shareholder class actions, and other types of cases.
52%
17% 17%
38%
16%
46%
25%
7%
24%
10%
35%
24%
3%
19%
14%
33%
22%
4%
30%
22%
10b-5 Sec. 11 or 12 ERISA Breach of Fiduciary Duty Breach of Contract
2007 2008 2009 2010 YTD*
Exhibit 5. Filings by Type of Defendant
Notes and Sources: Filings for 2010 are as of 30 April.NERA collected lawsuits from various sources, including Factiva, Bloomberg, AP News, Securities Law360, The Wall Street Journal, and BusinessWeek. Counts include ERISA claims, shareholder derivative actions, individual state and federal cases, international cases, state and federal shareholder class actions, and other types of cases.
Securities Issuers/Underwriters
Mortgage Lender
Broker/Dealers
Asset Management Firm
Insurers
Rating Agency
REIT
Bank Holding Company
Other Defendants
Home Builders
2007
3%1%
10%
12%
24%
25%
6%
12%
7%
2008
12%16%
8%
23%19%
2%1% 1%
2%
16%
2009
13% 37%
17%
4%4%
2%9%
1%
13%
2010 YTD*
7%
11%
7%
4%
11% 60%

www.nera.com 7
There has been a noticeable shift in the type of defendants as the credit crisis has progressed. In 2007, mortgage lenders, home builders, and REITs were named as defendants in 47% of filings. In 2008, mortgage lenders, home builders, and REITs were named in only 20% of filings. This decreased to just 5% in 2009 and so far in 2010 we have not recorded any filings against this group of defendants yet.
An opposing trend has occurred in the percentage of filings that name securities issuers/underwriters as defendants. Although securities issuers/underwriters were defendants in only 24% and 23% of filings in 2007 and 2008, respectively, filings against these types of defendants increased in both 2009 and 2010. In 2009, securities issuers/underwriters were named in 37% of the filings. Through 30 April 2010, 60% of filings have targeted securities issuers/underwriters, though this increase is partially due to the wave of litigation against Goldman Sachs and its involvement in synthetic CDOs.
Shareholder Suits Dropped in 2008 and 2009 But Are Up Again in 2010
Similarly, we classify the types of plaintiffs in the credit crisis filings as shareholders, ARS investors, non-ARS investors, plan participants, insurers, swap contract claimants, government/regulators, and other plaintiffs. The types of plaintiffs filing suits by year are shown in Exhibit 6.
We define shareholders as common stock owners. ARS investors are those who invested in long-term variable-rate instruments (usually municipal or corporate bonds) whose interest rates are reset through auctions. The non-ARS investors are those who invested in preferred securities, corporate bonds, MBS, asset-backed securities (ABS), mutual funds, and money market funds. Plan participants are generally employees that file ERISA claims. Swap contract claimants are most commonly parties that bring suits over disputes over CDS. The government/regulator claims include cases brought by the SEC, state attorneys’ general, cities, and municipalities.
Exhibit 6. Filings by Type of Plaintiff
Notes and Sources: Filings for 2010 are as of 30 April.NERA collected lawsuits from various sources, including Factiva, Bloomberg, AP News, Securities Law360, The Wall Street Journal, and BusinessWeek. Counts include ERISA claims, shareholder derivative actions, individual state and federal cases, international cases, state and federal shareholder class actions, and other types of cases.
Shareholders
Other Plaintiffs
Swap Contract Disputant
Non-ARS Investors
Plan Participants
Gov't/Muni/Regulators
ARS Investors
Insurers
2007
60%17%
1%7%
12%
3% 2008
35%
32%
8%
1%
17%
4%2%
1%
2009
6%4%1%
6%
12%
44%
20%
7%
2010 YTD*
40%
30%
7%
4%
4%4%
7%4%

www.nera.com 8
Similar to the trends in defendants, the plaintiffs involved in cases have shifted towards non-primary mortgage market participants. The share of cases involving investors (both ARS and non-ARS) have increased in 2008 and 2009. While not as high in 2010, thus far they have accounted for 37% of the cases filed through 30 April. Government entities and regulators accounted for 4% of the suits in 2008 and 7% in 2009. This trend has continued in 2010, with 7% of the suits filed thus far by this group.
Additionally, shareholder suits declined in 2008 and 2009, but have experienced an uptick in 2010. For the year through 30 April 2010, shareholder suits have represented approximately 40% of all lawsuits, though this number is influenced by seven separate shareholder derivative and class action claims filed against Goldman Sachs in April regarding synthetic CDOs.
Litigation Involving Nationally Recognized Statistical Rating Organizations (NRSROs)
Shareholder class action suits against the rating agencies have mostly survived motions to dismiss and are allowed to proceed. In addition, Moody’s announced on 7 May 2010 that it received a Wells Notice from the SEC.
The rating agencies have been targeted in litigation since 2007, both in securities class actions, and in many instances, as named defendants in investor suits. All three major credit rating agencies—Filmac (Fitch), McGraw-Hill (S&P), and Moody’s—face shareholder class action suits. The SEC’s Wells Notice against Moody’s in March 2010 alleges “false and misleading” statements in the company’s application to register as a Nationally Recognized Statistical Rating Organization (NRSRO).7
In the consolidated amended securities class action against Moody’s, plaintiffs alleged that the company “made material misrepresentations and omissions in public statements respecting: (1) Moody’s business, business conduct, and independence; (2) the meaning of Moody’s credit ratings; (3) the method of Moody’s credit ratings; and (4) the manner in which Moody’s had generated financial results and growth.”8
On 18 February 2009, Judge Shirley Kram rejected the defendants’ motions to dismiss the case in full, but did trim some of the claims. Judge Kram’s order outlines the importance of scienter and loss causation as legal requirements in cases brought under Rule 10b-5. According to Judge Kram’s order, “[t]he [amended complaint] does not sufficiently allege scienter” with respect to the company’s chief operating officer and chief regulatory and compliance officer. With respect to the CEO (Raymond McDaniel), the Judge ruled that Plaintiffs had in fact pleaded sufficient facts to allege scienter.9 On the topic of loss causation, the Judge ruled that the “Plaintiffs have met their burden for pleading loss causation” and the amended complaint “alleges sufficient corrective disclosures regarding Moody’s independence, integrity, and ratings methodologies to survive Defendants’ motion to dismiss.”10

www.nera.com 9
Products at Issue Include ARS, CDOs, CP, and CDS
We also classify credit crisis filings according to the type of product or security at issue in the case. We identify different products/securities involved in the filings: (1) mortgage loans, (2) commercial and construction loans, (3) fund shares (e.g., mutual fund, hedge fund), (4) commercial paper (CP), (5) ARS, (6) CMBS, (7) ABS/MBS, (8) CDOs, and (9) CDS. These categories are not mutually exclusive and in many instances, multiple types of securities are involved in each filing. For example, in the case against Luminent Mortgage Capital, the plaintiffs in the shareholder class action claim that the company invested in “mortgage-backed securities” as well as “residential mortgage loans,” which were allegedly not “high quality.” Plaintiffs further claim that the true facts regarding the nature of the investments in both MBS and residential mortgage loans were concealed from the public, and as a result, Luminent’s stock price allegedly traded at inflated levels.11 This case would be classified as involving mortgage loans and ABS/MBS.12 The product types involved in the credit crisis litigation are shown in Exhibit 7.
Mortgage Loans
Year Share of Total Cases
2007 ||||||||||||||||||||||||||||||||||||||| 39.1%
2008 ||||||||||||||||||||| 21.2%
2009 ||||||||||||||| 15.4%
2010 ||||||| 7.4%
Commercial Loans
Year Share of Total Cases
2007 ||| 2.9%
2008 ||||| 4.7%
2009 |||||||||| 9.6%
2010 ||||||||||| 11.1%
Fund Shares
Year Share of Total Cases
2007 |||||||||| 10.1%
2008 ||||||||| 8.8%
2009 ||||||||| 8.8%
2010 0.0%
ARS
Year Share of Total Cases
2007 | 1.4%
2008 |||||||||||||||||||||| 21.8%
2009 |||||||||||||||||||| 19.9%
2010 ||||||| 7.4%
CMBS
Year Share of Total Cases
2007 | 1.4%
2008 | 0.6%
2009 |||| 4.4%
2010 ||||||| 7.4%
ABS & MBS
Year Share of Total Cases
2007 |||||||||||||||||||||||||| 26.1%
2008 ||||||||||||||||||||||||||||||| 31.2%
2009 |||||||||||||||||||||||||||||||| 32.4%
2010 |||||||||||||||||||||||||||||| 29.6%
Exhibit 7. Credit Crisis Filings by Product Type

www.nera.com 10
The early litigation that occurred in 2007 largely involved lenders, originators, and home builders, and as such, many of the claims were related to increased accounting provisions (i.e., increases in reserves) for mortgage loans and mortgage loan charge-offs due to impairment. In fact, in 2007, 39.1% of credit crisis claims involved allegations relating to mortgage loans. By comparison, in 2010 thus far, only 7.4% of claims involve mortgage loans. Products such as ABS/MBS, CDOs, and CDS now make up the majority of the recent securities credit crisis lawsuits. CDOs and CDS have both recently seen a surge in litigation as the controversy involving synthetic CDOs has moved into the spotlight.
Synthetic CDOs, a type of collateralized debt obligation where the underlying collateral is a portfolio of CDS, have not exceeded 21% of global CDO issuance in any quarter since 2005. In fact, total synthetic CDO issuance from 2005 through 2009 was $161.0 billion, approximately 12% of the $1.3 trillion total CDO issuance globally in the same time period. Exhibit 8 below illustrates global issuance of synthetic CDOs relative to all CDO issuance quarterly. The allegations in the synthetic CDOs lawsuits include alleged failures of appropriate disclosure regarding CDS counterparties with “economic interests directly adverse to investors” and intentional or reckless misrepresentation of offering documents including term sheets and offering memorandums.13
Exhibit 7. Credit Crisis Filings by Product Type (continued)
Commercial Paper
Year Share of Total Cases
2007 ||| 2.9%
2008 | 1.2%
2009 || 2.2%
2010 0.0%
CDS
Year Share of Total Cases
2007 ||| 2.9%
2008 |||||||| 7.6%
2009 |||||||| 8.1%
2010 ||||||||||||||||||||||||||||||||||||||||| 40.7%
CDOs
Year Share of Total Cases
2007 ||||||||||||||||||||||| 23.2%
2008 |||||||||||||||||||| 20.0%
2009 |||||||||| 10.3%
2010 ||||||||||||||||||||||||||||||||||||| 37.0%
Notes and Sources: Filings for 2010 are as of 30 April. NERA collected lawsuits from various sources, including Factiva, Bloomberg, AP News, Securities Law360, The Wall Street Journal, and BusinessWeek. Counts include ERISA claims, shareholder derivative actions, individual state and federal cases, international cases, state and federal shareholder class actions, and other types of cases.

www.nera.com 11
Exhibit 8. Synthetic Share of Global CDO Issuance
Synthetic Non-Synthetic
Notes and Sources: Data are from SIFMA. Synthetic CDOs sell credit protection via credit default swaps (CDS) rather than purchase cash assets. Synthetic CDOs use CDS to synthetically replicate a cash flow CDO. Funded tranches require the deposit of cash to an SPV at the inception of the deal to collateralize portions of the SPV’s potential swap obligations in the transaction; losses result in principal writedowns of the issued notes. Non-synthetic issuance includes market value, cash flow, and hybrid CDOs.
15% 17% 14%
21% 12%
18%
9% 12%
15% 8%
6% 6% 0% 5% 0% 3% 13% 0% 18% 4% 0%
20
40
60
80
100
120
140
160
180
200
Q1 Q2 Q3 Q4 Q1 Q2 Q3 Q4 Q1 Q2 Q3 Q4 Q1 Q2 Q3 Q4 Q1 Q2 Q3 Q4 Q1
2005 2006 2007 2008 2009 2010
Glo
bal C
DO
Issu
ance
($ b
illio
ns)

www.nera.com 12
A Rise in Bankruptcy Trends
Another recent trend is the rise in businesses declaring bankruptcy since 2007 and the relative increase in the share of financial companies filing for bankruptcy in the wake of the crisis and recession.14 We analyzed the 20 largest public company bankruptcies in each year between 2000 and 2010.15 Among those filings, financial, insurance, and real estate companies never made up more than two in any year between 2001 and 2006 inclusive. However, in 2007, 2008, and 2009, financial, insurance, and real estate companies accounted for six, nine, and nine of the 20 largest bankruptcies in those years, respectively. Many of these companies included real estate investment trusts like General Growth Properties, as well as savings and loan institutions like Washington Mutual and IndyMac Bancorp. The breakdown of the top 20 largest public company bankruptcies by sector and year is shown in Exhibit 9.
Exhibit 9. Top 20 Largest Public Company Bankruptcy Filings by Year
0
4
8
12
16
20
2000 2001 2002 2003 2004 2005 2006 2007 2008 2009 2010
Other
Retail Trade
Transportation, Communications, Electric, Gas, And Sanitary Services
Manufacturing Services Finance, Insurance, And Real Estate
Notes and Sources: Data are from BankruptcyData.com. "Other" includes companies in mining, construction, and wholesale trade.

www.nera.com 13
Decisions Show Mixed Signals: Over $2.1 Billion in Settlements Thus Far, Yet Many Decisions Granting Dismissals
Exhibit 11. Credit Crisis Settlements by Type of Matter
Notes & Sources: NERA collected settlements from various sources, including Factiva, Bloomberg, AP News, Securities Law360, The Wall Street Journal, and BusinessWeek.
Securities Class
Action Settlement
$1,744,449,000
82%
ERISASettlements
$219,750,00010%
Private Civil Matters177,800,000
8%Shareholder
DerivativeSettlements$950,000
0%
Exhibit 10. Types of Decisions in the Credit Crisis Litigation
Voluntary Dismissal
22
Dismissal Denied
20Dismissal Granted
72
Settlement 23
Notes & Sources: NERA attempts to capture any decisions and settlements associated with the credit crisis filings; they do not necessarily represent the final status of these lawsuits. NERA collected decisions and settlements from various sources, including Factiva, Bloomberg, AP News, Securities Law360, The Wall Street Journal, and BusinessWeek. Counts include ERISA claims, shareholder derivative actions, individual state andfederal cases, international cases, state and federal shareholder class actions, and other types of cases. Dismissals include those both with or without prejudice.
Partial Dismissal/
Denial18
We have recorded 155 decisions and settlements in 139 cases, representing approximately 35% of the credit crisis filings. We attempt to capture any decisions and settlements associated with the credit crisis filings that we track; they do not necessarily indicate the final status of these lawsuits. Additionally, multiple decisions and settlements (e.g., dismissal denied followed by a settlement) are each recorded and counted separately. The types of decisions are detailed in Exhibit 10 below.
We have recorded over $2.1 billion in credit crisis settlements through 30 April 2010.16 Of the $2.1 billion, roughly $1.7 billion or 82% have arisen from class action settlements. Exhibit 11 shows the breakdown of settlements by type of matter.

www.nera.com 14
Recent Decisions: A Review
Finally, we discuss some of the recent decisions and settlements in the credit crisis filings. First we describe two decisions granting motions to dismiss: one in an ARS case where plaintiffs were separately pursuing litigation after participating in a settlement that the defendant made with regulators to compensate investors, and a second in which the judge ruled on claims for liability based on the duty of oversight. We also look into a third decision in which the motion to dismiss was denied and discuss the role of the ratings agencies and their contributions to the credit crisis. The section concludes with a brief discussion on recent settlements.
In Re UBS Auction Rate Securities LitigationUBS’ auction-rate securities litigation—similar to ARS lawsuits facing other financial institutions—involved investors who alleged that the company had inadequately disclosed the extent to which it intervened in auctions for ARS that it had underwritten. In February 2008, when UBS and other major broker-dealers allegedly stopped supporting the auctions, there was widespread auction failure, which left investors holding illiquid ARS. UBS had subsequently entered into a settlement in August 2008 with state and federal regulators and law enforcement to restore liquidity to its investors’ ARS holdings.17 It is this settlement that Judge McKenna noted in his order granting UBS’ motion to dismiss:
Given that Plaintiffs have availed themselves of the relief provided for in the Regulatory Agreement, Plaintiffs cannot now allege out-of-pocket damages. When Plaintiffs elected to have UBS buyback their ARS at par value, they received a full refund of the purchase price. Therefore, Plaintiffs have already been returned to the position they were in before they purchased the ARS and before any fraud ensued. They paid $25,000 per share for ARS and have now received $25,000 per share plus the interest or dividends the ARS accrued during the period Plaintiffs held them. And though Plaintiffs allege that they “overpaid” for the ARS, the full refund they received certainly accounted for an inflated purchase price. In sum, Plaintiffs’ out-of pocket damages are necessarily zero because after choosing to rescind the ARS purchases, Plaintiffs have effectively paid nothing for their ARS.18
In Re American International Group, Inc. Derivative LitigationIn the AIG derivative litigation, plaintiffs alleged breaches of fiduciary duty, waste of corporate assets, and unjust enrichment, as well as violations of Rule 10b-5 and Section 20 of the 1934 Exchange Act. Plaintiffs asserted, among other allegations, that AIG’s officers and directors had failed to properly oversee AIG’s CDS and materially misstated and made omissions regarding AIG’s financial health.19 In her order granting AIG’s motion to dismiss, Judge Swain noted, “A plaintiff may not support a claim for liability based on the duty of oversight (known as a ‘Caremark claim’) merely by identifying signs of general difficulty in the market in which the company participates and asserting that the defendants should be held liable for exercising their business judgment in a manner that appears to have been inconsistent with those indications.”20

www.nera.com 15
King County, Washington et al. v. IKB Deutsche Industriebank AG, et al.In April 2010, Judge Scheindlin denied S&P and Moody’s motion to dismiss in a suit against IKB Deutsche Industriebank and the ratings agencies. The suit involves two institutional investors that brought putative class actions for common law fraud involving a structured investment vehicle (SIV), Rhinebridge, and the collapse of the senior notes that it issued. IKB was the transaction sponsor of the SIV. The senior notes were assigned triple-A ratings by the ratings agencies in June 2007 and, within four months, had been downgraded to junk status. The Plaintiffs allege that the high ratings concealed the true risk contained in the SIV due to its investments in “toxic” assets and, as a result of the SIV’s inability to obtain funding following the downgrade, the senior notes collapsed in value, causing millions of dollars in losses.21 Judge Scheindlin noted that IKB’s motions would be addressed in a separate ruling and that this one pertained only to S&P and Moody’s. S&P and Moody’s motion to dismiss asserted, among others, that it was the credit crisis and not the “materialization of the risk allegedly concealed by the Top Ratings that caused plaintiffs’ losses.”22 Judge Scheindlin characterized her role as follows: “a court’s task when ruling on a motion to dismiss is to ‘constru[e] the complaint liberally, accept[] all factual allegations in the complaint as true, and draw[] all reasonable inferences in the plaintiffs’ favor.’”23 Given these parameters, she opined, “To hold that plaintiffs failed to plead loss causation solely because the credit crisis occurred contemporaneously with Rhinebridge’s collapse would place too much weight on one single factor and would permit S&P and Moody’s to blame the asset-backed securities industry when their alleged conduct plausibly caused at least some proportion of plaintiffs’ losses.”24 While she ruled against the ratings agencies that the credit crisis may not have caused all of the plaintiffs’ losses, she also cautioned:
…it is not necessary for me to accept plaintiffs’ position that ‘the Rating Agencies were in fact one of the major causes of any so-called global crisis that may have occurred in late 2007.’ Blame for the financial crisis can be, and has been, spread globally—from the financial sector’s increasingly complex financial products, to mortgage originators, to the government’s loosened regulatory practices and its failure to respond to the collapse and substantial weakening of multiple financial powerhouses. While the Ratings Agencies’ actions may have been a ‘substantial factor’ in causing the loss, that is not tantamount to labeling their conduct a ‘major cause’ of the global financial crisis.25
Recent SettlementsCharles Schwab recently agreed to a $235 million settlement to resolve its pending class action in which plaintiffs had alleged, among others, that the company had misrepresented its YieldPlus Fund and that the ultra short duration it had touted was actually much longer.26 In addition, the Plaintiffs had claimed that the Funds’ assets were not well diversified and concentrated in the mortgage industry.27
In our previous article, we discussed the Countrywide class action case and the December 2008 decision in which Judge Pfaelzer largely denied defendants’ motions to dismiss. Countrywide settled the class action in April 2010 for $600 million (with its former auditor agreeing to pay an additional $24 million).28

www.nera.com 16
The Stakes Remain High
While the credit crisis lawsuits are being filed at a slower pace than in previous years, the current lawsuits are now focused on structured products and derivatives, and we expect similar suits in light of the SEC case against Goldman Sachs in April 2010 involving synthetic CDOs. Also, as many of the early lawsuits against lenders and brokers work their way through the system and lawsuits involving structured products continue to be litigated, settlements and judgments will be the next chapter in this story as they will surely impact the current financial and economic landscape.
www.nera.com 17
* The authors would like to thank David Tabak for his insightful comments. All errors and omissions are ours.
1 Faten Sabry, Anmol Sinha, and Sungi Lee, “Subprime Securities Litigation: Key Players, Rising Stakes, and Emerging Trends,” The Journal of Alternative Investments, Vol. 11, No. 2 (Fall 2008). In our previous publication released in July 2008, filings were as of 21 March 2008.
2 The total credit losses and writedowns are from Bloomberg, L.P. as of 12 May 2010. US GDP for 2009 was $14.3 trillion in current dollars according to the Bureau of Economic Analysis.
3 We do not include cases related to predatory lending, mortgage loan repurchase disputes, arbitration claims, or consumer finance.
4 We rely on Bloomberg, L.P. for data on writedowns and credit losses. According to Bloomberg, L.P., the data on the writedowns are from regulatory filings, press statements, company-published reports, and executives’ public remarks in events such as earnings conference calls.
5 Susan Pulliam et al., “Wall Street Probe Widens,” The Wall Street Journal (May 12, 2010).
6 Rule 10b-5, § 240.10b-5, Employment of manipulative and deceptive devices.
7 Moody’s Corporation, Form 10-Q for the period ending March 31, 2010.
8 Order at 1, In re Moody’s Corporation Securities Litigation, No. 07-CV-8375 (SWK) (S.D.N.Y) filed February 18, 2009 (order granting motion to dismiss in part and denied in part).
9 Order at 40, In re Moody’s Corporation Securities Litigation, No. 07-CV-8375 (SWK) (S.D.N.Y) filed February 18, 2009 (order granting motion to dismiss in part and denied in part).
10 Order at 34, In re Moody’s Corporation Securities Litigation, No. 07-CV-8375 (SWK) (S.D.N.Y) filed February 18, 2009 (order granting motion to dismiss in part and denied in part).
11 Complaint at 6,19, Rosenbaum Capital LLC, et al., v. Luminent Mortgage Capital, Inc. et al., No. 07-CV-04073 (N.D.Ca) filed August 9, 2007.
12 Note that indirect exposure is not considered in these classifications. Only products directly identified are considered. For example, if a lawsuit only involves an entity’s CDO holdings, the product classification for that case will only be CDOs, regardless of whether the CDO itself is backed by ABS, MBS, or whole loans.
13 See, for example, Complaint, Securities and Exchange Commission v. Goldman Sachs & Co. and Fabrice Tourre, No. 10 Civ. 3229 (BJ) (S.D.N.Y. filed April 16, 2010). The shareholder derivative and class action suits against Goldman Sachs also have similar allegations.
14 American Bankruptcy Institute.
15 We classified each company according to its SIC code. Companies are classified into retail trade, wholesale trade, transportation, communication, electric, gas, and sanitary services, construction, mining, manufacturing, services, and financial, insurance, and real estate.
16 Our records include tentative settlements, which have not been approved by court order.
17 Memorandum and Order at 4-5, In Re UBS Auction Rate Securities Litigation, No. 08 CV 2967 (LMM) (S.D.N.Y. filed March 30, 2009).
18 Memorandum and Order at 11-12, In Re UBS Auction Rate Securities Litigation, No. 08 CV 2967 (LMM) (S.D.N.Y. filed March 30, 2009).
19 Opinion and Order at 1, In Re American International Group, Inc. Derivative Litigation, No. 07 Civ. 10464 (March 30, 2010).
20 Opinion and Order at 21, In Re American International Group, Inc. Derivative Litigation, No. 07 Civ. 10464 (March 30, 2010).
21 Opinion and Order at 2-5, King County, Washington et al. v. IKB Deutsche Industriebank AG, et al., No. 09 Civ. 8387 (SAS) (S.D.N.Y filed April 26, 2010).
22 Opinion and Order at 16, King County, Washington et al. v. IKB Deutsche Industriebank AG, et al., No. 09 Civ. 8387 (SAS) (S.D.N.Y filed April 26, 2010).
23 Opinion and Order at 23, King County, Washington et al. v. IKB Deutsche Industriebank AG, et al., No. 09 Civ. 8387 (SAS) (S.D.N.Y filed April 26, 2010).
24 Opinion and Order at 19, King County, Washington et al. v. IKB Deutsche Industriebank AG, et al., No. 09 Civ. 8387 (SAS) (S.D.N.Y filed April 26, 2010).
25 Opinion and Order at 25, King County, Washington et al. v. IKB Deutsche Industriebank AG, et al., No. 09 Civ. 8387 (SAS) (S.D.N.Y filed April 26, 2010).
26 “Schwab to Pay $35 Million to Settle YieldPlus Fund Suit.” Dow Jones Business News, (May 5, 2010).
27 Complaint at 7, Mike Labins v. The Charles Schwab Corporation, et al., No. CV 085150 (N.D. Cal filed Mar. 18, 2008).
28 Jonathan Stempel, “BofA’s Countrywide in $624 million lawsuit settlement,” Reuters (May 7, 2010).
Notes

About NERANERA Economic Consulting (www.nera.com) is a global firm of experts dedicated to applying economic, finance, and quantitative principles to complex business and legal challenges. For half a century, NERA’s economists have been creating strategies, studies, reports, expert testimony, and policy recommendations for government authorities and the world’s leading law firms and corporations. We bring academic rigor, objectivity, and real world industry experience to bear on issues arising from competition, regulation, public policy, strategy, finance, and litigation.
NERA’s clients value our ability to apply and communicate state-of-the-art approaches clearly and convincingly, our commitment to deliver unbiased findings, and our reputation for quality and independence. Our clients rely on the integrity and skills of our unparalleled team of economists and other experts backed by the resources and reliability of one of the world’s largest economic consultancies. With its main office in New York City, NERA serves clients from more than 25 offices across North America, Europe, and Asia Pacific.
Contact For further information and questions, please contact:
Dr. Faten Sabry
Senior Vice President
+1 212 345 3285
The opinions expressed herein do not necessarily represent the views of
NERA Economic Consulting or any other NERA consultant.