part2: software hardware architectureathena.ecs.csus.edu/~yaoz/pdf/abmpart2-softwarehardware.pdf ·...
TRANSCRIPT

Part2: Software & hardware architecture
1NYBPM Users Group Meeting, June 8, 2011

Topics Software architecture
Data structures Algorithms Distributed computing Outputs and visualization Outputs and visualization
Hardware architecture ARC ABM example ARC ABM example
2NYBPM Users Group Meeting, June 8, 2011

CT‐RAMP: Software Design Concept
SANDAG•UEC spreadsheets•Market definitions
CT‐RAMP:•Model Flow•Model Components•Inputs/Outputs
Common Modeling Framework:•Matrix Classes
Inputs/Outputs
•LogitModel•Utility Expression Calculator
NYBPM Users Group Meeting, June 8, 2011 3

Common Modeling Framework A library of tools for building transport and land‐use modelsW i i h J i l Written in the Java programming language
Open source (Apache public license)C ll b i Collaborative
Currently used by over 30 clients
NYBPM Users Group Meeting, June 8, 2011 4

Wh J ?Why Java?
Java is a fully Object‐Oriented Programming (OOP) Language
Java is easy to learn and use Java encourages good software design Java natively supports multi‐threading Java is architecture‐neutral
NYBPM Users Group Meeting, June 8, 2011 5
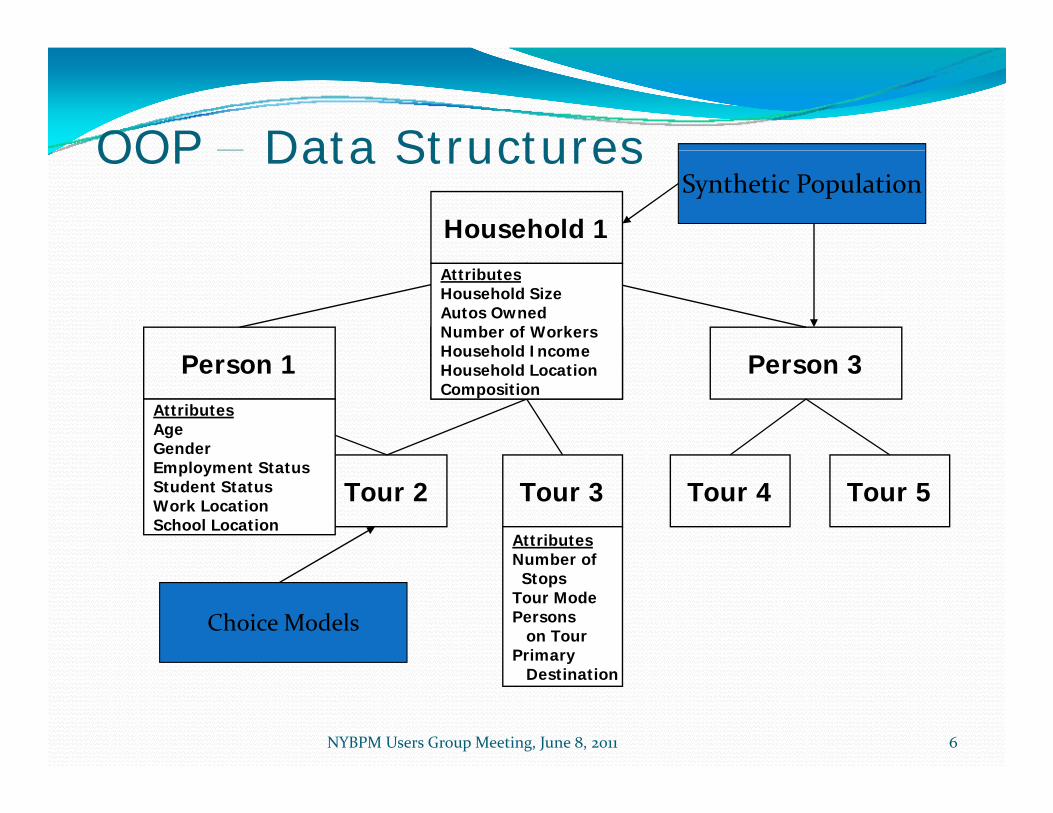
OOP – Data Structures
Household 1
Synthetic PopulationOOP Data Structures
P 2P 1 P 3
AttributesHousehold SizeAutos OwnedNumber of WorkersHousehold Income
Person 2Person 1 Person 3Household IncomeHousehold LocationComposition
AttributesAgeGender
Tour 1 Tour 2 Tour 3 Tour 4 Tour 5Employment StatusStudent StatusWork LocationSchool Location
AttributesNumber ofNumber of Stops
Tour ModePersons
on TourPrimary
Choice Models
NYBPM Users Group Meeting, June 8, 2011 6
yDestination

Interaction between models and dataInteraction between models and data
HouseholdDataManager
Household 1
Person 2Person 1 Person 3
AttributesHousehold SizeAutos OwnedNumber of WorkersHousehold IncomeHousehold Location
Tour 1 Tour 2 Tour 3 Tour 4 Tour 5
Household LocationComposition
AttributesAgeGenderEmployment StatusStudent StatusWork LocationSchool Location
AttributesNumber ofNumber of Stops
Tour ModePersons
on TourPrimary
Destination
NYBPM Users Group Meeting, June 8, 2011 7

CMF Tools – Matrix Package Read/write to/from all major software (TransCAD, Cube, Emme, etc)
Matrix calculations Matrix calculations Random access (skims in memory, sparse matrices) N‐dimensional matrix, iterative proportional fittingd e s o a at , te at ve p opo t o a tt g
NYBPM Users Group Meeting, June 8, 2011 8

CMF Tools – Model Package Create and apply discrete choice models Flexible in specification of nesting structures “Interface” pattern used – any object can be an alternativeE i d b i f Extensive debugging features
NYBPM Users Group Meeting, June 8, 2011 9

CMF T l M d l P kCMF Tools – Model Package/** A simple mode choice model*/LogitModel.add()
public class MyModeChoiceModel {
public runModel(){
//instantiate modes
g ()takes a Mode
getUtility() solves logit model, returns logsum
//instantiate modesDriveAlone driveAlone = new DriveAlone();Transit transit = new Transit();
//instantiate model
g
//LogitModel model = new LogitModel;
//add modes to modelmodel.add(driveAlone);m d l dd(tr n it);
Uses Monte Carlo to select alternative according to logit
b bili i d model.add(transit);
//calculate utilitiesdouble logsum = model.getUtility();
probabilities and returns it.
NYBPM Users Group Meeting, June 8, 2011 10
//choose ModeMode chosenMode = (Mode) model.chooseAlternative();
}}

CMF Tools – Calculator Package Activity‐based models typically utilize many logit choice models, some with many alternatives
Traditional software relies on hard‐coded utility equationsTraditional software relies on hard coded utility equations Inefficient ‐ Programmer responsible for coding utility equations Inflexible – Requires programmer to change equations and
recompilerecompile Imperfect – Only one person typically reviews equations, which
increases probability of bugs Utility Expression Calculator (UEC) developed to overcome Utility Expression Calculator (UEC) developed to overcome these limitations
NYBPM Users Group Meeting, June 8, 2011 11

CMF Tools – Calculator Package
The UEC is a Java package that reads and interprets an Excel workbook containing a interprets an Excel workbook containing a logit model specification and its inputs
The UEC solves the utility equations for a y qgiven decision‐maker
The UEC “opens up” the model specification p p p– anyone can edit the spreadsheets, change inputs & parameters, check that the model is
l ifi d
NYBPM Users Group Meeting, June 8, 2011 12
properly specified, etc.

UEC ‐ Data PageTable Data: CSV files of zonal, household, or person data
Matrix Data: Trip tables or level-of-service skims in zone-f t (TPPLUS TRANSCAD EMME2 d/zone format (TPPLUS, TRANSCAD, EMME2, and/or
BINARY formats)
(Sparse matrices can be compressed in memory)
NYBPM Users Group Meeting, June 8, 2011 13

UEC ‐Model Page ‐ Tokens
NYBPM Users Group Meeting, June 8, 2011 14

UEC – Model Page ‐ Utilities
NYBPM Users Group Meeting, June 8, 2011 15

Threading
Quad‐core Intel Box with 4 GB RAM per process
Workplace Location Choice
Thread 1: households 1‐50,000
Household Data
Manager
Thread 2: households 50,001‐100,000Thread 3: households 100,001‐150,000
NYBPM Users Group Meeting, June 8, 2011 16
Thread 4: households 150,001‐200,000

Distribution
MasterNode
TaskScheduler Results
ResultsWriter
NYBPM Users Group Meeting, June 8, 2011 17

Grid Computing via the Java p gParallel Processing Framework

ABM Outputs
HID PID TID PUR MOD SB SA OTAZ DTAZ S1TAZ S2TAZ TLOR TLDS1 1 1 2 1 0 1 943 987 0 964 1 3
Household Data, Person Data, Tour/Trip List
1 1 1 2 1 0 1 943 987 0 964 1 3 1 1 2 1 2 1 0 943 731 856 0 3 3 1 2 1 4 1 0 0 943 952 0 0 1 2 1 3 1 2 4 1 1 943 565 698 982 1 2
Work Trip Frequency Distribution:Auto Ownership 1, Income Group 1-2
Estimated vs. Observed
4.0%
5.0%
6.0%
cy
Observed
Trip Tables
0.0%
1.0%
2.0%
3.0%
5 8 11 14 17 20 23 26 29 32 35 38 41 44 47 50 53 56 59
Peak Highway Travel Time (minutes)
Freq
uenc Estimated
NYBPM Users Group Meeting, June 8, 2011 19
Other SummariesMaps, Graphics Assignment
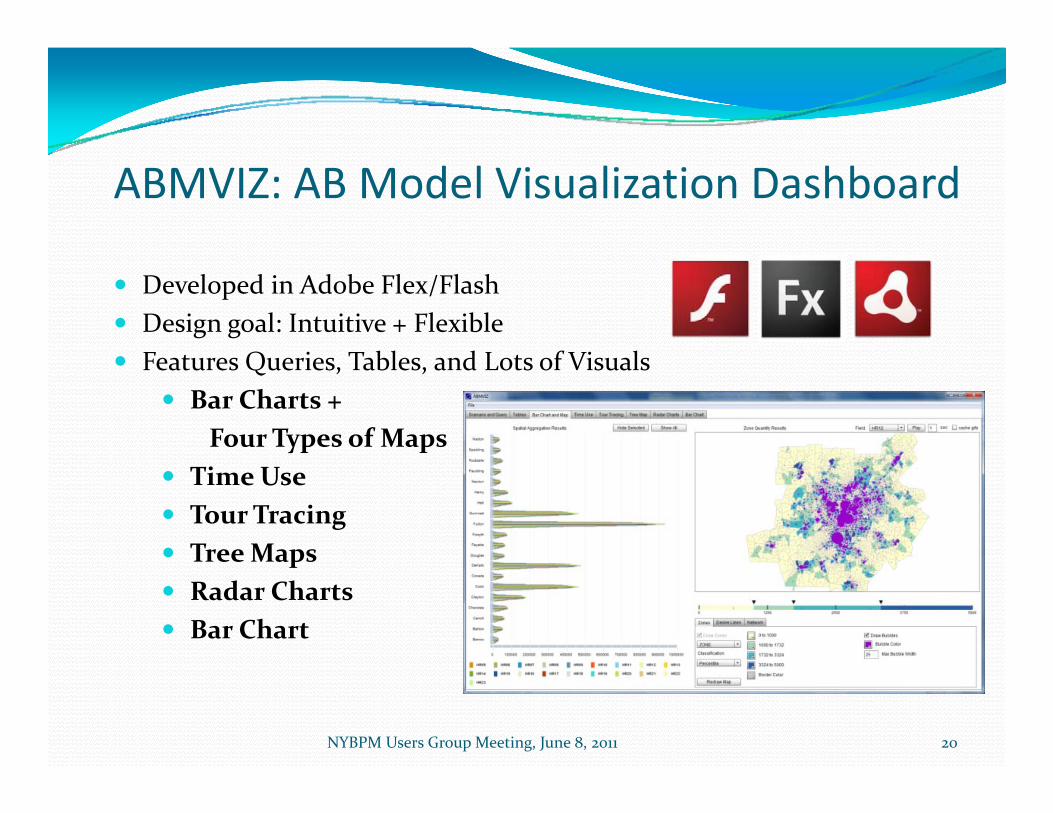
ABMVIZ: AB Model Visualization Dashboard
Developed in Adobe Flex/Flash Design goal: Intuitive + Flexible
F t Q i T bl d L t f Vi l Features Queries, Tables, and Lots of Visuals Bar Charts +
Four Types of Maps Time Use Tour Tracing Tree MapsTree Maps Radar Charts Bar Chart
20NYBPM Users Group Meeting, June 8, 2011

ARC ABM Reporting Database
Stores ABM Output Tables, Travel Time Skim Data, and Select Inputs By Scenario Around 15 GBs per scenario Around 5–10 scenarios at a time in the DB Can load survey data into DB as a scenario for comparison purposes
Needs to be fast – not a traditional transactional DB, more a data warehouse Use de‐normalized data to avoid millions of joins each time for
dynamic visualization dashboardR d l i i l llb k f i d Read‐only; minimal rollback features required
Parallel query functionality (SQL Server) Needs excellent query caching functionalityU ARC E t i SQL S ith Li d P Use ARC Enterprise SQL Server with 4 Licensed Processors

ABMVIZ QueriesInteractive query builder with lots of default queriesDifference
alternatives
Q
Aggregations
Edit SQL if desired
Aggregations
Save Tables to Save Tables to Clipboard, Excel

Bar Chart and MapBar Chart and MapCan interactively hide/show bars and redraw plot Select field to visualize
Cycle thru fields anredraw map
Zoom in/out with “+”/”‐” or mouse wheel
23NYBPM Users Group Meeting, June 8, 2011

Ti S t T li b I & P TTime Spent Traveling by Income & Person Type
NYBPM Users Group Meeting, June 8, 201124

T it Rid b A B F tTransit Riders by Age – Base vs. Future
NYBPM Users Group Meeting, June 8, 201125

Time UseCan change person type
Share of time use by purpose and person type
26NYBPM Users Group Meeting, June 8, 2011

Tracing of Activities/Tours
27NYBPM Users Group Meeting, June 8, 2011

Performance Measures with Radar Charts Compares independent measures across entities Compares independent measures across entities

Persons Not At Home By TAZ and Hour
29NYBPM Users Group Meeting, June 8, 2011

Special Reports for Pricing Number of high a users (persons ehicles) Number of highway users (persons, vehicles):
Toll users: Captive
AM Peak Toll Trips by Time SavedCaptive
By choice
Non‐toll users: Captive By choice
Toll revenue Toll revenue Equity analysis
NYBPM Users Group Meeting, June 8, 2011 30

ARC HOV2HOT Conversion StudyARC HOV2HOT Conversion StudyToll Share of Toll‐Eligible Trips by Time Saved
NYBPM Users Group Meeting, June 8, 2011 31

ARC HOV2HOT Conversion StudyARC HOV2HOT Conversion StudyDiurnal Distribution of Toll versus Non‐Toll Work Tours
NYBPM Users Group Meeting, June 8, 2011 32

ARC ABM Hardware and Software Setup• Three Windows Server 2003
64bit Machines:D l Q d C I t l X • Dual Quad Core Intel Xeon X5570 2.93 GHz with Hyper‐Threading 16 threads
• 32 GB of RAM• Cube Voyager + 8 seat Cube
Cluster license
• Total cost ~ $30,000 in 2009

Implementation Design Goals • Overnight run time Model Relevance
• Around 16 hours• Requires distribution and threadingRequires distribution and threading• Model runtime is roughly proportional to population size• Network skimming and assignment procedures are still proportional to
the squared number of TAZs: ~50% or more of total model runtime
• Commodity hardware Minimize total lifetime cost• Hardware available today from common vendors; reasonably priced
• Easy to Setup and Use Staff acceptance• Not too complicated to setup, run, debug, etcp p g

ARC ABM System DesignARC ABM System Design
NYBPM Users Group Meeting, June 8, 2011 35

Distributing and Threading CT‐RAMPM i C b i t ll th JPPF li t t t t CT RAMP• Main Cube script calls the JPPF client to start CT‐RAMP
• ~1.76 million households split into 880 tasks of 2000 HHs• CT‐RAMP data managed through:g g
• Household Manager – manages all HH and person data into RAM for quick I/O
• Matrix Manager – reads all the matrix data into RAM for quick I/Og q• Run a sample of HHs to save time: 33% 50% 100%• HHs and Persons store a random number seed to avoid
random number sequence order of processing problemsrandom number sequence order of processing problems• SPEED UP = 9X

ARC ABM Run Times
3325
0 1000 2000 3000 4000 5000 6000 7000 8000 9000 10000
Network Prep, Truck Model, Initial Skims
ARC ABM Run Times (min)
1400
24
25
112
6
II Demand with CT‐Ramp (33% Sample)
Convert Trip Lists to Demand Matrices
No Threading/Distribution (8 processors, 16GB RAM, 1 Computer)
Threaded and Distributed (24 processors, 48GB RAM, 3 computers)
170
2100
36
80
165
9
Highway & Transit Assignment & Skimming
II Demand with CT‐Ramp (50% Sample)
Convert Trip Lists to Demand Matrices
170
4200
52
75
310
Highway & Transit Assignment & Skimming
II Demand with CT‐Ramp (100% Sample)
C T i Li D d M i 52
173
437
13
75
100
Convert Trip Lists to Demand Matrices
Highway & Transit Assignment & Skimming
Highway Assignment (AM, PM, MD, NT)
NYBPM Users Group Meeting, June 8, 2011 37
8795970Total