partek - web.lib.aalto.fi · pdf file2 partek is minerals cargotec hiab loglift jonsered load...
TRANSCRIPT

ey’r ha
eg
in8neibe
t ad
inkif
aee
p b
reiethnoro--
--
-ete
ANNUAL GENERAL MEETINGThe annual general meeting of PartCorporation will be held on ThursdaApril 20, 1995 at 5 p.m. at the companyDevelopment Centre in Pargas. Shaholders whose names are registeredMonday April 10, 1995 at the latest witthe Partek register kept by the CentrShare Register of Finland Cooperativare entitled to take part in the annual gneral meeting. All shareholders wishinto attend must notify the head office Pargas by 4 p.m. on Tuesday April 11995 at the latest, either by telepho(+358-21-742 6056) or in writing at thaddress 21600 Pargas, Finland. Possproxies must be notified at the same tim
DIVIDENDThe board of directors proposes thadividend of FIM 0.60 per share, i.e. total of FIM 23,100,000, be distribute
k
se-on
le-
,e
le.
a
and that the dividend can be drawn froshareholders’ bank accounts on May1995. If a shareholder has not given formation about his bankers to the booentry securities register, the dividend wbe paid to the shareholder in the form opostal order.
Dividends that will be paid as postorders will be in the Post Office on thday the dividend is paid in order that thmay be delivered to the payee. Sharehders whose names are registered on A26, 1995 with the Partek register keptthe Central Share Register of Finland Coperative are entitled to a dividend.
Shareholders who have not transfertheir shares to the book-entry securitsystem by the record date will be paid dividend after the shares have been traferred to the system. The dividend f1994 falls within the sphere of the corpration tax avoir fiscal system. Withhold
1
m2,--
ll a
l
yol-rily
o-
dses-
ing tax will be deducted from dividendspaid overseas.
PARTEK’S FINANCIALREPORTS
Partek’s financial statements are published in March. The annual report is published in Finnish, Swedish and English inApril. Partek publishes two interim re-ports, the first for the period January 1 April 30, 1995 on June 20, 1995 and thsecond for the period January 1 - Augus31, 1995 on October 23, 1995. The abovreports may be ordered from:Partek Corporation,Annual Reports,P.O. Box 61,FIN-00501 Helsinki, Finland,or by telephone: +358-0-39 441.
l-d
ed-ic-
At the end of the period under reviewthere were 12,060 shareholders. Foreigowners accounted for 30.8 percent of thshare capital and voting rights.
Key products and marketsPartek’s key products are:- products processed from limestone
and other minerals- cargo-handling equipment for
vehicles- precast concrete elements and struc-
tures, rock wool insulation and panels
Partek is an international industrialgroup. Its three business areas are Mine-rals, Cargotec and Building Products.Partek also has a 25 percent holding in theEuroc Group. Partek has operations inmore than 20 countries and employs over8,000 people. Partek’s net sales total FIM6 billion, 80 percent of which are genera-ted outside Finland. Partek was establis-hed at Pargas, on the Southwest coast ofFinland, in 1898.
Partek’s shares have been quoted onthe Helsinki Stock Exchange since 1915.
P A R T E K
ne
Cargotec’s products and Partek’s buiding products technology are marketeworldwide. The markets for Mineralsand insulation, which is within the Buil-ding Products business area are focuson the Baltic region. The principal markets for precast concrete are the Nordcountries, Holland, Belgium and Germany.

P A R T E K I S
se
nwtte t w
a
n-or-al.strec-
cts.nt.l
ng-gol
M I N E RA L S
NordkalkIndustrial Minerals
The Minerals business area consistNordkalk and Partek Industrial Minals. Nordkalk is the Nordic countriebiggest lime producer, with limestoquarries and mines in Finland and Sden. Partek Industrial Minerals operain Finland, supplying mineral raw marials to the processing industry. Minals’ products are employed mainly inpaper, glass and metal industries asas in the chemical industry. Limestoproducts are also used in agriculturefor environmental purposes.
nd
CARGOTEC
HiabLoglift JonseredLoad & Waste Handling
ofr-s’ee-ese-r-heell
nend
The Cargotec business area includeHIAB, Loglift Jonsered, Load & WasteHandling and product-based sales companies. Sales are, however, principallthe responsibility of sales companieswhich carry a range of Cargotec productin Europe, Asia and North America. Car-gotec’s trademarks include HIAB,Loglift, FMV, JONSERED, Multilift,LeeBur, Norba, Focolift and Nummi.HIAB is the world’s leading producer ofknuckleboom cranes for vehicles. LogliftJonsered is the market leader in forestrcranes. Multilift and LeeBur manufac-ture interchangeable demountables anare market leaders in Europe.
2
InsulationPrecast Concrete NordicPrecast Concrete International
s
-y
s
y
d
The Building Products business area cosists of Insulation, Precast Concrete Ndic and Precast Concrete InternationThe principal products for the precaconcrete operations are hollow-coslabs, railway sleepers, precast strutures, bridge beams and special produSales of technology are also importaAll the insulation products are rockwoobased. The main products are buildiinsulation, technical insulation for industrial purposes, lightweight buildinpanels, acoustic products, rockwogrowing media, non-woven products atechnology sales.
BUILD INGPRODUCTS
-s-
n
EUROC, 25%The Swedish Euroc group produces anddistributes mineral-based building mate-rials mainly in the Baltic and North Searegions. Euroc is divided into seven busi-ness areas: Cement International, Cement
Nordic, Concrete and Aggregates, Concrete Products, Masonry Products, Platerboard and Building Materials Distribu-tion. Partek has a 25 percent holding iEuroc.
gned
OTHER BUSINESSACTIVITIES
Partek North America manufactures rockwool in the USA and Canada. Partek
Morin is in the precast concrete businein France. United Tiles, an associatecompany (50%), manufactures and seceramic tiles. A-Rakennusmies, an ass
ciated company (27%), leases buildinmachines. Real Estate Administratiosells real estate that is no longer includin Partek’s industrial operations.
ssd
llso-

1 9 9 4 I N B R I E F
SUMMARY OF OPERATIONS
• Net sales fell compared with 1993 asa result of changes in Group structure.
• The Finnish proportion of net salesfell to below 20 percent.
• Profit after financial items improvedby almost FIM 450 million andamounted to FIM 41 million (1993:FIM -407 million).
• Extraordinary costs include a reserof FIM 200 million for restructuring.
• The Group attracted over FIM 420million in new capital during the ye
• Partek acquired Metra’s holding annow owns 25 percent of the Swedicompany Euroc.
ve
ar.dsh
• The Norwegian Aker a.s came in asan owner in Partek with a holding of27 percent.
• The Board of Directors proposes thepayment of a dividend.
Sales 1994 1993
Net sales FIM million 6 166.3 6 609.8change % – 6.7 – 0.3foreign sales % 81.5 74.5
ProfitOperating profit after depreciation FIM million 231.5 4.1Profit after financial items FIM million 41.1 – 407.3
% of net sales % 0.7 – 6.2Profit before taxes FIM million – 202.6 – 433.9Net profit for the financial year FIM million – 193.9 – 392.5
Profitabil i tyReturn on capital employed % 6.1 0.2Return on equity after taxation % 3.7 – 19.8
ResourcesInvestment FIM million 580.6 158.5Balance sheet total FIM million 6 590.1 6 540.9Capital employed December 31 FIM million 5 221.6 5 186.4Personnel, average 8 128 9 428
Definitions pg. 35
3

F R O M T H E P R E S I D E N T
d
.
c
l
t,
f
l
d
o
-
-
.
s
f
,
n
-
,
l
;
f
l
l
e
-
2
g
e
n
s
e
For Partek the year 1994 marked
turning point in the Group’s fortunes
with developments taking on a favoura
ble trend after a period of considerab
difficulty.
This is true of the Group’s result
Partek was able to show a small pro
after financial items but the result is sti
unsatisfactory. It is also true of the Ba
ance Sheet, which was strengthen
through an injection of new equity. Fur
thermore, it is true of our role in the
Nordic building materials industry; since
the end of last year Partek has owned
percent of Euroc, the Swedish buildin
materials company. If we further tak
into account the fact that the Norwegia
company Aker became Partek’s large
shareholder, we can state that for th
third year in succession 1994 was a ye
of major changes.
In consequence Partek has now r
gained to a large extent its drive an
4
dynamism, qualities that were weakene
during the loss-making years.
Partek’s main interest now lies in
developing the Group’s core operations
These continue to be Minerals, Cargote
and Building Products and they are al
on course for achieving the level of prof-
itability that is their long-term goal.
This is reflected in a clear improve-
ment in their result. Improved demand in
most areas has contributed to this bu
first and foremost, it is a consequence o
different structural changes.
* * *
When Partek last year exercised its
option to buy Metra out of the company
in which we together held a quarter of
Euroc, we achieved one of the principa
goals of our restructuring process. This
began when the two companies merge
their Finnish interests in building mate-
rials in 1992.
Euroc can report a very favourable
upward trend and has also been able t
take full advantage of the synergy bene
fits offered by merging similar opera-
tions over national borders. Partek’s
share in Euroc’s result has had a consid
erable impact on Partek’s own result
We value our shareholding in Euroc
primarily as a strategic asset that enable
us to play a role in the building materials
industry in the Nordic countries. But it
can also be exploited to provide us with
the strength to expand within our core
operations.
Even though demand in a number o
important markets continues to be weak
Building Products as a whole has bee
able to report a clear improvement in
profitability.
This is true of Insulation, for exam-
ple, which has turned in a very encourag
ing profit that promises to improve even
a
-
e
it
l
-
d
5
t
e
ar
-
d
t
h
ts
-
s
s
s
ts
f
in
r
r,
-
t
.
e
a
to
o
s
th
in
e
n
h
a
s
.
e
d
e
e
a
of
l-
-
-
a
r
v-
r
r
r
’
re
l
d
t
at
-
s,
ss
e
-
es
u-
o
rs.
n
o
e
-
l
a
-
further. It also applies to our larges
precast concrete producer, the Dutc
VBI, which reported a good profit. VBI
has concentrated on industrial produc
which is the principal direction for the
whole of our precast concrete opera
tions. It is also worth noting that our
precast concrete activities in southea
Asia have achieved an established po
tion and are profitable.
Following the structural measure
taken in recent years there are still uni
that we do not regard as forming part o
our core activities. These are entered
this year’s financial statements unde
Other Business Activities and for the
most part are loss-making. Howeve
they also include units which have con
siderable potential even in the short term
The financial statements are intended
provide a framework that will facilitate
further measures in the coming period
There has been a marked improv
ment in Cargotec, which had its best ye
so far. Loglift Jonsered again proved
be a great success. The possibilities
further favourable development in thi
business area are strengthened by
measures taken to better efficiency
recent years. At the same time Cargot
has succeeded in improving its positio
in most of the market segments in whic
it operates.
Minerals has continued to show
steady improvement, not least becau
things are going well for its customers
The major investments made in th
1990’s but also the adaptations an
changes in production structure hav
borne fruit.
* * *
In order to achieve a reasonable lev
of profit for the whole Group further
improvements are needed in our oper
t
i-
.
o
-
r
f
e
c
e
l
-
tions and especially our loss-makin
activities need to be reduced. This and
clear strengthening of our equity/asse
ratio form Partek’s goal for this year.
* * *
Partek’s improved situation now pro
vides leeway for more expansive move
The expansion of the paper industr
in Finland has led to increased deman
for minerals, which means investment i
new capacity. An important goal is to
strengthen Partek’s position in lime op
erations around the Baltic Sea region.
We foresee good opportunities t
further consolidate Cargotec’s positio
as the leading company in load-handlin
equipment. This applies especially t
Asia, where the new regional office in
Singapore forms the base. The succe
of our company in Japan only confirm
this view. We are introducing a new
system that is better able to meet th
demands that recycling makes on equi
ment for the collection and transport o
waste.
As far as our precast concrete oper
tions are concerned the focus on indu
trial products has meant that we hav
been able to reduce our dependence
major building projects, which tend to
place an uneven load on capacity utiliza
tion. Our insulation activities have adop
ed as their immediate target to strengt
en their position, and by means of ne
investment among other measures,
become the leading supplier of rock woo
in the entire Baltic area.
* * *
All in all, one might conclude that
the next few years pose a number
challenges. However, economic deve
opment, which for the most part is fa
vourable in our key markets, also con
tains features that call for caution. I am
5
g
a
ts
-
s.
y
d
n
-
o
n
g
o
ss
s
e
p-
f
a-
s-
e
on
-
t-
h-
w
to
l
convinced that the current year will be
clear improvement over last year fo
Partek. Seasonal variations in our acti
ities, will however, adversely affect ou
result in the early part of the year.
I wish to thank our customers fo
their cooperation during the year. Ou
aim is to conform to our customers
requirements even better in the futu
and to keep our promises.
This view is certainly shared by al
our employees, who have actively an
loyally contributed to the fact tha
Partek’s fortunes have changed. For th
they deserve our gratitude.
Despite the fact that they have re
ceived no dividend for the past two year
Partek’s shareholders have neverthele
demonstrated their confidence in th
company in the way in which they read
ily subscribed to the new issue of shar
that was brought to a successful concl
sion at the end of 1994. We have als
acquired a number of new shareholde
I can and will promise that everybody i
the Partek Group is working hard t
ensure that all shareholders will receiv
a return on their investment in the com
pany. The Board of Directors’ proposa
to the Annual General Meeting for
dividend this year is a step in this direc
tion.
Christoffer Taxell

From
From
B O A R D O F D I R E C T O R S
6
7
6
5
5
7
6
5
7
6
Sakari T. Lehto and C.O. Tallgren
left: Tom Ruud, Jouko K. Leskinen, Cato A. Holmsen and Paavo Pitkäne
left: Björn Mattsson, Christoffer Taxell and Jan Ekberg.
Car l O lo f Ta l lg ren , b. 1927ChairmanM.Sc.(Pol.), Ph.D.(h.c.)Chairman of the Board ofÅbo Akademi University FoundationElected to Partek's Board: 1979Now elected for the period: 1994–199Shareholding in Partek: 1 228
Sakar i T . Leh to , b. 1923Vice-ChairmanPresident of Partek 1972–1987Ll.M., B.Sc. (Econ.), Minister,Dr.Tech. (h.c.), D.Sc. (Econ.) (h.c.)Elected to Partek's Board: 1976Now elected for the period: 1993–199Shareholding in Partek: 8 292
Jan Ekberg , b. 1936President and CEO of Pharmacia ABElected to Partek's Board: 1994Now elected for the period: 1994–199Shareholding in Partek: 1
Cato A . Ho lmsen, b. 1940M. Sc. (Tech.)President of Aker a.s, Cement andBuilding Materials divisionElected to Partek's Board: 1994Now elected for the period: 1994–199Shareholding in Partek: –
Jouko K . Lesk inen, b. 1943Ll.M.C.E.O., Sampo GroupElected to Partek's Board: 1994Now elected for the period: 1994–199Shareholding in Partek: –
Björn Mat tsson , b. 1941Lic. Phil., Honorary CouncillorManaging Director, Cultor OyElected to Partek's Board: 1993Now elected for the period: 1993–199Shareholding in Partek: 1 160
Paavo P i t känen , b. 1942M.Sc. (Phil.)Managing Director, Pension-Varmamutual insurance companyElected to Partek's Board: 1994Now elected for the period: 1994–199Shareholding in Partek: 11
Tom Ruud, b. 1950M. Sc. (Tech.)President and C.E.O., Aker a.sElected to Partek's Board: 1994Now elected for the period: 1994–199Shareholding in Partek: –
Chr is to f fe r Taxe l l , b. 1948Ll.M.President and C.E.O. of PartekElected to Partek's Board: 1984Now elected for the period: 1993–199Shareholding in Partek: 3 355
n.

From left
E X E C U T I V E B O A R D
)
to right: Raimo Taivalkoski, Carl-Gustaf Bergström, Christoffer Taxell, Patrick Enckell and Kari Heinistö.
Chr is to f fe r Taxe l l , b. 1948President and C.E.O.,Ll.M.Employed at Partek since 1990Number of Partek shares: 3 355
Car l -Gus ta f Bergs t röm, b. 1945Senior executive vice president,B.Sc. (Econ.)Employed at Partek since 1970Number of Partek shares: 2 710
Raimo Ta iva lkosk i , b. 1940Senior executive vice president,M.Sc. (Eng.)Employed at Partek since 1981Number of Partek shares: 233
Pat r i ck Encke l l , b. 1937Senior executive vice president,Lic. Tech.Employed at Partek since 1964Number of Partek shares: 1 750
7
Kari Heinistö, b. 1958Chief financial officer, M.Sc. (Econ.Employed at Partek since 1983Number of Partek shares: 385
s, Olof, Jorma
The Management Group is comprised of the Executive Board, the division directors and a number of key personsrepresenting Group Administration.
Members of the Management Group are: Carl-Gustaf Bergström, Peder Biese, Nikolai Danilotschkin, Herman DeganElenius, Patrick Enckell, Eelis Eskelinen, Bengt Gerger, Frej Granholm, Lauri Hakkala, Kari Heinistö, Bengt JanssonLaine, Raili Manninen, Lauri Palojärvi, Ahti Salonen, Christer Sundström, Raimo Taivalkoski, Christoffer Taxell, OlavUppgård, Timo Vuorio and Ulf Åhman.
M A N A G E M E N T G R O U P
AuditorsEric Haglund, B.Sc.(Econ.), A.P.A., Juhani Kolehmainen, M.A., Thor Nyroos, B.Sc.(Econ.), A.P.A.Deputy auditorsKPMG Wideri Oy Ab, Firm of Authorized Public Accountants, Antti Lehtinen, M.Sc.(Econ.), Managing Director,Alf-Erik Lerviks, D.Sc.(Econ.), professor
A U D I T O R S

M I N E R A L S
nt
Strong foundation from limestone
Nordkalk and the Swedish Railways and Highways Authority
have together initiated a wide-scale research and developme
programme to advance the limestone/cement pillar method
used for reinforcing road foundations. The use of limestone
pillars for soil-stabilization is a competitive option in the
construction of roads and railways. In the next few years
Finland and Sweden, which have both become
members of the European Union, will be
investing heavily in developing their
infrastructures i.e. building roads
and railways.
8

rtekvingronized
ownis a
teel,ion andreign.
eli,Termi-strial
Background information The Minerals business area is comprised of Nordkalk and PaIndustrial Minerals. The main products are limestone, quick lime, hydrated lime, soil-improproducts, limestone powders and crushed stones, wollastonite, quartz, feldspar, ground miccalcite and certain imported minerals. Minerals accounts for 15% of the group’s net sales.
Trademarks The products in the Minerals business area are sold mainly in bulk form. Well-kntrademarks include Flowlime, Parcover, Fostop, Movab, Finmix and Wicroll. Hydrocarb trademark of Suomen Karbonaatti Oy.
Customers Minerals’ customers are found in the following industries: pulp and paper, schemicals, construction, plastics, glass and ceramics in addition to environmental conservatagriculture. A considerable number of customers for wollastonite, quartz and feldspar are fo
Production units Nordkalk Finland: Pargas, Lappeenranta, Lohja, Sibbo, Louhi, VimpSiikainen and Vampula. Sweden: Storugns (Gotland), Ignaberga, Köping, Uddagård, Orsa. nals: Landskrona, Luleå. Associated company: NordCarb Oy Ab, Finland. Partek InduMinerals: Lappeenranta, Nilsiä, Kimito, Haapaluoma and Virkkala.
Divisions Net sales Personnel1994 1993 1994 1993
Nordkalk 681.3 643.3 659 648Industrial Minerals 259.2 235.6 283 339Other 93- Inter-divisional – 23.5 – 29.0Total 917.0 849.9 942 1 080
Key figures 1994 1993 ChangeMFIM MFIM %
Net sales 917.0 849.9 7.9 - export andforeign sales 303.3 280.0 8.3Operating profit 132.2 93.2 41.9Capital employed, avg. 793.0 984.2 – 19.4Return on capitalemployed, % 17.0 10.7Investment 45.3 39.9 13.5Personnel Dec. 31 942 1 080
9
Net sales by market 1994MFIM %
Finland 613.7 66.9Other Nordic countries 257.5 28.1Other EU countries 32.9 3.6Other European countries 7.2 0.8USA and Canada – –Asia 3.6 0.4Other 2.1 0.2Total 917.0 100.0

10
-
r
yr
-
y
sh
-
r
n
y
MINERALSThe Minerals business area is com-prised of Nordkalk and Partek Indus-trial Minerals. The main products arelimestone, quick lime, hydrated lime,soil-improving products, limestonepowders and crushed stones, wollastonite, quartz, feldspar, ground micro-nized calcite and certain imported min-erals. The business area accounts fo15% of the group’s net sales.
Almost all of Nordkalk’s and Indus-trial Minerals’ product groups in-creased their delivery volumes. Sales bthe whole business area for the yeawere 8% higher than in 1993.
The dependency on trends in domestic construction has been reduced, andoperations have been focused mainlon export markets either directly orthrough customers’ operations.
Deliveries of quick lime at the units inFinland and Sweden grew comparedwith the previous year. Capacity utili-zation was good.
Demand for soil-improving limestonealso exceeded the level for the previouyear, considerably so on the Swedismarket given the favourable weatherconditions. Uncertainty over the conse-quences of the European Union (EU)decision on farmers had an effect ontrends in Finland and Sweden at theend of 1994 and probably at the beginning of 1995.
The good market situation in thepaper industry has kept capacity utili-zation by Suomen Karbonaatti Oy at ahigh level. During 1994 it was decidedto invest in raising the capacity ofground micronized calcite.
The wollastonite market is mainly inEurope. The aim is to increase deliver-ies to the plastics industry.
Domestic sales of quartz and feldspaproducts went well, principally becauseof the large volumes being sold by theglass industry. The strengthening of theFinnish mark reduced exports.
’
-
to
Every year Suomen Karbonaatti Oy, a Partek Industrial Mineralssubsidiary, supplies the Finnish paper industry with more tha6,000 truckloads of the Hydrocarb coating pigment from Lappeenranta. Hydrocarb’s main raw material is Industrial Miner-als’ calcite concentrate.
With the FOSTOP lime-filter drain, which was developed bNordkalk in association with Finnish environmental officials, it ispossible to reduce discharges of phosphorus from agriculture inwaterways.
Paper pigments
Lime-filter drains

6
ii
-
n
,
f
i
r
e
--r
eni-.et-or0
-
-
,
-
r
y
-
.
-
i-
-
t
NORDKALK
Nordkalk exploits the group’s limestonedeposits in Finland and Sweden and deposit in Norway belonging to a relat-ed co-partner. The limestone is processed by several different methods inproducts that are used in processingagriculture and environmental conser-vation in the Nordic countries. Nordkalkinvests in the continuous upgrading othe technology for handling and processing raw materials, logistics and qualitysystems.
Nordkalk benefitted from the upturnin the Nordic countries’ export industryin 1994, because many of the companyproducts are used by this industry. Deliveries of Nordkalk products conse-quently achieved a high volume.
Sales of limestone-based bindingagents for soil-stabilization went ex-tremely well. Sales of agricultural prod-ucts in Finland and Sweden also increased.
Investment in productionA new plant for processing quick-limeproducts came on stream at Landskronat the beginning of 1994. It includes alime-hydration plant and terminal withloading silos for transportation by roadand rail. The plant utilizes Nordkalk’sown limestone that is produced inGotland, Sweden. Costing some SEK 2million (FIM 18 million), the new plantwill improve the distribution of lime-stone products in southern Swedenwhere Nordkalk’s competitiveness haalready been considerably enhanced bthe investment.
In Sweden Nordkalk invested in developing Uddagårdskalk’s operationsand in that connection it acquired thedeposit and real estate that it had prevously leased.
FOSTOPprotects waterways
Phosphorus discharges from agriculturcause the eutrophication of waterwayand are a considerable environmentproblem.
During 1994, Nordkalk launched anew patented method for reducing agrcultural nutrient leaching in waterwaysThe method, which is called FOSTOPuses sub-surface drainage principles anis based on limestone’s ability to bind
a
-to,
f-
’s-
-
a
5
,sy
-,
i-
esal
i-.,d
phosphorus, which can be reduced byto 80 percent with the new methodNordkalk has developed the method association with the water authorities Finland.
The method has been approved as igible for EU funding allocated to environment-friendly agriculture.
Nordkalk has also brought onto thmarket a new liming material used ipotato farming.
Forerunner inquality concept
Partek’s total quality process calleFoCus has now been introduced in aNordkalk units. Nordkalk Storugns ABwhich was among the first in Partek tapply the process, received an award ”Outstanding Performance” in the grouin 1994.
Prospects for 1995Prospects for 1995 are considered gooespecially for deliveries to industry.
Agricultural lime could be affected bychanges in expectations caused by Fland’s and Sweden’s membership of thEuropean Union.
The structural reorganization and rationalization that have taken place insidNordkalk over the past three years aexpected to bring about further improvements in resources and profitability.
PARTEKINDUSTRIAL MINERALS
Partek Industrial Minerals is a supplieof minerals for the paper, glass, ceramic, plastics, building materials, foundryand metallurgical industries. The company is also responsible for the servicfunctions of all the Partek factories inthe Lappeenranta area.
The market position of Industrial Minerals’ most important product, Hydrocarb paper pigments, was furthestrengthened.
Partek Industrial Minerals and thSwiss Plüss-Staufer AG together owSuomen Karbonaatti, which is responsble for the microcalcite operationsPartek Industrial Minerals supplies thjoint-venture company with its mosimportant raw material calcite concentrate. The increase in the demand fpaper pigments led to the start of FIM 5million worth of investment both in an
11
0.nn
el-
e
dll
oorp
d,
n-e
-ere-
-
-
extension and technology at Lappeenranta at the end of 1994. After this in-vestment the Partek plant at Lappeenranta will be Finland’s biggest producerof paper pigments, with annual produc-tion reaching almost 400,000 tonneswhich is a fifth of the needs of the Finn-ish paper and board industry. The investment will be completed in 1995.
Strong exportsto Europe
Most of the products in the wollastoniteproduct line and the quartz and feldspaproduct line are exported to westernEurope.
The wollastonite product line concen-trates to an increasing degree on highlupgraded Wicroll products for the plas-tics industry and a new insulation material application. Competition from im-ported Chinese wollastonite has in-creased, especially in southern Europe
The quartz-feldspar product line oper-ates at Nilsiä, Kimito, Haapaluoma andVirkkala. Sales of quartz on the domestic market developed satisfactorily as aresult of its wide range of industrial us-ages, even though the construction busness is reviving slowly.
Exports of Finmix, an induction-fur-nace lining material, went well. Increas-ing competition on the feldspar marketwas met with measures to improve quality and service.
Prospects for 1995Partek Industrial Materials will be car-rying out expansion and developmenprojects in 1995 with the aim of creatinga clearly-defined base for growth in1996.

C A R G O T E C
Together in the forest
The Timberjack Group, the world leader in forestry machines, struck a deal
with Loglift, a Partek Cargotec company specializing in timber cranes, that
strengthened the market position of both parties. Timberjack offered Loglift
the opportunity to develop and manufacture cranes for forwarders
and harvesters that met Timberjack’s and its customers’
specific requirements. The crane must be designed
simultaneously with the basic unit in order to
achieve the best possible forestry machine.
Product development cooperation will also
extend through to the maintenance and
spare parts servicing.
12

les,roup,
aturesng and
er thearks
aniestimber,nicipal-
nddling’sits ownuntries:pain, Mexico
Background information Cargotec manufactures cargo-handling equipment for vehicmainly trucks, and is the world leader in its field. The business area is divided into: the Hiab Gthe Loglift Jonsered Group and Load & Waste Handling. The products have the following fein common: they are based on hydraulics, mainly chassis-mounted and used for loadiunloading goods.
Trademarks Cargotec’s own sales companies and importers market the products all ovworld. No competitor has an equivalent international representation. Well-known trademinclude HIAB, Loglift, JONSERED, FMV, Multilift, LeeBur, Norba, Focolift and Nummi.
Customers Most of the customers consist of private truck drivers and transportation compthat use the products in the transportation of building materials and equipment, transporting handling and recycling waste, and delivering goods. Customers also include companies, muities and authorities as well as armed services.
Production units/sales companies Hiab has production units in Sweden, Denmark, Hollaand Spain. Loglift Jonsered’s production units are in Finland and Sweden. Load & Waste Hanproduction plants are located in Finland, Sweden, Holland and Great Britain. Cargotec has sales companies whose product ranges include one or more of its products in the following coFinland, Sweden, Norway, Denmark, Great Britain, Germany, Holland, Belgium, France, SPoland, the United States, Singapore, Korea and Japan. There is an associated company inas well as several independent importers and distributers located worldwide.
Divisions Net sales Personnel1994 1993 1994 1993
HIAB 1 064.7 991.4 893 834Loglift Jonsered 369.9 327.7 285 262Load&Waste Handling 542.0 534.9 573 527Sales companies 572 601Total 1 976.6 1 853.9 2 323 2 224
Key figures 1994 1993ChangeMFIM MFIM %
Net sales 1 976.6 1 853.9 6.6 - export andforeign sales 1 865.6 1 786.7 4.4Operating profit 136.5 60.3 126.3Capital employed, avg. 903.4 1 006.4 – 10.2Return on capitalemployed, % 16.0 7.8Investment 27.7 25.2 9.9Personnel Dec. 31 2 323 2 224
Net sales by market 1 9 9 4MFIM %
Finland 111.0 5.6Other Nordic countries 256.8 13.0Other EU countries 1 038.8 52.5Other European countries 128.3 6.5USA and Canada 163.5 8.3Asia 213.4 10.8Other 64.9 3.3Total 1 976.6 100.0
13

14
-
s
n
-
.
-ds
d-s.yed- in
es0
ro
s,e
CARGOTECCargotec manufactures cargo-han-dling equipment for vehicles, mainlytrucks, and is the world leader in itsfield. The business area is divided intothe Hiab Group, the Loglift JonseredGroup, Load & Waste Handling and ajoint sales network. The products havethe following features in common: theyare based on hydraulics, mainly chassis-mounted and used for loading andunloading goods.
The market for heavy trucks, whichhas a direct influence on the demandfor Partek Cargotec’s products, made astrong recovery in Europe. The increasefrom the record low level in the previ-ous year was 15 percent. The trend wasimilar on the Japanese market, whichis important to Cargotec. The registra-tion of heavy trucks in the United Statesrose to record levels.
Cargotec succeeded in maintainingor increasing market share in most ofits markets.
During the year concentrated invest-ment in marketing was initiated in theAsia Pacific region.
Singapore is the centre of growingoperations in the area. In January 1995Cargotec took over a sales company iKorea that it had previously partly-owned and strengthened its market position in the area.
The positive market trend is expectedto continue in Europe and Japan in1995 and to remain roughly at thepresent high level in the United StatesAs the trend is also favourable on theother markets that are important toCargotec, prospects are bright.
HIAB
The HIAB group manufactures and markets equipment and systems for goohandling in the transport sector.
Crane marketsIn 1994 the market for truck-mountedcranes began to recover from the consierable slump of the previous few year
Orders for HIAB cranes increased bsome 10 percent during the year. Thtrend in cranes is towards bigger antechnically more advanced units. A higher degree of electronics has been usedthe control and safety systems. Salincreased in value by approximately 2percent.
-
Effective waste management is crucial to environmental consevation. Norba is continually developing its products in order tspeed up the driver’s work and make it easier.A Cargotec sales unit, Multilift Government Business Operationsupplies load-handling equipment to many countries’ defencforces and UN peacekeeping forces.
general cargo cranes(see cover photo)
forestry cranes(see pg. 12 - Timberjack)

n-
hsin
oe
-lsd.
ll
renin
eel-
dn
re
d
twts
ed
od
a-es
-
--
--
,
-
s
r-
s
f
-
s
-
HIAB also strengthened its position the market leader. Roughly 75 percensales go to western Europe, the Norcountries included. The position on tbiggest market, Germany, is stronHIAB also dominates the Japanese mket for knuckleboom cranes. The markin the Nordic countries now accounts fan increased share of the total sales ume.
Several new modelsIn 1994 HIAB launched several necrane models, especially in the capacrange of 17 ton meters upwards. Momodels were fitted with the MiniSPACsafety system, which fulfils all the saferequirements specified in the machidirective of the European Union. Thisan absolute requirement for producmanufactured and delivered in the Efrom 1995 onwards.
The SPACE system, which had beintroduced previously, for both improved safety and a better technical pformance, was increasingly installed more crane models.
With the SPACE and MiniSPACEsystems, truck-mounted cranes are nequipped with electronics on a larscale. HIAB is a clear leader in this dvelopment.
All the HIAB plants in Europe wereawarded the ISO 9001 quality systecertificate in 1994.
Prospects for 1995The outlook is bright. The growth in salof heavy trucks will mean that the maket for cranes will become increasingactive overall. HIAB’s product range already very large and will be broadenfurther in 1995. The aim is to strengthpositions on new, expanding markechiefly in the Asian region.
LOGLIFT JONSERED
The Loglift Jonsered Group developmanufactures and markets hydrauknuckleboom cranes mainly for thtransportation and handling of timbeThe division’s trademarks are LoglifJonsered and FMV.
Growing marketsThe trend in 1994 was characterizeda pronounced upturn within the foreindustry in general. The demand fCargotec’s new products, particular
ast ofdicheg.ar-etorvol-
wityst
Etyne istsU
en-er-in
owgee-
m
esr-lyisedents,
s,lice
r.t,
bystorly
forest machine applications, more thadoubled; it also accelerated for truckmounted loaders. The division strengtened the marketing organization by etablishing its own sales companies Finland, Sweden and Germany.
In the past year Loglift developed twnew forwarder loader models and onnew model loader for handling fulllength logs. The Jonsered range was aincreased with one foldable model loaer with a new, patented boom system
Investment in R & DThe good result achieved in 1994 wifacilitate further investment in R & Dand the development of new market aeas. In Salo, Finland, a new after-salcenter for the handling of spare parts aloader maintenance will be completed the summer of 1995.
Prospects for 1995The investment carried out to improvdelivery capacity and quality has left thLoglift Jonsered Group in a welequipped position. The outlook continues to be favourable in 1995.
LOAD & WASTEHANDLING SYSTEMS
The Division develops and markets proucts and systems for load and waste hadling. The trademarks of the Load &Waste Handling Systems Division aNorba, Multilift, LeeBur, Nummi andFocolift.
OrganizationAt the beginning of 1995, Focolift tail-lift equipment and Nummi tipping hy-draulics were assimilated into the Loaand Waste Handling Division.
MarketsLoad & Waste Handling kept its markeshare in Europe and also found neexpanding markets there for its produc
The Multilift load-handling systemsfor armed services strengthened theposition, and additional orders were rceived from the Norwegian, British anMalaysian armies.
Coordination of the activities of thevarious companies in the division led tthe development of a new integratesystem for the collection and transporttion of waste. It is expected to be in seri
15
--
o-
-sd
--
,.
ir-
production at the turn of the year 19951996 after testing.
Demand for Multilift, LeeBur andNummi products rose dramatically dur-ing the year. This was the result of a revival in markets and new market openings. Nummi concentrated on gaining afoothold in the German and British mar-kets for tipping hydraulics and adjustedtheir product range accordingly. Production capacity was also raised considerably in response to demand.
Focolift strengthened its marketingorganization by changing the importerin France and introducing new operatingmethods in Sweden. Demand for tail-liftequipment revived particularly well onthe domestic market.
Prospects for 1995Southeast Asia offers huge potential andalong with Europe, it is considered to bethe main growth area for Load & WasteHandling. Operations on this market willbe made more efficient by Partek Cargotec’s regional office in Singapore.
In Europe as well the indications for1995 show a growing demand for loadand waste handling products and systemin line with increased truck sales. Load& Waste Handling products are facing aperiod of expansion.
SALES COMPANIES
The above-mentioned divisions have, inall, some ten sales companies that maket their respective products.
Sales companies marketing productmanufactured in several different divi-sions form their own unit, which in 1994was responsible for almost 45 percent oCargotec’s total sales.
Almost all Cargotec’s own sales com-panies increased their sales and profitability in 1994 compared with the previ-ous year. The trend in the United Statewas particularly gratifying.
Prospects for 1995The growth on all markets and invest-ment in marketing in Southeast Asia willprovide good opportunities for the salescompanies to continue making favourable progress.

B U I L D I N G P R O D U C T S
Shopping at the Arctic Circle
Prisma situated on the intersection of Finland and the Arctic circle in Rovaniemi,
is the world’s first circular supermarket, the result of unconventional design and
structures. Lightweight, non-combustible PAROC panels were chosen for the
facades and partitioning walls to produce spans of almost 8 metres.
The pre-faced panels were transported from southern Finland up
north in only a few truckloads and quickly erected with light
cranes. There was no need to protect the structures or
finish the surfaces on the site; work began directly on the
interior. It was important for the customer,
Arina Cooperative, to have their million mark
investment up and running as soon as possible.
16

caste min-
ducts,for theuctures,
s arerade-ockfon.
ublic
land,recast
ulationt Britain,
Background information The Building Products business area consists of Insulation, PreConcrete Nordic and Precast Concrete International. The main products for Insulation are theral-based insulations for construction and industry, lightweight panels, acoustic prorock wool growing media, non-woven products and technology sales. The principal products precast concrete operations are hollow-core slabs, concrete railway sleepers, precast strbridge beams and special products. Sales of concrete technology are also important.
Trademarks Some of the most important trademarks for the precast concrete operationVariax, Betemi, Elematic, Parma, Induco, Dimensio and Palazzo. Well-known insulation tmarks include Paroc, Ecoprim, Parafon, Pargro and Roctex, and in Sweden Rockwool and R
Customers Building Products’ customers are mainly construction firms, retailers and the psector. Special products are sold to many industrial areas.
Production plants Production plants of Precast Concrete International are situated in HolBelgium, Germany, Malaysia and Singapore. Technology sales are handled from Finland. PConcrete Nordic operates in Norway, Finland, Estonia and Russia. Production plants for Insare situated in Finland and Sweden. In addition, there are sales companies in Germany, GreaDenmark, Belgium, Estonia, Lithuania, Latvia and Russia.
Divisions Net sales Personnel1994 1993 1994 1993
Insulation 1 100.4 1 066.5 1 538 1 625Precast concreteNordic 447.6 349.5 548 498Precast concreteInternational 1 373.8 1 365.6 1 924 1 885Other 375.9Total 2 921.8 3 157.5 4 010 4 008
Key figures 1994 1993 ChangeMFIM MFIM %
Net sales 2 921.8 3 157.5 – 7.5 - export andforeign sales 2 545.4 2 538.8 0.3Operating profit 170.3 75.0 127.1Capital employed, avg. 1 671.3 2 245.4 – 25.6Return on capitalemployed, % 11.5 4.3Investment 70.4 60.3 16.7Personnel Dec. 31 4 010 4 008
17
Net sales by market 1994MFIM %
Finland 376.4 12.9Other Nordic countries 812.2 27.8Other EU countries 1 439.5 49.3Other European countries 226.6 7.8USA and Canada 2.5 0.1Asia 46.3 1.6Other 18.3 0.6Total 2 921.8 100.0

18
-
nre-ill
--s-
s
t
-
,
rO
BUILDING PRODUC TSThe Building Products business areaconsists of Insulation, Precast ConcreteNordic and Precast Concrete Interna-tional. The main insulation productsare mineral wool based insulation forconstruction and industry, lightweightpanels, acoustic products, rock woolgrowing media, non-woven productsand technology sales. The principalproducts for the precast concrete oper-ations are hollow-core slabs, concreterailway sleepers, precast structures,bridge beams and special products.Sales of concrete technology are alsoimportant.
INSULATIONPARTEK INSULATION
Partek Insulation intends to maintain itsstrong position on the insulation marketsin Finland and Sweden by means of itscustomer-oriented policies and ad-vanced production technology. At thesame time know-how within the groupwill be exploited to ensure growth inneighbouring areas, both geographically and in terms of products.
MarketsPartek Insulation made good progress i1994. Sales increased and costs wereduced thanks to the efficiency measures that have been taken and are stbeing taken.
Sales were increased in particular bythe growing demand for technical insu-lation on the Finnish market and on im-portant export markets such as Germany, Denmark, Russia and the Baltic countries. The demand for Paroc Panels habeen good and production has been operating at full capacity.
The Swedish construction marketshrank further in 1994 and demand wapoor.
Eventful yearPreparations for establishing a plant thamanufactures rock wool in Lithuania incooperation with Lithuanian sharehold-ers continued during the year. The output from the new facilities is intendedprimarily to meet demand in the Balticcountries. Partek Insulation’s technolo-gy unit received two fairly large ordersthat both involve the delivery of a rockwool production line.
During the year Partek Insulation’sassociated company Roctex Oy Abbrought a new plant on stream in Pargas
teeeslo
.
Paroc’s technical insulation is needed in industrial construction.The pulp mill’s oxygen bleaching plant is insulated with, forexample, Paroc’s PV-S tank slabs.
Paroc Panels(See page 16-Prisma on theArctic Circle)
The contract between Spenn-Gruppen and the Norwegian StaRailways for the supply of concrete sleepers was extended for thyears. Some of these sleepers will be used on the track between and Gardermoen, the main airport, which is due to open in 1998

-
,h
n
tt
s
-
k-e
n
e-r
u-
so
--
-
d.
ut-e
.kd
-e
gs-
-il--t at
e-r.55e
n
stn-
ec
-ll-kt
l
d.we-ts
Finland, for the manufacture of non-woven products.
FIM 20 million investmentPartek Insulation invested approximate-ly FIM 20 million in machinery andequipment during 1994, an increase tosome degree over 1993.
Prospects for 1995Partek Insulation is strongly competi-tive both on its domestic markets inSweden and Finland and in the expormarkets. This, together with the fact thatdemand is expected to grow in impor-tant markets such as Finland, GermanyRussia and the Baltic countries, offersconsiderable opportunities for expand-ing sales during 1995. At the same timecapacity utilization will increase. Theprogramme of measures taken in thepast few years is expected to achieve itfull effect during the year.
PRECAST CONCRETENORDIC
Precast Concrete Nordic consists ofSpenn-Gruppen, Norway’s leading sup-plier of precast concrete elements, twoFinnish associated companies of PartekPartek Betonila and Parma, andParastek, which operates mainly in Rus-sia. The low level of construction in theNordic countries that has lasted for sev-eral years has shown signs of a slightrecovery. The increase in constructionwas most noticeable in Norway.
SPENN-GRUPPENSpenn-Gruppen produces and installsprecast concrete elements for the infra-structure and housing construction inNorway.
MarketsAfter seven continuous years the declin-ing trend in the Norwegian constructionindustry finally ended in 1994. Increas-ing volumes were noted throughout thecountry with, however, marked geo-graphical variances. The increase wabiggest in the Oslo region and on the wescoast.
Owing to changes in the purchasingprogramme of the Norwegian State Rail-ways the number of sleepers deliveredby Spenn-Gruppen fell drastically dur-ing 1994. A new contract, however, forthe supply of new types of railway sleep-ers for i.e. the track to Gardermoen air-port has been signed. It will last for aperiod of 3 years, starting in 1995.
t
,
s
,
st
Large-scale projectsSpenn-Gruppen’s biggest projects during 1994 included deliveries to the Halliburton production facilities at Sta-vanger, the National Hospital in Osloand a car park at Fornebu airport, whicwill be completed during 1995.
In addition, Spenn-Gruppen wasawarded a contract for a new concept ifreezing facilities for the fishing indus-try and a project worth NOK 56 millionfor a shopping centre.
Prospects for 1995Slightly increased volumes are expectefor Spenn-Gruppen, especially in theOslo region. The south of Norway, how-ever, may see reduced volumes owing the decrease in the oil-related invesments.
In December 1994 it was decided tomerge Partek Østspenn and ParteSørspenn. This will streamline thegroup’s organization and strengthen itposition in the Stavanger area.
PARTEK BETONILA (50%)Partek Betonila is Finland’s leadingproducer of precast concrete. The company develops, markets and producewide-ranging, high-quality products,services and complete building solutions based on precast concrete technology.
Partek Betonila is owned equally byPartek and Euroc. During 1994 ParteBetonila’s group structure was redefined, and several subsidiaries wermerged into the parent company.
MarketsThe entire share capital of the Estoniaassociate company EE-Betoonelemenwas acquired at the end of the year. Thproduction capacity for precast concretelements in Finland considerably outweighs demand, which has led to undeutilization of capacity and lowered pric-es disproportionately. Partek Betonilahas systematically improved its competitiveness with a review of productivity.
Prospects for 1995A slight increase in total constructionvolumes is forecast for 1995 thanks tothe investment in the new Rauman Sellsulphate pulp mill and planned investment in paper machines.
No increase in housing construction iexpected. Public construction has alsbeen at a very low level historicallyspeaking.
19
-
d
o-
k
-s
-
te
-
-
PARMA (50%)Parma specializes in high-quality, polished precast concrete elements, hollowcore slabs and ready-to-install bathroomand cabin modules. Parma also produces concrete railway sleepers.
Parma is owned equally by Partek anthe Finnish construction company APuolimatka. The downturn in productionthat lasted for several years levelled oin 1994. The hollow-core slab and railway sleeper production was awarded thISO 9001 quality-system certificateCorresponding quality assurance woris under way for facade element anmodule products and operations.
In September a big order of FIM 50million was received for bathroom modules to be supplied to cruise ships for thRoyal Caribbean Cruise Line shippincompany. A licensing agreement wasigned with Eastern Partek for the production of bathroom modules. Deliveries of sleepers to the Finnish State Raways continued. The production of hollow-core slabs and facades remained asimilar level to the previous year, buprices have remained extremely low.
Prospects for 1995Parma expects a small increase in dmand, most of it at the end of the yeaOverall, Parma’s orders in hand for 199are reasonable. At the beginning of 199Parma was awarded a contract by thFinnish State Railways for the deliveryof some one million sleepers betwee1995 and 1999.
PARASTEKParastek markets and delivers precaconcrete elements and ready-mix cocrete mainly to hard-currency payingcustomers in Russia. The product rangconsists chiefly of Partek and Euromaterials.
Most of the precast concrete production was delivered for the residentiaareas being constructed for Russian sodiers returning from Germany. Parastelocated its first ready-mix concrete uniin Moscow in the autumn of 1994.
Prospects for 1995In spite of the economic and politicainstability in Russia, demand forParastek products continues to be gooIt has been decided to invest in a neready-mix concrete unit, and there arplans to invest in raising the level of technology at those precast concrete planin which Parastek is a part-owner.

st,ngeld
ten
nl-ere
Partek Brespa is theGermany, with sales
In May 1994 Spanbeprestressed curved bneeded for the Amst
Prestressedhollow-coreslab technology
PRECAST CONCRETEINTERNATIONAL
Precast Concrete International consistof precast concrete companies operaing in Holland, Belgium and Germanyassociated companies in Singapore aMalaysia, Partek Concrete EngineerinOy, which supplies precast concrettechnology, and Partek Concrete Deveopment Oy, which concentrates on prouct development.
20
k-
dt-
n-
s-lem.
h-
-n-e,
in
-l-le
)’si-g.
b
erk-c--na.or
se-e.e
leading supplier of hollow-core slabs in in excess of 500,000 m2 in 1994.
ton started supplying and erecting theridge girders or ”concrete bananas”
erdam ring road project.
-
d
--
PARTEK BETONPartek Beton produces precast concreand offers services for the constructioof buildings and infrastructure in Hol-land, Belgium and Germany.
At the beginning of 1995 Partek Betocomprises Partek’s companies in Holand and Belgium. The biggest of thesare the Dutch VBI, the leading produceof flooring systems in Europe and thBelgian Partek Ergon.
The past year was very busy for ParteBeton, and financially it was very satisfactory. For VBI in particular 1994 wasa very good year. This favourable trenwas furthered by the large-scale invesment carried out earlier at the Schuileburg plant. The handling of orders fromtheir actual receipt to supplying the cutomer was improved by the large-scarenewal of the data processing systeIn this way, VBI which supplies to a largenumber of separate deliveries, strengtened its competitive position.
MarketsThe volume of Dutch housing construction in 1994 was 12 percent higher thain 1993. Office and industrial construction in the Netherlands showed a declinwhile infrastructure projects rose.
There was a large increase in salesHolland
In Belgium residential and non-residential construction declined drasticaly. Work on the high-speed TGV raitrack did not bring the benefits that werexpected by Partek Ergon.
Partek’s total quality process (FoCushas been started in all Partek Betonunits. The aim is to ensure greater effciency and overall quality by developinoperations and production technology
Most important projectsDuring 1994 VBI delivered 4.8 millionm2 of hollow-core slabs and flooringsystems. VBI’s biggest hollow-core slaproject (65,000 m2) was the HaagscheSchool situated in The Hague. The othDutch companies Spanbeton and Schobeton received an order for the prodution and installation of structural elements for the large-scale distributiocentre to be constructed at SchuitemSchokbeton also delivered elements fthe IKEA shopping centre in Utrecht.
One of the biggest projects in 1994 wathe hollow-core slabs and structural elments delivered for two buildings at thAlkmaar shopping centre in HollandThe delivery of curved precast bridg
-r-
t-t.x-l.a
o,s
kak--bd
t--
r-rg
--td
en-
o
-d
inldsh
o
re
s
ft
g
hr
p
t
t
e-gc
f
fo-n
l-
----
k)es-r
of,
-f-
s
r
k
n
tr-
es-l-
girders needed for the ring road circumventing Amsterdam was also an impotant order.
Prospects for 1995Dutch residential construction is expeced to grow by approximately 10 percenConstruction in other sectors is also epected to experience a faint revivaThere may also be an increase in infrstructure projects.
In Belgium the market is expected tstabilize at a low level. It is thoughthowever, that civil construction projectwill improve.
VBI’s German sales company ParteVerbin, which operates in the Ruhr arewill endeavour in association with ParteBrespa to influence architects’ and building engineers’ attitudes in order to increase market share of hollow-core slain Germany. It is at a low level comparewith Holland, where hollow-core slabshold considerable market share.
PARTEK BRESPAPartek Brespa, whose production planis situated in Schneverdingen in northern Germany, produces and sells prestressed hollow-core slabs for the Geman market. The company’s most impotant customer group consists of buildinand construction firms.
MarketsConstruction in Germany remained lively. The hollow-core slab industry succeeded in increasing market share slighly. Partek Brespa’s sales exceede500,000 m2 for the first time, and thecompany maintained its position as thleading supplier. The new sales office iBerlin reinforced Partek Brespa’s presence in the important eastern region the country.
The plant’s capacity has been increased and the equipment modernize
Prospects for 1995Demand is expected to be satisfactory1995. The economy in general shoucontinue to grow, and construction iexpected to carry on at the present higlevel. Residential construction couldreach its peak in 1995, at the same timas non-residential construction alsstarts a slow recovery.
s
g
-
,
s
-
-
f
.
e
PARTEK CONCRETEENGINEERING
PCE supplies precast concrete technoogy to the concrete industry and contractors throughout the world.
The flagship product, the PCE flooelement technology, has a global markshare exceeding 40 percent. PCE’s tradmarks include Elematic, Parma and Induco for machines and production lineand Betemi for shotcreted circular columns. Much of the sales volume is generated from plants delivered on the turnkey principle. The most important oPCE’s competitors operate from wesern Europe and the USA.
MarketsFor PCE the most important event o1994 was the award of the Sertolovcontract. The contract for the delivery oa precast concrete plant and technoloto the St. Petersburg area is worth somDEM 75 million and is due for comple-tion in 1996.
In South Korea PCE received its seventh order for a precast concrete elemeplant for housing production. The customer this time was Hansung Co., LtdThe transactions in Korea have strengtened PCE’s position on the Asian maket.
The company’s research and develoment has concentrated on flooring technology, partly in cooperation with VBI,a Partek subsidiary in Holland, and parly with Eastern Partek, an associatecompany in Singapore.
A quality system that emphasizes thimportance of customer satisfaction ancorresponds to ISO 9001 requiremenwas introduced.
Prospects for 1995The market is expected to develop rathfavourably. Volumes are growing quickly. Many new technologies are cominonto the market as a result of researand development work - but in a situation of increasing competition PCE’sposition is strong.
PARTEK CONCRETEDEVELOPMENT
Partek Concrete Development (PCDstarted its operations at the beginning o1994. The company is responsible for thcontinuation of projects that relate tomaterials and production technologyand which were under way in Partek’precast concrete companies.
One of the key projects was Castin
21
l--
te--,
---
-
fofye
-nt-.--
--
-d
eds
r
h-
)fe
Unit 2000, which exploits the hollow-core slab know-how of the various unitsin order to develop a new generation oproduction technology. The aim of theproject is to maintain the competitive-ness of the most important product oPartek’s precast concrete units. PCD alsparticipates in developing the transmission of data on production and desigknow-how between the units.
EASTERN PARTEKThe Eastern Partek Group (45%) is ajoint-venture company of Partek and aSingaporean company, the NatSteeGroup. Eastern Partek companies combine their locally-based constructionskills with new industrial solutions andhighly developed precast concrete technology. Eastern Partek invests in quality, customer service and technical assistance in projects from design to implementation.
Eastern Partek Pte Ltd (Eastern Parteimproved its sales and result. Both thPrecast Concrete unit as well as the Platers and Mortars unit increased theisales.
At the beginning of 1994, EasternPartek became a 25% shareholder National Cement Industries Pte Ltdwhose business activities involveready-mix concrete production and importing cement. In the last quarter o1994 Partek Concrete Pacific, whose operations were narrowly-based, wamerged with Eastern Partek.
New products on the marketEastern Partek secured the first order fobathroom modules from the HousingDevelopment Board. The productionwill take place at the Eastern Parte(Malaysia) plant in Malaysia under a li-censing agreement from Parma Oy, aassociated company of Partek.
New to the market was the lightweighParoc panel, which aroused great inteest among customers.
Prospects for 1995A great deal of activity is expected on thSingapore housing market in 1995. Athe emphasis will be on design and structural implementation, Eastern Partek wilhave a clear competitive edge. The company will be able to offer its own designand structural services.
The prospects for 1995 look good inMalaysia as well, as demand will stayhigh.

e
l-
d
t
c
g
t
-
a
s
s
s
--y-
-
e
e
e.
t
-ts
-
,-
EUROC (25%)
The Euroc group concentrates on thproduction of mineral-based buildingmaterials and distribution of buildingmaterials mainly in the Baltic and NorthSea Regions.
Euroc is registered in Malmö, SwedenIts operations are grouped into sevenbusiness areas: Cement InternationaCement Nordic, Concrete and Aggregates, Concrete Products, MasonryProducts, Plasterboard and BuildingMaterials Distribution. The group’s netsales were FIM 9018 million (1993:7719). The result after financial itemswas FIM 589 million (1993: 174).
The Euroc group has included theFinnish-based building products operations that were acquired from Partek anMetra in 1993. Partek and Metra thenowned 25 percent of Euroc’s shares joinly. Once Partek had acquired Metra’sholding in November 1994, it became a25 percent shareholder in the Nordicountries’ biggest building productscompany.
In the Balance Sheet Partek’s holdinin Euroc is entered as FIM 866 millionwhile the quoted value of the shares athe end of the financial period was FIM1136 million. Euroc’s result has beenincluded in Partek’s consolidated accounts under the equity method (12.5%for 10 months and 25% for 2 months, total of FIM 63.2 million). Partek is rep-resented on Euroc’s Board of Directorby Christoffer Taxell and Björn Matts-son.
The Norwegian Aker group ownsjointly with Euroc the Cement Interna-tional business area, which compriseproduction in Great Britain and the USAand considerable trading operationchiefly in Africa.
In spite of the continuing poor situa-tion on their domestic market, Eurocimproved its result considerably com-pared with 1993. The merger of the Finnish operations with Euroc has been highly successful. The effects of the synerghave been seen more quickly and noticeably than was expected. Their contribution was about FIM 88 million, i.e. al-most twice as big as was forecast at thtime of the acquisition. All the Finnishoperations improved their result as thmarket has revived.
22
.
,
-
-
Delivery volumes have increased andprices risen in several other of Euroc’smain markets such as Great Britain, thBenelux countries and the United StatesEuroc’s deliveries to markets outsideSweden accounted for 72 percent of nesales. Exports from Sweden totalled FIM361 million and from Finland FIM 79million.
Finnish companies accounted for FIM1507 million of Euroc’s entire net sales,i.e. 16 percent.
Increased volumes, higher prices, enhanced cost effectiveness and the effecof synergy with Finnish companies will,according to forecasts, improve the operating profit in 1995. If Euroc’s cashflow remains at a high level under thepresent structure in 1995 as well, thegroup’s debt will be reduced and the fi-nancial situation will show a furtherimprovement. Compared with the 1994result, which was FIM 496 million aftertaking into account non-recurring itemsthe result is expected to improve by between 15 and 25%.

e
-
dr
c-n
r-h
gv
ensasceng
s,
-y’nltst
sndin
t-t
ente-in
a
n
e
d
r-
-s-
lt
si-.
m
at-
-
er
OTHER BUSINESSACTIVITIES
Other Business Actvities include thosactivities that in operational or geo-graphical terms lie outside Partek’s strategic orientation.
PARTEK NORTH AMERICA
Partek North America produces anmarkets rock wool based insulation foindustrial, commercial and horticultur-al purposes. The company has prodution units in Canada and the USA. I1994 net sales totalled FIM 118 millionand the staff numbered 238.
Partek North America made consideable improvements in 1994. Althougnet sales fell by FIM 20 million from the1993 level the gross profit improved.
Operations are, however, still runninat a loss. The strong measures that haalready been started will have to be sethrough to a conclusion if the problemare to be solved. The organization hbeen modernized. The heavy balansheet has been slimmed down and finacial costs reduced. The structural chanes have yet to be decided in full.
PARTEK MORIN
Partek Morin’s product concept includehollow-core slabs, structural elementshigh-quality facades in addition to bridges and tunnel elements. The compannet sales for 1994 were FIM 168 millioand it employed 411 people. The resudeteriorated again and was a heavy losPartek Morin has production plants athree localities in France.
The French construction market hacontracted considerably since 1991, athere is a great deal of overcapacity the sector.
The most significant projects compleed in 1994 were the Christian Dior planin Orleans, the tunnel cladding for thD2 metro line in Paris, the refreshmecentre on the A 71 motorway and thtechnical university at Beziers. The biggest uncompleted project is the new maoffice for Air France for which PartekMorin will supply the facade.
It seems that the market will show slight revival in 1995, but competitionwill still be strong.
e
--
s
.
UNITED TILES (50%)
United Tiles produces and marketsglazed and unglazed ceramic floor andwall tiles for residential and commer-cial buildings in select market areas andsegments via independent distributioand sales companies.
In 1994 the company’s net sales werFIM 904 million and it employed 1,216people. United Tiles consists of NuoveCeramiche Ricchetti in Italy, Klingen-berg Dekoramik in Germany, PartekHöganäs Byggkeramik in Sweden anPukkila in Finland. There are marketingand sales companies in Denmark, Noway, USA, France and Belgium.
A-RAKENNUSMIES
A-Rakennusmies Oy, which leases machines and equipment to builders, habeen able to make a considerable improvement in its result. In 1994 the resuwas a profit of FIM 2 million comparedwith a significant loss in the previousyear. Rationalization continued, and inthe summer of 1994 A-RakennusmieOy acquired the machine-leasing busness operations of Julius Tallberg Oy AbPartek’s holding in A-Rakennusmies Oywas reduced in the same connection fro37 to 27 percent.
REAL ESTATEADMINISTRATION
Real Estate Administration adminis-trates, leases and sells off real estate this no longer included in Partek’s industrial operations. Supply far outweighsdemand and competition is tough. During 1994 real estate to the value of FIM53 million was divested. A considerableportion of this is made up of employeeaccommodation and plant sites that arno longer needed. The result for the yeawas a loss.
23

ANNUAL REPORT OF THEBOARD OF DIRECTORS
arhnw
d,ne ontere.rea
ge25
ep’y
r-e
a
-
s
tshell
ts.e-
taldo-ra-
sy,
M8ar.-a-re
-n-r-nt-heh
ah
G E N E R A L
The economic trend in the Group’s mkets was a favourable one during tfinancial period. Housing constructioin many countries remained at a lolevel, however, especially in FinlanSweden and France. On the other hademand for heavy trucks increased; thare of great importance for the salesCargotec’s cargo-handling equipmeAs far as the markets for lime, limproducts and industrial minerals weconcerned, the trend was favourable
At the end of the year Partek execised its option to buy Metra out of thcompany that was set up when the mjority of the mineral-based buildinmaterials industry in Finland was mergwith Euroc in 1993. Partek now owns percent of Euroc.
Group sales were somewhat lowthan in the preceding year. The Grouresult after financial items improved bFIM 450 million to FIM 41 million. Allthree business areas improved theirsult to show a profit. Euroc also improved its profit considerably. All thos
-e
d,sef.
-
-
d
rs
e-
operations which either by their verynature or by reason of their geographicsituation lie outside the Group’s coreactivities are included in this year’s fi-nancial statements under the heading Other Business Activities. This groupwas a significant loss-maker.
The issue of convertible subordinated bonds and a share issue resultedjust over an additional FIM 420 millionin new equity.
N E T S A L E S
The Group’s net sales reachedFIM 6 166 (1993: 6 610) million. Theyachieved their budget target level bufell by 7 percent compared with 1993The corresponding figures for 1993however, include approx. FIM 375 mil-lion earned from activities which nolonger form part of Partek’s operationafter structural reorganisation. Net salefor 1993 also include the sale of most oPartek’s real estate holdings for FIM260 million.
On the domestic market net saleshrank by 32 percent as a result of Grou
24
l
of
in
t.,
sf
sp
structural changes while other markereported an increase of 2 percent. In tNordic countries however, net sales fethough they increased in other markeForeign sales increased its share somwhat and amounted to 81 percent of tonet sales. Partek’s dependence on mestic construction has been considebly reduced in recent years.
Minerals. This business area includelime and mineral products for industrthe environment and agriculture.
Net sales in 1994 amounted to FI917 (1993: 850) million and were percent higher than the previous yeBoth Nordkalk’s and Industrial Minerals’ sales improved. Budget expecttions were exceeded and sales wemarkedly better than in 1993.
Cargotec. This business area includes mainly equipment for cargo-hadling such as knuckleboom cranes, foestry cranes, interchangeable demouables and waste handling systems. Tproducts are marketed partly througCargotec’s own sales companies innumber of countries and partly througimporters.
NET SALES
1994 1993 ChangeFIM million % FIM million % %
BY MARKETFinland 1 142.6 18.5 1 682.3 25.5 – 32.1Other Nordic countries 1 326.3 21.5 1 363.5 20.6 – 2.7Other EU countries 2 696.6 43.7 2 640.2 39.9 2.1Other European countries 365.5 5.9 309.2 4.7 18.2USA and Canada 285.0 4.6 262.5 4.0 8.6Other countries 350.2 5.7 352.1 5.3 – 0.5
Total 6 166.3 100.0 6 609.8 100.0 – 6.7
BY BUSINESS AREAMinerals 917.0 14.7 849.9 12.7 7.9Cargotec 1 976.6 31.8 1 853.9 27.8 6.6Building Products 2 921.8 47.0 3 157.5 47.2 – 9.3Other Business Activities 322.4 5.2 754.6 11.3 – 57.3Other units 81.3 1.3 75.6 1.1 8.0Inter-Group sales – 52.9 – 81.8
Total 6 166.3 100.0 6 609.8 100.0 – 6.7of which:Finland 1 142.6 18.5 1 682.3 25.5 – 32.1Export from Finland 791.0 616.9 28.2Foreign invoicing 5 023.7 81.5 4 927.5 74.5 2.0

sg-ltetr & i
lykn 7 7a
thts
onet
28ingou
e-aencan
di
ss
e
k
n
-n--
-
s
se-
t
e
y
-
as
s
In Europe sales of heavy trucks roby 15 percent. This is of particular sinificance for HIAB, which after severayears of weak demand has now strengened its position for knuckleboom cranin a number of markets. Sales of forescranes improved strongly. Also LoadWaste Handling reported an increasesales.
Order flows improved, especialtowards year-end. Likewise order stocat the turn of the year were larger thayear earlier. Net sales rose to FIM 1 9(1993: 1 854) million and increased bypercent compared with the previous ye
Building Products. This businessarea manufactures and markets, onone hand, rock wool, rock wool producand the technology for the productithereof, on the other, precast concrand precast concrete technology.
Net sales amounted to FIM 2 92(1933: 3 157) million, a decline of percent compared with the precedyear in consequence of changes in Grstructure.
Demand for building insulation matrials in Finland and Sweden, which hfallen sharply in recent years, continuto remain at a low level during the finacial year. However, demand for techniinsulation materials and lightweight paels increased. Exports from the Nor
e
h-sy
n
sa7
r.
e
e
p
sd-l-c
countries to Central Europe, Russia anthe Baltic countries rose significantly.
Trends in the construction industryare reflected in the demand for precaconcrete. In our biggest markets thidemand declined in Finland, grew somewhat in Norway and continued to bestrong in the Netherlands as far as ouprincipal product, precast concrete flooring, was concerned. Order stocks increased and were about 20 percent largat year-end than the previous year. Ordflows also improved.
Euroc. Partek owns a quarter ofEuroc, whose principal activities are themanufacture and marketing of cemenand other mineral-based building materials, above all, in northern EuropeEuroc and Aker together own Scancemwhich has significant international ce-ment activities, including production andtrading in cement.
To Other Business Activities havebeen transferred Partek’s real estate aministration, the subsidiaries ParteNorth America and Partek Morin and theassociated companies A-Rakennusmieand United Tiles.
R E S U L T
Major steps have been taken in receyears to adapt Partek’s operations t
25
d
t
-
r--err
t-.,
d-
s
to
falling demand. Group structure haschanged. The costs for further restructuring and reorganisation are entered ithe year’s Income Statement partly under operating costs and partly under extraordinary costs.
The negative trend in result and profitability was reversed in 1993. Duringthe past year this encouraging trend habeen further strengthened.
Operating profit for 1994 amountedto FIM 231 (1993: 4) million. Profit afterfinancial items and expenses was FIM41 (1993: -407) million, in other words0.4 (1993: -6) percent of net sales.
A provision of FIM 200 million hasbeen made as an extraordinary expento cover the estimated cost of restructuring the insulation operations of PartekNorth America and the French precasconcrete company Partek Morin. Of thissum just over half has been used to writoff fixed assets in both companies. Thevalue of Partek’s holding in PolarYhtymä Oy has been depreciated bFIM 29 million and a provision of FIM15 million has been made for a tax dispute resulting from turning certain of theGroup’s activities into limited compa-nies. Both these sums are also enteredextraordinary expenses for the year.
Partek’s net result after allowing forextraordinary expenses and taxe

-
dti)n
t.t-
e
ae
r-i-t-
d--
.ed
nl-n-d
tt
netf- dh.di
0
osc
-o
rn.ne
n
,a-
-
e
yw
ky
5
il
n
-
r
ler
amounted to FIM -193 (1993: -393) million.
Return on capital employed improvebut nevertheless continued to be unsafactory, amounting to 6.1 (1993: 0.2percent. Return on equity after taxes aafter allowing for changes in deferred taliability was 3.7 (1993: -19.8) percenEarnings per share after taxes and afallowing for changes in deferred tax liability was FIM 1.43 (1993: -11.09).
Return on capital employed for thdifferent business areas is now approacing the long-term budget targets. Ththe return on capital employed for thwhole Group continues to be far fromsatisfactory is primarily due to OtheBusiness Activities, which have provided only weak or no return. The provsions made in the financial statemengive support to continuing re-structuring measures.
Minerals. Operating profit improvedcompared with the previous year anamounted to FIM 132 (1993: 93) million. Minerals’ profit improved as a result of strengthening demand and threorganisation measures undertaken.
Cargotec. Operating profit im-proved over the preceding year anreached FIM 137 (1993: 60) millionKnuckleboom cranes and forestry cranreported improvements in profit anprofitability for all divisions was good.
Building Products. Operating prof-
he
d
p
l-
o
-
y
l
ts
s-
dx
er
h-t
s
e
d
s
it was better than the previous year aamounted to FIM 170 (1993: 75) milion. All divisions were able to report aimproved result, mainly owing to rationalisation and strengthening demanAssociated companies recorded a beresult than the year before.
Euroc. Euroc has been included iPartek’s consolidated financial statments in accordance with the equimethod. Partek’s share of Euroc’s proamounts to FIM 63 million. In the Balance Sheet Partek’s holding in Eurocentered as FIM 866 million; the quotevalue of the shares at the end of tfinancial period was FIM 1 136 million
Euroc’s profit improved strongly anamounted after financial items and mnority interests to SEK 871 (1993: 24million. One of the reasons for this improvement was the merging with Finnish operations. Increased volumes supplies, improved prices, reduced coand a major capital gain are further fators that had a favourable impact oEuroc’s profit.
Other Business Activities. Operat-ing profit for Partek North America improved but weakened in the case Partek Morin. Both, together withPartek’s real estate administration, weloss-making. Operating losses amoued to FIM 104 (1993: 171) millionPartek’s associated company A-Rakenusmies improved its result but the levstill remains unsatisfactory. The samealso true of United Tiles.
L I Q U I D I T Y A N DE Q U I T Y / A S S E T S R A T I O
Special attention was directed during tfinancial period towards improving thGroup’s liquidity and equity/assets ratio. During the year there was an issueconvertible subordinated bonds, bonwith warrants, and a rights issue. Bmeans of these measures the Grouequity increased by FIM 423 million.
The convertible subordinated bondamount to FIM 167.8 million. Followingthe rights issue made in the late autumthese bonds can be converted in
26
d
.er
-yit
is
e
-)--fts-n
f
et-
-l
is
e
-ofsy’s
s
n,to
2 104 326 shares, representing aincrease in share capital of FIM21 043 260. The bonds with warrantsamount to FIM 1.5 million and givessubscription rights, after the new issueto 315 652 shares, increasing the compny’s share capital by FIM 3 156 520. Theconversion/subscription price is FIM79.75 and FIM 77.07 per share respectively. A more detailed account of theconditions for the convertible subordi-nated bonds and bonds with warrants arto be found on page 49.
During the period Nov. 30 – Dec. 30,1994, a rights issue was made wherebshareholders could subscribe to one neshare for six old ones at a price of FIM46.00 per share. This meant that Partewas able to increase its share capital bFIM 55 million to FIM 385 million. Thenumber of shares increased from 5.million to 38.5 million. This increase inshare capital was not registered untafter the financial period had expired;the increase has, however, been takeinto account when calculating key indi-cators.
The Board of Directors has been given the authority to further increasePartek’s share capital up to Novembe21, 1995 by a maximum of FIM38 million by means of a new issue ofshares and also by means of convertibbonds or bonds with warrants in one omore issues.
The task of selling assets that faloutside Partek’s core operations continued throughout the year and will alsocontinue during the current year. Like-wise concerted efforts are being made treduce the working capital used by thedifferent divisions. This work has al-ready borne fruit and has liberated considerable quantities of capital.
Interest-bearing loans decreased bsome FIM 0.2 billion and by year-endthey amounted to FIM 3.0 billion. Totalliabilities decreased by FIM 0.3 billion.The quick ratio at the end of the financiaperiod was 0.68 (1993: 0.71) and thecurrent ratio 0.94 (1993: 1.07).
Loans in foreign currencies havebeen taken as a hedge against the effec
’ved8h
gr
e
er9
ict
e
tle
h
a
f
/
hhio9o
-t
k
est
sw
,.
d
rc--is-ts
n
d
utc-
e
-
e
s
ygsoh
a
nae
r
teyu
k
etr
exerted by exchange-rate fluctuatioon investment in the form of Partekequity when foreign subsidiaries habeen acquired or their equity increas
At the close of the financial perioPartek’s equity/assets ratio was 2(1993: 25.0) percent and excluding tconvertible subordinated bonds 25percent. Net financial expenses incluing the share in associated companwere FIM 190 (1993: 411) million. Neinterest payments amounted to 3(1993: 4.8) percent of net sales.
S H A R E S A N DS H A R E H O L D E R S
Trading on the Helsinki Stock Exchanduring the year was lively. The upwaswing in prices that began in 1992 cotinued during 1993 and also the greapart of 1994. The HEX index for December rose to 1847, which was 17 perchigher than in December 1993.
The price of Partek’s shares was bter than the average. The adjusted prose from FIM 47.65 at the end of 19to FIM 60.00 at the end of 1994, in othwords by 26 percent. The price at whPartek’s shares were traded during year was highest in May, when it reachFIM 81.79 and lowest in January, whit was FIM 47.55.
Partek shares were traded during year on the Helsinki Exchange to a vaof FIM 414.8 (1993: 237) million. Thadjusted number of shares traded talled FIM 6.3 (1993: 6.1) million, representing 18 (1993: 17) percent of tentire stock.
The number of shareholders at yeend was 12 060 (1993: 11 958).
Earnings per share after tax and aallowing for the change in deferred taxwas FIM 1.43 (1993: –11.09). The Pratio was 42 (1993: negative).
No dividend was distributed for thyears 1992 and 1993 because of the lalosses made by the Group. While tresult for 1994 is not satisfactory, ttrend is nonetheless in the right directand is expected to continue during 19The Board of Directors therefore pr
nssed.
.0e
.2d-iest.7
edn-ter-nt
t-ice3
erhheedn
heue
to--e
r-
teresE
ergeeen5.-
poses to the Annual General Meetinthat a small dividend, FIM 0.60 per shartotalling FIM 23.1 million, be paid for1994.
The strengthening of the Group’equity/assets ratio is now being givehigh priority. The intention for the futureis that the dividend should be a reasonble portion of the earnings per share.
C H A N G E S I NO W N E R S H I P S T R U C T U R E
On May 17, the Norwegian companAker a.s acquired privately the Rettiand Myllykoski groups’ shareholdingin Partek. Aker purchased a total 8 888 208 shares or 26.9 percent of ttotal stock of Partek at a price of FIM89.50 per share.
Aker is quoted on the stock exchangin Oslo and also on the SEAQ Interntional in London. Aker’s operations cover two main areas: cement and cemebased building materials, and oil and gtechnology. In 1994 the company’s salamounted to approx. NOK 16.6 billionof which approx. NOK 6.5 billion wasaccounted for by building materials.
S H A R E H O L D E R S ’A G R E E M E N T
Simultaneously with Aker’s acquisitionof its holding in Partek, a shareholdeagreement regarding the right of pre-emtion, which will apply to the shares owneby the parties concerned at the time of making of the agreement, was concludbetween Aker, Åbo Akademi UniversitFoundation, the Sampo Insurance Groand the Pension-Varma pension compny. Agreement was also reached on reresentation on Partek’s Board. The signtories’ aggregate holding in Parteamounted to 52.1 percent.
B O A R D O F D I R E C T O R S
As a consequence of the sale of thPartek shares, the representatives of Rettig and Myllykoski groups ThoBjörn Lundqvist and Fredrik Björnberg
27
resigned from Partek’s Board of Directors. During the year Nils G. Grotenfeland Kauko Kaasila, both long-servingmembers, left Partek’s Board. Parteextends its heart-felt gratitude to themfor the expertise that they brought to thBoard over the years and for the intereand commitment they have shownPartek.
The number of Board members waincreased by one to nine and is nomade up of the following: Carl OlofTallgren, chairman, Sakari T. Lehtovice-chairman, Jan Ekberg, Cato AHolmsen, Jouko K. Leskinen, BjörnMattsson, Paavo Pitkänen, Tom Ruuand Christoffer Taxell.
S T R U C T U R A L C H A N G E SDuring the years 1992-1993 majochanges were made in Partek’s struture, above all to its domestic mineralbased building materials operations. Threorganisation continued during the financial year when Partek exercised ioption to acquire Metra’s half of thejointly owned company Partek MetraOy Ab. This company owns the shares iEuroc AB, received when PartekCement Ab and Lohja Oy Ab weretransferred to Euroc’s ownership in1993. The company through whichPartek owns 25 percent of the equity anvoting rights of Euroc is now calledPartek Byggprodukter Ab.
I N V E S T M E N TInvestment increased during the year bthe increase was due entirely to the aquisition of Metra’s holding of the joint-ly owned shares in Euroc. Altogether thsum of FIM 581 (1993: 159) million wasinvested and distributed between different assets as follows:(FIM million) 1994 1993Buildings andconstructions 15.6 20.0Machinery andequipment 116.5 98.3Shares andparticipations 396.2 10.6Other 52.3 29.6
Total 580.6 158.5
g,
n
a-
fe
e-
-t-ss
,
sp-dhed
pa-p-a-
irhe

r-tdfey.
--resr-ngl
-nddr
--
’s
e
d to
of
e
t andnces on
Distribution by geographical regionwas as follows:
(FIM million) 1994 1993Finland 86.0 52.9Other Nordic countries452.9 39.0Other EU countries 37.2 54.9USA and Canada 3.7 11.1Other regions 0.7 0.6
Total 580.6 158.4
P E R S O N N E L
The average number of employees duing the year was 8 128 (1993: 9 428). Ayear-end the total was 8 133 comparewith 8 094 a year earlier. The number oemployees increased slightly during thyear as a result of better use of capacit
P R O S P E C T S F O R 1 9 9 5
Activity in the construction field is ex-pected to remain at a low level during1995 in Finland and Sweden. In Norway, Denmark, the Netherlands, Belgium, Germany and France it will eithecontinue unchanged or increase. Salof trucks are expected to increase futher. Trends in the export industries iFinland and Sweden promise continuinbuoyant demand for lime and industriaminerals.
The structural and adaptive measures taken by Partek in recent years athe improved economic situation shoulmake it possible for the Group to betteits result in 1995. If the major losses inOther Business Activities can be radically reduced or even eliminated entirely, then there exist possibilities of aneven greater improvement in the Groupresult. However, during the first fourmonths of the year Partek’s result will bweak.
P R O P O S A L T O T H E A N N U A L G E N E R A L M E E T I N G
Group non-restricted equity according to the Balance Sheet amounte
FIM 442.3 million on December 31, 1994, after allowing for a net loss
FIM 193.9 million for the financial period. During 1995, FIM 5.8 million
must be transferred from non-restricted equity to restricted equity.
The Parent Company’s non-restricted equity according to the Balanc
Sheet was FIM 682 209 782.69 on December 31, 1994. Of this
– undistributed profit from previous years 647 626 217.89
– net loss for the financial period – 113 071 420.88
534 554 797.01
The Board proposes that the aboveamount be distributed as follows:
– a dividend of FIM 0.60 per share
be distributed for 1994 23 100 000.00
– to be carried forward 511 454 797.01
534 554 797.01
Further details of the Partek Group’s and the Parent Company’s resulfinancial position are to be found in the Income Statements and BalaSheets, Source and Application of Funds and Notes to the Accountpages 29-47.
Pargas, 2 March 1995
Carl Olof TallgrenChairman
Jan Ekberg
Jouko K. Leskinen
Paavo Pitkänen
Christoffer TaxellPresident
Sakari T. LehtoVice-chairman
Cato A. Holmsen
Björn Mattsson
Tom Ruud
28

CONSOLIDATEDINCOME STATEMENT
JANUARY 1 - DECEMBER 31, 1994
1994 1993FIM million % FIM million %
NET SALES 6 166.3 100.0 6 609.8 100.0
Cost of goods sold – 4 739.2 – 76.9 – 5 287.1 – 80.0
GROSS PROFIT 1 427.1 23.1 1 322.6 20.0Selling and marketing costs – 569.9 – 664.1Research and development costs – 123.2 – 125.9Administration expenses – 451.3 – 515.6Other operating expenses – 115.4 – 193.3Other operating income 64.3 180.5
– 1 195.6 – 19.4 – 1 318.5 – 19.9
OPERATING PROFIT (notes 2, 3 and 4) 231.5 3.8 4.1 0.1
FINANCIAL ITEMSShare in associated companies (note 5) 50.1 – 47.6Dividend income 0.2 1.3Interest income onlong-term investments 8.0 3.2Other interest income 31.1 51.2Interest expenses – 256.8 – 369.1Other financial expenses (note 6) – 19.8 – 47.7Value adjustment of investments – 3.2 – 2.6
– 190.4 – 3.1 – 411.4 – 6.2PROFIT/LOSS AFTERFINANCIAL ITEMS 41.1 0.7 – 407.3 – 6.2
EXTRAORDINARY ITEMSExpenses (note 7) – 243.7 – 4.0 – 26.6 – 0.4
PROFIT/LOSS BEFORE TAXATIONAND MINORITY SHARE – 202.6 – 3.3 – 433.9 – 6.6
Direct taxes for the year – 46.5 – 38.0Change in deferred tax 69.6 81.4Minority share – 14.7 – 2.1
NET PROFIT/LOSS FOR THE PERIOD – 193.9 – 3.1 – 392.5 – 5.9
29

31.12.1994 31.12.1993FIM million % FIM million %
ASSETS
FIXED ASSETSIntangible assets (note 8)Goodwill 117.5 152.3Other capitalised expenditure 40.4 50.1
157.9 2.4 202.4 3.1
Tangible assets (note 8)Mineral deposits and land 598.8 607.6Buildings and constructions 816.8 960.7Machinery and equipment 877.1 1 119.4Other tangible assets 71.3 89.4Advance payments andconstruction in progress 11.0 23.2
2 375.1 36.0 2 800.4 42.8
Investments (note 9)Shares in associated companies (note 10) 1 146.8 634.6Other shares and participations 104.8 116.6Long-term receivables (note 11) 203.7 217.2Other investments 29.7 27.5
1 485.1 22.5 995.9 15.2
Fixed assets. total 4 018.1 61.0 3 998.7 61.1
CURRENT ASSETSInventoriesMaterials and supplies 313.0 307.1Finished and semi-finished products 478.9 604.2Advance payments 3.5 4.4
795.4 12.1 915.6 14.0Receivables (note 11)Accounts receivable 981.9 898.8Loans receivable 137.1 76.6Prepayment and accrued income 128.4 93.9Other receivables 69.9 174.7
1 317.4 20.0 1 244.0 19.0Liquid assetsShares and participations 5.0 11.1Cash on hand and in banks 454.3 371.5
459.2 7.0 382.6 5.8
Current assets. total 2 572.0 39.0 2 542.3 38.9
ASSETS. TOTAL 6 590.1 100.0 6 540.9 100.0
PLEDGED ASSETS (note 20) 766.9 847.7
CONSOLIDATEDBALANCE SHEET
30

31.12.1994 31.12.1993FIM million % FIM million %
LIABILITIES AND EQUITY
SHAREHOLDERS’ EQUITY (not 12)RESTRICTED EQUITY
Ordinary share capital 330.0 330.0Share issue 1994 230.6 –Capital reserve 332.4 332.4Revaluation reserve 36.7 36.8Other restricted equity 27.5 138.4
957.2 14.5 837.7 12.8
Convertible subordinated bonds 167.8 2.5 –
NON-RESTRICTED EQUITYEquity share of untaxed reserves (note 13) 223.4 421.8Other non-restricted equity 636.2 733.6Net profit/loss for the financial year – 193.9 – 392.5
665.7 10.1 762.9 11.7
Shareholders’ equity, total 1 790.7 27.2 1 600.6 24.5
MINORITY INTERESTTotal 54.0 0.8 35.4 0.5
PROVISIONS (note 14)Provisions 273.7 4.2 144.2 2.2
LIABILITIESLONG-TERM (note 15)
Debentures and bonds with warrants (note 16) 101.5 250.0Loans from financial institutions 899.3 1 221.9Pension fund loans 581.2 624.3Other interest bearing debts 60.3 79.5Deferred tax liabilities 86.5 157.3Other interest-free debts 16.8 50.0
1 745.6 26.5 2 383.0 36.4
SHORT-TERM (notes 17, 18)Loans from financial institutions 227.4 231.8Pension fund loans 35.7 34.3Other interest bearing debts 1 094.4 757.5Advances received 118.2 96.9Accounts payable 576.9 490.1Accrued expenses and prepaid income 441.4 436.3Other interest-free debts 231.9 330.9
2 726.0 41.4 2 377.8 36.4Total liabilities 4 471.6 67.9 4 760.8 72.8
TOTAL LIABILITES AND EQUITY 6 590.1 100.0 6 540.9 100.0
CONTINGENT LIABILITIES (note 20) 586.9 1 070.5
31

GROUP SOURCE ANDAPPLICATION OF FUNDSJANUARY 1 - DECEMBER 31, 1994
Loans, fixed assets and workingcapital belonging to subsidiariesacquired or sold during the year areincluded in the change of each item.
1994 1993(FIM million)
FUNDS GENERATED FROM OPERATIONSNet sales 6 166.3 6 609.5
Operating expenses – 5 934.8 – 6 605.4
Operating profit before depreciation 231.5 4.1Depreciation and value adjustmentsnot affecting cash flow 480.7 466.4Financial items – 190.4 – 411.4Extraordinary items – 243.7 – 26.6Less profit/loss on sale of fixed assets – 23.9 – 97.2Direct taxes for the year – 46.5 – 38.0
Total 207.7 – 102.7
CHANGE IN WORKING CAPITALInventories (+ =decrease) 120.2 213.7Short-term receivables (– = increase) – 73.4 184.4Short-term payables (+ = increase) 11.5 – 412.7
Total 58.3 – 14.6
NET FUNDS GENERATED FROM OPERATIONS 266.0 – 117.3
NET INVESTMENTInvestment – 580.6 – 158.5Sale of fixed assets 55.7 295.9Other changes 238.5 529.8
Total – 286.4 667.2
FINANCIAL SURPLUS/DEFICIT – 20.4 549.9
EXTERNAL FINANCINGEquity:
Share issue 230.6Convertible subordinated bonds 167.8Minority interest 3.9 5.0Translation differences and other changes – 15.2 – 63.1
Short- and long-term loans:New loans 364.8 141.9Repayment on loans – 342.0 – 380.4Other changes – 326.3 – 533.5
Other financing:Long-term receivables (+ = decrease) 13.5 191.1
Total 97.1 – 639.0
CHANGE IN LIQUID ASSETS 76.6 – 89.1
32

INCOME STATEMENTPARENT COMANYJANUARY 1 - DECEMBER 31, 1994
1994 1993(FIM million)
NET SALES 73.6 37.3Costs of goods sold – 17.8 – 12.4
GROSS PROFIT 55.8 24.9Selling and marketing costs – 7.4 – 7.7Research and development costs – 2.2 – 2.0Administration expenses – 89.2 – 89.7Other operating expenses – 35.4 – 227.9Other operating income 24.4 41.7
– 109.7 – 285.6
OPERATING PROFIT/LOSS(notes 2, 3 and 4) – 53.9 – 260.7
FINANCIAL ITEMS (note 19)Dividend income 51.1 65.7Interest income onlong-term investments 21.8 55.7Other interest income 29.8 49.5Interest expenses – 159.9 – 207.2Other financial expenses (note 6) 84.4 – 25.0Value adjustment of investment – 2.6 3.2
24.6 – 57.9
PROFIT/LOSS AFTERFINANCIAL ITEMS – 29.3 – 318.6
EXTRAORDINARY ITEMSExpenses (note 7) – 444.9 – 48.5Received Group contribution (note 5) 116.0 232.0
– 328.9 183.5
PROFIT/LOSS BEFOREAPPROPRIATIONS AND TAXATION – 358.2 – 135.1
AppropriationsDepreciation less than plan 41.8 20.2Transfers from untaxed reserves 200.1 38.0
Direct taxes 3.2 0.6
NET PROFIT/LOSSFOR THE PERIOD – 113.1 – 76.3
33
SOURCE ANDAPPLICATION OF FUNDSPARENT COMANYJANUARY 1 - DECEMBER 31, 1994
1994 1993(FIM million)
FUNDS GENERATEDFROM OPERATIONS
Net sales 73.6 37.3Operating expenses – 127.5 – 298.0
Operating profit/loss – 53.9 – 260.7
Depreciation and value adjustments 417.5 234.4Financial income and expenses 24.6 – 57.9Extraordinary income and expenses – 328.9 183.5Taxes 3.2 0.6Profit on sale of fixed assets andloss on mergers 35.2 2.4
97.8 102.3
CHANGE IN WORKING CAPITALInventories (– increase) – 5.1 –Short-term receivables (– increase) – 32.4 240.0Short-term interest-freedebts (– decrease) – 40.1 – 332.1
– 77.5 – 92.1
NET FUNDS GENERATEDFROM OPERATIONS 20.3 10.2
NET INVESTMENTInvestment in other fixed assets – 738.6 – 861.6Sale of other fixed assets 163.3 330.0
– 575.3 – 531.6
FINANCIAL DEFICIT/SURPLUS – 555.0 – 521.4
EXTERNAL FINANCINGEquity:Share issue 230.6 –Convertible subordinated bonds 167.8 –
Short- and long-term liabilities:New loans 438.5 373.6Repayment on loans – 380.9 – 260.8
Other financing:Long-term receivables 162.8 417.0
618.8 529.8
CHANGE IN LIQUID ASSETS 63.8 8.5

BALANCE SHEET,PARENT COMPANY
DECEMBER 31 , 1994
1994 1993MFIM % MFIM %
ASSETS
FIXED ASSETSIntangible assets (note 8)
Other capitalised expenditure 21.3 22.9
21.3 0.5 22.9 0.5
Tangible assets (note 8)Mineral deposits and land 261.4 251.2Buildings and constructions 258.5 286.6Machinery and equipment 10.1 7.2Other tangible assets 3.5 4.5
533.5 12.1 549.5 12.6
InvestmentsShares andparticipations (note 9)
Subsidiaries 2 452.3 1 943.7Associatedcompanies (note 10) 66.6 416.0Other shares andparticipations 88.6 102.5
Long-term receivables (note 11)409.6 575.8Other investments 23.4 20.0
3 040.5 68.7 3 058.0 70.1
Fixed assets, total 3 595.3 81.2 3 630.4 83.2
CURRENT ASSETSInventories
Finished and semi-finishedproducts 5.1 0.1 –
Receivables (note 11)Accounts receivable 25.0 7.6Loans receivable 411.0 329.2Prepayments andaccrued income 81.5 32.6Other receivables 202.7 318.4
720.2 16.3 687.8 15.8
Liquid assetsShares and participations 4.8 9.0Cash on hand and in banks 102.1 34.1
106.8 2.4 43.1 1.0
Current assets, total 832.1 18.8 730.9 16.8
ASSETS, TOTAL 4 427.3 100.0 4 361.3 100.0
PLEDGED ASSETS (note 20) 19.9 106.8
34
1994 1993MFIM % MFIM %
LIABILITIES AND EQUITY
SHAREHOLDERS’EQUITY (note 12)
Restricted equityOrdinary share capital 330.0 330.0Share issue 1994 230.6 –Capital reserve 332.4 332.4Revaluation reserve 36.3 36.3
929.4 21.0 698.8 16.0
Convertible subordinated bonds 167.8 3.8 –
Non-restricted equityContingency reserve 147.7 147.7Other non-restricted equity 647.6 724.0Net result for thefinancial year – 113.1 – 76.3
682.2 15.4 795.3 18.2
Shareholders’ equity, total 1 779.4 40.2 1 494.0 34.3
UNTAXED RESERVES AND PROVISIONSAccumulated excessdepreciation (note 13) 141.1 177.9Reserves (note 13)
Acquisition reserve – 199.5Other reserves 1.0 1.6
Provisions (note 14) 45.3 43.0
Untaxed reserves andprovisions, total 187.5 4.2 422.0 9.7
LIABILITIES
Long-term (note 15)Debentures and bondswith warrants (note 16) 101.5 100.0Loans from financial institutions 512.9 702.6Pension fund loans 372.3 385.4Other interest-bearing debts 3.3 4.4Interest-free debts 2.7 –
992.6 22.4 1 192.4 27.3
Short-term (notes 17, 18)Loans from financial institutions 466.5 335.2Pension fund loans 28.1 29.0Other interest-bearing debts 846.8 719.8Accounts payable 9.6 4.6Accrued expenses andprepaid income 82.4 55.6Other interest-free debts 34.4 108.6
1 467.8 33.2 1 252.9 28.7
Total liabilities 2 460.4 55.6 2 445.3 56.1
TOTAL LIABILITIESAND EQUITY 4 427.3 100.0 4 361.3 100.0
CONTINGENTLIABILITIES (note 20) 1 540.6 2 265.3

NOTES TO THE ACCOUNTS
t
kthdet
hce
rce
ten
y
cinesc
-
ree
hhieaa o
teei’
hest
v-he
d
-lher-stg-
f-sresndnaxtot
ern,
ele
--s ofad
n.
-ed
nns,o-ts
a-d
s,
e
tsh
s-tsc
t
a
a
wi
a
re.
q
c
nhc
eea
cirn
NOTE 1
ACCOUNTING PRINCIPLESThe year reviewed covers the monthJanuary–December. The year 199covered the months March–Decemband earlier years the months MarchFebruary.
(A) BASIS OF ACCOUNTSThe Consolidated Financial Statementhe Parent Company’s accounts and taccounts of Finnish subsidiaries havbeen drawn up in accordance with legilation and current regulations in Finland. Foreign subsidiaries’ accounhave been adjusted to conform to acounting practice in Finland.
(B) CONSOLIDATIONPRINCIPLES
The Consolidated Financial Statemencover the parent company Partek Oy Aand all companies in Finland and abroin which the parent company controlleddirectly or indirectly, more than fiftypercent of the shares or participationsthe end of the financial year. The Consolidated Balance Sheet has been draup in accordance with the direct acquistion method.
Companies acquired during the yehave been included in the Group IncomStatement from the date of their acquistion. Companies sold during the year aincluded in the Consolidated IncomStatement up to the date of their sale
Associated companies have beeconsolidated in accordance with the euity method.
In drawing up the ConsolidatedFinancial Statements internal transations have been eliminated.
(C) GOODWILLGoodwill, i.e. the difference betweethe acquisition value of shares and tcurrent value of net assets in the aquired company, is entered as a fixeasset in the Consolidated Balance Shand is written off systematically on thbasis of its economic life. In no case hthis life exceeded ten years.
Possible untaxed reserves in the aquired company at the time of acquistion are divided in accordance with ealier practice between an equity share adeferred taxes according to current tarates.
(D) INVESTMENTSEVALUATION
Investments classified as fixed assehave been entered at their acquisitiovalue less possible depreciation to tainto account the actual decrease in wor
Investments in securities classifieas current assets are valued at the lowof either their acquisition or markevalue.
SALESWhen an investment has been sold, tdifference between the net sales priand the book value is entered in thIncome Statement.
SUBSIDIARIESInvestments in subsidiary companies arecorded in the Parent Company’s acounts in accordance with the abovpolicy for the evaluation of long-termassets. For Consolidated Financial Staments the principles of consolidation iparagraph B are applied.
A list of the most important subsidiarcompanies is included in Note 9.
ASSOCIATED COMPANIESInvestments in associated companies ashown in the Parent Company’s BalanSheet in accordance with the above prciples for long-term fixed assets. In thConsolidated Financial Statements asociated companies are recorded in acordance with the equity method.
A list of the most important associated companies are shown in Note 9.
(E) FOREIGN CURRENCIESTRANSACTIONS
Transactions in foreign currencies atranslated in the currency used in thFinancial Statements on the basis of texchange rate applying on the day of ttransaction. Liquid assets and debts foreign currencies have been translatinto the currency used in the FinanciStatements according to the centrbank’s exchange rate on the last daythe financial period.
TRANSLATION OFFINANCIAL STATEMENTS
Foreign subsidiaries are considered operate independently and do not therfore constitute an integrated part of thParent Company’s operations. As a drect result of this foreign subsidiaries
s1r–
,e
e-
-
sbd,
t-n
-
rei-e
n-
-
e-
det
s
---dx
35
sne.
st
ee
e-
-
ree-
--
eendllf
o-
-
assets and liabilities are translated at tcentral bank’s exchange rates on the laday of the financial period while incomeand expenditure are translated at an aerage exchange rate for the whole of tperiod under review. Differencesarising from this translation are entereunder equity.
EQUITY HEDGINGIn order to minimise the effects of translation in the Consolidated FinanciaStatements loans are recorded in tsame currency as the foreign subsidiaies’ equity. Exchange-rate differenceresulting from these loans are offseagainst translation differences resultinfrom translating the foreign subsidiaries’ balance sheets.
(F) TAXESTax liabilities are calculated on the proit before tax and permanent differencebetween taxable and recorded profit ataken into account. Tax on differencebecause items have been recorded ataxed in different periods are included ithe Balance Sheet as deferred taxes. Tclaims that may be offset againspossible future approved losses are ntaken into account until realised.
Deferred taxes are calculated on thbasis of tax rates for the following yeaor, in cases where these are not knowfor the the financial period.
(G) INVENTORYInventory has been valued at either thdirect acquisition value or net realisabvalue, whichever is lowest. The first-infirst-out principle has been used in valuing inventory. When calculating the value of semi-finished and finished goodaccount has also been taken not onlythe direct acquisition cost but also reasonable portion of indirect costs andepreciation associated with productio
(H) TANGIBLE FIXED ASSETSLand, mineral deposits, factories, machinery and other equipment are enteraccording to their historic acquisitioncost with the exception of certain land iFinland, the value of which has beeappreciated in certain Group companieespecially the Parent Company. An ecnomic life has been estimated for asseand on the basis of this linear deprecition according to plan has been carrieout. In the case of mineral deposit
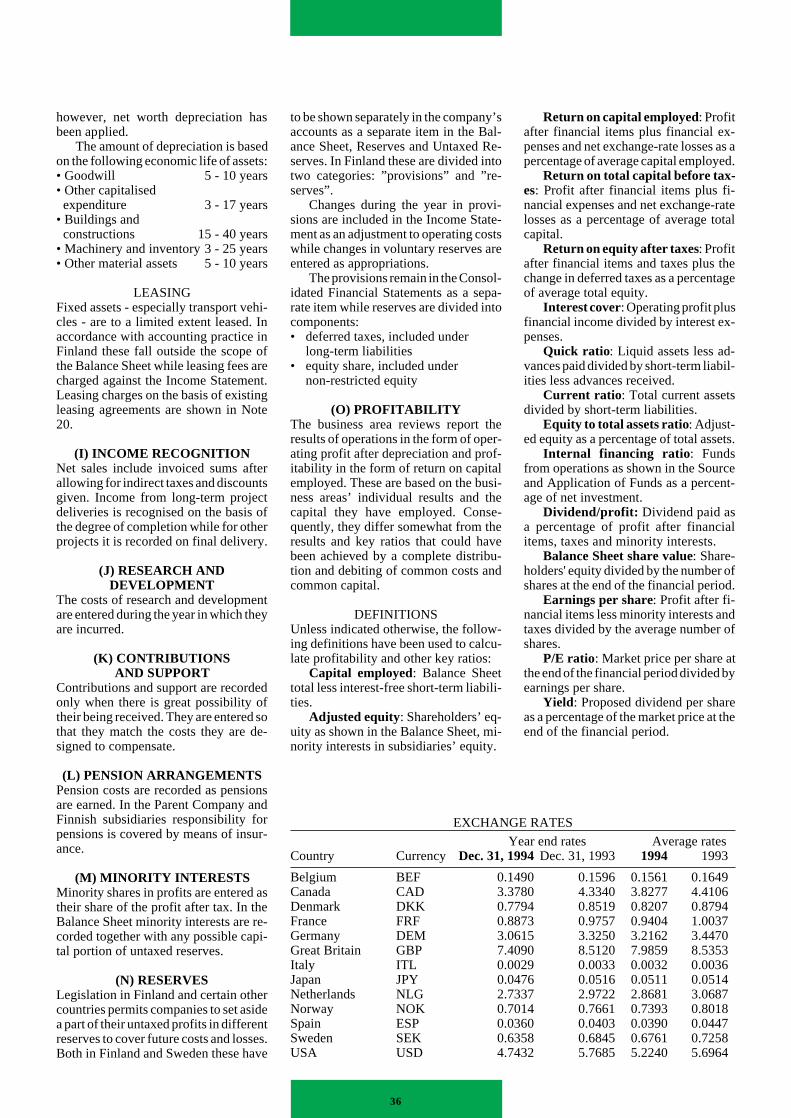
s
h
t
e
e
onsnr
eei
ridtev
- as ad.
atetal
eage
-
-l-
ts.
cet-
l
fd.
dof
ty
ethe
’a
t-
i-esr
l-
to
hr-ls
ee
ud
-u
i-
s
964703
47
878
4
however, net worth depreciation habeen applied.
The amount of depreciation is baseon the following economic life of assets• Goodwill 5 - 10 years• Other capitalised expenditure 3 - 17 year• Buildings and constructions 15 - 40 year• Machinery and inventory 3 - 25 year• Other material assets 5 - 10 yea
LEASINGFixed assets - especially transport vecles - are to a limited extent leased. accordance with accounting practice Finland these fall outside the scope the Balance Sheet while leasing fees acharged against the Income StatemeLeasing charges on the basis of existileasing agreements are shown in No20.
(I) INCOME RECOGNITIONNet sales include invoiced sums aftallowing for indirect taxes and discoungiven. Income from long-term projecdeliveries is recognised on the basis the degree of completion while for otheprojects it is recorded on final delivery
(J) RESEARCH ANDDEVELOPMENT
The costs of research and developmeare entered during the year in which thare incurred.
(K) CONTRIBUTIONSAND SUPPORT
Contributions and support are recordonly when there is great possibility otheir being received. They are enteredthat they match the costs they are dsigned to compensate.
(L) PENSION ARRANGEMENTSPension costs are recorded as pensiare earned. In the Parent Company aFinnish subsidiaries responsibility fopensions is covered by means of insuance.
(M) MINORITY INTERESTSMinority shares in profits are entered atheir share of the profit after tax. In thBalance Sheet minority interests are rcorded together with any possible captal portion of untaxed reserves.
(N) RESERVESLegislation in Finland and certain othecountries permits companies to set asa part of their untaxed profits in differenreserves to cover future costs and lossBoth in Finland and Sweden these ha
s
d:
ssrs
i-Ininofrent.ngte
erstofr.
nty
df soe-
to be shown separately in the companyaccounts as a separate item in the Bance Sheet, Reserves and Untaxed Rserves. In Finland these are divided intwo categories: ”provisions” and ”reserves”.
Changes during the year in provsions are included in the Income Statment as an adjustment to operating cowhile changes in voluntary reserves aentered as appropriations.
The provisions remain in the Consoidated Financial Statements as a seprate item while reserves are divided incomponents:• deferred taxes, included under
long-term liabilities• equity share, included under
non-restricted equity
(O) PROFITABILITYThe business area reviews report tresults of operations in the form of opeating profit after depreciation and profitability in the form of return on capitaemployed. These are based on the buness areas’ individual results and thcapital they have employed. Consquently, they differ somewhat from thresults and key ratios that could havbeen achieved by a complete distribtion and debiting of common costs ancommon capital.
DEFINITIONSUnless indicated otherwise, the following definitions have been used to calclate profitability and other key ratios:
Capital employed: Balance Sheettotal less interest-free short-term liabilties.
Adjusted equity: Shareholders’ eq-uity as shown in the Balance Sheet, mnority interests in subsidiaries’ equity.
36
Return on capital employed: Profitafter financial items plus financial expenses and net exchange-rate lossespercentage of average capital employe
Return on total capital before tax-es: Profit after financial items plus fi-nancial expenses and net exchange-rlosses as a percentage of average tocapital.
Return on equity after taxes: Profitafter financial items and taxes plus thchange in deferred taxes as a percentof average total equity.
Interest cover: Operating profit plusfinancial income divided by interest expenses.
Quick ratio : Liquid assets less advances paid divided by short-term liabiities less advances received.
Current ratio : Total current assetsdivided by short-term liabilities.
Equity to total assets ratio: Adjust-ed equity as a percentage of total asse
Internal financing ratio : Fundsfrom operations as shown in the Sourand Application of Funds as a percenage of net investment.
Dividend/profit: Dividend paid asa percentage of profit after financiaitems, taxes and minority interests.
Balance Sheet share value: Share-holders' equity divided by the number oshares at the end of the financial perio
Earnings per share: Profit after fi-nancial items less minority interests antaxes divided by the average number shares.
P/E ratio: Market price per share athe end of the financial period divided bearnings per share.
Yield: Proposed dividend per sharas a percentage of the market price at end of the financial period.
sl-e-o
-tse
a-
e-
i-e-
e-
-
i-
d
r-
s
--
e
s.e
EXCHANGE RATES
Year end rates Average rateCountry Currency Dec. 31, 1994Dec. 31, 1993 1994 1993
Belgium BEF 0.1490 0.1596 0.1561 0.164Canada CAD 3.3780 4.3340 3.8277 4.410Denmark DKK 0.7794 0.8519 0.8207 0.879France FRF 0.8873 0.9757 0.9404 1.003Germany DEM 3.0615 3.3250 3.2162 3.447Great Britain GBP 7.4090 8.5120 7.9859 8.535Italy ITL 0.0029 0.0033 0.0032 0.0036Japan JPY 0.0476 0.0516 0.0511 0.051Netherlands NLG 2.7337 2.9722 2.8681 3.068Norway NOK 0.7014 0.7661 0.7393 0.801Spain ESP 0.0360 0.0403 0.0390 0.044Sweden SEK 0.6358 0.6845 0.6761 0.725USA USD 4.7432 5.7685 5.2240 5.696

he
NOTE 2 WAGES AND SALARIES(FIM million) Group Parent Comany
1994 1993 1994 1993WAGES AND SALARIES
Salaries, wages and fringe benefits toBoard Members and Managing Directors 34.3 36.8 1.7 1.6To others 1 266.6 1 352.1 29.9 14.6Bonus to Board Members andManaging Directors 2.5 1.6 – –
Total 1 303.3 1 390.5 31.6 16.2
OTHER PAYROLL COSTSPensions and pension premiums 120.8 145.2 6.9 6.7Other payroll costs 181.7 288.9 4.7 1.7
Total 302.4 434.1 11.6 8.5
TOTAL 1 605.8 1 824.6 43.1 24.7
The President of the Parent Company and other members of the Executive Board are entitled to retire at tage of 60 while heads of divisions and persons in similar posts are entitled to retire at 62.
NOTE 3 DEPRECIATIONGroup Parent Company
(FIM million) 1994 1993 1994 1993DEPRECIATION BY FUNCTION
Production 246.2 273.2 11.0 10.5Distribution and marketing 17.0 20.6 0.1 0.2Research and development 4.1 8.1 – –Administration 29.6 45.1 11.6 12.1Other operating expenses
Goodwill 31.7 33.8 –
Depreciation according to plan 328.7 380.8 22.8 22.8Extra depreciation 152.0 28.9 394.7 223.2
Total 480.7 409.7 417.4 246.0
DEPRECIATION ACCORDING TO PLANGoodwill 31.7 33.8 – –Other long-term expenditure 11.7 14.5 3.4 3.3Land and mineral deposits 7.7 5.9 – –Building and constructions 64.8 63.2 15.5 14.9Machinery and equiment 190.9 239.2 2.8 3.4Other tangible assets 21.9 24.1 1.1 1.1
Total 328.7 380.8 22.8 22.8
BOOK DEPRECIATION(incl. reduction in Investment and AcquisitionReserves)
Goodwill 31.7 33.8 – –Other long-term expenditure 13.6 11.8 1.7 1.6Land and mineral deposits 11.7 4.0 – –Building and constructions 39.1 57.6 – 20.1 0.0Machinery and equiment 290.5 176.8 – 1.6 0.0Other tangible assets 22.3 23.7 1.0 1.1Securities and investments 34.0 27.0 394.7 223.2
Total 442.9 334.7 375.7 225.8
DEPRECIATION LESS THAN PLAN 37.8 75.0 41.8 20.2
37

NOTE 4 OTHER OPERATING ITEMS
NOTE 5 SHARE IN PROFIT/LOSS OF ASSOCIATED COMPANIES
Share of equity Profit after Share of Share of% tax profit after profit after
tax tax(FIM million) 1994 1993
A-Rakennusmies Oy 27.0 2.2 0.0 – 8.1Lohja Oy Ab, Sept. 1.92–Aug. 31.93 – – 24.8NordCarb Oy 30.0 1.1 0.3 – 1.8Parma Oy*), May 1.93– 50.0 4.9 1.7 – 3.3Partek Betonila Oy Ab, Sept. 1.93– 50.0 12.5 – 4.9 – 11.5Partek Cement Ab, Jan. 1–Aug. 31.93 – 8.2Partek Metra Oy Ab*), Sept. 1.93–Oct. 31.1994 50.0 69.3 34.7 2.4Roctex Oy Ab 50.0 – 7.4 – 3.7 – 2.0Other associated companies in Finland 0.6 0.8Controladora Accionaria Y AdministrativaS.A. de C.v., Mexico 45,0 1.0 0.5 1.8Eastern Concrete Pte Ltd,Singapore Jan. 1.93– Jan. 1.94 – 1.7Eastern Partek Pte Ltd, Singapore 45.0 16.5 7.4 2.8Euroc AB, Sverige, Nov. 1.94– 25.0 119.5 28.5 –Hiab Kanglim Co Ltd, Republic of Korea 45.0 – 6.4 – 2.9 – 4.9Rockwool Ecoprim AB, Sweden 50.0 1.4 0.7 0.3Steinullarverksmidjan H/F, Iceland 27.7 0.5 0.1 – 1.1United Tiles AB, Sweden 50.0 – 26.3 – 13.2 – 7.9Other associated companies 0.2 – 0.1
Total 50.1 – 47.6*) Owned by the Parent Company
Group Parent Company(FIM million) 1994 1993 1994 1993
INCOMERents 8.1 5.2 4.3 2.0Profit on sale of fixed assets 35.9 127.0 20.0 21.7Other income 20.3 48.3 0.0 18.1
Total 64.3 180.5 24.4 41.7
EXPENSESTaxes on real estate 2.8 3.9 1.8 1.7Depreciation on goodwill 31.7 33.8 – –Depreciation of shares – 0.0 2.6 175.3Depreciation on receivables – 4.4 0.0 0.0Loss on sale of fixed assets 12.0 29.8 4.7 24.1Redundancy pay 0.5 7.5 – –Depreciation on fixed assets 13.0 5.2 – –Other restructuring costs 29.9 70.7 13.6 17.0Other expenses 25.5 38.0 12.7 9.9
Total 115.4 193.3 35.4 227.9
38

NOTE 6 OTHER FINANCIAL ITEMS
NOTE 7 EXTRAORDINARY ITEMS
Group Parent Company(FIM million) 1994 1993 1994 1993
EXCHANGE RATE DIFFERENCESON LOANS
Exchange rate gains 266.9 245.1 274.5 57.5Exchange rate losses – 270.4 – 283.6 – 180.8 – 79.1
Total exchange rate differences – 3.5 – 38.5 93.8 – 21.6
OTHER FINANCIAL INCOMEAND EXPENSES
Other financial income 4.1 3.4 – -Other financial expenses – 20.4 – 12.7 – 9.4 – 3.4
Total – 19.8 – 47.7 84.4 – 25.0
Group(FIM million) 31.12.1994 31.12.1993GOODWILLAcquisition value Jan. 1 424.3 442.7+ Increase during the year 6.9 0.0– Decrease during the year – 26.3 – 18.4
Acquisition value Dec. 31 404.9 424.3– Accumulated depreciation – 287.4 – 272.1
Residual value Dec. 31 117.5 152.3
NOTE 8 FIXED ASSETS
Group Parent Company(FIM million) 1994 1993 1994 1993
EXPENSESDepreciation of shares in subsidiaries 360.2 –Depreciation of other shares 28.9 26.6 28.9 48.5Merger loss 49.4 –Provision for restructuring costs anddepreciation on fixed assets 200.0 – 3.0 –Provision for tax dispute 14.9 – 3.4 –
Total 243.8 26.6 444.9 48.5
39
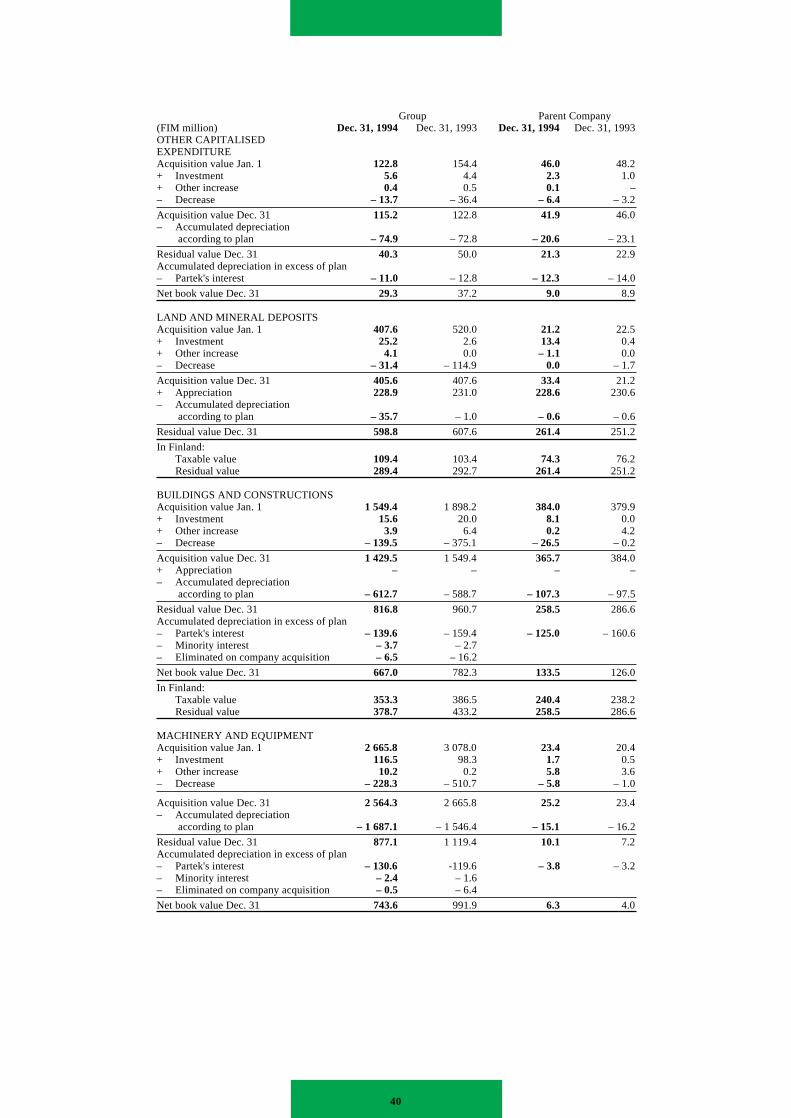
Group Parent Company(FIM million) Dec. 31, 1994 Dec. 31, 1993 Dec. 31, 1994 Dec. 31, 1993OTHER CAPITALISEDEXPENDITUREAcquisition value Jan. 1 122.8 154.4 46.0 48.2+ Investment 5.6 4.4 2.3 1.0+ Other increase 0.4 0.5 0.1 –– Decrease – 13.7 – 36.4 – 6.4 – 3.2
Acquisition value Dec. 31 115.2 122.8 41.9 46.0– Accumulated depreciation
according to plan – 74.9 – 72.8 – 20.6 – 23.1
Residual value Dec. 31 40.3 50.0 21.3 22.9Accumulated depreciation in excess of plan– Partek's interest – 11.0 – 12.8 – 12.3 – 14.0
Net book value Dec. 31 29.3 37.2 9.0 8.9
LAND AND MINERAL DEPOSITSAcquisition value Jan. 1 407.6 520.0 21.2 22.5+ Investment 25.2 2.6 13.4 0.4+ Other increase 4.1 0.0 – 1.1 0.0– Decrease – 31.4 – 114.9 0.0 – 1.7
Acquisition value Dec. 31 405.6 407.6 33.4 21.2+ Appreciation 228.9 231.0 228.6 230.6– Accumulated depreciation
according to plan – 35.7 – 1.0 – 0.6 – 0.6
Residual value Dec. 31 598.8 607.6 261.4 251.2
In Finland:Taxable value 109.4 103.4 74.3 76.2Residual value 289.4 292.7 261.4 251.2
BUILDINGS AND CONSTRUCTIONSAcquisition value Jan. 1 1 549.4 1 898.2 384.0 379.9+ Investment 15.6 20.0 8.1 0.0+ Other increase 3.9 6.4 0.2 4.2– Decrease – 139.5 – 375.1 – 26.5 – 0.2
Acquisition value Dec. 31 1 429.5 1 549.4 365.7 384.0+ Appreciation – – – –– Accumulated depreciation
according to plan – 612.7 – 588.7 – 107.3 – 97.5
Residual value Dec. 31 816.8 960.7 258.5 286.6Accumulated depreciation in excess of plan– Partek's interest – 139.6 – 159.4 – 125.0 – 160.6– Minority interest – 3.7 – 2.7– Eliminated on company acquisition – 6.5 – 16.2
Net book value Dec. 31 667.0 782.3 133.5 126.0
In Finland:Taxable value 353.3 386.5 240.4 238.2Residual value 378.7 433.2 258.5 286.6
MACHINERY AND EQUIPMENTAcquisition value Jan. 1 2 665.8 3 078.0 23.4 20.4+ Investment 116.5 98.3 1.7 0.5+ Other increase 10.2 0.2 5.8 3.6– Decrease – 228.3 – 510.7 – 5.8 – 1.0
Acquisition value Dec. 31 2 564.3 2 665.8 25.2 23.4– Accumulated depreciation
according to plan – 1 687.1 – 1 546.4 – 15.1 – 16.2
Residual value Dec. 31 877.1 1 119.4 10.1 7.2Accumulated depreciation in excess of plan– Partek's interest – 130.6 -119.6 – 3.8 – 3.2– Minority interest – 2.4 – 1.6– Eliminated on company acquisition – 0.5 – 6.4
Net book value Dec. 31 743.6 991.9 6.3 4.0
40

Group Parent Company(FIM million) Dec. 31, 1994 Dec. 31, 1993 Dec. 31, 1994 Dec. 31, 1993OTHER TANGIBLE ASSETSAcquisition value Jan. 1 219.4 226.9 24.8 24.5+ Investment 7.2 4.8 0.1 0.0+ Other increase 3.6 4.9 0.0 0.5– Decrease – 26.6 – 17.2 – 7.7 – 0.1
Acquisition value Dec. 31 203.5 219.4 17.3 24.8– Accumulated depreciation
according to plan – 132.2 – 130.0 – 13.7 – 20.3
Residual value Dec. 31 71.3 89.4 3.5 4.5Accumulated depreciation in excess of plan– Partek's interest – 0.1 – 0.2 – 0.1 – 0.1
Net book value Dec. 31 71.1 89.2 3.5 4.4
CONSTRUCTION IN PROGRESSAcquisition value Jan. 1 22.0 41.4 0.0 5.5+ Investment 7.4 17.8 0.0 0.0+ Other increase 0.0 0.3 – –– Decrease – 21.2 – 37.6 0.0 – 5.5
Acquisition value Dec. 31 8.1 22.0 0.0 0.0
SHARES AND PARTICIPATIONS, SUBSIDIARIESAcquisition value Jan. 1 2 207.1 1 895.8+ Investment 397.8 10.1+ Other increase 634.5 310.5– Decrease – 162.6 – 9.3
Acquisition value Dec. 31 3 076.9 2 207.1– Accumulated extraordinary depreciation – 624.6 – 263.4
Net book value Dec. 31 2 452.3 1 943.7
In Finland:Taxable value 2 174.1 1 345.1Residual value 2 452.3 1 943.7
SHARES AND PARTICIPATIONS,ASSOCIATED COMPANIESAcquisition value Jan. 1 782.5 613.4 416.0 251.0+ Investment 329.9 5.5 0.0 0.1+ Other increase 112.0 573.3 2.3 525.7– Decrease – 10.8 – 409.7 – 350.1 – 360.6
Acquisition value Dec. 31 1 276.6 782.5 68.2 416.0– Depreciation and adjusted
share of equity – 129.7 – 147.9 – 1.6 0.0
Net book value Dec. 31 1 146.8 634.6 66.6 416.0
In Finland:Taxable value 936.3 505.2 20.5 416.0Residual value 1 073.9 416.0 68.2 416.0
SHARES AND PARTICIPATIONS, OTHERSAcquisition value 168.0 309.6 151.6 143.4+ Investment 3.3 5.1 0.0 5.1+ Other increase 26.8 15.5 22.4 11.6– Decrease – 11.5 – 162.2 – 4.5 – 8.5
Acquisition value Dec. 31 186.5 168.0 169.5 151.6– Accumulated extraordinary depreciation – 81.7 – 51.4 – 81.0 – 49.1
Residual value Dec. 31 104.8 116.6 88.6 102.5
In Finland:Taxable value 48.3 72.1 44.0 68.0Residual value 93.7 102.5 88.6 102.5
41
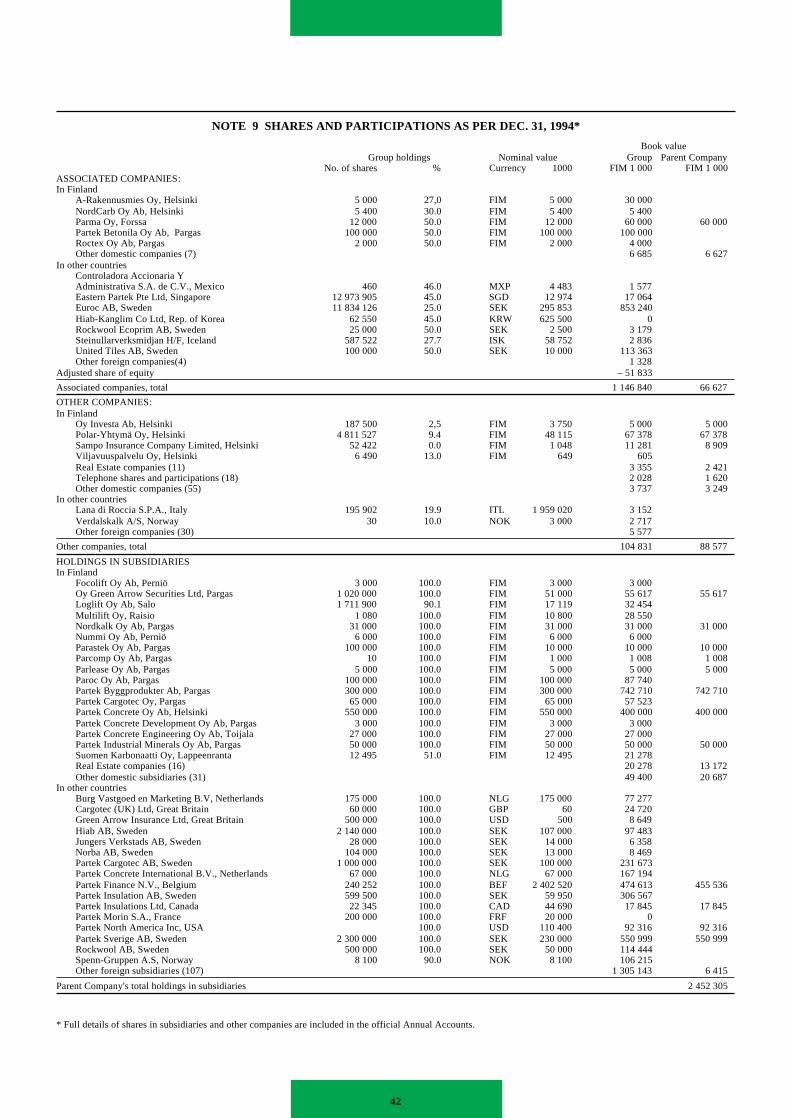
NOTE 9 SHARES AND PARTICIPATIONS AS PER DEC. 31, 1994*
Book valueGroup holdings Nominal value Group Parent Company
No. of shares % Currency 1000 FIM 1 000 FIM 1 000ASSOCIATED COMPANIES:In Finland
A-Rakennusmies Oy, Helsinki 5 000 27,0 FIM 5 000 30 000NordCarb Oy Ab, Helsinki 5 400 30.0 FIM 5 400 5 400Parma Oy, Forssa 12 000 50.0 FIM 12 000 60 000 60 000Partek Betonila Oy Ab, Pargas 100 000 50.0 FIM 100 000 100 000Roctex Oy Ab, Pargas 2 000 50.0 FIM 2 000 4 000Other domestic companies (7) 6 685 6 627
In other countriesControladora Accionaria YAdministrativa S.A. de C.V., Mexico 460 46.0 MXP 4 483 1 577Eastern Partek Pte Ltd, Singapore 12 973 905 45.0 SGD 12 974 17 064Euroc AB, Sweden 11 834 126 25.0 SEK 295 853 853 240Hiab-Kanglim Co Ltd, Rep. of Korea 62 550 45.0 KRW 625 500 0Rockwool Ecoprim AB, Sweden 25 000 50.0 SEK 2 500 3 179Steinullarverksmidjan H/F, Iceland 587 522 27.7 ISK 58 752 2 836United Tiles AB, Sweden 100 000 50.0 SEK 10 000 113 363Other foreign companies(4) 1 328
Adjusted share of equity – 51 833
Associated companies, total 1 146 840 66 627
OTHER COMPANIES:In Finland
Oy Investa Ab, Helsinki 187 500 2,5 FIM 3 750 5 000 5 000Polar-Yhtymä Oy, Helsinki 4 811 527 9.4 FIM 48 115 67 378 67 378Sampo Insurance Company Limited, Helsinki 52 422 0.0 FIM 1 048 11 281 8 909Viljavuuspalvelu Oy, Helsinki 6 490 13.0 FIM 649 605Real Estate companies (11) 3 355 2 421Telephone shares and participations (18) 2 028 1 620Other domestic companies (55) 3 737 3 249
In other countriesLana di Roccia S.P.A., Italy 195 902 19.9 ITL 1 959 020 3 152Verdalskalk A/S, Norway 30 10.0 NOK 3 000 2 717Other foreign companies (30) 5 577
Other companies, total 104 831 88 577
HOLDINGS IN SUBSIDIARIESIn Finland
Focolift Oy Ab, Perniö 3 000 100.0 FIM 3 000 3 000Oy Green Arrow Securities Ltd, Pargas 1 020 000 100.0 FIM 51 000 55 617 55 617Loglift Oy Ab, Salo 1 711 900 90.1 FIM 17 119 32 454Multilift Oy, Raisio 1 080 100.0 FIM 10 800 28 550Nordkalk Oy Ab, Pargas 31 000 100.0 FIM 31 000 31 000 31 000Nummi Oy Ab, Perniö 6 000 100.0 FIM 6 000 6 000Parastek Oy Ab, Pargas 100 000 100.0 FIM 10 000 10 000 10 000Parcomp Oy Ab, Pargas 10 100.0 FIM 1 000 1 008 1 008Parlease Oy Ab, Pargas 5 000 100.0 FIM 5 000 5 000 5 000Paroc Oy Ab, Pargas 100 000 100.0 FIM 100 000 87 740Partek Byggprodukter Ab, Pargas 300 000 100.0 FIM 300 000 742 710 742 710Partek Cargotec Oy, Pargas 65 000 100.0 FIM 65 000 57 523Partek Concrete Oy Ab, Helsinki 550 000 100.0 FIM 550 000 400 000 400 000Partek Concrete Development Oy Ab, Pargas 3 000 100.0 FIM 3 000 3 000Partek Concrete Engineering Oy Ab, Toijala 27 000 100.0 FIM 27 000 27 000Partek Industrial Minerals Oy Ab, Pargas 50 000 100.0 FIM 50 000 50 000 50 000Suomen Karbonaatti Oy, Lappeenranta 12 495 51.0 FIM 12 495 21 278Real Estate companies (16) 20 278 13 172Other domestic subsidiaries (31) 49 400 20 687
In other countriesBurg Vastgoed en Marketing B.V, Netherlands 175 000 100.0 NLG 175 000 77 277Cargotec (UK) Ltd, Great Britain 60 000 100.0 GBP 60 24 720Green Arrow Insurance Ltd, Great Britain 500 000 100.0 USD 500 8 649Hiab AB, Sweden 2 140 000 100.0 SEK 107 000 97 483Jungers Verkstads AB, Sweden 28 000 100.0 SEK 14 000 6 358Norba AB, Sweden 104 000 100.0 SEK 13 000 8 469Partek Cargotec AB, Sweden 1 000 000 100.0 SEK 100 000 231 673Partek Concrete International B.V., Netherlands 67 000 100.0 NLG 67 000 167 194Partek Finance N.V., Belgium 240 252 100.0 BEF 2 402 520 474 613 455 536Partek Insulation AB, Sweden 599 500 100.0 SEK 59 950 306 567Partek Insulations Ltd, Canada 22 345 100.0 CAD 44 690 17 845 17 845Partek Morin S.A., France 200 000 100.0 FRF 20 000 0Partek North America Inc, USA 100.0 USD 110 400 92 316 92 316Partek Sverige AB, Sweden 2 300 000 100.0 SEK 230 000 550 999 550 999Rockwool AB, Sweden 500 000 100.0 SEK 50 000 114 444Spenn-Gruppen A.S, Norway 8 100 90.0 NOK 8 100 106 215Other foreign subsidiaries (107) 1 305 143 6 415
Parent Company's total holdings in subsidiaries 2 452 305
* Full details of shares in subsidiaries and other companies are included in the official Annual Accounts.
42

NOTE 10 SHARE OF EQUITY IN ASSOCIATED COMPANIES
NOTE 11 LONG- AND SHORT-TERM RECEIVABLESGroup Parent Company
(FIM million) Dec. 31, 1994 Dec. 31, 1993 Dec. 31, 1994 Dec. 31, 1993
BOARD OF DIRECTORS ANDEXECUTIVE BOARDLong-term loans 0.3 0.5 0.3 0.5Short-term loans 0.1 0.1 0.1 0.1
Total 0.4 0.6 0.4 0.6
OTHER PERSONNELLong-term loans 9.6 10.8 8.6 9.4Short-term loans 3.7 2.4 3.5 2.3
Total 13.3 13.3 12.1 11.7
SUBSIDIARIESLong-term loans 266.2 438.9Short-term loans 303.8 279.8Accounts receivable 19.8 4.1Prepayments and accrued income 20.0 19.7Other short-term receivables 196.8 237.6
Total 806.6 980.0
ASSOCIATED COMPANIESLong-term loans 142.4 45.4 97.1 0.7Short-term loans 111.1 2.4 103.5 0.9Accounts receivable 15.6 8.0 3.9 1.6Prepayments and accrued income 11.9 0.6 0.1 0.0Other short-term receivables 4.4 78.0 3.2 77.9
Total 285.4 134.4 207.9 81.1
OTHERSLong-term loans 51.3 160.4 37.4 126.4Short-term loans 22.3 71.8 0.0 46.9Accounts receivable 966.4 890.8 1.4 1.9Prepayments and accrued income 116.4 93.3 61.4 12.9Other short-term receivables 65.6 96.7 2.6 2.0
Total 1 222.0 1 313.0 102.8 190.1
LONG-TERM RECEIVABLESBoard of Directors and Executive Board 0.3 0.5 0.3 0.5Other personnel 9.6 10.8 8.6 9.4Subsidiaries 266.2 438.9Associated companies 142.4 45.4 97.1 0.7Others 51.3 160.4 37.4 126.4
Total 203.7 217.2 409.6 575.8
SHORT-TERM RECEIVABLESBoard of Directors and Executive Board 0.1 0.1 0.1 0.1Other personnel 3.7 2.4 3.5 2.3Subsidiaries 540.4 541.2Associated companies 142.9 88.9 110.8 80.4Others 1 170.7 1 152.6 65.4 63.7
Total 1 317.4 1 244.0 720.2 687.8
Share of equity 1994 1993% FIM million FIM million
A-Rakennusmies Oy, Helsinki 27.0 5.1 4.4NordCarb Oy Ab, Helsinki 30.0 3.9 3.6Parma Oy, Forssa *) 50.0 58.7 56.7Partek Betonila Oy Ab, Pargas 50.0 55.1 48.8Partek Metra Oy Ab, Helsinki*) – 351.0Roctex Oy Ab, Pargas 50.0 0.0 1.9Other associated companies in Finland 0.9 3.8Controladora Accionaria Y AdministrativaS.A. de C.V., Mexico 45.0 5.5 4.9Eastern Concrete Pte Ltd, Singapore – 4.4Eastern Partek Pte Ltd, Singapore 45.0 42.0 28.0Euroc AB, Sweden 25.0 865.8 –Hiab-Kanglim Co Ltd, Republic of Korea 45.0 0.0 -1.0Rockwool Ecoprim AB, Sverige 50.0 4.2 3.9Steinullarverksmidjan H/F, Iceland 27.7 3.0 3.1United Tiles AB, Sweden 50.0 101.4 87.3Other associated companies 1.3 0.7
*) Owned by the Parent Company
43

Total Restricted equity Non-restricted equity
Share CapitalRevaluation Other Share in Other non-(FIM million) capital reserve reserve restricted untaxed restricted
reserves equityGROUP
January 1. 1994 1 600.6 330.0 332.4 36.8 138.4 421.8 341.1Share issue 1994 230.6 230.6Convertible subordinated bonds 167.8 167.8Translation differences – 15.2 – 104.1 – 0.2 89.1Transfer of change in equity share – – 198.1 198.1Other changes 0.8 – 0.2 – 6.8 – 0.1 7.9Net result for the financial year – 193.9 – 193.9
December 31. 1994 1 790.7 330.0 332.4 36.7 426.0 223.4 442.2
N.B. In accordance with current legislation for certain foreign subsidiaries FIM 5.8 million should betransferred from non-restricted equity to restricted equity.
PARENT COMPANYJanuary 1. 1994 1 494.0 330.0 332.4 36.3 – – 795.3Share issue 1994 230.6 230.6Convertible subordinated bonds 167.8 167.8Net result for the financial year – 113.1 – 113.1
December 31. 1994 1 779.4 330.0 332.4 36.3 398.4 – 682.2
NOTE 12 CHANGE IN SHAREHOLDERS’ EQUITY
NOTE 14 PROVISIONS
(FIM million) Group Parent Company1994 1993 1994 1993
For project deliveries and claims 69.0 48.5 11.5 19.1For reorganisation of operations inNorth America and France 93.6 – 3.0 –For divestment of real estate businessand reorganisation of other operations 94.6 86.8 23.8 22.8Others 16.5 8.9 7.1 1.1
Total 273.7 144.2 45.3 43.0
NOTE 13 UNTAXED RESERVES
(FIM million) 31.12.1994 Increases Decreases 31.12.1993
GROUP, PARTEK’S SHAREAccumulated depreciation in excess of plan 281.1 69.8 – 107.8 319.1Operating reserve 6.7 – – 1.2 7.9Acquisition reserve – 13.4 – 237.9 224.4Other reserves 9.4 0.6 – 2.1 10.9
Total 297.2 83.9 – 349.0 562.4of which
Equity share 223.4 62.1 – 260.5 421.8Deferred taxes 73.8 21.7 – 88.5 140.6
In deferred taxes are also included:Deferred taxes in respect of minorityinterest in untaxed reserves 2.2 0.4 – 0.1 1.9Deferred taxes on untaxed reserveswhere the equity share has been eliminatedwhen calculating the acquisition cost 10.5 0.0 – 4.2 14.7
Deferred taxes total 86.5 22.1 – 92.8 157.3
PARENT COMPANYAccumulated depreciation in excess of plan 141.1 – 36.8 177.9Acquisition reserve – – 199.5 199.5Other reserves 1.0 – 0.6 1.6
Total 142.1 – 236.9 379.0
44

NOTE 15 LONG-TERM LIABILITIES
Long-term liabilities are loans taken by indi-vidiual Group companies in the correspondingcountry’s currency and loans taken in some
other currency. Most of the loans in othercurrencies have been taken to minimise theeffects of exchange rate fluctuations on foreign
subsidiaries’ equity. The principal currenciesin question are shown below.
Group(FIM million) Dec. 31, 1994 Dec. 31, 1993
Local currencies 1 309.9 1 680.7of which in FIM 726.1 (861.4) million.
Other currenciesBelgium BEF 67.8 74.6Denmark DKK 20.8 34.2France FRF 20.1 34.3Germany DEM 85.4 161.4Great Britain GBP 14.8 17.0Netherlands NLG 236.8 333.0Norway NOK 70.1 77.0Sweden SEK 58.3 73.5USA USD 147.5 205.2ECU-loans XEU 53.7 59.6Other – 6.3
Total 2 085.4 2 756.9Loan repayments 1995 – 339.8 -373.9
Long-term liabilities, total 1 745.6 2 383.0
Long-term liabilities to be repaidaccording to the following schedule:
In Balance Sheet Years 2 - 5 After 5 yearsGROUP:
Debentures and bonds with warrants 101.5 101.5 –Loans from financial institutions 899.5 708.8 190.5Pension loans 581.2 122.0 459.2Other interest-bearing loans 60.3 10.9 49.4Deferred taxes 86.5 – 86.5Other interest-free loans 16.8 2.7 14.1
Total 1 745.6 945.9 799.7
PARENT COMPANY:Debentures and bonds with warrants 101.5 101.5 –Loans from financial institutions 512.9 443.6 69.3Pension loans 372.3 93.8 278.5Other interest-bearing loans 3.3 2.8 0.5
Total 989.9 641.7 348.2
NOTE 16 DEBENTURES AND BONDS WITH WARRANTS
Company/ Interest rate Term Long-termissue % liabilities
MFIMPartek Corporation
Debentures,FIM 100 million, fixed rates 11.0 1993/1998 100.0Bonds with warrants,FIM 1,5 million, floating rates 6.17 1994/1998 1.5
Total on December 31, 1994 101.5
45
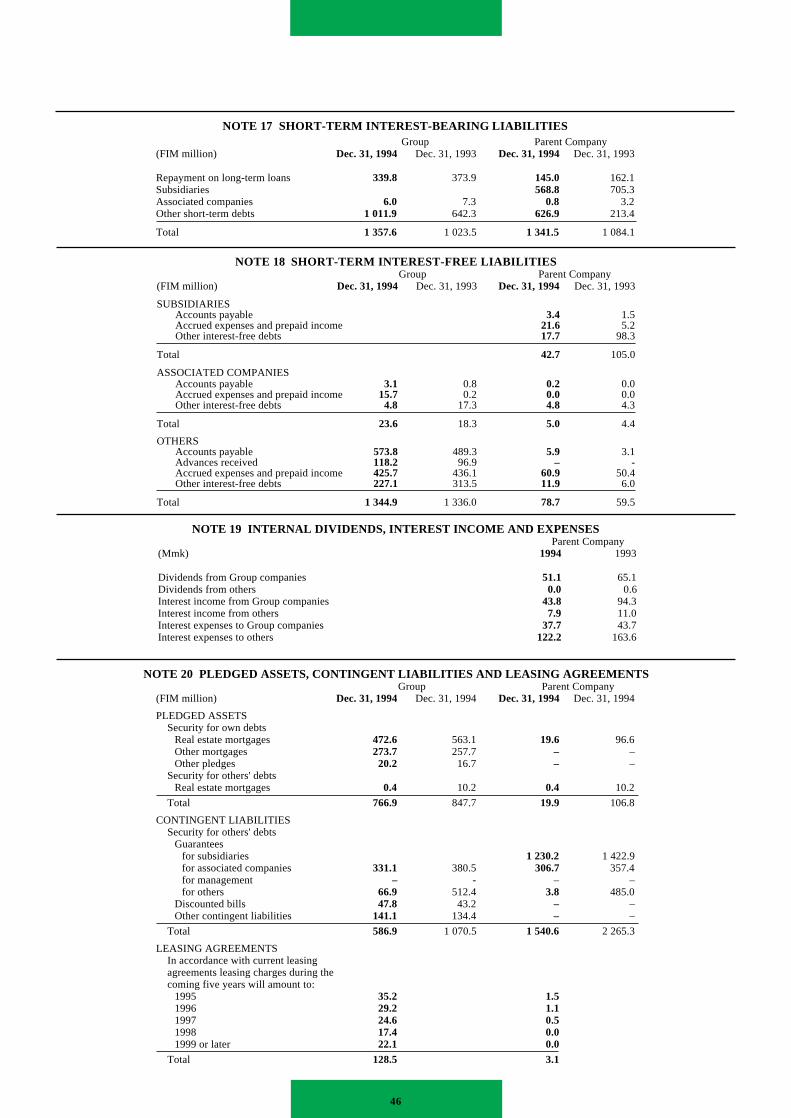
NOTE 17 SHORT-TERM INTEREST-BEARING LIABILITIESGroup Parent Company
(FIM million) Dec. 31, 1994 Dec. 31, 1993 Dec. 31, 1994 Dec. 31, 1993
Repayment on long-term loans 339.8 373.9 145.0 162.1Subsidiaries 568.8 705.3Associated companies 6.0 7.3 0.8 3.2Other short-term debts 1 011.9 642.3 626.9 213.4
Total 1 357.6 1 023.5 1 341.5 1 084.1
Group Parent Company(FIM million) Dec. 31, 1994 Dec. 31, 1994 Dec. 31, 1994 Dec. 31, 1994
PLEDGED ASSETSSecurity for own debts
Real estate mortgages 472.6 563.1 19.6 96.6Other mortgages 273.7 257.7 – –Other pledges 20.2 16.7 – –
Security for others' debtsReal estate mortgages 0.4 10.2 0.4 10.2
Total 766.9 847.7 19.9 106.8
CONTINGENT LIABILITIESSecurity for others' debts
Guaranteesfor subsidiaries 1 230.2 1 422.9for associated companies 331.1 380.5 306.7 357.4for management – - – –for others 66.9 512.4 3.8 485.0
Discounted bills 47.8 43.2 – –Other contingent liabilities 141.1 134.4 – –
Total 586.9 1 070.5 1 540.6 2 265.3
LEASING AGREEMENTSIn accordance with current leasingagreements leasing charges during thecoming five years will amount to:
1995 35.2 1.51996 29.2 1.11997 24.6 0.51998 17.4 0.01999 or later 22.1 0.0
Total 128.5 3.1
NOTE 20 PLEDGED ASSETS, CONTINGENT LIABILITIES AND LEASING AGREEMENTS
NOTE 19 INTERNAL DIVIDENDS, INTEREST INCOME AND EXPENSESParent Company
(Mmk) 1994 1993
Dividends from Group companies 51.1 65.1Dividends from others 0.0 0.6Interest income from Group companies 43.8 94.3Interest income from others 7.9 11.0Interest expenses to Group companies 37.7 43.7Interest expenses to others 122.2 163.6
NOTE 18 SHORT-TERM INTEREST-FREE LIABILITIESGroup Parent Company
(FIM million) Dec. 31, 1994 Dec. 31, 1993 Dec. 31, 1994 Dec. 31, 1993
SUBSIDIARIESAccounts payable 3.4 1.5Accrued expenses and prepaid income 21.6 5.2Other interest-free debts 17.7 98.3
Total 42.7 105.0
ASSOCIATED COMPANIESAccounts payable 3.1 0.8 0.2 0.0Accrued expenses and prepaid income 15.7 0.2 0.0 0.0Other interest-free debts 4.8 17.3 4.8 4.3
Total 23.6 18.3 5.0 4.4
OTHERSAccounts payable 573.8 489.3 5.9 3.1Advances received 118.2 96.9 – -Accrued expenses and prepaid income 425.7 436.1 60.9 50.4Other interest-free debts 227.1 313.5 11.9 6.0
Total 1 344.9 1 336.0 78.7 59.5
46
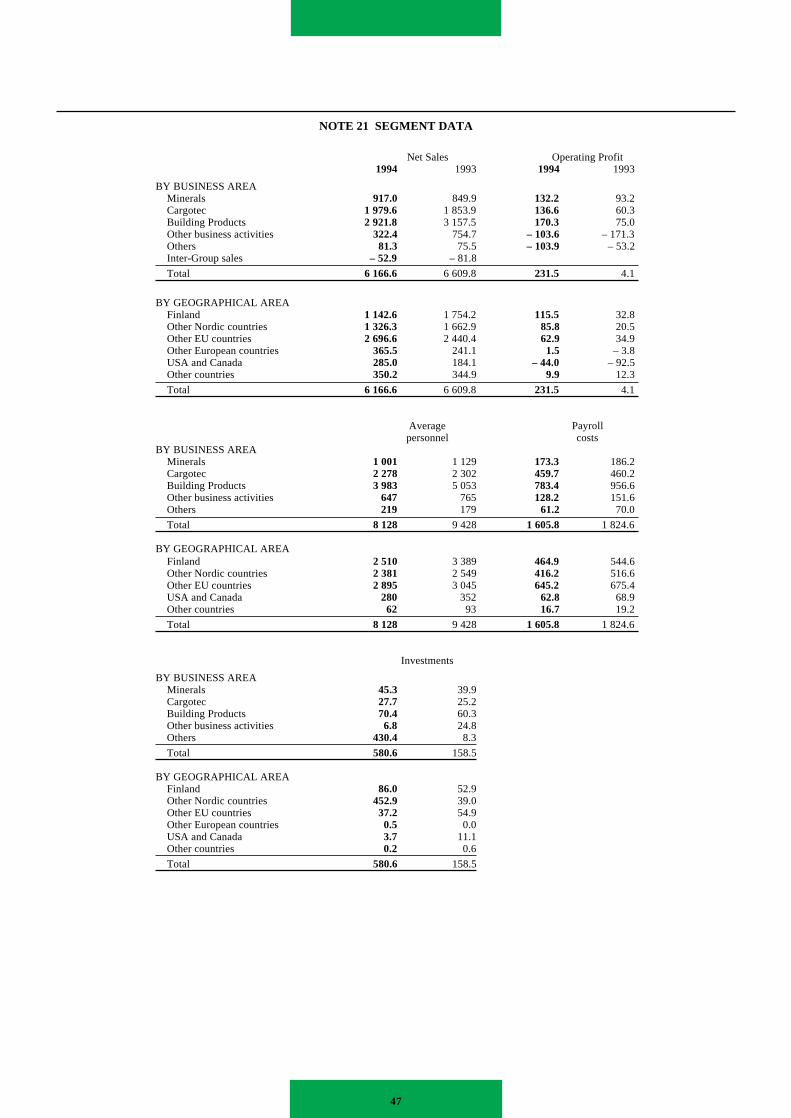
NOTE 21 SEGMENT DATA
Net Sales Operating Profit1994 1993 1994 1993
BY BUSINESS AREAMinerals 917.0 849.9 132.2 93.2Cargotec 1 979.6 1 853.9 136.6 60.3Building Products 2 921.8 3 157.5 170.3 75.0Other business activities 322.4 754.7 – 103.6 – 171.3Others 81.3 75.5 – 103.9 – 53.2Inter-Group sales – 52.9 – 81.8
Total 6 166.6 6 609.8 231.5 4.1
BY GEOGRAPHICAL AREAFinland 1 142.6 1 754.2 115.5 32.8Other Nordic countries 1 326.3 1 662.9 85.8 20.5Other EU countries 2 696.6 2 440.4 62.9 34.9Other European countries 365.5 241.1 1.5 – 3.8USA and Canada 285.0 184.1 – 44.0 – 92.5Other countries 350.2 344.9 9.9 12.3
Total 6 166.6 6 609.8 231.5 4.1
Average Payrollpersonnel costs
BY BUSINESS AREAMinerals 1 001 1 129 173.3 186.2Cargotec 2 278 2 302 459.7 460.2Building Products 3 983 5 053 783.4 956.6Other business activities 647 765 128.2 151.6Others 219 179 61.2 70.0
Total 8 128 9 428 1 605.8 1 824.6
BY GEOGRAPHICAL AREAFinland 2 510 3 389 464.9 544.6Other Nordic countries 2 381 2 549 416.2 516.6Other EU countries 2 895 3 045 645.2 675.4USA and Canada 280 352 62.8 68.9Other countries 62 93 16.7 19.2
Total 8 128 9 428 1 605.8 1 824.6
Investments
BY BUSINESS AREAMinerals 45.3 39.9Cargotec 27.7 25.2Building Products 70.4 60.3Other business activities 6.8 24.8Others 430.4 8.3
Total 580.6 158.5
BY GEOGRAPHICAL AREAFinland 86.0 52.9Other Nordic countries 452.9 39.0Other EU countries 37.2 54.9Other European countries 0.5 0.0USA and Canada 3.7 11.1Other countries 0.2 0.6
Total 580.6 158.5
47

s.
-
t
t
(Translation)
AUDITORS’ REPORT
To the shareholders of Partek Corporation
We have audited the accounts, the accounting records and the administration by the
Board of Directors and the Managing Director of Partek Corporation for the year ended
31 December 1994. The accounts prepared by the Board of Directors and the Managing
Director include the report of the Board of Directors, consolidated and parent company
income statements, balance sheets, cash flow statements and notes to the account
Based on our audit we express our opinion on these accounts and the company´s
administration.
We have conducted our audit in accordance with Finnish Generally Accepted
Auditing Standards. Those standards require that we plan and perform the audit in order
to obtain reasonable assurance about whether the accounts are free of material misstate
ment. An audit includes examining, on a test basis, evidence supporting the amounts and
disclosures in the accounts, assessing the accounting principles used and significant
estimates made by the management, as well as evaluating the overall financial statemen
presentation. The purpose of our audit of the administration has been to examine that the
Board of Directors and the Managing Director have complied with the rules of the
Finnish Companies´ Act.
In our opinion, the accounts have been prepared in accordance with the Finnish
Accounting Act and other rules and regulations governing the preparation of accounts
in Finland. The accounts give a true and fair view, as defined in the Accounting Act, of
both the consolidated and parent company result of operations, as well as of the financial
position. The financial statements can be adopted and the members of the Board of
Directors and the Managing Director can be discharged from liability for the period
audited by us. The proposal made by the Board of Directors on how to deal with the
retained earnings is in compliance with the Finnish Companies´ Act.
We have acquainted ourselves with the interim reports made public by the company
during the year. It is our understanding that the interim financial statements have been
prepared in accordance with the rules and regulations governing the preparation of such
statements in Finland.
Pargas, 28 March 1995
Eric Haglund
Authorized Public Accountant
Juhani Kolehmainen
Thor NyroosAuthorized Public Accountan
48

S H A R E S A N DS H A R E H O L D E R S
fl---we
-si-
st
red-
nr
-
ao-h
ei-f
at
r
e
ewxe6aahs
dlc
gd t
dhe
7radrn
EQUITYPartek’s registered share capital on 3December 1994 amounted to FIM 33million distributed between 33 millionshares with a nominal value of FIM 10The rights issue made between 30 November and 30 December 1994 raiseshare capital to FIM 385 million and thenumber of shares to 38.5 million. Theincrease in share capital was registereon 1 February 1995. The company’minimum share capital is FIM 175 mil-lion and its maximum share capital FIM700 million. Within these limits sharecapital can be raised or reduced withouany change to the Articles of Association
All shares are free and each sharcarries one vote and gives the same rigto dividend.
The shares are quoted on the Helsinki Stock Exchange.
CONVERTIBLESUBORDINATED BONDS 1994
On 25 April 1994 Partek’s Board of Di-rectors decided, in accordance with thauthority given it by the Annual GeneraMeeting of 21 April 1994, to issue con-vertible subordinated bonds directed tthe public. The bonds are subordinateand will count as equity. They have noexpiry date and no guarantee or warranty has been given for the bonds. The receivables resulting from the bonds hava lesser right than the company’s otheobligations. The nominal value of thebonds totals FIM 167 280 000 and th
10
.-d
ds
t.eht
-
el
od
--
er
e
conversion price adjusted for the shaissue is FIM 79.75 from 30 Novembe1994. Conversion can be made each yduring the period 2 January–30 November. By conversion of all the bonds thcompany’s share capital after the neissue in 1994 can be raised by a mamum of FIM 21 043 260 and the numbof shares by a maximum of 2 104 32which corresponds to 5.47 percent of shares and voting rights. The bonds tract a fixed annual interest payable witin the limits of the distributable fundbefore payment of dividend.
Up to 31 December 1994 no bonhad been converted. The convertibbonds are quoted on the Helsinki StoExchange.
BONDS WITHWARRANTS 1994
Partek’s Extraordinary General Meetinof 14 June 1994 decided to issue bonwith warrants intended as an incentivesenior management within the Grouincluding the president. These bondisapply shareholders’ pre-emptive rigto subscription. The nominal value of thbonds is FIM 1 500 000. The adjusteprice for one share that can be subscribto by means of the warrant is FIM 77.0Subscription to these bonds with warants can raise the company’s share cital by a maximum of FIM 3 156 520 anthe number of shares by 315 650, repsenting 0.82 percent of all shares avoting rights.
4 9
THE BOARD’S AUTHORITYAt an Extraordinary General Meetingheld on 21 November 1994 the Board oDirectors was authorised for a year caculated from the date of the Extraordinary General Meeting to raise the company’s share capital by means of a neissue of shares, to take up convertiblbonds or bonds with warrants in Finnishmarks on one or more occasions. In accordance with this authorisation Partek’share capital can be raised by a maxmum of FIM 38 million. The Board hasthe authority to determine the conditionof any such issue and loan provided thathe interests of existing shareholders anot neglected when the subscription anconversion price are fixed. The shareholders’ pre-emptive right may be dis-applied in the event of any increase iequity or issue of convertible bonds obonds with warrants.
SHAREHOLDERS’AGREEMENT
A shareholders’ agreement was concluded on 17 May 1994 between Aker, ÅboAkademi University Foundation, theSampo Insurance Group and the Varmpensions company. The agreement prvides for a pre-emptive in respect of eacshareholder’s holding at the time of theagreement and for representation by thshareholders on the Partek Board of Drectors. The aggregate shareholding othe parties to the agreement amountedyear-end to 51.3 percent.
erar-
i-r,llt--
sek
sopst
ded.-p-
e-d
re
00
00
000
00
SHARE ISSUES SINCE 1989
Type of Subscription Subscription Price/share, FIM Number of New shaissue period ratio new shares capital, FIM
Split June 19–Aug. 31,1989 From 100 FIM to 10 FIM
Bonus issue June 19–Aug. 31,1989 5:1 5 000 000 300 000 0
Rights issue June 19–Aug. 31,1989 10:1 100.00 2 500 000 325 000 0
Issue to the personnel June 19–Aug. 23,1989 135.00 500 000 330 000
Share issue Nov. 30–Dec. 30,1994 6:1 46.00 5 500 000 385 000 0
Convertiblesubordinated bonds May 6–May 13,1994 Public issue 83.91 max. 2 000 000Change from Nov. 30, 1994 79.75 2 104 326
Bonds with warrants June 20–July 1,1994 Issue to management 81.09 max. 300 000Change from Nov. 30, 1994 77.07 315 652

ent
s and
DISTRIBUTION OF SHARES
By size of holding, December 31, 1994
Shares per Shareholders Sharesholder No. % No. %1)
1 – 1000 9 647 80.0 2 754 246 7.21001 – 5000 2 000 16.6 4 093 190 10.65001 – 10000 226 1.9 1 552 378 4.0
10001 – 50000 140 1.2 2 782 248 7.250001 – 47 0.4 26 108 392 67.8Others 1 209 546 3.1
Total 12 060 100.0 38 500 000 100.0
1) Percentage of total number of shares andvoting rights
By shareholding, %
Dec. 31, Dec. 31,1994 1993
Private individuals 21.0 26.4
Associations and trusts 20.2 22.8
Companies 32.7 29.0
Insurance companies 17.0 15.5
Investment funds 4.3 3.0
Banks, financialinstitutions 0.2 0.8
State, local authoritiesand religious connunities 1.4 1.6
Others 3.1 0.8
Total 100.0 100.0
LARGEST SHAREHOLDERS
Dec. 31, 1994 Dec. 31, 1993No. %1) %1)
Aker a.s 10 479 776 27.2 –
Åbo Akademi University Foundation 4 057 123 10.5 11.6
Sampo GroupTeollisuusvakuutus Oy 1 591 466Jälleenvakuutusosakeyhtiö Patria 959 174Vakuutusosakeyhtiö Eläke-Sampo 515 925Vakuutusosakeyhtiö Sampo 270 000Otso Keskeytysvakuutus Oy 118 363Keskinäinen vakuutusyhtiö Kaleva 94 442Suomen Vakuutus Oy 46 304 3 681 762 9.6 9.6
Pension-VarmaPension-Varmamutual insurance company 1 368 731
Nova Henkivakuutusosakeyhtiö 175 661 1 544 392 4.0 4.0
Eläkesäätiö Polaris r.s. 466 666 1.2 1.2
Stif telsen Martha och AlbinLöfgrens Understödsfond r.s. 438 242 1.1 1.6
Oy TPL Optiot Ab 430 000 1.1 1.0
Alfred Berg Finland mutual fund 401 283 1.0 0.4
Samfundet Folkhälsan i Svenska Finland 334 487 0.9 0.9
Evli-Select mutual fund 326 500 0.8 –
Total 22 160 231 57.6 31.3
1) Percentage of total number of shares and voting rights.
Members of the Board of Directors and the Executive Board owned 19,125 shares or 0.05 (0.09) percof the total number of shares and voting rights. Members of the Executive Board also held bonds withwarrants whch entitle them to subscribe to 153 882 shares or 0.4 percent of the total number of sharevoting rights.
5 0

1994 1993 1992 1991 1990/91
Share capital and sharesShare capital, FIM million 385.01) 330.0 330.0 330.0 330.0Market value, FIM million 2 310.0 1 653.3 1 092.3 1 386.0 2 277.0
No. of shares, adjusted, 1000'sTotal at the end of the year 38 5001) 34 700 34 700 34 700 34 700After conversion and subscription 40 920Average number of shares 34 710 34 700 34 700 34 7002) 34 700After conversion and subscription 36 262
Earnings per share, adjusted, FIM 2)
After financial items, taxation and thechange in deferred taxes 1.43 – 11.09 – 13.15 – 4.20 3.35
After conversion and subscription 1.65P/E ratio 42.0 neg neg neg 19.6
DividendTotal, FIM million 21.33) – – 36.3 1) 52.8Dividend per share, adjusted, FIM 0.603) – – 1.05 1) 1.60Yield, % 1.0 – – 2.6 2.3Dividend/profit, % 42.8 – – neg. 47.1
Share value (FIM per share) at year-endNominal value 10.00 10.00 10.00 10.00 10.00Value adjusted for issues
Equity excluding convertible subordinated bonds 42.74 46.12 58.11 68.95 77.70Equity after conversion and subscription 45.16Market price, Helsinki Stock Exchange
at the end of the period 60.00 47.65 31.48 39.94 65.62as an average during the period 65.80 39.01 35.63 70.11 106.24highest 81.79 48.50 58.96 86.45 133.14lowest 47.55 23.87 19.97 40.04 75.61
Shares traded 2)
Total, FIM million 414.8 236.6 76.5 87.5 132.6No. of shares, adjusted for issues, 1000's 6 304 6 066 2 146 1 248 1 248
Shares traded as % of total number of shares 18.2 17.5 6.2 3.6 3.6
NUMBER OF SHAREHOLDERS 12 060 11 958 13 744 13 700 13 625
1) Of which FIM 330.0 million (33.0 million shares) were registered at the end of the year2) March 1–Dec. 31, 1991; previous periods March 1–Feb. 283) Board's proposal
Definitions p. 35
5 1

sed.
F I V E - Y E A R R E V I E W
1994 1993 1992 1991* 1990/91FROM INCOME STATEMENT
Net sales FIM million 6 166.3 6 609.8 6 627.5 7 547.5 8 668.7change % – 6.7 – 0.3 – 12.2 – 12.9 + 12.6foreign sales % 81.5 74.5 73.5 62.8 58.4
Operating profit FIM million 231.5 4.1 – 132.4 14.5 356.2% of net sales % 3.8 0.1 – 2.0 0.2 4.1
Profit after financial items FIM million 41.1 – 407.3 – 559.0 – 237.3 148.6% of net sales % 0.7 – 6.2 – 8.4 – 3.3 1.7
Profit before appropriationsand tax FIM million – 202.6 – 433.9 – 567.6 – 212.3 170.3Net profit for the financial year FIM million – 193.9 – 392.5 – 442.7 -13.51) 3.4
FROM BALANCE SHEETFixed assets FIM million 4 018.1 3 998.7 5 027.9 4 506.2 4 545.8Inventories FIM million 795.4 915.6 1 129.3 1 175.9 1 339.0Financial assets FIM million 1 776.6 1 626.6 1 900.1 2 239.2 2 118.2Restricted equityincl. conv. sub. bonds FIM million 1 125.0 837.7 814.1 745.8 731.9Non-restricted equity FIM million 665.7 762.9 1 201.5 690.4 738.3
Minority interest FIM million 54.0 35.4 29.8 55.4 61.5Provisions FIM million 273.7 144.2 66.5 1 378.8 1 623.6
Long-term liabilities FIM million 1 745.6 2 383.0 3 120.2 2 418.3 2 056.6Short-term liabilities FIM million 2 726.0 2 377.8 2 825.2 2 632.6 2 791.0
Balance sheet total FIM million 6 590.1 6 540.9 8 057.3 7 921.3 8 003.1Capital employed FIM million 5 221.6 5 186.4 6 290.4 6 267.8 6 311.3
FROM STATEMENT OF SOURCE ANDAPPLICATIONS OF FUNDS 1)
Funds generated from operationsFIM million 207.7 – 102.7 – 223.0 9.9 308.5Change in working capital FIM million 58.3 – 14.6 397.2 83.1 – 213.2Net investment FIM million – 286.4 667.2 –461.0 202.1 931.6Loans less repayments FIM million – 303.5 – 772.0 554.6 241.7 776.9Change in liquid assets FIM million 76.6 – 89.1 2.4 153.3 – 105.3
PROFITABILITYReturn on capital employed % 6.1 0.2 –1.7 4.7 8.6Return on total capital % 4.3 0.2 –1.3 3.7 6.6Return on equity
after allowance for tax % 3.7 – 19.8 – 20.0 – 6.8 4.1after taxes paid % – 0.3 – 21.8 – 22.6 – 10.2 1.6
OTHER RATIOSInterest cover times 1.2 0.2 0.1 0.8 1.7Quick ratio times 0.68 0.71 0.86 0.89 0.80Current ratio times 1.09 1.07 1.20 1.30 1.24Equity to total assets % 28.0 25.0 25.4 31.8 34.3
Per employeeNet sales FIM 1 000 759 701 600 550 557Value added FIM 1 000 285 234 216 194 206Wages and salaries FIM 1 000 198 194 179 159 154Profit after financial items FIM 1 000 5 – 43 – 51 – 18 10Dividends FIM 1 000 3 – – 3 1) 4
Note: The figures for 1992–1994 are based on the new accounting standards; the previous years have not been revi*) Proforma Jan. 1–Dec. 31, Previous financial periods March 1–Feb. 281) March 1–Dec. 31, 1991
5 2

STOCK EXCHANGERELEASE SUMMARY 1994
-4e
e-
,o
eo
h
mh
ooren
hr
ee-
Ka o
noi-
y
et
o
o
-
e
i
e
s
e
e
e
rh
:a
e-c-he-e
y’st a
bes.
b
:eat7
d
em-e
yf alef
ts
a
is
.r
e-hee
fofooM
e
cey-c8.
March 2Report on Financial Result: Net sales fo1993 remained at approximately the samlevel as in 1992 and was 6,610 millionOperating profit increased by FIM 136 million, compared with 1992, and was FIM million. The result after financial items rosto FIM -407 million, compared to FIM -559million in 1992. Of the three business areaMinerals and Cargotec showed a profit aftfinancial items. Restructuring of the building materials industry continued in 1993Through their jointly owned companyPartek and Metra became owners of EurAB with a 25% shareholding.
April 5The Board of Directors proposes that thApril 21 annual general meeting of shareholders gives the Board authorization to dcide on the launch of convertible bonds bonds with warrants denominated in FIM oother currencies in one or more issues. Bason the authorization, the share capital of tCompany can be increased by a maximuamount of FIM 20 million. Approval wasgiven to the Board’s proposal to delete frothe Articles of Association, the section whiclimits a placed issue of shares to a nominvalue of FIM 20 million.
April 22The Board of Directors was authorized tdecide on the issue of convertible bonds bonds with warrants at the annual genemeeting on April 21. On the basis of thauthorization, the share capital can be icreased by a maximum of FIM 20 million.A decision was made at the meeting that tcompany would not distribute a dividend fo1993.
Partek decided to increase the numbermembers of the board of directors by onNils G. Grotenfelt asked to resign from thboard. C.O. Tallgren and Thor Björn Lundqvist retired by rotation and were re-electeto the board for the next three years. JoukoLeskinen and Jan Ekberg were elected new members. The proposal by the BoardDirectors (see Apr. 5) to amend the Articleof Association was approved in the firshearing.
April 25The Board of Directors decided on April 25based on the authorization given by the anual general meeting of shareholders April 21, to approve the launch of convertble subordinated bonds. The bonds will boffered for subscription to both the Company’s shareholders and the public, disappling shareholders’ pre-emptive right to subscription, from May 6 to May 13, 1994.
May 18The Norwegian group Aker a.s has acquir26.9% of Partek’s shares. The sellers are Rettig and Myllykoski groups. Aker, ÅboAkademi University Foundation, the Samp
re.
s,r
.
c
e--rredem
al
ral
-
e
of.
d.sf
st
,-n
e---
dhe
Group and Pension-Varma (joint ownershi52.1%) have made a shareholders’ agrement concerning the mutual right of preemption and representation on the Board Directors. A similar agreement has beemade between the Finnish partners. Thealso intend to recommend that the provisionrelating to the restriction of voting rights beremoved from Partek’s Articles of Association at a general meeting.
May 19The Board of Directors has today called foan extraordinary general meeting of sharholders on June 14. At the meeting they wipropose the launch of bonds with warrants the amount of FIM 1.5 million to be directedto the Partek Group management. The Boaof Directors proposes further that approvabe given in the second and final hearing tdelete from the Articles of Association, thesection limiting a placed issue of shares (sApril 5, and April 22).
June 15At the extraordinary general meeting oshareholders on June14, Tom Ruud, Predent & CEO of Aker a.s, Cato A. HolmsenPresident of Aker’s Cement and BuildingMaterials Division, and Paavo PitkänenManaging Director of Pension-Varma werelected to Partek’s Board of Directors. Fredrik Björnberg, Thor Björn Lundqvist andKauko Kaasila asked to resign from thBoard. At the second and final hearing, approval was given to the Board’s proposal tdelete from the Articles of Association, thesection limiting a placed issue of shares (sMay 19). The launch of bonds with warrantto the management was approved.
Approval was given at the first hearing tothe following amendments: that the company name be changed to Partek Oy Ab, thatbe possible to elect to the Board of Directoa person who is not a shareholder, that trestriction limiting voting rights to one fifthof the combined total of shares representeat a general meeting be deleted.
Christoffer Taxell, President &CEO statedat the meeting that the result for the first foumonths of the year is a loss of FIM 50 millionafter financial items. This is an improvemenof more than FIM 145 million compared withthe corresponding period for 1993.
The new Board of Directors decided to reelect C.O. Tallgren as chairman and SakaT. Lehto as vice-chairman. The Chairman othe Board stated that Partek continues operate in the business areas Minerals, Builing Products and Cargotec.
June 28Interim report January 1 - April 30, 1994The result after financial items showed clear improvement and was a loss of FIM 5million during the first four months of theyear. Net sales totalled FIM 1.9 billion. Theoperating profit is expected to have improvefurther at the year end.
5 3
pe--f
nys
r-
lln
rdlo
e
fi-
,
,
-
-o
es
- itse
d
r
t
-rif
tod-
0
d
August 31The extraordinary general meeting of sharholders on August 30 confirmed in the seond and final hearing the amendments to tArticles of Association, that the clause restricting voting rights at a general meeting bdeleted (see June 15), that the companname be changed to Partek Oy Ab and thaperson who is not a shareholder may elected to the company’s Board of Director
September 26Oy Partek Ab’s new name, Partek Oy Awill be officially registered as of Sept. 28.
October 24Interim report January 1 - August 31, 1994The result after financial items during thfirst eight months of the year showed a greimprovement and was a loss of FIM 2million. The profit for the second third of theyear was FIM 23 million. Net sales totalleFIM 3.9 billion. The operating profit is ex-pected to improve by the end of the year.
November 8The Board of Directors will propose to thannual general meeting to increase the copany’s share capital with a rights issue. Thaim is to raise FIM 250 million in newcapital. The Board will also ask for authoritto increase the share capital by means orights issue and/or by issuing convertibbonds or bonds with warrants to a total oFIM 38 million. Partek’s objective is to pro-vide the basis for taking advantage of ishare option in Partek Metra Oy Ab.
November 14Partek will acquire Metra’s 50% holding intheir jointly owned company, Partek MetrOy Ab which will become a fully-ownedPartek subsidiary. The transaction price FIM 430 million. In addition, Partek willtake from Metra responsibility for over FIM90 million worth of receivables from EurocTherefore, 25% of Euroc will come undePartek’s direct ownership.
November 21An extraordinary general meeting of sharholders decided on Nov. 21 to increase tcompany’s share capital with a rights issuby a minimum of 1 and a maximum o5 500 000 shares at a subscription price FIM 46. The Board of Directors was alsgiven authority for the period of one year tincrease share capital by a maximum of FI38 million. The rate of conversion for theconvertible subordinated bonds will bamended from November 30, 1994.
December 15On Dec. 14, Partek paid the redemption prifor Metra’s 50% share in Partek Metra OAb. Following this transaction, the total purchase value of Partek’s holding in Eurocorresponds to an average rate of SEK 10

5 4

e
te
,
,a,
BELGIUMHIAB-FOCO SA/NV ,Wauthier-BraineParoc Insulation NV,Wilrijk (Antwerpen)Partek Beton, ZaventemPartek Ergon NV, Lier
CANADAPartek Insulations Ltd.,Sarnia (Ontario)
DENMARKHIAB Export A/S; Humlebaek, LemNorba A/S, KarlstrupPartek Dainovo A/S, Espergaerde
ESTONIAE Betoonelement AS*;Harku, TamsaluAS Paroc Eesti, TallinnParmek AS*, Tallinn
FINLANDA-Rakennusmies Oy*, HelsinkiFocolift Oy Ab, PerniöLoglift Oy Ab, SaloMultilift Oy, RaisioNordkalk Oy Ab; Pargas,Lappeenranta, Tytyri, Louhi,Siikainen, Vampula, Vimpeli, SibboNummi Oy Ab; Perniö, PorvooParastek Oy Ab, HelsinkiParma Oy*, ForssaParoc Oy Ab; Lappeenranta, PargasOuluPartek Oy Ab, Head Office, PargasPartek Betonila Oy Ab*; Nummela,Hyrylä, Muijala, Hämeenlinna, TurkuKangasala, Ylöjärvi, Nastola, KurikkOuluPartek Concrete Development OyAb; Nummela, PargasPartek Concrete Engineering(PCE) Oy Ab, ToijalaPartek Industrial Minerals Ltd.;Lappeenranta, Virkkala, Kimito,Haapaluoma, NilsiäRoctex Oy Ab*, PargasTimmec Nosturit Oy Ab, Salo
FRANCEHIAB-FOCO S.A., Trappes-CedexPartek Morin S.A.; Boran-sur-Oise,Gilly-sur-Loire, Montereau
GERMANYHIAB-MULTILIFT GmbH,LangenhagenLoglift Jonsered GmbH,Offenburg-ZunsweierParoc Dämmstoffe GmbH; Weyhe,Bremen-BrinkumPartek Brespa GmbH, SchneverdingPartek Verbin Baufertigteile GmbH,DuisburgPCE Partek Concrete EngineeringGmbH, Nidda
JAPANHIAB Ltd., Yokohama
REPUBLIC OF KOREAHIAB Co. Ltd., Seoul
LATVIASIA Paroc Latvija, Riga
LITHUANIAParoc Lietuva, Vilnius
MALAYSIAEastern Partek (Malaysia)SDN BHD*, Kuala Lumpur
MEXICOHIAB-FOCO S.A. de C.V.*,Naucalpan de Juarez
NETHERLANDSHIAB BV, MeppelHIAB ACCESSORIES BV, MeppelLeeBur Containersystemen BV,BladelSchokbeton BV, ZwijndrechtSpanbeton BV,Koudekerk aan den RijnVBI Verenigde BouwproduktenIndustrie BV; Huissen, Oss,Oostermeer, Weert, Weurt, Drach
NORWAYHIAB-FOCO A/S, OsloSpenn-Gruppen; Hønefoss,Trondheim, Hjørungavåg, Verdal,Blomsterdalen, Sandnes
POLANDHIAB POLSKA Sp. Zo.o., Kobylka
5 5
n
n
RUSSIAA/O Extruder, MoscowA/O Mospart*, MoscowParastek Oy Ab, MoscowA/O Partek Beton, MoscowAO Partek Ecomax;Moscow, St. Petersburg
SINGAPOREEastern Partek Pte Ltd.*Partek Cargotec Pte Ltd.
SPAINHIAB-VALMAN S.A.;Torrejon de Ardoz (Madrid), Zaragoza
SWEDENEuroc AB*, MalmöHIAB AB; Hudiksvall, SödertäljeHIAB Forest AB, HudiksvallJungers Verkstads AB,Västra FrölundaNorba AB, BlomstermålaNordKalk Kalcium AB; Malmö,Köping, Hässleholm, Orsa,Uddagården (Falköping)NordKalk Storugns AB,Storugns (Lärbro)Partek Cargotec AB, StockholmPartek Sverige AB, StockholmPartek Insulation AB, SkövdeRockwool AB; Skövde, Hässleholm,HällekisTimtek Skogskranar AB, SödertäljeUnited Tiles AB*, Bromma
UNITED KINGDOMCargotec (UK) Ltd.; Shrewsbury,EllesmereEcomax Acoustics Ltd.,BuckinghamshireParoc Panel System UK Ltd.*,Merseyside
USACargotec Inc, Swanton (Ohio)Partek Insulations Inc.,Phenix City (Alabama)
* Associated company

A D D R E S S D I R E C T O R Y
le
n
1
THE PARTEK GROUP
Helsinki OfficeSörnäisten rantatie 23, P.O.Box 61FIN-00501 Helsinki, Finlandtel. +358-0-39441telex 124755 pksor fitelefax+358-0-3944 222
Executive BoardChristoffer Taxell, President & CEOCarl-Gustaf Bergström,Senior Executive Vice PresidentRaimo Taivalkoski,Senior Executive Vice PresidentPatrick Enckell,Senior Executive Vice PresidentKari Heinistö, Chief Financial Officer
Group AdministrationTimo Vuorio,Administration and PersonnelOlav Uppgård, Finance, TreasuryRaili Manninen,Corporate CommunicationsAntti Koivupalo, Risk ManagementAntti Puumala, Commercial RelationsSeppo Kupiainen,Real Estate AdministrationOle Rosquist, Corporate Secretary,Legal Affairs
Head OfficeFIN-21600 Pargas, Finlandtel. +358-21-74261telex 62220 pkpar fitelefax +358-21-742 6340
Christoffer Taxell, President & CEOCarl-Gustaf Bergström,Senior Executive Vice PresidentKari Heinistö, Chief Financial OfficerLauri Hakkala, Total Quality andProductivity ImprovementLars Ljung, Internal AuditingJorma Laine, Finance
Local Managers in FinlandLappeenranta,Eelis Eskelinen, tel. +358-53-67171Pargas,Robi Lindblad, tel. +358-21-74261
Partek Sverige ABVasagatan 8-10 B, 6 trBox 544, S-101 30 Stockholm, Swedetel. +46-8-677 5300telefax +46-8-100145Tomas Lilja, Finance
MINERALS
Nordkalk Oy AbChrister SundströmFIN-21600 Pargas, Finlandtel. +358-21-74261
alsoLundavägen 151S-212 24 Malmö, Swedentel. +46-40-438 930
Partek Industrial Minerals Ltd.Eelis EskelinenFIN-53500 Lappeenranta, Finlandtel. +358-53-67171
CARGOTEC
Partek Cargotec ABCarl-Gustaf Bergström*Bengt GergerVasagatan 8-10 B, 6trBox 586, S-101 31 Stockholmtel. +46-8-677 5300*also21600 Pargastel. +358-21-74261
HIAB GroupUlf ÅhmanS-824 83 Hudiksvall, Swedentel. +46-650-91000
Loglift Jonsered GroupOlof EleniusP.O. Box 54FIN-24101 Salo, Finlandtel. +358-24-524 0011
Load & Waste Handling SystemsFrej GranholmPartek Cargotec Oy21600 Pargastel. +358-21-74261
BUILDING PRODUCTS
InsulationPartek Insulation ABPeder BieseS-541 86 Skövde, Swedentel. +46-500-469000alsoSörnäisten rantatie 23, P.O.Box 6FIN-00501 Helsinki, Finlandtel. +358-0-39441
Precast Concrete NordicSpenn-GruppenBengt JanssonPostboks 38N-3501 Hønefoss, Norwaytel. +47-32 131 205
Partek Betonila Oy Ab**Bengt JanssonP.O.Box 76FIN-03101 Nummela, Finlandtel. +358-0-222001
5 6
A separate, more detailed address directory is availabin English, Finnish or Swedish from Partek CorporateCommunications at +358-0-394 4297.
Parma Oy**Hannu MartikainenMurrontieFIN-30420 Forssa, Finlandtel. +358-16-41271
Parastek Oy AbNikolai DanilotschkinSörnäisten rantatie 23, P.O.Box 61FIN-00501 Helsinki, Finlandtel. +358-0-39441
Precast Concrete InternationalPartek BetonRaimo TaivalkoskiHerman DegansHeerke KuiperImperiastraat 6B-1930 Zaventem, Belgiumtel. +32-2-7191911
Partek Ergon NVHerman DegansMarnixdreef 5,B-2500 Lier, Belgiumtel. +32-3-4900411
VBI Verenigde BouwproduktenIndustrie BVHeerke KuiperLooveerweg 1, P.O. Box 31NL-6850 Huissen, the Netherlandstel. +31-85-260911
Partek Brespa Spannbetonwerk GmbH& CO. KGHeikki HaikonenStockholmer Strasse 1D-29640 Schneverdingen, Germanytel. +49-5193-850
Partek Concrete Engineering(PCE) Oy AbLauri PalojärviP.O.Box 33FIN-37801 Toijala, Finlandtel. +358-37-54951alsoSörnäisten rantatie 23, P.O.Box 61FIN-00501 Helsinki, Finlandtel. +358-0-39441
Eastern Partek Pte Ltd.***Kauko Karvinen15 Sungei Kadut Street 2Singapore 2572tel. +65-3681366
** Associated company 50%.*** Associated company 45%