parthenon higher education seminar_july 16 2009_robert lytle
TRANSCRIPT

8/6/2019 Parthenon Higher Education Seminar_July 16 2009_Robert Lytle
http://slidepdf.com/reader/full/parthenon-higher-education-seminarjuly-16-2009robert-lytle 1/16
THE PARTHENON GROUPBoston • London • Mumbai • San Francisco
Global Best Practicesin Higher Education
Opportunities in India for Entrepreneurs,
Philanthropists and Investors

8/6/2019 Parthenon Higher Education Seminar_July 16 2009_Robert Lytle
http://slidepdf.com/reader/full/parthenon-higher-education-seminarjuly-16-2009robert-lytle 2/16
THE PARTHENON GROUP
2
Education Sector Experience:Global Coverage
= On The Ground Education Sector Projects Completed
Pre-Kindergarten
K-12Career and
ProfessionalUniversity
Vocationaland Other
8/6/2019 Parthenon Higher Education Seminar_July 16 2009_Robert Lytle
http://slidepdf.com/reader/full/parthenon-higher-education-seminarjuly-16-2009robert-lytle 3/16
THE PARTHENON GROUP
3
c-
Education Centre Of Excellence:Representative Clients

8/6/2019 Parthenon Higher Education Seminar_July 16 2009_Robert Lytle
http://slidepdf.com/reader/full/parthenon-higher-education-seminarjuly-16-2009robert-lytle 4/16
THE PARTHENON GROUP
4
Minsheng
University
CoveredIn IndiaProjects:
c-
Deep Understanding of EducationBusiness Development
Pre-Kindergarten
K-12Career and
ProfessionalUniversity
Vocationaland Other

8/6/2019 Parthenon Higher Education Seminar_July 16 2009_Robert Lytle
http://slidepdf.com/reader/full/parthenon-higher-education-seminarjuly-16-2009robert-lytle 5/16
THE PARTHENON GROUP
5
GDP And Higher Education Enrolment Ratio
0%
10%
20%
30%
40%
50%
$0 $2,000 $4,000 $6,000 $8,000 $10,000
PPP adjusted GDP per Capita
E n r o l l m e n
t R a t i o
2004
2000
1995
2005
2000
1996
2005
2000
1996
2005
2000
1996
2005
20001995
Higher education enrolment rises with GDP
Chile
China
Mexico
Brazil
Turkey
Higher Education Enrolment vs. Income

8/6/2019 Parthenon Higher Education Seminar_July 16 2009_Robert Lytle
http://slidepdf.com/reader/full/parthenon-higher-education-seminarjuly-16-2009robert-lytle 6/16
THE PARTHENON GROUP
6
0%
25%
50%
75%
100%
$0 $10,000 $20,000 $30,000 $40,000
Peru
PPP-adjusted GDP per Capita
E n r o l l m e n t R a t i o
Qatar
UAE
Nigeria
AlgeriaIran
Saudi Arabia
Venezuela
Colombia
Chile
Argentina
United Kingdom
Italy
GermanyFrance
Thailand
Republic of Korea
Philippines Malaysia
Japan
Indonesia
India China
United States
Mexico
Canada
Higher Education And National Income
Higher Education Enrollment Ratio vs. PPP Adjusted GDP Per Capita
R2 * = 61%
Economic strength and GDP per capita are closely linked to acountry’s enrollment ratio
Arab OPEC
Non-Arab OPEC
Other
8/6/2019 Parthenon Higher Education Seminar_July 16 2009_Robert Lytle
http://slidepdf.com/reader/full/parthenon-higher-education-seminarjuly-16-2009robert-lytle 7/16
THE PARTHENON GROUP
7
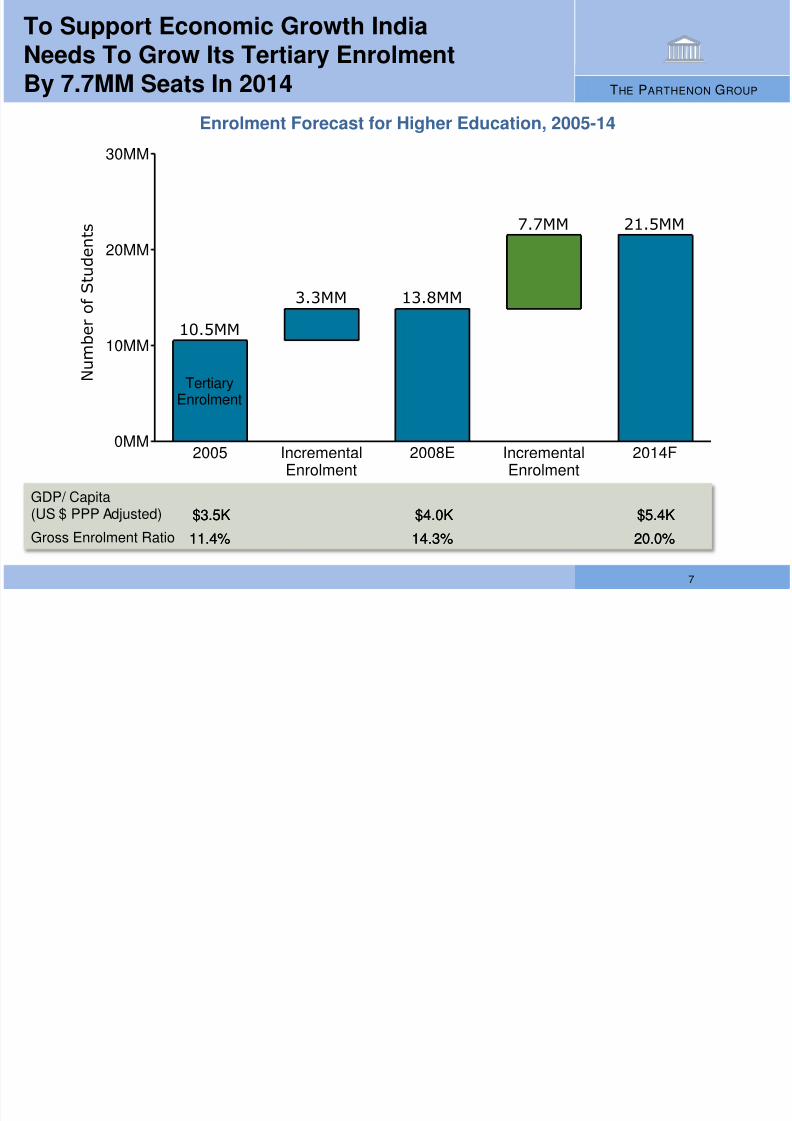
To Support Economic Growth IndiaNeeds To Grow Its Tertiary EnrolmentBy 7.7MM Seats In 2014
0MM
10MM
20MM
30MM
2005
TertiaryEnrolment
10.5MM
IncrementalEnrolment
3.3MM
2008E
13.8MM
IncrementalEnrolment
7.7MM
2014F
21.5MM
$3.5K $5.4K$4.0K
11.4% 20.0%14.3%
$3.5K $5.4K$4.0K
11.4% 20.0%14.3%
N u m
b e r o
f S t u
d e n
t s
Enrolment Forecast for Higher Education, 2005-14
GDP/ Capita(US $ PPP Adjusted)
Gross Enrolment Ratio

8/6/2019 Parthenon Higher Education Seminar_July 16 2009_Robert Lytle
http://slidepdf.com/reader/full/parthenon-higher-education-seminarjuly-16-2009robert-lytle 8/16
THE PARTHENON GROUP
8
India Higher Education: ~170K UnmetDemand For Engineering Seats In AndhraPradesh And Tamil Nadu In 2008
AndhraPradesh
236 K* 116 K 120 K563 K
Tamil Nadu 171 K 118 K 53 K448 K
Penetration 38%
Penetration 42% 2.0 Applicants/ Seat
1.5 Applicants/ Seat
Pass ClassXII
Appear forEngg. Exam
Secure Adm. inColleges
Current UnmetDemand
306 K
89 K
2013 Unmet
Demand

8/6/2019 Parthenon Higher Education Seminar_July 16 2009_Robert Lytle
http://slidepdf.com/reader/full/parthenon-higher-education-seminarjuly-16-2009robert-lytle 9/16
THE PARTHENON GROUP
9
0%
20%
40%
60%
80%
100%
EngineeringCollege (TN)
90%
Chain of IndianEngineering Colleges
70%
China UndergradLiberal Arts
50%
Chain of IndianMBA Colleges
42%
8K 10K 3K4KEnrolment
E B I T D A M a r g i n
s ( % )
India Higher Education: Higher EducationBusinesses Realize > 40% Margins
EBITDA Margins/ Surplus for Higher EducationInstitutions in India and China
EBITDA w/o Value Added Services
EBITDA w/ Value Added Services

8/6/2019 Parthenon Higher Education Seminar_July 16 2009_Robert Lytle
http://slidepdf.com/reader/full/parthenon-higher-education-seminarjuly-16-2009robert-lytle 10/16
THE PARTHENON GROUP
10
India Higher Education: Education LoansHave Grown At 27% Annually Since 2004
Total Amount Disbursed In Education Loans (2004-08)
Education Loans are thefastest growing segmentof SBI
HDFC has been in 9metros plans to reachout to tier II and tier III
cities via a hub andspoke model
0K
2K
4K
6K
2004-05
Rs3K Cr
2005-06
Rs3K Cr
2006-07
Rs4K Cr
2007-08
Rs6K Cr
211K 307K 361K 337K
A m o u n t I n R s
C r o r e s
2004-08
27%
CAGR
Number of
Accounts
8/6/2019 Parthenon Higher Education Seminar_July 16 2009_Robert Lytle
http://slidepdf.com/reader/full/parthenon-higher-education-seminarjuly-16-2009robert-lytle 11/16
THE PARTHENON GROUP
11
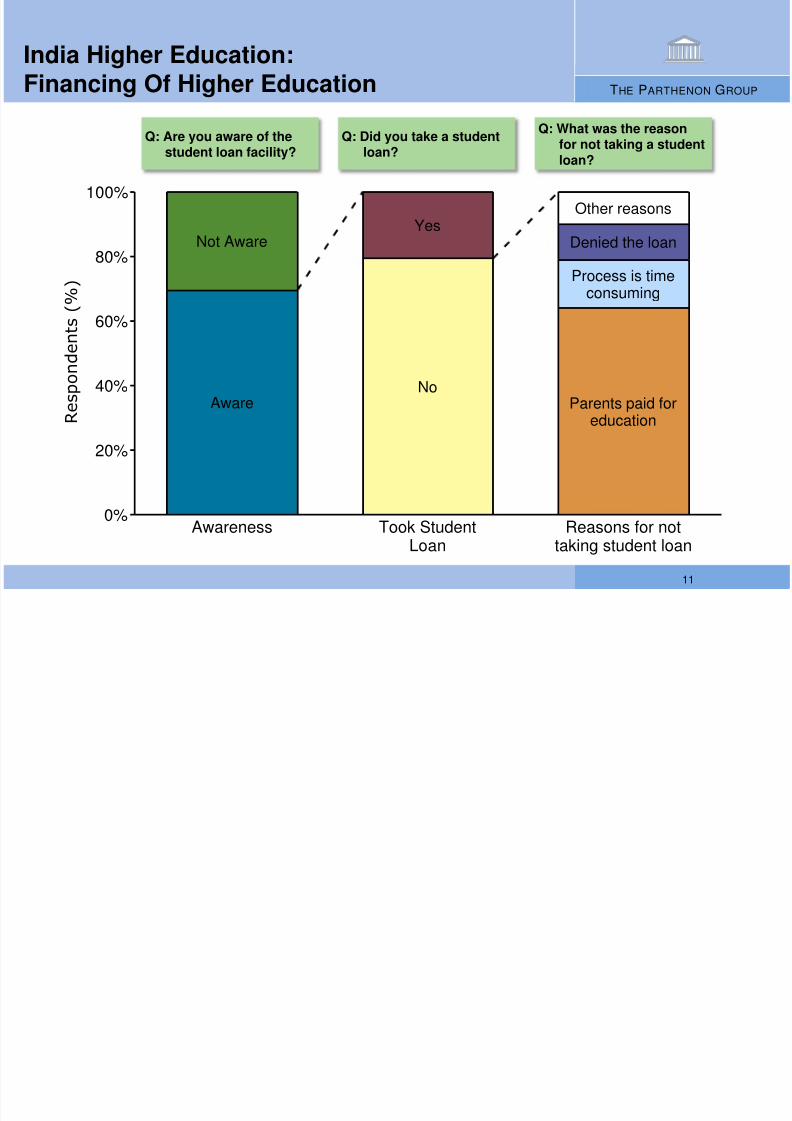
India Higher Education:Financing Of Higher Education
0%
20%
40%
60%
80%
100%
Awareness
Not Aware
Aware
Took Student
Loan
Yes
No
Reasons for not
taking student loan
Other reasons
Denied the loan
Process is timeconsuming
Parents paid foreducation R
e s p o n
d e n
t s ( % )
Q: Are you aware of thestudent loan facility?
Q: Did you take a studentloan?
Q: What was the reason
for not taking a studentloan?
8/6/2019 Parthenon Higher Education Seminar_July 16 2009_Robert Lytle
http://slidepdf.com/reader/full/parthenon-higher-education-seminarjuly-16-2009robert-lytle 12/16
THE PARTHENON GROUP
12
Rs0Lakh
Rs2Lakh
Rs4Lakh
Rs6Lakh
Rs8Lakh
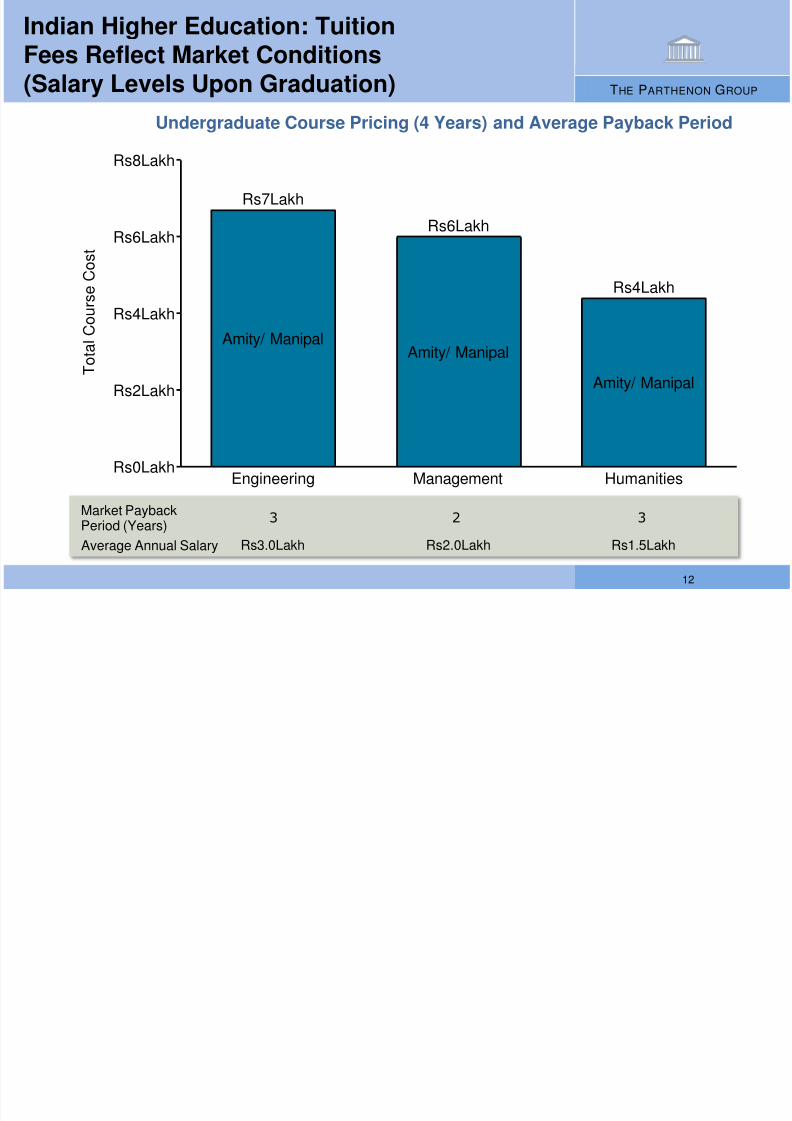
Engineering
Amity/ Manipal
Rs7Lakh
Management
Amity/ Manipal
Rs6Lakh
Humanities
Amity/ Manipal
Rs4Lakh
Rs2.0LakhRs3.0Lakh Rs1.5Lakh
T o t a l C o u r s e C
o s t
3 2 3Market PaybackPeriod (Years)
Average Annual Salary
Indian Higher Education: TuitionFees Reflect Market Conditions(Salary Levels Upon Graduation)
Undergraduate Course Pricing (4 Years) and Average Payback Period

8/6/2019 Parthenon Higher Education Seminar_July 16 2009_Robert Lytle
http://slidepdf.com/reader/full/parthenon-higher-education-seminarjuly-16-2009robert-lytle 13/16
THE PARTHENON GROUP
13
0MM
10MM
20MM
30MM
1993 2008
I n d i a
C h i n a
M M S
t u d e n t s E n r o l l e d
1998 1999 2000 2001 2002 2003 2004 2005 2006 2007
India & China Higher EducationEnrolment Growth
Number of Students Enrolled in Higher Education (Degree & Diploma)
CAGR 2000-2008
China: 21%
India: 7%
China’s growth is driven by private for -profit universities
India’s enrollment growth rate must increase dramatically to capitalize
on its demographic demand

8/6/2019 Parthenon Higher Education Seminar_July 16 2009_Robert Lytle
http://slidepdf.com/reader/full/parthenon-higher-education-seminarjuly-16-2009robert-lytle 14/16
THE PARTHENON GROUP
14
0
500
1,000
1,500
2,000
85-89
43
90-94
103
95-99
308
00-04
594
05-08
573
85-08
ASIA
EUROPE
USA
1,621
N u m
b e r o f T r a n s a c t i o n s
International Education Markets:Volume of M&A
International Education SectorM&A Activity, 1985 to 2008
8/6/2019 Parthenon Higher Education Seminar_July 16 2009_Robert Lytle
http://slidepdf.com/reader/full/parthenon-higher-education-seminarjuly-16-2009robert-lytle 15/16
THE PARTHENON GROUP
15
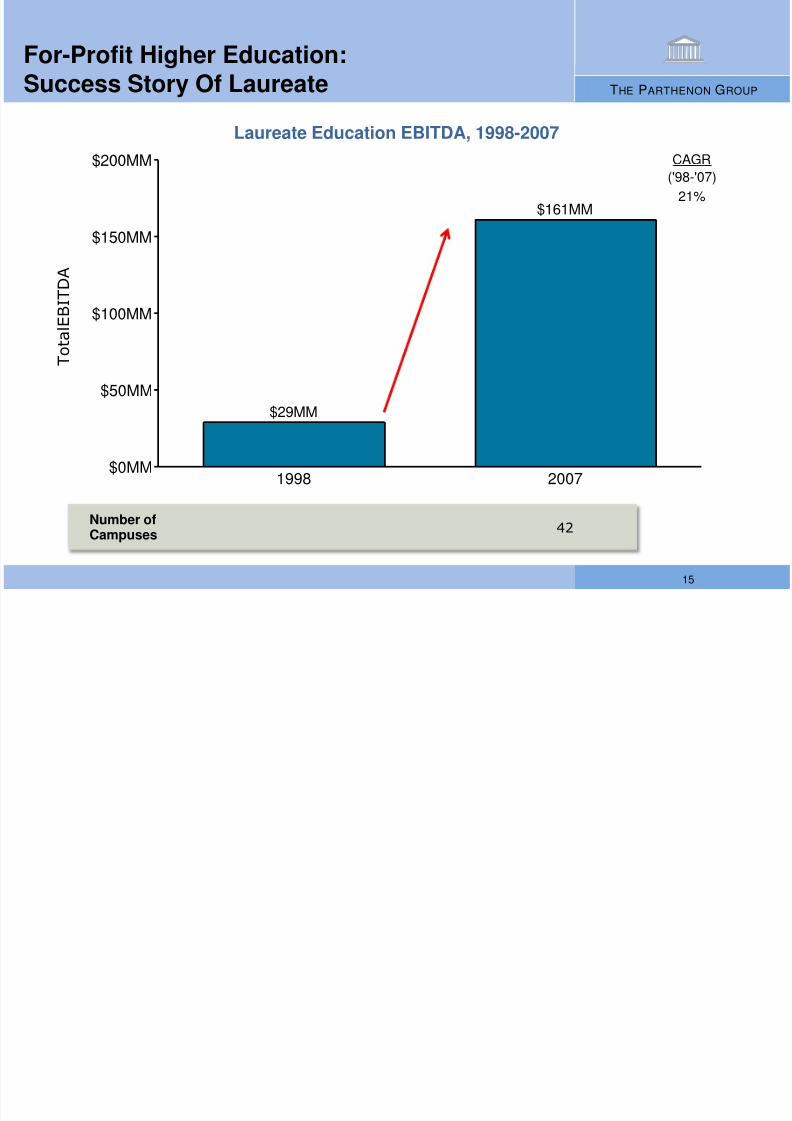
For-Profit Higher Education:Success Story Of Laureate
$0MM
$50MM
$100MM
$150MM
$200MM
1998
$29MM
2007
$161MM
T o
t a l E B I T D A
21%
('98-'07)
CAGR
42Number ofCampuses
Laureate Education EBITDA, 1998-2007

8/6/2019 Parthenon Higher Education Seminar_July 16 2009_Robert Lytle
http://slidepdf.com/reader/full/parthenon-higher-education-seminarjuly-16-2009robert-lytle 16/16
THE PARTHENON GROUP
16
How does one invest in a trust?
How does one realize investment?
What is the trade-off between short-term value creationand long-term quality?
Key Questions