participatory assessment and analysis of livestock markets, off - tufts
TRANSCRIPT

PARTICIPATORY ASSESSMENT AND ANALYSIS OF
LIVESTOCK MARKETS, OFF TAKE AND MARKETING
CONSTRAINTS IN LOIMA DIVISION, TURKANA DISTRICT,
KENYA.
By
RAPHAEL LOTIRA ARASIO (BVM, Nairobi)
A thesis submitted in partial fulfilment of requirements
for the degree of Master of Science in Veterinary Epidemiology and Economics
Department of Public Health, Pharmacology and Toxicology
Faculty of Veterinary Medicine
University of Nairobi
2003

ii
DECLARATION
This thesis is my original work and has not been presented for a degree in any other
university
Signature ________________________________ Date ________________
Dr. Raphael Lotira Arasio (BVM)
This thesis has been submitted for examination with our approval as University
Supervisors.
Signature ________________________________ Date ________________
Prof. J. M. Gathuma (BVSc., MSc., PhD)
Signature ________________________________ Date ________________
Dr. P. M. Kitala (BVM., MSc., PhD)
Signature ________________________________ Date ________________
Dr. G. K. Gitau (BVM., MSc., PhD)

iii
DEDICATION
In memory of my beloved mother,
Martha Benedette Awoi Naleng’o
and my uncle, John Paul Losur Eleman Naleng’o.

iv
TABLE OF CONTENTS
DECLARATION ................................................................................................................ ii
DEDICATION................................................................................................................... iii
TABLE OF CONTENTS................................................................................................... iv
LIST OF TABLES........................................................................................................... viii
LIST OF FIGURES ........................................................................................................... ix
LIST OF PLATES ............................................................................................................ xii
LIST OF APPENDICES.................................................................................................. xiii
ACKNOWLEDGEMENTS.............................................................................................. xv
ABSTRACT.................................................................................................................... xvii
1.0 INTRODUCTION ........................................................................................................ 1
1.1 SPECIFIC OBJECTIVES OF THE STUDY:........................................................... 5
2.0 LITERATURE REVIEW ............................................................................................. 6
2.1 BACKGROUND INFORMATION ......................................................................... 6 2.1.1 Contribution of livestock sector to Kenya’s economy....................................... 6 2.1.2 Livestock resources, populations and off-take in Kenya. .................................. 6 2.1.3 Livestock populations and off-take in Turkana District .................................... 7 2.1.4 Policy developments in livestock marketing industry in Kenya........................ 8
2.2 COMMON LIVESTOCK MARKETING SYSTEMS IN PASTORAL AREAS OF KENYA........................................................................................................................... 9
2.2.1 Traditional non-market circulation of livestock and livestock products ........... 9 2.2.2 Auctions ........................................................................................................... 10 2.2.3 Person to person negotiation............................................................................ 12
2.3 HISTORICAL DEVELOPMENT OF COMMERCIAL LIVESTOCK TRADE IN TURKANA................................................................................................................... 13
2.3.1 Colonial period up to early 1970s.................................................................... 13 2.3.2 Late 1970s to Early 1990s................................................................................ 14

v
2.3.3 Early 1990s to date........................................................................................... 16 2.4 TERMS OF EXCHANGE IN TRADING TRANSACTIONS IN PASTORAL AREAS OF KENYA .................................................................................................... 17 2.5 MARKETING OF LIVESTOCK AND LIVESTOCK PRODUCTS IN THE PASTORAL AREAS OF KENYA............................................................................... 19
2.5.1 Live animals..................................................................................................... 19
2.5.1.1 Livestock species, age and sex structure preference for sale ................... 19 2.5.1.2 Domestic and export markets for live animals from pastoral areas of Kenya. ................................................................................................................... 20
2.5.2 Trade in livestock products.............................................................................. 21
2.5.2.1 Milk ........................................................................................................... 21 2.5.2.2 Hides and skins. ........................................................................................ 21
2.6 COMMON CONSTRAINTS ASSOCIATED WITH LIVESTOCK TRADE IN PASTORAL AREAS.................................................................................................... 22
2.6.1 Poor Marketing infrastructure.......................................................................... 23 2.6.2 High Transportation costs ................................................................................ 24 2.6.3 Drought ............................................................................................................ 24 2.6.4 Lack of markets and marketing information.................................................... 25 2.6.5 Livestock diseases............................................................................................ 26 2.6.6 Variation in the volume of sales ...................................................................... 29
2.6.6.1 Variation due to season ............................................................................ 29 2.6.6.2 Variation due to the level of home consumption....................................... 30
2.7 CONCLUSION....................................................................................................... 32
3.0 MATERIALS AND METHODS................................................................................ 33
3.1 DESCRIPTION OF STUDY AREA ...................................................................... 33 3.2 SELECTION OF STUDY AREA, SITES AND SAMPLING UNITS.................. 36 3.3 DATA COLLECTION ........................................................................................... 36
3.3.1 Phase one: Sensitization workshop.................................................................. 37 3.3.2 Phase two: Participatory mapping ................................................................... 38 3.3.3 Phase three: Matrix scoring ............................................................................. 40

vi
3.3.3.1 Herders’ preference for different types of livestock traders and livestock marketing systems ................................................................................................. 40 3.3.3.2 Seasonal calendar ..................................................................................... 41
3.3.4 Wealth ranking and Proportional piling........................................................... 43 3.3.5 Phase Five: Simple ranking and semi-structured interviews ........................... 44 3.3.6 Phase six: Stakeholders workshop................................................................... 45
3.3 DATA HANDLING AND ANALYSIS................................................................. 46
3.3.1 Participatory mapping data .............................................................................. 46 3.3.2 Matrix scoring and seasonal calendars data..................................................... 47 3.3.3. Proportional piling data................................................................................... 47 3.3.4 Semi-structured interviews data....................................................................... 47 3.3.5. Simple ranking data ........................................................................................ 48
4.0 RESULTS ................................................................................................................... 49
4.1 HERDERS PERCEPTIONS OF LOCAL MARKETS .......................................... 49 4.1.1 Mapping potential livestock markets based on seasonal movements of pastoralists................................................................................................................. 49 4.1.2 Herders’ criteria for classification and preference for different types of livestock traders. ....................................................................................................... 50
4.1.2.1 Classification and preference based on tribe of a trader ......................... 50 4.1.2.2 Classification and preference based on how and where traders operate (marketing system of operation) ........................................................................... 54
4.1.3 Preference for different types of Livestock marketing systems....................... 57 4.2 HERDERS’ PERCEPTIONS OF CASH INCOME SOURCES WITH SPECIAL REFERENCE TO LIVESTOCK MARKETING AS SOURCE OF CASH ................ 60
4.2.1 Sources of cash income with special reference to livestock ............................ 60 4.2.2 Cash proportions of different sources of income: Comparing adakars. .......... 63 4.2.3 Cash proportions of different sources of income: Gender groups’ comparison.................................................................................................................................... 65 4.2.4 Cash proportions of different sources of income: Wealth groups’ comparison.................................................................................................................................... 66
4.3 LIVESTOCK OFF-TAKES.................................................................................... 68
4.3.1 Existing off take with regard to species, age and sex of animals sold............. 68 4.3.2 Preference for selling different types of stock (species and their age sex categories). ................................................................................................................ 72
4.3.2.1 Goats ......................................................................................................... 72

vii
4.3.2.2. Donkeys.................................................................................................... 73 4.3.2.3 Cattle......................................................................................................... 73 4.3.2.4 Camels....................................................................................................... 74
4.3.3 Existing off take with regard to proportional measure of herds ...................... 75 4.3.4 Existing off-take with regard to seasonality of sales ....................................... 78
4.3.4.1 Seasonal variation in donkeys’ age-sex categories’ off takes .................. 78 4.3.4.2 Seasonal variation in goats’ age-sex categories’ off takes....................... 80 4.3.4.3 Seasonal variation in cattle age-sex categories’ off takes........................ 82 4.3.4.4 Seasonal variation in camels’ age-sex categories’ off takes .................... 84
4.4 LIVESTOCK MARKETING CONSTRAINTS..................................................... 86
4.4.1 Livestock marketing constraints as perceived by herders, traders and government livestock workers .................................................................................. 86
4.5 HERDERS’ PREDICTION OF OFF-TAKE LEVELS IF MARKETING WAS IMPROVED.................................................................................................................. 88
4.5.1. General trend in off-take levels if marketing was improved. ......................... 88
5.0 DISCUSSION............................................................................................................. 90
6.0 CONCLUSIONS AND RECOMMENDATIONS ................................................... 111
6.1 CONCLUSIONS................................................................................................... 111 6.2 RECOMMENDATIONS...................................................................................... 112
7.0 REFERENCES: ........................................................................................................ 114
8.0 APPENDICES .......................................................................................................... 127

viii
LIST OF TABLES
Table 1: Mean annual cash proportion (%) of important sources of income in four
adakars of Loima division, Turkana District (2002-2003)………………………………62
Table 2: Mean annual proportion (%) of goats, cattle, camels and donkeys sold in relation
to those in the original herd and not sold, in four adakars of Loima Division, Turkana
District, 2002/2003 (expressed as proportion of total livestock population units)………76
Table 3: Median ranks (range) of four most important livestock marketing constraints as
perceived by herders, traders and government livestock workers in Loima Division,
Turkana District (2002/2003)……………………………………………………………87
Table 4: Mean annual proportion (%) of livestock type in the herd, proportion sold before
marketing improves, proportion sold after marketing improves and proportional change
in sales, expressed as a proportion of total livestock population units, in four adakars of
Loima division, 2002/2003………………………………………………………………89
Table 5: Mean annual proportion (%) of livestock types sold before marketing improves,
proportion sold after marketing improves and proportional change in sales, expressed as a
proportion of population of particular livestock species, in four adakars of Loima
division, 2002/2003……………………………………………………………………...89

ix
LIST OF FIGURES
Figure 1: Map of Turkana District showing Loima Division (study area)………………34
Figure 2: Map showing the location of the four adakars (Natuba, Kicono, Acemie and
Aporon) studied in Loima Division, May/June, 2003……………………………………38
Figure 3: Mean ranks and significance values for tribal classification and preference of
traders in four adakars of Loima Division, Turkana District, 2002/2003……………….54
Figure 4: Summarized matrix scoring of livestock trader-qualities in four adakars of
Loima Division, Turkana District (May/July 2003)……………………………………..56
Figure 5: Summarized matrix scoring of marketing systems-qualities in four adakars of
Loima Division, Turkana District (May/July 2003)……………………………………..59
Figure 6: Mean annual cash proportion per adakar of livestock as a source of cash in four
adakars of Loima Division, Turkana District (2002/2003)……………………………...62
Figure 7: Mean annual cash proportion (%) of important sources of income in four
adakars of Loima division, Turkana District (2002-2003)………………………………63
Figure 8: Mean annual cash proportion (%) per adakar unit of important sources of
income in four adakars of Loima division, Turkana District (2002-2003)……………...65
Figure 9: Mean annual cash proportion (%) per gender group of important sources of
income in four adakars of Loima division, Turkana District (2002-2003)……………...66
Figure 10: Mean annual cash proportion (%) per wealth group of important sources of
income in four adakars of Loima division, Turkana District (2002-2003)……………...67

x
Figure 11: Mean annual proportion (%) of age-sex categories of goats sold in four
adakars of Loima Division, Turkana District, 2002/2003 (expressed as proportion of total
livestock population units)……………………………………………………………….69
Figure 12: Mean annual proportion (%) of age-sex categories of cattle sold in four
adakars of Loima Division, Turkana District, 2002/2003 (expressed as proportion of total
livestock population units)……………………………………………………………….70
Figure 13: Mean annual proportion (%) of age-sex categories of camels sold in four
adakars of Loima Division, Turkana District, 2002/2003 (expressed as proportion of total
livestock population units)……………………………………………………………….70
Figure 14: Mean annual proportion (%) of age-sex categories of donkeys sold in four
adakars of Loima Division, Turkana District, 2002/2003 (expressed as proportion of total
livestock population units)……………………………………………………………….71
Figure 15: Mean annual proportion (%) of goats, cattle, camels and donkeys in a herd,
expressed as proportion of total livestock population units in four adakars of Loima
Division, Turkana District, 2002/2003…………………………………………………..76
Figure 16: Mean annual proportional measure (%) of goats, cattle, camels and donkeys
expressed as proportion of total population of animals per adakar group, in four adakars
of Loima Division, Turkana District, 2002/2003………………………………………...77
Figure 17: Mean annual proportional measure (%) of goats, cattle, camels and donkeys
expressed as proportion of total livestock population units per gender group, in four
adakars of Loima Division, Turkana District, 2002/2003……………………………….77

xi
Figure 18: Mean annual proportional measure (%) of goats, cattle, camels and donkeys
expressed as proportion of total livestock population units per wealth group, in four
adakars of Loima Division, Turkana District, 2002/2003……………………………….78
Figure 19: Summarized seasonal calendar for donkeys age-sex categories’ off-take in
four adakars of Loima Division, Turkana District (2002/2003)………………………...79
Figure 20: Summarized seasonal calendar for goats age-sex categories’ off-take in four
adakars of Loima Division, Turkana District (2002/2003)……………………………...82
Figure 21: Summarized seasonal calendar for cattle age-sex categories’ off-take in four
adakars of Loima Division, Turkana District (2002/2003)……………………………...84
Figure 22 Summarized seasonal calendar for camels’ age-sex categories’ off-take in four
adakars of Loima Division, Turkana District (2002/2003)……………………………...85

xii
LIST OF PLATES
Plate 1: Elders of adakar Aporon carrying out a matrix scoring exercise, May/June,
2003………………………………………………………………………………………45
Plate 2: Enumerator, Mark Adiaka, confirming from the informant the outcome of a
proportional piling exercise, May/June 2003…………………………………………….46
Plate 3: An elder, Longole Lotwel, expressing a point in a stakeholders’ workshop, July
2003………………………………………………………………………………………46

xiii
LIST OF APPENDICES
Appendix 1: Significance levels between adakar, gender and wealth groups, of sources of
cash income in four adakars of Loima Division, Turkana District, 2002/2003………..125
Appendix 2: Mean annual cash proportion (%) of sources of cash income in four adakars
of Loima Division, Turkana District, 2002/2003………………………………………126
Appendix 3: Grand mean annual proportion (%) of age-sex categories of goats, cattle,
camels and donkeys sold in four adakars of Loima Division, Turkana District, 2002/2003
(expressed as proportion of total livestock population units)…………………………..127
Appendix 4: Significance levels of age-sex categories of goats, cattle, camels and
donkeys sold in four adakars of Loima Division, Turkana District, 2002/2003……….128
Appendix 5: Mean annual proportion (%) of age-sex categories of goats, cattle, camels
and donkeys sold in four adakars of Loima Division, Turkana District, 2002/2003
(expressed as proportion of total livestock population units)…………………………..129
Appendix 6: significance levels of goats, cattle, camels and donkeys sold in relation to
those in the original herd and not sold, in four adakar of Loima Division, Turkana
District, 2002/2003……………………………………………………………………..130
Appendix 7: Mean annual proportion (%) of goats, cattle, camels and donkeys sold in
relation to those in the original herd and not sold, in four adakars of Loima Division,
Turkana District, 2002/2003 (expressed as proportion of total livestock population
units)……………………………………………………………………………………131
xiv
Appendix 8: Median ranks (range) of livestock marketing constraints affecting herders
and traders as perceived by government livestock workers, Loima Division, Turkana
District (2002/2003)…………………………………………………………………….132
Appendix 9: Median ranks (range) of livestock marketing constraints as perceived by
herders and traders themselves, Loima Division, Turkana District (2002/2003)………133
Appendix 10: Significance levels for proportion of livestock types sold before marketing
improves, proportion after marketing improves and proportional change in sales, in four
adakar of Loima Division, Turkana District, 2002/2003………………………………134
Appendix 11: Off-take prediction per adakar, gender and wealth groups expressed as a
proportion of total livestock population units in four species of livestock sold by
pastoralists of Loima Division, Turkana District, 2002/2003…………………………..135
Appendix 12: Off-take prediction per adakar, gender and wealth groups expressed as a
proportion of particular livestock species population in four species of livestock sold by
pastoralists of Loima Division, Turkana District, 2002/2003…………………………..136

xv
ACKNOWLEDGEMENTS
I sincerely thank my supervisors, Prof. J.M. Gathuma, Drs P. M. Kitala and G. K. Gitau
for their guidance and encouragement from the development of the project proposal,
through fieldwork and eventual preparation of this thesis.
I am greatly indebted to Community-based Animal Health and Participatory
Epidemiology (CAPE) Unit of African Union/ Inter-African Bureau for Animal
Resources (AU/IBAR) for the financial support they extended to my project through
which this study was possible. Sincere thanks go to DAAD, who in collaboration with the
University of Nairobi, provided me with a scholarship. A lot of thanks to Turkana
Livestock Development Project (TLDP) of Veterinaries Sans Frontieres-Belgium (VSF-
B) for giving office space in Lodwar and providing logistical support. Special
appreciation is extended to Andy Catley for his tireless advice and assistance in designing
the methodology of this study and further assisting in organization, analysis and
interpretation of data.
I wish to thank the Turkana pastoralists (both producers and traders) for their invaluable
participation without which this project would have been incomplete. Indeed, honourable
thanks go to Dr. Eregae for his remarkable comments to this project from proposal
preparation to field level, and additionally, for offering his computer, which made typing
of this work easier and faster. My thanks are due to P. Natapar and M. Ameripus who
tirelessly assisted in data collection. My inexpressible thanks go to my brother, V.

xvi
Naleng’o, for keeping the family healthy in my absence. A lot of thanks to my friends F.
Mariao and S. Ekitela for their encouragement when all seemed impossible. Finally and
not least, my special thanks are extended to a special friend Nina and her son Leon and
my relatives for their patience, understanding, prayers and coping with problems that my
study period may have imposed upon them.

xvii
ABSTRACT
A participatory study was conducted in Loima Division of Turkana District to assess and
analyze livestock markets, off-take and marketing constraints. It was aimed at generating
information that could be used in redesigning or modifying plans for viable livestock
marketing interventions in the division.
Four livestock camps (adakars) including adakar Natuba, Kicono, Acemie and Aporon
were conveniently selected based on accessibility, security and logistics. Selection of
study area was influenced by the existence of livestock marketing project that was under
Veterinaries Sans Frontieres- Belgium (VSF-B). 72 individual informants stratified on
gender and wealth, and 16 informant groups of 8-15 people each were selected from the
livestock camps. Participatory Appraisal (PA) methods used in data collection included
Seasonal migration maps, matrix scoring, proportional piling, simple ranking, seasonal
calendars, semi-structured interviews and workshops.
From the study, potential livestock markets in the division were defined. The herders
classified traders based on tribe and marketing system of operation of which the latter
criterion clearly distinguished traders’ preference than the former. Traders were preferred
based on their pricing of livestock, consistency in buying livestock, trustworthiness, cash
handling and friendly negotiations. The auction system and organized marketing system
with market days (based on person-to-person negotiation) were highly preferred and also

xviii
were the traders operating in those systems. Preference of a marketing system was based
on livestock prices offered, cash availability, attraction of buyers and sellers and its
regularity.
The major sources of cash reported were livestock, borrowing and sale of livestock
products in a decreasing order. Commonly sold species of livestock were goats, cattle,
camels and donkeys of which goats emerged the primary source of cash. Within the
livestock holdings, goats had the largest proportion, followed by camels and cattle, with
donkeys being the least. The proportion of goats in the herd (and hence sales) was higher
among the poor whereas the proportion of large stock (and hence sales) was higher
among the rich and medium class. Preference for selling different types of stock was
based on availability of buyers/market, season, availability in the herd, magnitude of
family problem, wealth status and need for cash.
Most preferred age-sex categories sold of goats, cattle and camels were mature male
castrates except for donkeys where breeding males and females were being sold. Mature
male castrates of goats, cattle, camels and donkeys were mostly sold during the dry
season whereas young animals of these species were sold throughout the year. Breeding
males and females of donkeys were mostly sold during the dry season.
Whereas producers gave high priority to low prices of livestock and traders perceived
low working capital as major problems affecting them in livestock marketing,

xix
government livestock workers prioritized poor marketing infrastructure and lack of
marketing information as major problems that need to be addressed. When marketing
improves, herders were willing to sell more livestock. The proportion of goats to be sold
was higher than of other livestock types though the proportional change in sales
(difference between sales before and after marketing improves) was negative. Despite
low proportion of sales in future, camels, cattle and donkeys displayed positive
proportional change in sales as compared to goats.
Based on the results of this study, it can be concluded that livestock marketing is an
important recipe to the livelihoods of Turkana pastoralists and are ready to sell their
livestock if a market with less barriers to entry exist. They should therefore be involved
in gathering and analyzing information that is used in planning and designing best-bet
interventions to livestock marketing. A further study is recommended to look at the root
causes of livestock marketing constraints, their effects and perceptive and economic
analysis of various options of intervention.

1
1.0 INTRODUCTION
Turkana District is one of the arid and semi-arid districts of Kenya, situated in the
northern part of the Rift Valley Province. It covers an area of approximately 77,000 Km2
with 75% of its total area classified as arid or semi-arid (Republic of Kenya, 2002). It is
inhabited by the Turkana pastoralists, who, according to the 1999 census, were estimated
at 450,860 people in 73,645 households (Central Bureau of Statistics, 2001).
Livestock is the main resource in the district and it forms the economic base of the
Turkana community, as it is more reliable than crop production. During drought, for
instance, animals die and crops fail, but some animals may survive to build up the herd
again, this being a kind of insurance against unpredictable misfortunes in the harsh
environment (Chabari, 1994). It is the centerpiece of the daily and ceremonial life and is
the principle currency for social and commercial transactions (McDermott et al., 1999).
The development of irrigation agriculture has so far contributed very little to stabilization
of food security in the district and it remains doubtful whether it ever will (Chabari,
1994). Rain-fed agriculture has not been given adequate attention yet, but its scope will
be limited anyhow (Airey et al., 1981). Relief food instituted during periods of severe
droughts is only but expanding the handouts dependency level among the Turkana
pastoralists (AGSEC, 2000).

2
Strengthening the need and the capacity of Turkana pastoralists to access and utilize this
livestock resource sustainably is essential (AGSEC, 2000). In various community
dialogue meetings among the turkana, livestock marketing has featured prominently as a
felt need of the livestock keepers (OAU/IBAR, 1999; OAU/IBAR, 2001). Besides,
livestock market development is believed and seen to be key to the success of other
development programs in this area (Aklilu et al., 2002). Livestock marketing is therefore
considered a wider food production system and economic activity in the district (Njenga,
2000). Improved livestock marketing would therefore be expected to improve pastoral
households incomes and thus their food security status.
There are common myths that pastoralists accumulate livestock in an irrational way, and
at the same time are resistant to new ideas of development. This is a tendency to refer to
pastoralists as if they have remained the same for hundreds of years, without recognizing
the fact that they have also changed socially as a result of external influence. In the recent
past, it has been realized that pastoralists (producers and livestock traders) are willing to
sell their stock if an advantageous market and marketing system exists which they can
easily access and be involved in (Njiru, 1982; Gathuma et al., 1989; Gufwoli and
Behnke, 1990, AGSEC, 2000). However, livestock marketing constraints and recurring
droughts are adversely impacting the wishes of both livestock traders and producers.
(Aklilu et al., 2002). Commonly mentioned constraints to livestock marketing include:
lack of markets for livestock and livestock products; lack of information on markets and
marketing; livestock diseases and lack of assured animal health services in such pastoral

3
areas (Gathuma et al., 1989; Gufwoli and Behnke, 1990; ALRMP, 2001; Aklilu et al.,
2002).
The Government of Kenya, in collaboration with other development agencies (NGOs),
have been attempting to develop livestock marketing strategies in the district, but their
efforts have remained an illusive goal (Njenga, 2000). Past reviews and studies suggest
conflicting opinions probably signifying the complexity of livestock development in a
pastoral district like Turkana. In common with other pastoral areas in Africa, billions of
dollars have been spent on pastoral livestock schemes but impact is cloudily seen and
hardly sustained. Several reasons and suggestions have been associated with this.
There seems to be lack of good ideas on the kind of interventions required to tackle the
main problems of fluctuating productivity and food security in such pastoral set-up
(Helland, 1987). Many research projects and livestock development interventions are
examining “suitable” conventional technologies for pastoral development ignoring
pastoralists’ traditional knowledge of survival in their own environment (Jahnke, 1982;
Aronson 1984; Akabwai, 2001; Orre, 2003). Moreover, these areas have been lowly
prioritized by livestock experts and policy markers. The Sessional Paper No. 4 of 1981 on
food policy recommended establishment of large-scale ranches in the rangelands and
expansion of feedlots in order to increase off-take (Republic of Kenya, 1999) but
implementation failed perhaps due to inappropriateness of policy (Orre, 2003).

4
Development efforts in Turkana have traditionally been aimed at providing destitutes
with alternatives to pastoralism, particularly so through efforts in fisheries, irrigation and
handcraft, ignoring the importance of the livestock resource (McCabe, 1984; Mbogoh et
al., 1989). Livestock development problems could be unique to a location or a division
based on its cultural, economic, social and physical differences and, district-wide studies
and development interventions could be low yielding (Jahnke, 1982). Although some
workers have advocated for greater local say (involving local people) in livestock
research and development, accounts of local perceptions on livestock marketing
opportunities and constraints in the District are lacking, particularly comparatively
analysis of opinions of all stakeholders in Livestock marketing.
The approach of past research and livestock development interventions is questionable
especially when it comes to considering local peoples’ priorities, preferences and
strategies. There is limited published information describing how opportunities and
constraints of livestock marketing are analyzed at community level or how decisions are
made concerning the most appropriate interventions. Subsequently, it has been realized
that, mostly in pastoral areas, acquiring information through quantitative methods of
investigation is difficult owing to financial and other research related constraints; and in
most cases data or information collected doesn’t lend itself to field analysis for
immediate action and making timely informed decisions.
5
This study aimed at generating information that can be used in redesigning or modifying
plans for viable livestock marketing interventions in Loima Division of Turkana District.
Additionally, can provide information on current status of livestock off-take in the
division and how trends could change if marketing was improved. Attention was focused
on producers’ and traders’ knowledge, abilities, attitudes, beliefs and behavioral patterns.
This will assist the pastoral community in the division, or otherwise the whole District, to
transcend from an isolated, subsistence-oriented economy to a market oriented one,
which can be integrated in to the national economy.
1.1 SPECIFIC OBJECTIVES OF THE STUDY:
1. To assess herders’ perceptions on local markets with regard to:
a) Mapping potential livestock markets in relation to seasonal movements;
b) Criteria for classification and preference for different types of livestock traders;
c) Preference for different types of marketing systems;
2. To assess herders’ perceptions of cash income sources with special reference to
marketing of livestock;
3. To assess existing off-take with regard to:
a) Species, age and sex of animals sold;
b) Preferences for selling different types of stock;
c) Proportional measure of herds;
d) Seasonality of sales;
4. To assess herders’ perceptions of marketing constraints and compare these perceptions
to those of livestock traders and government livestock workers;
5. To assess herders’ predictions of off-take levels if marketing was improved taking in to
account the constraints identified in objective 4;
6
2.0 LITERATURE REVIEW
2.1 BACKGROUND INFORMATION
2.1.1 Contribution of livestock sector to Kenya’s economy
Livestock contribute about 3.3% of the total GDP in Kenya (Aklilu et al., 2002). Cattle
production contributes nearly 50% to the Agricultural GDP, which has fluctuated around
25% of the total GDP of the country since the early 1980s (MoA, 1996). Despite such
significant contribution to the national economy, the livestock sector received 2% of the
total recurrent agricultural budget in Kenya for the year 97/98 (Aklilu et al., 2002).
2.1.2 Livestock resources, populations and off-take in Kenya.
In 2001, Kenya’s livestock population was estimated at 12 million head of cattle (of
which 3.2 million are in dairy herds), close to 20 million sheep and goats (shoats) and 1
million camels (MoARD, 2001). Variation in livestock population between years is not
uncommon and it is mainly a reflection of frequent droughts resulting in heavy losses
(Chabari, 1986; Aklilu et al., 2002). In addition, it owes to gaps in population data
collection in pastoral areas (Dahl and Hjort, 1976) and non-estimated off-take consumed
within the production units (Little et al., 1983).
An annual estimate of red meat production in Kenya is approximately 362,815 metric
tons of which beef constitutes about 286,000 metric tons (LMD, Undated (a)). A bulk of

7
this is beef mainly from Arid and Semi-arid Lands (ASAL) (AGSEC, 2000). A small
proportion of beef supply also comes from the dairy herds. The value of annual red meat
production is estimated at Ksh 43.2 billion. Within this the value of beef is estimated at
Ksh 34.4 billion, combined goat meat and mutton at Ksh 8.2 billion and camel meat at
Ksh 0.66 million (LMD, Undated (a)). Annual variation in off-take is attributed to
droughts and cross-border trade (Aklilu et al., 2002). The prevailing off-take rate in
Kenya cannot be adequately met without the contribution of cross-border trade which
accounts for 26% of beef supply in Kenya (Aklilu et al., 2002).
The off-take rate for shoats is estimated at 25% from an estimated 21.08 million shoats in
the country (comprising 6.9 million hair sheep, 1.1 million wool sheep, 12.95 million
meat and 0.04 million dairy goats) (LMD, Undated (a)). In the year 2000, mutton and
goat meat production was estimated at 68,269 metric tons (LMD, Undated (a)). Demand
for red meat is expected to grow by 15,000 metric tons every year for the next five years
(2002-2007)(LMD, Undated (b)).
2.1.3 Livestock populations and off-take in Turkana District
Different species of livestock perform best under different environmental conditions. The
Turkana, therefore, maintain proportions of stock in their herds appropriate to the local
environmental conditions and local patterns of drought risk (Gathuma et al., 1989;
AGSEC, 2000). The commonly kept livestock species include: cattle, sheep, goats,
camels and donkeys. In the year 2002, livestock populations were estimated as 175,815

8
cattle, 2,439,027 goats, 813,000 sheep, 138,000 camels, 32,000 donkeys and 10,387
poultry (DALEO, 2002). Recurrent droughts in the district cause fluctuations in livestock
populations. In the year 2001, a total of 2,809 cattle and 8,623 shoats were sold in
markets outside the district (DALEO, 2001).
2.1.4 Policy developments in livestock marketing industry in Kenya
Government policy on livestock marketing arose from policy changes imposed through
the structural adjustment programs (SAPs) and to a less extent through its own initiatives.
A shift in Government policy in mid 1980s focused on agriculture in providing food
security, the absorption of the labour force, boosting earnings and rural industrialization
(Republic of Kenya, 1986). Specific policies included liberalization of markets and
removal of government subsidies effectively sidelining the Livestock Marketing Division
(LMD) of the Ministry of Agriculture and Rural Development (MoARD) from operating
in the markets. The earlier role of LMD was livestock purchasing, drought management,
provision of facilities and disease control (Aklilu et al., 2002). Due to SAP, the roles of
LMD were revised to supervision and maintenance of infrastructure, establishment of
livestock marketing information network and livestock off taking during droughts (LMD,
Undated (b)).
Today, there is a growing keenness among interested parties (civic associations,
government agencies, donors, non-governmental organizations (NGOs), regional
organizations, etc) to promote livestock marketing in quality and quantity to alleviate the
9
predicaments of the primary producer and also the livestock trader (Aklilu et al., 2002).
However, following the exit of LMD and Kenya Meat Commission (KMC) from the
market, no specific policy has been formulated to date aimed at supporting and
facilitating the livestock trade per se, especially within the private sector. Livestock
marketing, whether for the domestic or export markets, has been left to the rules of
globalization (Aklilu et al., 2002).
2.2 COMMON LIVESTOCK MARKETING SYSTEMS IN PASTORAL AREAS OF
KENYA
2.2.1 Traditional non-market circulation of livestock and livestock products
The pastoralists maintain a network of interpersonal relations. This is characterized by
presence of claims between individuals (Storaas, 1989). Personal relationships are
established and maintained through transfers of property such as live animals, food,
tobacco, utensils or clothing as well as being exercised as expressions of active support
and generosity among relatives (McCabe, 1984). Outstanding claims between individuals
are challenged or called for in different situations. These include: as compensations;
during periods when a relative is worst hit by calamities such as of raids, livestock
disease epidemics and droughts; and during inheritance quarrels (McCabe, 1984).
When need arises, a person can go and see a wide range of people and bring such claims
to the surface. It is important to note that, these claims are not bound by time like in

10
typical pure market exchanges (Storaas, 1989). So long as partners recognize their
relation and the “state of the ledger”, they are never regarded complete. This flexible
social mechanism of outstanding claims is of great importance in such society where the
risks of losing livestock (the subsistence base) are so high, mostly in disasters such as
raids, disease epidemics and drought (Broch-Due and Storaas, 1983). It is therefore
practiced as a support system, though not in total.
This non-market circulation of livestock and livestock products, as well as money and
bartered or bought products, between individual units serves as a kind of security
mechanism for groups and individuals among the pastoralists. These exchanges are
generally characterized by impersonal ad hoc demand-supply conditions where
individual transactions need not carry any further implications for the relation between
the partners, although it occasionally happens (Broch-Due and Storaas, 1983; Broch-Due,
1987). Essentially, this mechanism is an inherent aspect of the political and socio-
economic organization of the pastoralists. This organization has an expanded role, which
enables the pastoralists to regulate exploitation of natural resources in such a vulnerable
natural environment where they live.
2.2.2 Auctions
Auctions flourish spontaneously when there is a surplus of bidders competing against
each other for a scarce commodity, and disappear when there is a plentiful supply of a
commodity and relatively fewer buyers (Gufwoli and Behnke, 1990). It provides

11
producers and sellers with the opportunity to use their discretion when deciding when to
buy or sell and also injects transparency to the market place such that it is possible to
monitor values such as price changes. Seasonal timing, adequate and timely advertising
coupled to the regular and reliable holding of sales (frequency) is crucial to the success of
this marketing system such that, there is a tendency to influence and improve buyer
attendance and prices (Airey et al., 1981; Mbogoh et al., 1989). Buyers must be informed
in advance of the sales’ venues and dates and the likely numbers, types, grades and prices
of animals to be offered. Likewise, sellers must be aware when sales are to take place and
be encouraged to offer their animals. Common means of advertising include radio,
newspaper and personal communication (Gufwoli and Behnke, 1990).
Droughts adversely affect performance of auctions. During this season, markets get
flooded with animals in poor condition, inevitably causing a drop in price. Poor prices
discourage sellers who would ultimately resort to private negotiations with buyers to
allow greater disposals/ off-take of their animals at the face of low prices (Gufwoli and
Behnke, 1990). In such situations, auction system collapses into a series of private
negotiations between individual buyers and sellers rather than maintain its status quo of
equal bargaining power. Conversely, wet seasons are characterized by reluctance of
producers to sell and high price expectation from producers. As a result, buyers are
disadvantaged due to possible reduced trading margins when competing for external
markets.

12
Other factors affecting the operations of the auction system include among others,
nomadic nature of the pastoralists, problems with organization and information
arrangements, price distortions due to a cartel of buyers, as well as trade volume
fluctuation (Gufwoli and Behnke, 1990).
2.2.3 Person to person negotiation
Airey et al. (1981) and Gufwoli and Behnke (1990) indicated that this is the existing
livestock marketing system in pastoral areas after the collapse of LMD and KMC.
ALRMP (2001) and Aklilu et al. (2002) observed that, although livestock and livestock
trade is the main source of livelihoods in most pastoral areas, most livestock markets
operating under this system are, in fact, poorly organized. This is partly attributed to poor
infrastructural development, poor marketing support interventions and poor markets and
marketing information systems. Traders operate in a haphazard system that may be
entirely relying on their extensive knowledge to understand the supply and demand
conditions of the trade, thus creating possibilities of their profit margins being curtailed
(Gufwoli and Behnke, 1990). Traders operating in such circumstances need to have
unique adaptation behaviour and inter-related business approach in order to give them the
financial and logistical flexibility to cope with difficulty of assembling trade animals
under the poor road conditions, nomadic nature of the pastoralists, long distances and
possible variations in supply volume. Additionally, they operate amid claims that, they
are exploitative to the pastoralists (Gathuma et al., 1989; AGSEC, 2000). Airey et al.
(1981) and Gufwoli and Behnke (1990) recommended that, measures intended to

13
improve livestock marketing in pastoral areas would more likely achieve their objective,
viability and cost-effectiveness if they are designed to organize and assist this existing
livestock trading system.
2.3 HISTORICAL DEVELOPMENT OF COMMERCIAL LIVESTOCK TRADE IN
TURKANA
2.3.1 Colonial period up to early 1970s
An auction system began in the 1950s under the colonial administration (Gathuma et al.,
1989). This was being propelled by poll/ hut taxes that were charged directly to all
pastoral households (McCabe, 1984). The auctions acted as big market places and major
outlets for stock sales and retail purchases.
Buyers in the auctions were reported to be coming from Uganda rather than from Kenya,
and reasons for this trend are unknown. In fact, Kenyan buyers of Turkana animals
frequently resold them in Uganda. No wonder, the system collapsed with the onset of
political insecurity in Uganda in the 1970s. Cattle rustling along the Kenya-Uganda
border exacerbated the collapse (Akabwai, 2000).
Since the end of the golden moments for these auctions in the early 1970s (after the
colonial era), other specialized marketing mechanisms (market forces) fundamentally
developed.

14
2.3.2 Late 1970s to Early 1990s
After the collapse of the colonial auction system, the Turkana Livestock Co-operative
Society Ltd (TLCS Ltd) was registered in 1977 to continue performing livestock
activities from where the colonialists left (Gufwoli and Behnke, 1990). In 1985, the
cooperative society collapsed due to poor management, lack of financial skills, lack of
enough working capital, political interference and competition from private traders.
The severe drought of 1979-81 that occurred in Turkana District found a disorganized
livestock marketing system where pastoralists could vent and salvage their livestock
(Airey et al., 1981). The Turkana Rehabilitation Project (TRP), instead of distributing
free relief food, introduced a food-for-work strategy where the Turkana could sell their
livestock in exchange for consumables. Private traders in consumer goods also utilized
this opportunity created by TRP.
On consolidation of lessons learned from the operations of the colonial auction system,
the TLCS and TRP’s interventions, and after consulting several Turkana District
Development Plans from 1979, Livestock Marketing Division of the Ministry of
Agriculture in collaboration with Norwegian Agency for Development (NORAD) and
TRP considered to initiate a livestock marketing project in Turkana District in 1983. The
strategy was based on re-establishment of the auction system and development of
infrastructure (consisting of holding grounds, stock routes, outspans, sale yards) for
facilitation of marketing and disease control measures (Gathuma et al., 1989).

15
Furthermore, it was to encourage gradual involvement of private traders in livestock
purchasing activities and to continue acting as a buyer of last resort during stress and
drought periods.
In its operations, the project was faced by a myriad of market distortions, which
undermined the establishment and viability of commercial trading in the district. These
included, among others, stiff competition for external markets, difficulty in developing
regular and high volume sales, non-adoption of integrated approach that embraces related
disciplines and projects and, lack of baseline data for estimation and verification of its
economic viability and determination of its performance (Mbogoh et al., 1989; Gufwoli
and Behnke, 1990). Additionally, auctions were infrequent and could not favour traders’
involvement because of the project being the only buyer at the auctions and by extension
the project was offering consistently much higher prices than could be offered by the
private traders.
After the collapse of LMD and KMC, Livestock Small Trader Loans Project, later to be
called Turkana Livestock Traders and Consumers Cooperative Society, was formed but
never took off. Subsequently, Gufwoli and Behnke (1990) in their livestock marketing
study in Turkana, made a proposal for a Turkana Livestock Trading Company, which,
however, did not materialize.

16
2.3.3 Early 1990s to date.
It is apparent that, private traders networks’ have been attempting to emerge and were
being suppressed by top-down interventions. It clearly manifested after the colonial
auctions, during the TRP drought intervention project, and after the livestock marketing
project of LMD. In any pastoral area of Kenya, livestock trading has been the domain of
the private sector following the liquidation of KMC and the exit of LMD from the
markets (Aklilu et al., 2002). Four categories of traders have been identified to exist.
They include shopkeepers, itinerant livestock traders (rural merchants), large-scale
businessmen, and butcher- men/hoteliers (McCabe, 1984; Gufwoli and Behnke, 1990).
This indicates that, stocks change hands several times before reaching any of the
domestic markets (Aklilu et al., 2002).
All sorts of traders are observed to reach the pastoralists (Gufwoli and Behnke, 1990). It
is questionable whether these traders’ networks are well vertically and horizontally
integrated and, clearly defined either by location or function in the trade (ALRMP, 2001).
The present status of the livestock markets necessitates a complete review in order to
formulate goal-oriented strategies (Aklilu et al., 2002). The roles and responsibilities of
governments, trader and producer associations, private sector and other civic associations
need to be re-assessed with a view to handing over most of trade related activities to the
private sector for sustainability while maintaining the regulatory and supervisory role of
governments (Aklilu et al., 2002).

17
2.4 TERMS OF EXCHANGE IN TRADING TRANSACTIONS IN PASTORAL
AREAS OF KENYA
Exchange of animals for animals or animals for goods or animals for cash is commonly
practised both within the pastoral communities (McCabe, 1984; Storaas, 1989) and
between pastoralists and traders (Mbogoh et al., 1989; Gufwoli and Roy, 1990).
Controversies have existed on relative superiority and attractiveness of either barter or
cash under the pastoralists trading situation. Gathuma et al. (1989), Mbogoh et al. (1989)
and AGSEC (2000) indicated with little supportive evidence that, barter trade doesn’t
give the producer his worth and more preference should be given to introduction of a
cash economy. Gufwoli and Behnke (1990), however, observed that the conditions under
which barter trade is conducted are in part difficult, and it is not immediately clear that
anyone is exploiting the other. They further argued that pricing in the barter exchange
system is not simply a second-hand or more exploitative version of cash prices. Barter
prices are set by the internal logic of the system and are not strictly comparable to cash
prices (Gufwoli and Behnke, 1990). Gufwoli and Behnke (1990) were of the opinion that
in any anticipated period of transition, in search of a cash economy, barter should co-exist
with cash transactions. This debate has remained unresolved for many years.
One of the reasons associated with pastoralists disfavour of cash emanates from the
common observation that, less shopping centers were found at the hinterland and the
pastoralists are forced to exchange their livestock with consumables brought by mobile
traders (Mbogoh et al., 1989). Gathuma et al. (1989) indicated that, even if shops were

18
available, pastoralists do not have ready cash facility to do purchases at the time and
place of wish. Additionally, traders do a lot of blackmailing when it comes to cash
transactions. Gufwoli and Behnke (1990) proposed that national distributors should be
expanded to pastoral areas to give the pastoralists a bargaining power for cash. Mbogoh
et al. (1989) suggested that, to promote more fair transactions, many shopkeepers and
mobile traders should be in the market and they should be provided with credit facilities
to allow them use cash as they participate in trading transactions.
In the pastoralists-traders’ transactions, the terms of exchange are determined by different
relative values that pastoralists and traders place on different classes of animals and on
different types of consumer goods. Traders’ assessment of animals is rather specialized as
compared to that of pastoralists, which exhibits a diverse nature. Traders attach a lot of
consideration to the market value of animals. Attributes valued by pastoralists are more
diverse and not specially business-focused because, they do not only sell but also breed
animals, use them for haulage and subsist on them and their produce (Gufwoli and
Behnke, 1990).
It therefore raises a question of how transactions should be legitimately handled in such
pastoral set-ups, to the favorable expectation of both traders and livestock producers
(herders) and in a bid to promote a cash economy. The need for and the use of cash by
pastoralists might vary from one commodity to the other or from one pastoral community
to the other, or may depend on other factors that are worth investigating.

19
2.5 MARKETING OF LIVESTOCK AND LIVESTOCK PRODUCTS IN THE
PASTORAL AREAS OF KENYA.
2.5.1 Live animals
2.5.1.1 Livestock species, age and sex structure preference for sale
Mbogoh et al. (1989) found that, among the Turkana, 56% of the marketed species are
sheep and goats, followed by cattle (24%), camels (12%) and finally donkeys (8%),
although percentages can vary from individual to individual (family status) and from
community to community. For any transactions, pastoralists consider small stock as a
“current account” and cattle as a “savings account”, while the camel is likened to a “fixed
account”. This means that, pastoralists will first dispose the small stock for their needs
before they think of disposing cattle. Camels will only be disposed of as a last resort
(Mbogoh et al., 1989).
Pastoralists sell or slaughter distinct class of animals (Dyson-Hudson, 1982; McCabe,
1984; Gufwoli and Behnke, 1990). Often sold or slaughtered are mature castrated males
(Mbogoh et al., 1989), barren females and culled breeding animals that are past
reproductive age (Schwartz, 1981). When this class of animals is unavailable, they resist
sales (or slaughter). Breeding stock and young stock is neither preferred for sale nor
home consumption. This is to ensure that total herd size decline is not experienced.
Breeding stock is the one that ensures progression of the herd, produces milk for

20
consumption and sale and, produces males for future slaughter and sales (Schwartz,
1981).
2.5.1.2 Domestic and export markets for live animals from pastoral areas of Kenya.
Domestic markets consist of primary, secondary and terminal markets (Aklilu et al.,
2002). The major terminal market for live animal from the pastoral areas of Kenya used
to be KMC (ALRMP, 2001). Since its collapse in 1987, total volume of off take of
livestock from pastoral areas has been greatly reduced, leaving domestic markets to
become supply-driven and increasingly non-competitive to the disadvantage of the
producer (Aklilu et al., 2002). Setting up of private abattoirs to replace KMC has been
limited by high production costs and deterioration of livestock marketing infrastructure
(AGSEC, 2000; Aklilu et al., 2002). However, current major terminal markets are
Nairobi, Mombasa and Nakuru (Mbogoh et al., 1989; Kariuki, 2000; Aklilu et al., 2002).
The other source of livestock for the domestic markets is the cross-border livestock
supply. This is claimed to be squeezing some pastoralists out of domestic markets (Aklilu
et al., 2002). The Middle East dominated the live animals export market in the late 1970s
and late 1980s. Since late 1980s, Kenya has not exported any significant quantities of
animals, owing to trade bans due to disease and other reasons (Aklilu et al., 2002).

21
2.5.2 Trade in livestock products
In pastoral areas, trade in livestock products has received little or no attention yet. This is
based on the assumption that most livestock products are used for subsistence/home
consumption (Mbogoh et al., 1989). However, recent observations indicate that a portion
of these products is readily destined for market (Aklilu et al., 2002).
2.5.2.1 Milk
It has been observed that milk contributes a greater percentage of pastoralists’ diet,
especially during the rain season and normal dry season (Schwartz, 1981; McCabe,
1984). Milk is readily marketed when in excess (Mbogoh et al., 1989). Many households
sell milk in the wet season or early dry season when production is high in spite of low
prices (Gufwoli and Behnke, 1990). However, during the dry season, milk production is
low and sales are low despite higher prices. In pastoral areas, market outlets for milk are
the urban and settlement centers, which directly consume it. Traders are not involved in
this milk trade due to problems of return to investment since they can’t dispose it
(Mbogoh et al., 1989).
2.5.2.2 Hides and skins.
A high proportion of hides and skins in pastoral areas is in the low quality grades III and
IV and a low proportion is of high quality grades I and II (Aklilu et al., 2002). The

22
Ministry of Agriculture and Livestock Development is doing little to improve hides and
skins quality and prices (Gathuma et al., 1989) although it is entrusted with the
responsibility of offering licenses, extension, inspection, grading and advisory services.
This is attributed to non-recognition of hides and skins trade as one of the major
components of trade in pastoral areas and as an important source of income to livestock
producers and thus, deserving an increased attention (Gufwoli and Behnke, 1990).
Sources of trade’s hides and skins in pastoral areas include pastoralists themselves,
butchers/slaughterhouses and influx from neighbouring districts or countries (Mbogoh et
al., 1989; Aklilu et al., 2002). In pastoral areas, socio-cultural obligations such as ritual
meat feast and traditional crafts affect the volume of hides and skins for trade (McCabe,
1984; Gathuma et al., 1989; Storaas, 1989). Export markets for Kenyan hides and skins
are Pakistan, Italy, India and China (Aklilu et al., 2002).
2.6 COMMON CONSTRAINTS ASSOCIATED WITH LIVESTOCK TRADE IN
PASTORAL AREAS.
Relatively unique features associated with trade risks and uncertainties characterize
pastoral areas. Chabari and Njiru (1991); ALRMP (2001); Wario (2001) and Orre (2003)
enumerated major constraints connected to livestock trade as lack of organized and
established livestock markets and marketing systems, lack of market and marketing
information, livestock diseases, inadequate or deteriorating infrastructure, insecurity due
to banditry and cattle rustling, inadequate market outlets for livestock, high transportation

23
costs and cess charges, poor road infrastructure, lack of operating capital for livestock
traders, and droughts. These problems highly disadvantage small livestock traders and
producers (Wario, 2001).
2.6.1 Poor Marketing infrastructure
Many marketing structures in pastoral areas were constructed by government projects, or
in the recent years by NGOs. The main purpose of these structures is to facilitate and
promote an efficient and organized livestock marketing system and disease control. These
structures consist of stock routes, holding grounds, out-spans, tanneries for hides and
skins, and slaughter facilities. Many of them are either abandoned or under-utilized or are
poorly maintained, where they still exist (Aklilu et al., 2002). Provision of infrastructural
facilities has had problems after KMC and LMD ceased marketing operations and
stopped managing them due to their collapse in 1987 and 1983 respectively, although a
few are currently being used and managed by community user groups (ALRMP, 2001).
Most of these infrastructures require heavy capital investments both for initial
establishment and maintenance (Gufwoli and Behnke, 1990). The Arid Lands Resource
management Project (ALRMP) is now undertaking responsibility of improving livestock
marketing infrastructure (ALRMP, 2001).
24
2.6.2 High Transportation costs
Transport has been the most important component of cost in marketing operations for any
trader (Aklilu et al., 2002). In Kenya, 25% to 40% of the total cost of livestock taken to
terminal markets from the northern pastoral areas is accounted to transport (Aklilu et al.,
2002). In a study in South Sudan, the ratio of transportation costs in the marketing margin
was found to be between 0.07 and 0.48 per kg live weight of cattle (Guvele and Lautze,
2000). As a result, transport costs determine the level of profits accrued by livestock
traders. Those traders with their own means of transport accrue the highest profit margin
(Aklilu et al., 2002). Some traders trek their animals and it is not certain whether the
perceived benefits would outweigh costs of trucking particularly if trekking involves
many days that result in tying of working capital for too long, low turn over volume,
disease spread and weight loss. Remoteness of the pastoral areas, rough terrain, insecurity
and poor roads limit lorry transport (Gufwoli and Behnke, 1990). In addition to transport
costs, livestock traders pay taxes and transit fees in many places en-route to terminal
markets, regardless of the regulation that livestock should only be taxed at the point of
origin (Aklilu et al., 2002).
2.6.3 Drought
Drought is an ever-recurring problem in pastoral areas and has serious effects on
livestock production and marketing (Airey et al., 1981). It is recommended that, for any
livestock marketing system to be considered satisfactory, it must continue to function

25
under drought conditions and lend itself to practical drought contingency measures that
are appropriate to pastoral areas and, any other measures that prove necessary (Airey, et
al., 1981; Schwartz, 1981). Although pastoralists are increasingly pushed to sell animals
during droughts, this has not been matched by a corresponding growth in per capita
consumption of meat due to the stagnation of the economy (Aklilu et al., 2002), causing a
price inelastic demand situation (Kivunja, 1976). During this period, low producers’ price
share and lack or limited export markets exacerbate the pastoralists’ suffering.
2.6.4 Lack of markets and marketing information
Lack of market information network has been identified to be a major constraint to
livestock marketing in pastoral areas of Kenya and Tropical Africa in general (Chabari,
1986). Governments and public institutions have been performing the role of acquiring
and disseminating market information so as to improve livestock market performance,
but the problem still remains. Gatere and Dow (1980) found that pastoralists were less
knowledgeable about market situation than the buyers and were commonly outwitted by
the latter during selling/buying negotiations. This was attributed to the nomadic nature of
the pastoral populations and inadequate or lack of extension agents that are mobile and
flexible enough to accommodate the mobility of the groups (Mbogoh et al., 1989).
Additionally, the harsh environmental situation of pastoral areas limits the frequency of
visits by extension agents. Local chiefs have been underlined to be most crucial in
enhancing awareness and passing livestock development (and any other) extension
messages (Mbogoh et al., 1989). The accuracy and quality of information is poor (Aklilu
26
et al., 2002). Livestock marketing information and data base centers are lacking in
pastoral areas (Gufwoli and Behnke, 1990).
The ALRMP (2001) found that traders and producers commonly complain about lack of
price information, and yet there is extra bulk of information that is required to improve
the efficiency of markets in pastoral areas. Marketing information networks, therefore,
should not only revolve around the issue of price, but be a wider knowledge-passing
conduit and intelligence system on several aspects of livestock trading, such as
constraints, opportunities and, mere performance, structure and conduct (ALRMP, 2001).
In Kenya, there are current efforts by the Arid Lands Resource Management Project
(ALRMP) to establish market information systems through establishing pastoral and
livestock marketing associations at the grass roots and district levels, culminating into
registration of the Kenya Livestock Marketing Council (Wario, 2001).
2.6.5 Livestock diseases
Several diseases pose threats to livestock trade. These are diseases that are regarded as
notifiable within the Animal Diseases Act (Cap 364 of the Laws of Kenya) (Republic of
Kenya, 1972), and at the international level, those diseases that are listed under List A
and List B (OIE, 1998). These diseases are transmissible, have the potential for very
serious and rapid spread and have serious socio-economic or public health consequences.

27
The most significant include Rift Valley fever, Rinderpest, Foot and Mouth disease
(FMD), Contagious Bovine Pleuropneumonia (CBPP), among others.
The Kenya’s disease control policy was put in place in 1900. Government policy to try to
control and eradicate diseases is through undertaking measures that would ensure an
effective control of any future infections and disease outbreaks (ALRMP, 2001). This is
achieved through vaccinations, screening and livestock movement restrictions through
the enforcement of quarantine measures/ cordons/ lines between the disease endemic
areas and the traditionally disease non-endemic areas within the country (Republic of
Kenya, 1972).
The Director of Veterinary Services (DVS) is empowered to declare livestock movement
restrictions (i.e. livestock quarantines) for disease control purposes within any part of
Kenya under the Animal Diseases Act (Cap 364) (Republic of Kenya, 1972).
Veterinary permits are necessary for movement of animals in all cases and the DVS
encourages transportation by trucks as a means of disease control, especially for animals
from disease high risk areas (Aklilu et al., 2002). Livestock for sale must be subjected to
the required regulations of inspection or vaccination against notifiable diseases (Gathuma
et al., 1989).
The efficacy of the current disease control systems through the restriction of movement
has been found to be low (ALRMP, 2001). Disease control measures and regulations are

28
not effectively adhered to. Funds, equipment and material, and trained personnel for
disease control are in short supply (Aklilu et al., 2002). Disease-Free Zones that were
maintained in the central parts of the country and from which livestock and livestock
products were exported in the past no longer retain the status (LMD, Undated (b)). The
eight quarantine facilities (including Isiolo), run jointly by the DVS and the LMD, are not
providing the same level of service as in the past (ALRMP, 2001). The Animal Diseases
Act is silent on some issues, for instance, cross-border livestock imports, and therefore
requires review. Some provisions governing the inspection of livestock (for instance three
CBPP tests) prior to exports appear unrealistic in today’s highly competitive world
market (ALRMP, 2001; Aklilu et al., 2002).
Disease control regulations for international trade are being coordinated by the Office
International des Epizooties (OIE) through formulation, documentation and regular
review of international standards, guidelines and recommendations formally adopted as
international Animal Health Code. The aim of the code is to ensure the health security of
international trade in animals (mammals, birds and bees) and animal products, through
the detailed definition of health guarantees to be required of trading partners so as to
avoid the transfer of disease agents that are pathogenic for animals or humans (OIE,
1998).

29
2.6.6 Variation in the volume of sales
2.6.6.1 Variation due to season
The number of animals marketed by pastoralists is sensitive to changes in rainfall and
pasture conditions but the relationship between sales and rainfall is complex (Gufwoli
and Behnke, 1990). Similar rainfall conditions can elicit very different marketing
responses depending on the condition of the pastoral economy and size, structure and
productive performance of pastoral herds (Gufwoli and Behnke, 1990). Wide and
unpredictable fluctuations in the numbers of animals sold in a given year or season are
characteristic of marketing patterns in dry pastoral areas. The number of livestock sold by
pastoralists from season to season or year to year are difficult to predict. Gufwoli and
Behnke (1990) noted a supply variation of 500% to 1000% from year to year. Difficulty
in predicting livestock sales among pastoralists creates obstacles in attempting to design a
strategic livestock marketing system that incorporates other vital technical and economic
requirements that are otherwise expensive to provide, establish and maintain, such as
infrastructure and financial assistance. Redundancy of structures at some season or
circumstance of no trading activity is possible and yet it is expensive to maintain such
redundant facility.
Similarly, demand for commercial goods and services by pastoralists seems to reflect a
seasonal variation. This indicates that improvement of livestock marketing in pastoral

30
areas could therefore be matched with relative demand for these goods or services,
coupled with traders’ knowledge on the dynamics of pastoralists’ demand for the same.
2.6.6.2 Variation due to the level of home consumption
McCabe (1984) suggested that the socio-economic environment of pastoral communities
has some remarkable influence on the marketing behaviour. This is mainly attributed to
the ritual, social and economic role of livestock in a pastoral community (Gulliver, 1951;
Schwartz, 1981). In part, Galvin (1984) asserted that there is a tendency by pastoralists to
“excessively” accumulate livestock as a result of them lacking a “commercial-mind”.
Schwartz (1981) observed that, majority of the pastoralists are subsistence producers in
that they consume within the household most of the livestock produce. McCabe (1984),
Gufwoli and Behnke (1990) and AGSEC (2000) later refuted this claim when they found
that, despite being surrounded by socio-cultural obligations, pastoralists are willing to sell
their stock if an advantageous market (for livestock, livestock products and non-pastoral
products) exists and, herds/stock are considerably built as a drought averting strategy or
as an insurance against disastrous situations.
Gufwoli and Behnke (1990) noted that pastoralists sell livestock for complex and
apparently conflicting reasons. Firstly, they sell to get cash to purchase demanded non-
domestically produced goods and services such as veterinary drugs, tobacco, cloth, maize
meal, beads, tyre shoes, school fees, and many others. Secondly, they sell because they
have an unusual abundance of livestock products, which they cannot otherwise use

31
(Gufwoli and Behnke, 1990). Thirdly, the pastoralists sell livestock during periods of
stress (long dry season or drought) in order to purchase food and offset shortfalls in
subsistence production.
In spite of the willingness of pastoralists to sell, the decision to sell is a joint undertaking
between those with claims on the livestock, for instance, husband and wife (Storaas,
1989). Conflicts arise when one party makes a decision without consulting the other
party, ending up in restitutions. Stronger claims are attached to big stock (camels, cattle),
than to small stock (McCabe, 1984).
32
2.7 CONCLUSION
In common with other pastoral communities, livestock is the main resource and economic
base of the Turkana pastoralists. Indeed, there is need to strengthen the capacity of the
Turkana pastoralists to utilize this livestock resource. Livestock market development is
therefore key to such attempts. Several constraints have been suggested as limiting
sustainable access to this resource. Among others, is the limited involvement of
pastoralists in matters pertaining to livestock development interventions. There is
therefore need to involve the pastoralists themselves in the analysis of constraints and
opportunities to livestock marketing or livestock development in general, in a bid to
formulate or design strategies/ interventions that suit the pastoralists way of life, and
which can subsequently influence design or amendment and adoption of policies that are
specific to pastoral development.

33
3.0 MATERIALS AND METHODS
3.1 DESCRIPTION OF STUDY AREA
The study was carried out in Loima Division of Turkana District, Rift Valley Province of
Kenya. Turkana District occupies the northwestern part of Kenya sharing international
borders with Ethiopia to the North, Sudan to the northwest and Uganda to the West.
Within Kenya, the district borders Marsabit to the East, Samburu to the southeast and
Baringo and West Pokot districts to the South. The district lies between longitudes 3400′
and 36040′ East, and between latitudes 10030′ and 5030′ North. It covers an area of
approximately 77,000 km2. The district has 17 divisions, 56 locations and 158 sub-
locations, with a human population estimated at 450,860 (CBS, 2001). Turkana District is
an arid and semi-arid land and receives annual rainfall of between 120mm and 500mm in
the lowlands and highlands respectively and, with temperatures ranging between 24-
380C.
Loima Division covers an area of approximately 4,250km2 comprising of two
geographically distinct regions, Lorengippi region (2,050Km2) and Loima hills plateau
(2,200Km2) (Range Management Handbook of Kenya, 1994). It falls under range units 7
(Lorengippi region) and 8 (Loima hills plateau). Landforms in the division include
mountains, hills, uplands, foot slopes, dissected erosional plains, sedimentary plains and
riverine (flood) plains (Range Management Handbook of Kenya, 1994). The vegetation
comprises of evergreen woodlands, deciduous bush land, deciduous bush annual

34
grassland, and wooded grassland and it is within 10Km of permanent water (Range
Management Handbook of Kenya, 1994). It receives a median annual rainfall of 200-
400mm.
Loima Division has three locations with an estimated human population of 33,765 people
in 5,104 households (Republic of Kenya, 2002). It is in the Western part of the district,
sharing borders with West Pokot District to the South and Uganda to the West. It
supports a livestock population of 24,500 cattle, 126,800 sheep, 253,600 goats, 18,300
camels and 4,250 donkeys (DALEO, 2002). The division is inhabited by ngikamatak
section of the turkana. There are no organized livestock markets in the division and
people often sell their animals at markets outside the division (but within Turkana
District), and to some extent, across the border to Moroto markets in Uganda and
Amakuriat in West Pokot District of Kenya. Government of Kenya (Ministry of
Agriculture and Rural Development) and Veterinaries Sans Frontieres- Belgium (Non-
Governmental Organization) provide Animal Health and Livestock marketing services.
Figure 1 shows the location of the study area.

35

36
3.2 SELECTION OF STUDY AREA, SITES AND SAMPLING UNITS
The study was carried out in four livestock camps of Loima Division. They included
Adakar Natuba, Kicono, Acemie and Aporon. They were conveniently selected based on
accessibility, security and logistics. Additionally, Veterinaries Sans Frontieres- Belgium
(VSF-B) was carrying out livestock marketing project in the area that helped to mobilize
the pastoralists and sometimes offer logistical support. In studying livestock off-take, a
family was taken as the basic sampling unit. It is the primary decision making unit among
the Turkana pastoralists as far as resource management is concerned, and collecting data
at that level assisted to understand factors that influence decision that could be used to
design and plan development interventions.
3.3 DATA COLLECTION
The data was collected between May and July 2003. Participatory appraisal (PA)
methods such as seasonal migration maps, matrix scoring, proportional piling, simple
ranking, seasonal calendars, semi-structured interviews and workshops were used. Other
workers had used these methods in the past in conducting epidemiologic and economic
assessment studies (Catley and Ahmed, 1996; Catley and Mohammed, 1996; Mariner;
1999; Catley, 2000; Catley and Leyland, 2001; Catley et al., 2002; Eregae, 2003; Kaitho,
2003; Mochabo, 2003).
37
3.3.1 Phase one: Sensitization workshop
A workshop was held in Lorugum at District Officer’s (DO) compound for three days,
between 13th and 16th May 2003, with the main purpose of informing the community of
the intended research and the need for their involvement. The participants included 12
key elders (mainly livestock camp leaders) from the three locations of Loima Division
(four from every location), 3 chiefs (one from each location), 7 livestock traders, 2
representatives from the Ministry of Agriculture and Rural Development, and one
representative from VSF-Belgium. Discussions were mainly through brainstorming and
semi-structured interviews. Issues discussed were major cattle camps in every location
and their possible routes of migration, historical development of livestock marketing in
turkana; types of marketing systems; means of exchange; classification of livestock
traders; those responsible for decision to sell an animal in a family; wealth ranking; age-
sex categories of types of livestock kept; constraints faced by producers and traders in
livestock marketing; seasons of the year and their corresponding months; sources of cash
income. Participatory methods to be used in the study were also demonstrated. The
workshop generated information that was later verified and standardized in the course of
actual data collection.

38
3.3.2 Phase two: Participatory mapping
This was used to map potential livestock markets in Loima Division based on seasonal
movements of the livestock camps. One group of informants (of about 8-15 people) in
every livestock camp was involved, totaling to 4 informant groups. A mapping procedure
was explained to a group. Features of interest to the researcher were geographical
boundaries of a livestock camp demarcated by major mountains/hills, main rivers and
major watering points along them, neighboring tribes; grazing areas during wet and dry
season plus potential directions of migration; trading centers; earth roads. A group was
instructed to use locally available materials such as stones, sticks, tyre shoes, traditional
chairs (Ekicholong), bones to distinctively mark a feature placed on the map. A clean
space on the ground was prepared for them to produce a map. Informants were left alone
to carry out the exercise for twenty minutes. The informants were added more time on
request. Guidance of the researcher was sought from time to time. On completion of the
exercise, the informants were asked to reaffirm the features on the map, after which the
map was drawn on A-4 size notebook. The maps from the four livestock camps were
collapsed in to one, shown in Figure 2.

39
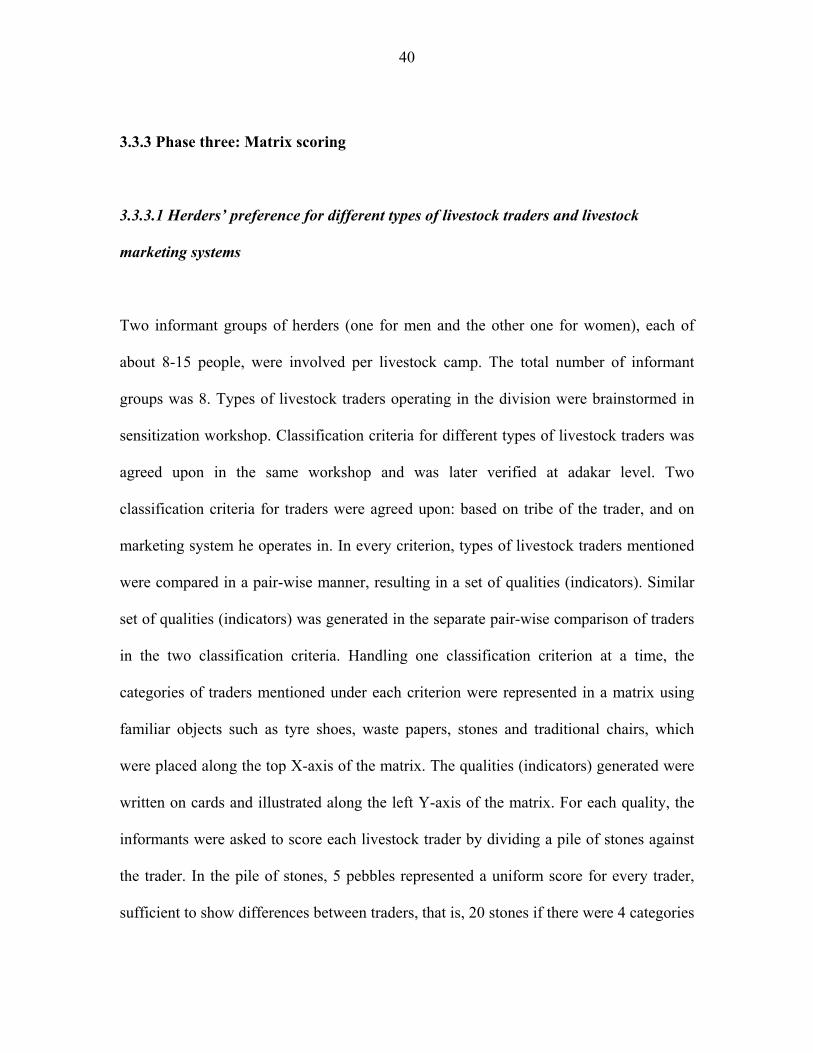
40
3.3.3 Phase three: Matrix scoring
3.3.3.1 Herders’ preference for different types of livestock traders and livestock
marketing systems
Two informant groups of herders (one for men and the other one for women), each of
about 8-15 people, were involved per livestock camp. The total number of informant
groups was 8. Types of livestock traders operating in the division were brainstormed in
sensitization workshop. Classification criteria for different types of livestock traders was
agreed upon in the same workshop and was later verified at adakar level. Two
classification criteria for traders were agreed upon: based on tribe of the trader, and on
marketing system he operates in. In every criterion, types of livestock traders mentioned
were compared in a pair-wise manner, resulting in a set of qualities (indicators). Similar
set of qualities (indicators) was generated in the separate pair-wise comparison of traders
in the two classification criteria. Handling one classification criterion at a time, the
categories of traders mentioned under each criterion were represented in a matrix using
familiar objects such as tyre shoes, waste papers, stones and traditional chairs, which
were placed along the top X-axis of the matrix. The qualities (indicators) generated were
written on cards and illustrated along the left Y-axis of the matrix. For each quality, the
informants were asked to score each livestock trader by dividing a pile of stones against
the trader. In the pile of stones, 5 pebbles represented a uniform score for every trader,
sufficient to show differences between traders, that is, 20 stones if there were 4 categories

41
of traders to be scored against. Every time a quality was to be scored against the types of
traders, the quality was read and explained to the group by the researcher. After the
exercise, informants were given additional five minutes to crosscheck the scores in a
matrix and do any alterations if necessary. In the course of crosschecking, informants
were asked probing questions in a bid to generate any other additional information about
livestock traders. The matrix produced was later recorded in a field notebook.
The matrix scoring for different livestock marketing systems underwent the same
procedure as above, that is, brainstorming in sensitization workshop, verification of types
of marketing systems at adakar level, pair-wise comparison of different marketing
systems and generation of qualities that were scored against each marketing systems
which, eventually produced marketing systems-qualities matrices. Plate 1 shows a matrix
–scoring exercise performed by an informant group.
3.3.3.2 Seasonal calendar
This was used to assess existing off take with regard to seasonality of sales. One
informant group of herders each of about 8-15 people was involved per livestock camp.
The total number of informant groups was 4. In the sensitization workshop, participants
were asked to mention the types of livestock commonly sold. For each type of livestock,
corresponding age-sex categories sold was produced. Participants were encouraged to
mention these categories in local language. Attempts were made to ensure that
participants settled at a name for every age-sex category mentioned, because an age-sex

42
category seemed to have several synonyms. This information was verified at the adakar
level.
During actual data collection, a line was drawn on the ground and explained to informant
group that it represented one full year. The informants were asked to divide the line in to
community’s seasons and corresponding months in local language. Each season was
labeled by a representation on a piece of carton; red marks for dry season, green for wet
season and green-red partition for inter-phase between wet and dry season. Informants
were given a chance to explain back to the researcher the meaning of color marks on the
pieces of cartons that represented seasons. Pieces of cartons were placed on the top X-
axis. Age-sex categories generated during sensitization workshop, written on pieces of
cartons, were placed on the left Y-axis. Considering one livestock type at a time,
informants were asked to divide the pile of stones provided, against seasons for every
age-sex category mentioned by the researcher to show the relative seasonal trend in the
sale of a particular age-sex category. After every scoring, informants were asked to
carefully check the scores and if they wished, adjust the scores until they are satisfied.
The produced seasonal matrix prompted further questioning and discussions. The matrix
was later transferred in to a field notebook.

43
3.3.4 Wealth ranking and Proportional piling
This was used to assess herders’ perceptions of income sources with special reference to
livestock marketing; assess off-take with regard to age and sex of animals sold and as
proportional measure of herds and, assess herders’ predictions of off-take levels if
marketing was improved. A total of 72 herders (individual informants), 18 from each
livestock camp, stratified on gender and wealth were involved. In assessing sources of
income, participants were asked ways and means they obtained cash income in the past
one year. Major sources of income were noted and those regarded minor by participants
were classified under “others”. Using a pile of 100 stones, each informant was asked to
divide the stones among the mentioned sources of income to show the relative
proportions of income that accrued from each source. In assessing off-take, each
informant was asked to divide a pile of 100 stones in to the four types of livestock (goats,
cattle, camels and donkeys) that were mentioned to be in his/her total herd in the past one
year to show relative proportions in the total herd. For each livestock type, the informant
was asked to further divide the allocated proportion of stones in to “those sold in the past
one year” and “those that remained in the herd”. Subsequently, the informant was asked
to divide the proportion of livestock sold in to age-sex categories that were sold. To
predict off take levels, stones assigned to a particular livestock species were pooled back
and informant asked to divide the stones in to a proportion he/she would sell if marketing
improves.

44
Community’s criteria of wealth ranking were discussed in the sensitization workshop.
This was verified at the adakar level. To identify individuals that belonged to various
wealth groups (rich, medium class or poor) in an adakar, the researcher consulted the
adakar leader based on the fact that he had a holistic understanding of individuals in the
adakar, commands respect and also had attended the sensitization workshop. The adakar
leader was asked to produce names of elders that were members/ occupants of his adakar
and a list was generated. Based on his experience coupled with wealth ranking criteria
adopted in sensitization workshop the adakar leader was asked to provide wealth ranks
against every elder listed. From the elders’ wealth status list, the researcher grabbed 3
elders for every wealth group (3 rich, 3 medium class and 3 poor). For purposes of
capturing information from both women and men, every elder was interviewed and views
of the wife sought later. This approach helped to standardize the number of informants
required and ensure that every wealth and gender group was equally represented. Plate 2
shows a proportional piling exercise performed by an informant.
3.3.5 Phase Five: Simple ranking and semi-structured interviews
This was used to assess herders’ preference for selling different types of stock, and assess
herders’ and traders’ perceptions of marketing constraints that were later compared to
perceptions of government livestock workers. This involved 72 herders (individual
informants), 59 individual traders (20 in lower primary markets, 14 in upper primary
markets and 25 in secondary markets) and 8 government livestock workers (individual
informants). Constraints faced by traders and producers in livestock marketing were

45
brainstormed during the sensitization workshop and later verified during actual data
collection. Herders were asked constraints they face in marketing their livestock and
subsequently assign ranks in the order of importance. Traders were stratified according to
types of livestock markets they were operating in (Lower primary, upper primary and
secondary), and asked to mention constraints they face in buying and selling livestock
and later guided through the process of assigning ranks to constraints in the order of
importance. Government livestock workers were asked to give their perception of
constraints faced separately by traders and producers in livestock marketing and assign
ranks in the order of their importance.
3.3.6 Phase six: Stakeholders workshop
After data collection and brief analysis of results in the field, a stakeholders’ workshop
was held where preliminary findings of the study were presented and verified. The
workshop was held between 10th and 12th July 2003 at District officer’s compound in
Lorugum. It was attended by 20 livestock owners (12 men and 8 women) from the four
adakar where the study was carried out, 3 chiefs from the 3 locations of Loima Division,
14 traders (3 from secondary market in Lodwar, 3 from upper primary market in
Lorugum and 8 from the lower primary markets), 1 representative from District
Veterinary office, 1 representative from Animal Production office, 5 NGO
representatives (1 from ITDG-EA, 1 from CAPE Unit of AU/IBAR, 1 from SNV-Kenya
and 2 from VSF-Belgium) and 2 lecturers from Department of Public Health

46
Pharmacology and Toxicology of the University of Nairobi. Plate 3 shows a participant in
a stakeholders’ workshop expressing a point.
Plate 1: Elders of adakar Aporon carrying out a matrix scoring exercise, May/June 2003
Plate 2: Enumerator Mark Adiaka, confirming from the informant the outcome of a proportional piling exercise, May/June 2003
Plate 3: An elder, Long’ole, expressing a point in a stakeholders’ workshop, July 2003
3.3 DATA HANDLING AND ANALYSIS
Data handling and analysis was as described by Eregae (2003); Kaitho (2003) and
Mochabo (2003).
3.3.1 Participatory mapping data
Maps constructed by pastoralists in the four adakars were summarized in to 1. The map
was first stored in field notebook and later scanned using Scanjet® 5200 scanner
(Hewlett Packard Corporation, USA).

47
3.3.2 Matrix scoring and seasonal calendars data
The data were first stored in field notebook as tables and later entered into Microsoft
Excel® 2000 (Microsoft Corporation, USA) software as spread sheets/workbooks. Data
were saved as Microsoft Excel 4.0 worksheet in separate files and then imported to
Statistical Package for Social Sciences (SPSS®) Version 11.0, 2002 (SPSS® Inc. USA)
where it were saved as SPSS files. Using SPSS, medians and range (maximum and
minimum values) were computed using descriptive statistics menu. Levels of agreement
between informant groups were computed using Kendall’s coefficient of Concordance
(W). Kendall’s coefficient of Concordance compares more than 2 items. The two types of
traders identified in tribal classification could not be compared using Kendall’s
coefficient of Concordance and was therefore subjected to Mann-Whitney (U) and
Wilcoxon (W) tests.
3.3.3. Proportional piling data
In the field, data were stored in to a notebook. Data were later entered into Microsoft
Excel® workbook and saved as Microsoft Excel 4.0 worksheets as separate files. These
were then imported in to SPSS where descriptive statistics were computed and presented
as tables, pie charts and bar graphs with error bars. Significant differences between
adakar, gender and wealth groups were computed using non-parametric one-way analysis
of variance (ANOVA).
3.3.4 Semi-structured interviews data
Data were summarized qualitatively.

48
3.3.5. Simple ranking data
In the field, data were stored in to a notebook. Data were later entered into Microsoft
Excel® workbook and saved as Microsoft Excel 4.0 worksheets as separate files. These
were then imported in to SPSS where descriptive statistics (median ranks and range) were
computed and presented as tables.

49
4.0 RESULTS
4.1 HERDERS PERCEPTIONS OF LOCAL MARKETS
4.1.1 Mapping potential livestock markets based on seasonal movements of
pastoralists.
Figure 2 shows the map for the location of the four adakars of Loima Division that were
involved in the study. It defines potential livestock markets and displays possible routes
of migration during seasonal movements by livestock keepers in the division. Trading
centers around the study adakars herein dubbed as potential livestock markets were
Namoruputh, Lokiriama and Lorengippi. There has been disorganized low-scale
marketing of livestock in these centers. Livestock keepers highly depended on markets
outside the division, namely, Lorugum, Turkwell, Lodwar and Kakuma ; Amakuriat
market in West Pokot District of Kenya, and Moroto market in Uganda. During dry
season, livestock was moved to hilly or mountainous regions of the Division and to some
extent across the borders to West Pokot and Uganda during severe drought. In the wet
season, livestock was moved to the erosional plains which form a larger part of the
division’s land mass. These movements were only reflected in three species of livestock,
that is, shoats, camels and donkeys. Cattle were in almost permanent grazing in Uganda
throughout the year. Ngikamatak of Loima Division occasionally engaged in running
battles with their neighbours, the pokots of Kenya, Tepes of Uganda, Matheniko of
Uganda and Jie of Uganda. These fierce battles were occasioned by raiding that is
practiced between and among the pastoral communities in the Karamoja cluster. Other

50
features shown in the map were earth roads, mountain ranges, hills, rivers and watering
points.
Pastoralists in Loima Division further reiterated that establishment of a market in the
division has to fulfill the following requirements: centrally placed to reduce distance from
a livestock camp to the market; not in an insecure area; with substantial supply of
commercial goods demanded by producers; availability of water and pasture for trade
animals; utilize cross-border marketing opportunities since the region borders West pokot
District and Uganda; easily accessed by traders; based on a marketing system that
promotes market days. Namoruputh was unanimously suggested as the trading center
where a livestock market could be established.
4.1.2 Herders’ criteria for classification and preference for different types of
livestock traders.
4.1.2.1 Classification and preference based on tribe of a trader
Figure 3 shows the mean ranks and significance values for tribal classification and
preference of traders. There was no significant difference in the herders’ preference of
Esomalit (Somali) or Eturkanait (Turkana) based on prices of livestock, consistency of
buying livestock, trust worth, cash handling and friendly negotiations. Informant groups
disagreed over the scoring of all indicators considered in preferential differentiation of a
certain tribe of trader. Though the differences were insignificant, Esomalit emerged to be

51
slightly trustworthy (mean=8.81) and handling enough cash (mean=9.19) than
Eturkanait. On the other hand, Eturkanait was recognized as a friendly negotiator
(mean=10.44), consistent in buying livestock (mean=9.88) and offering better prices of
livestock (mean=9.69) than Esomalit. In overall, most preferred qualities were
trustworthiness (U=29.5), Cash handling (U=26.5) and pricing of livestock (U=22.5).
From observation, most of the discussions were subjective.
In the course of discussion and on probing, some observations were made and further
information was provided. Some informants tilted towards Eturkanait due to the tribal
bias and generosity highly expected of them. It was observed that, some of the informants
were traders, and screening and isolating them from the groups was difficult. However,
interactive nature of methodology used and passive control of talkative individuals by the
researcher assisted to generate lengthy and heated debates that sometimes ended
unresolved.
Some informants preferred Eturkanait because, his business property belonged to the
community while that of Esomalit was individually owned and commonly re-invested
back to his original homeland. There was complaint over non-aggressiveness of
Eturkanait in trade. This was attributed to lack of business skills, working capital or due
to high illiteracy rate. Educated Eturkanait was blamed firstly, for fearing to conduct
trade around the community perhaps because of generosity expected and secondly, for
lacking deliberate effort and attempt to enlighten illiterate traders and community as a
whole. Low working capital was given as a reason why few Turkanas were venturing in

52
to livestock trade. Most of the traders emanated from poor families. Old historical myth
of disunity among the Turkanas was mentioned as one of impermeable barriers that
hinder operation of livestock trade as a cooperative that could help cushion risks and
uncertainties associated with trading in such set up.
Some Eturkanait were associated with offering very low prices. Consequently, Esomalit
learns this behaviour from Eturkanait and resorts to equally depress prices. Esomalit
could also offer low prices when they are few. Worse still, Esomalit was mentioned to
have studied the food-availability cycle among the turkana, known when they are
desperately looking for food, and at his discretion, could offer low prices for livestock at
that time. Despite the low pricing of Eturkanait, he was recognized for informing
producers on price changes, an attribute that was missing in Esomalit. One could only
sense that prices of livestock were not favorable when Esomalit was seen not to be
loading trucks of livestock for markets outside the division.
Though Esomalit was associated with handling enough cash, it was reported that, they
couldn’t release it easily. If they do, they depress livestock prices so that they can offer
very little cash that would otherwise be useless in the face of pastoralists when they want
to purchase priceless commodities from their shops. This could be a trick to divert the
minds of pastoralists from cash and lure them towards barter where the trader has
advantage of manipulating prices. Most of the transactions of Eturkanait were in barter
and this was blamed for influencing the mind of Esomalit to equally use and perpetrate
barter trade. Lack of cash among Turkana traders was attributed to low working capital.

53
Esomalit and Eturkanait were almost equally rated in being consistent in buying
livestock. However, Esomalit was said to be in a better position due to his capital base.
Conversely, lack of enough capital coupled with low business skills and non-integration
of business could often push Eturkanait out of business. Esomalit was associated with
trustworthiness because he could sometimes raise the price of livestock, trade both in
cash and barter and could give gifts.
Eturkanait was recognized for his ability to negotiate for a price margin in a respectable
manner. This was attributed to his constant presence with the people, better local
language command, wider knowledge of people’s problems and social/cultural
attachment to the people. Esomalit was reported to be treating livestock keepers as
strangers and his friendship was business oriented. He could set the price of livestock
without incorporating wishes of livestock owners especially when he realizes that, the
livestock owners are desperately in need of food.
Based on past experience, some informants were totally dissatisfied with the crop of
traders (both turkana and somali) that were present within the community, accusing them
of extensive mischief, business cartels and exploitation. They could prefer dealing with
new traders (from outside Loima division) if marketing improves. In the overall, the basic
concern of informants was a trader who is trustworthy (U=29.5), one who has cash
(U=26.5) and one who offers better prices (U=22.5).

54
Variable
Trader
type
Group
(N)
Mean
Rank
Mann-
Whitney U
Wilcoxon
W Significance
Price of livestock Esomalit 8 7.31 22.5 58.5 0.3
Eturkanait 8 9.69
Consistency in buying livestock Esomalit 8 7.13 21 57 0.22
Eturkanait 8 9.88
Trust worthiness Esomalit 8 8.81 29.5 65.5 0.79
Eturkanait 8 8.19
Cash handling Esomalit 8 9.19 26.5 62.5 0.56
Eturkanait 8 7.81
Friendly negotiation Esomalit 8 6.56 16.5 52.5 0.09
Eturkanait 8 10.44
Number of informant groups=8
Figure 3: Mean ranks and significance values for tribal classification and preference of traders in four adakars of Loima Division, Turkana District, 2002/2003.
4.1.2.2 Classification and preference based on how and where traders operate
(marketing system of operation)
Figure 4 shows the summarized matrix-scoring diagram for livestock trader-qualities
based on how and where they buy livestock (the system they use). The results show a
good agreement between the 8 informant groups, for the 5 qualities considered, with
critical values of W ranging from W=0.810 to W=0.875. Lo anok was strongly associated
with the five qualities. Lo edukan was moderately associated with the five qualities while
Lo angakejen did not receive high scores for any of the qualities relative to other types of
traders.

55
Further probing indicated that Lo edukan was a next alternative in the absence of Lo
anok. However, his substitution and preference was dictated by distance between a shop
establishment and location of livestock camp. Livestock owners that were very far from a
shop preferred dealing with Lo angakejen although his scope was limited by the quantity
and sizes of commodities he carried (by hand), his relative affinity to barter and poor
prices for livestock. On pricing, a competitive price offered by Lo anok was as a result of
them being many in the market place.
Consistency of buying livestock was strongly associated with Lo anok. However, his
presence was more realized during a market day (as seen in Moroto market). He acted as
a destination for livestock brought by producers, Lo edukan and Lo angakejen. Lo
angakejen was described as being in business when he has sold an animal from his herd
or when he has stolen and sold someone’s animal (a thief), and therefore displayed no
distinctive difference from an ordinary livestock keeper.
Despite the extensive despise on Lo angakejen that was evident across informant groups,
he could not miss a score because of his constant presence within the people, reducing
livestock owners’ distance to markets, not discriminating the type and size of animal he
wanted, being strategic in supply of commodities (though the sizes and quantities were
small) and always being a last resort in the absence of other types of traders. Though
pronounced unskilled, he must have had tactics of going about his business, in his small
way.
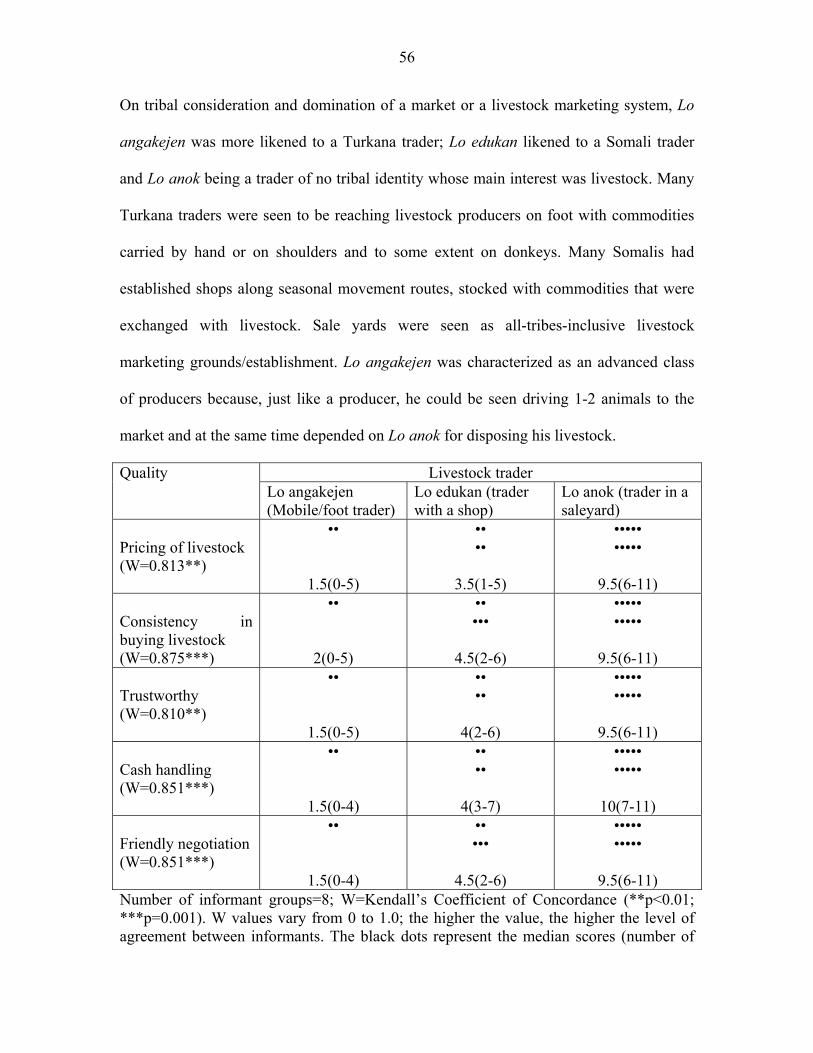
56
On tribal consideration and domination of a market or a livestock marketing system, Lo
angakejen was more likened to a Turkana trader; Lo edukan likened to a Somali trader
and Lo anok being a trader of no tribal identity whose main interest was livestock. Many
Turkana traders were seen to be reaching livestock producers on foot with commodities
carried by hand or on shoulders and to some extent on donkeys. Many Somalis had
established shops along seasonal movement routes, stocked with commodities that were
exchanged with livestock. Sale yards were seen as all-tribes-inclusive livestock
marketing grounds/establishment. Lo angakejen was characterized as an advanced class
of producers because, just like a producer, he could be seen driving 1-2 animals to the
market and at the same time depended on Lo anok for disposing his livestock.
Livestock trader Quality Lo angakejen (Mobile/foot trader)
Lo edukan (trader with a shop)
Lo anok (trader in a saleyard)
Pricing of livestock (W=0.813**)
••
1.5(0-5)
•• ••
3.5(1-5)
••••• •••••
9.5(6-11)
Consistency in buying livestock (W=0.875***)
••
2(0-5)
•• •••
4.5(2-6)
••••• •••••
9.5(6-11)
Trustworthy (W=0.810**)
••
1.5(0-5)
•• ••
4(2-6)
••••• •••••
9.5(6-11)
Cash handling (W=0.851***)
••
1.5(0-4)
•• ••
4(3-7)
••••• •••••
10(7-11)
Friendly negotiation (W=0.851***)
••
1.5(0-4)
•• •••
4.5(2-6)
••••• •••••
9.5(6-11)
Number of informant groups=8; W=Kendall’s Coefficient of Concordance (**p<0.01; ***p=0.001). W values vary from 0 to 1.0; the higher the value, the higher the level of agreement between informants. The black dots represent the median scores (number of

57
stones) that were used during the matrix scoring. The minimum and maximum limits are shown in parenthesis. Figure 4: Summarized matrix scoring of livestock trader-qualities in four adakars of Loima Division, Turkana District (May/July 2003).
4.1.3 Preference for different types of Livestock marketing systems
Figure 5 shows summarized matrix scoring diagram for marketing systems-qualities.
There was very good agreement between the 8 informants on all the 5 qualities used in
the matrices to compare the 5 marketing systems. Akoros and Eogesen systems received
high scores in all the 5 qualities, with Akoros leading in scores. Edukan was moderately
associated with all the qualities while Ngakejen and Akisiecha received very low scores.
Akisiecha was almost exempted from scoring with the view that, it was pastoralists’
traditional way of exchange. They were satisfied with it since time immemorial and could
not be compared with the other four modern and commercial-oriented systems. Akisiecha
was likened to someone’s livestock herd and being the “mother” of the other systems.
This was because animals from this system entered the other systems either through
livestock owners themselves or Ngakejen traders who didn’t appear different from
producers.
From observation, Eogesen seemed to have faded from memories of some informants.
However, diverse age structure of informants present during the scoring provided an
own-learning environment. The elderly individuals (who witnessed auctions) were very
instrumental in revitalizing memories of others. Informants repeatedly mentioned some
weak points about Eogesen. First, it disappeared several years ago and its reintroduction

58
was uncertain. Secondly, price setting based on a second party was not satisfying.
Thirdly, its irregularity was not uncommon. Fourthly, it was based on poll tax (during
colonial time) and Harambee (post-colonial taxation system) that was not a good
precondition to necessitate sale of livestock. Despite the above setbacks, they were liked
for standardized (somehow controlled) prices of livestock, being conducted closer to
production areas, minimal price cartels and brokering, reliability during drought,
wholesale purchases, shorter bargaining time, and absorbing all types, ages and sexes of
livestock.
Compared to Eogesen, Akoros discriminated on the sex and age and, to some extent type
of livestock required in the market; were not or never established in the division
(reference based on those outside the division), encouraged and promoted brokers (one
cannot know true traders), exploitative during drought (offer very low prices),
unpredictable price changes, unsteady number of livestock buyers over time, long
negotiation time, far away from production areas and, introduction of unexplained fee
known as county council cess. Relative to other systems, Ngakejen was considered by
informants as very exploitative and could only attract insincere traders and sellers. Most
of the sellers were explained to be wrongdoers who spent most of their time in hiding
(thieves) or young herdsmen who sold livestock without parents’ consent or approval, for
their own leisure.
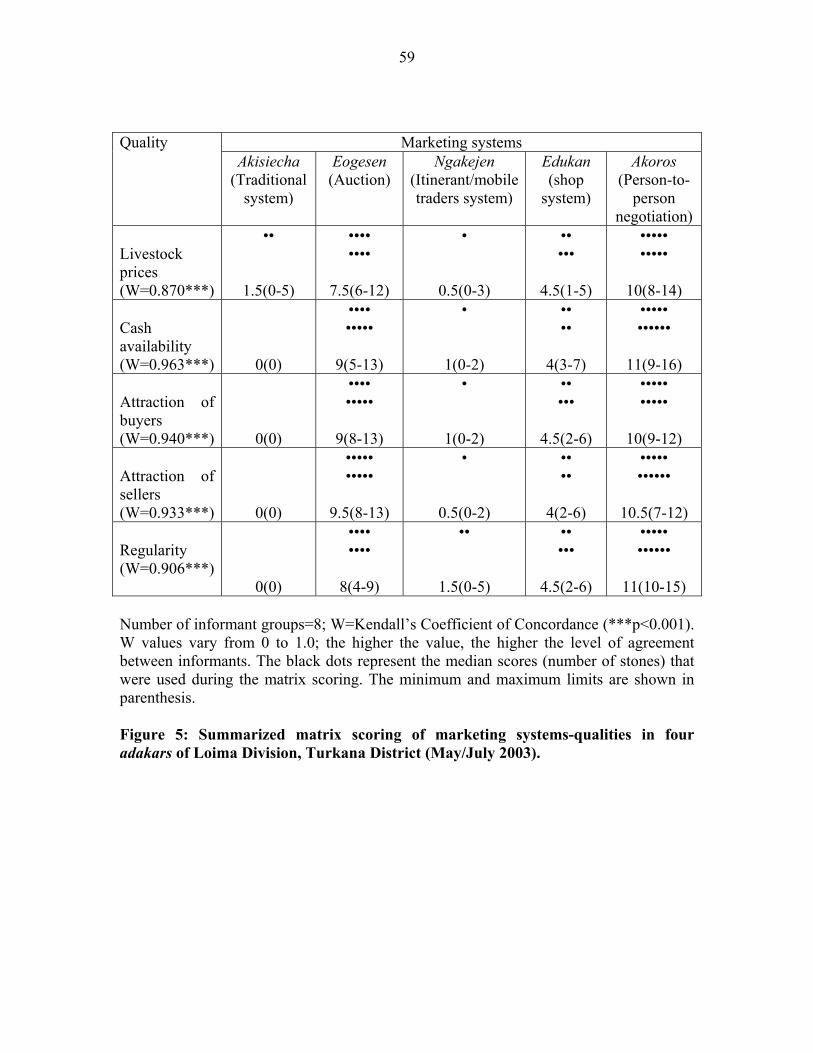
59
Marketing systems Quality Akisiecha
(Traditional system)
Eogesen (Auction)
Ngakejen (Itinerant/mobile traders system)
Edukan (shop
system)
Akoros (Person-to-
person negotiation)
Livestock prices (W=0.870***)
••
1.5(0-5)
•••• ••••
7.5(6-12)
•
0.5(0-3)
•• •••
4.5(1-5)
••••• •••••
10(8-14)
Cash availability (W=0.963***)
0(0)
•••• •••••
9(5-13)
•
1(0-2)
•• ••
4(3-7)
••••• ••••••
11(9-16)
Attraction of buyers (W=0.940***)
0(0)
•••• •••••
9(8-13)
•
1(0-2)
•• •••
4.5(2-6)
••••• •••••
10(9-12)
Attraction of sellers (W=0.933***)
0(0)
••••• •••••
9.5(8-13)
•
0.5(0-2)
•• ••
4(2-6)
••••• ••••••
10.5(7-12)
Regularity (W=0.906***)
0(0)
•••• ••••
8(4-9)
••
1.5(0-5)
•• •••
4.5(2-6)
••••• ••••••
11(10-15)
Number of informant groups=8; W=Kendall’s Coefficient of Concordance (***p<0.001). W values vary from 0 to 1.0; the higher the value, the higher the level of agreement between informants. The black dots represent the median scores (number of stones) that were used during the matrix scoring. The minimum and maximum limits are shown in parenthesis. Figure 5: Summarized matrix scoring of marketing systems-qualities in four adakars of Loima Division, Turkana District (May/July 2003).

60
4.2 HERDERS’ PERCEPTIONS OF CASH INCOME SOURCES WITH SPECIAL
REFERENCE TO LIVESTOCK MARKETING AS SOURCE OF CASH
4.2.1 Sources of cash income with special reference to livestock
Figure 7 and Table 1 show the mean annual proportion of cash of important sources of
income in four adakars of Loima Division. Mean annual cash proportion associated with
four types of livestock in four adakars of Loima Division is presented in Figure 6. The
major sources of cash income as perceived by herders were, in a decreasing order,
livestock (58.7%), borrowing (12.9%), sale of livestock products (9.7%) and labour, gold
mining and hunting combined (5.5%). Business appeared the least source of cash income,
contributing a proportion of 2.4%. Mean proportion of others (minor sources of income)
was observed to be exaggerated by tendency of informants to reduce proportion of cash
in the main sources of income in a bid to display a state of suffering that would otherwise
attract a form of assistance. On further probing, the informants explained that, most of the
cash they got from these sources was for family use, including cash from business.
Among the four species of livestock that were sold for cash in the year 2002/2003, goats
emerged the primary source of cash with mean annual cash proportion of 46.39% while
donkeys appeared the least source (3.1%). The mean annual cash proportions from
camels and cattle were 5.01% and 4.15% respectively. There was no significant
difference in the relative proportions of cash from the four species of livestock (goats,
cattle, camels and donkeys), between adakar, gender groups and wealth groups.
Informants explained that large proportion of income from livestock emanated from sale

61
of goats mainly because of their large proportions in total population of livestock, easy
disposability due to their small size, and availability of markets. Markets of goats were
available and could be accessed by all the four adakars. However, there were complaints
that, there were no organized livestock markets in the division except for the mobile
traders and the shopkeepers. People could travel long distances to reach competitive
livestock markets outside the division. The farthest of these markets were cattle, camels
and donkeys markets. Cattle were mostly sold in Moroto market in Uganda; camels sold
in Kakuma market where they were in high demand by the refugees while donkeys were
sold at Amakuriat market in West Pokot District, Kenya. Sale of large proportions of a
certain type of large stock (donkeys, cattle and camels) was reported to be largely
dependent on proximity of the adakar to the above particular markets following its
seasonal migration pattern. Very long distances to markets was a major constraint
curtailing the pastoralists’ will to sell large stock as compared to distances covered to
access markets for small stock. Appendix 1 shows significance levels between adakar,
gender and wealth groups of sources of cash income and Appendix 2 shows mean annual
cash proportion (%) of sources of cash income.

62
-20
-10
0
10
20
30
40
50
60
70
Goats Cattle camels Donkeys
Livestock species
Mea
n an
nual
cas
h pr
opor
tion
(%)
and
95%
CI
Adakar Natuba Adakar Kicono Adakar Acemie Adakar Aporon
Figure 6: Mean annual cash proportion per adakar of livestock as a source of cash in four adakars of Loima Division, Turkana District (2002/2003).
Table 1: Mean annual cash proportion (%) of important sources of income in four adakars of Loima division, Turkana District (2002-2003).
SOURCE OF CASH INCOME N MEANCP(%)
Goats 72 46.39Cattle 72 4.15
Camels 72 5.01Donkeys 72 3.1
Labour 72 1.94
Gold mining 72 2.65Borrowing 72 12.88
Hunting and gathering 72 0.92Livestock products 72 9.71
Business 72 2.43Others 72 10.82
Key: N Number of individual informants MEANCP Mean cash proportion associated with a source of income.

63
10.8%
2.4%
9.7%
12.9%
5.5%
58.7%
Others
Business
Livestock products
Borrowing
Labour,gold,hunting
Livestock
Figure 7: Mean annual cash proportion (%) of important sources of income in four adakars of Loima division, Turkana District (2002-2003)
4.2.2 Cash proportions of different sources of income: Comparing adakars.
The mean annual cash proportion per adakar of important sources of income is presented
in Figure 8. Between the four adakars units of Loima division, there was no significant
difference in the relative proportions of cash from sale of livestock (goats, cattle, camels
and donkeys), labour, gold mining, borrowing, hunting and gathering and sale of
livestock products. Business showed significant difference (P<0.05) in the proportion of
cash between the four adakar. Adakar kicono had the largest mean proportion of cash

64
from business (6.22%). The adakar was closer to a major trading center in Loima
division (Namoruputh trading center) and women were organized in to business groups.
Labour, gold mining and hunting and gathering were observed to be sources of cash
income for those adakars that were closer to where the activity (Casual work) and
resources (gold mining, hunting and gathering) were found. Loima ranges were observed
to be grossly rich in biodiversity and minerals. Gold deposits were found in Mt. Moroto
in Uganda and people from Loima Division could access these from the eastern side
where they were bordering. VSF-B was sinking water sand dams in Loima Division and
this provided the community with additional cash income through providing casual
labour. Therefore, projects that seek to develop an area could seriously involve the local
people in order to partly boost their source of cash and there hence their livelihood. Milk
was mainly sold in urban settlements around the grazing areas and mostly in the rainy
season.

65
-20-10
01020304050607080
Livestock Labour, Goldand hunting
Borrowing Livestockproducts
Business Others
Sources of income
Mea
n an
nual
cas
h pr
opor
tion
(%)
and
95%
CI
Adakar Natuba Adakar Kicono Adakar Acemie Adakar Aporon
Figure 8: Mean annual cash proportion (%) per adakar unit of important sources of income in four adakars of Loima division, Turkana District (2002-2003)
4.2.3 Cash proportions of different sources of income: Gender groups’ comparison.
Figure 9 shows the mean annual cash proportions per gender group, of important sources
of income. Between men and women there was no significant difference in mean annual
cash proportions for the rest of cash income sources except for business where significant
difference (P=0.05) was observed. Women recorded a higher proportion of cash from
business (3.97%) compared to men (0.89%). Between men and women, differences in the
proportions of cash from various sources of income could be compromised by the
consultative nature of pastoral men and women in almost everything that comes in and
goes out of the family.

66
-20-10
01020304050607080
Livestock Labour, Goldand hunting
Borrowing Livestockproducts
Business Others
Source of income
Mea
n an
nual
cas
h pr
opor
tion
(%)
and
95%
CI
Men Women
Figure 9: Mean annual cash proportion (%) per gender group of important sources of income in four adakars of Loima division, Turkana District (2002-2003)
4.2.4 Cash proportions of different sources of income: Wealth groups’ comparison.
Figure 10 shows the mean annual cash proportions per wealth group of important sources
of income. Cash proportions from different sources of income as perceived separately by
the rich, medium class and the poor were not significantly different. Though differences
in total livestock holding (both in type and proportions) between wealth groups were
expected to partly dictate for differences in the proportions of livestock sold for cash, this
was not revealed. On further probing, particularly in relation to sale of large stock, rich
and medium class informants were mentioning that, although they had a large proportion
of large stock in their herds, they sold a few for cash not because they were to retain the
rest in the herd but because most of them that could be sold later were coincidentally
raided. This was possible in such pastoral area where livestock populations were
constantly threatened by raids, uncontrolled severe disease outbreaks and recurrent

67
droughts. This could result in a “forced” uniform mean cash proportion of livestock types
sold between wealth groups. Therefore in these areas such factors as raids, drought and
disease could constantly disorganize wealth status among individuals and consequently
destabilize the community’s traditional wealth structures and ranking procedures. In spite
of lack of significant differences between wealth groups, the poor had a larger proportion
of cash income from goats, donkeys, hunting and gathering and business whereas the rich
and medium class had a large proportion of cash income from cattle, camels, labour and
borrowing.
-20-10
01020304050607080
Livestock Labour,Gold,
hunting
Borrowing Livestockproducts
Business Others
Source of income
Mea
n an
nual
cas
h pr
opor
tion
(%) a
nd 9
5%C
I
Rich Medium class Poor
Figure 10: Mean annual cash proportion (%) per wealth group of important sources of income in four adakars of Loima division, Turkana District (2002-2003)

68
4.3 LIVESTOCK OFF-TAKES
4.3.1 Existing off take with regard to species, age and sex of animals sold
Commonly sold species of livestock were goats, cattle, camels and donkeys. Ngikamatak
were not selling sheep owing to low numbers due to the effect of environment and
traditional uses. Traditionally, sheep were used for treating some human ailments, good
source of fat for family use, its skin used for making women wear, delicacy for in-laws
during courtship and actual wedding ceremony, used for cleansing wrong doers,
slaughtered for a woman who has just delivered and also in shaving ceremonies. Sale of
donkeys was restricted by their use for transport, medicinal value and low numbers kept.
Figures 11-14 show the mean annual proportion (%) of age-sex categories of goats,
cattle, camels and donkeys sold. Most preferred age-sex categories of goats sold were
Ebilarengoit (8.72%; 8.72/100) and Lodongong (6.82%; 6.82/100); in cattle were Emong
(1.29%; 1.29/100) and Aite Nakolup (0.33%; 0.33/100); in camels were Lodongong
(0.65%; 0.65/100) and Namojong (0.32%; 0.32/100); in donkeys were Asikiria (0.64%;
0.64/100) and Loketepan (0.38%; 0.38/100). Gender and wealth groups did not show any
significant differences in all categories of goats, cattle, camels and donkeys sold.
However, adakar groups displayed significant differences in the sales of some age-sex
categories of goats (Naminawoi=P<0.01; Ebilarengoit= P<0.001) and camels
(Loangitou=P<0.05). Adakar Acemie reported the lowest proportion of Naminawoi
(1.94%; 1.94/100) sold in the past one year while adakar Natuba reported the lowest
proportion of Ebilarengoit (2.83%; 2.83/100) sold in the past one year. In camels, the

69
lowest proportion of Loangitou (0%) sold last year was reported by adakar Aporon.
Some individuals in the respective adakar could have underestimated the proportional
sales of some age-sex categories of animals. Appendix 3, 4 and 5 show grand mean
annual proportion (%) expressed as proportion of total livestock population units,
significance levels, mean annual proportion (%) per adakar, gender and wealth groups
expressed as proportion of total livestock population units of age-sex categories of goats,
cattle, camels and donkeys sold respectively.
0
2
4
6
8
10
12
Naminawoi Lodongong Loangitou Ebilarengoit Akale
Age-sex categories of goats
Mea
n an
nual
pro
porti
on s
old
and
95%
CI
Figure 11: Mean annual proportion (%) of age-sex categories of goats sold in four adakars of Loima Division, Turkana District, 2002/2003 (expressed as proportion of total livestock population units).

70
-0.4
-0.2
0
0.2
0.4
0.6
0.8
1
1.2
1.4
1.6
Namojong Emong Loangitou Aite Nakolup Emanik
Age-sex categories of cattle
Mea
n an
nual
pro
porti
on s
old
and
95%
CI
Figure 12: Mean annual proportion (%) of age-sex categories of cattle sold in four adakars of Loima Division, Turkana District, 2002/2003 (expressed as proportion of total livestock population units).
0
0.1
0.2
0.3
0.4
0.5
0.6
0.7
0.8
Lodongong Loangitou Echekemuk Akaal Namojong Lopuuwa
Age-sex categories of camels
Mea
n an
nual
pro
porti
on s
old
and
95%
CI
Figure 13: Mean annual proportion (%) of age-sex categories of camels sold in four adakars of Loima Division, Turkana District, 2002/2003 (expressed as proportion of total livestock population units).

71
-0.2
-0.1
0
0.1
0.2
0.3
0.4
0.5
0.6
0.7
0.8
Lodongong Asikiria Loketepan Loangitou
Age-sex categories of donkeys
Mea
n an
nual
pro
porti
on s
old
and
95%
CI
Figure 14: Mean annual proportion (%) of age-sex categories of donkeys sold in four adakars of Loima Division, Turkana District, 2002/2003 (expressed as proportion of total livestock population units). Species Age-sex category Local name English translation Goats Naminawoi Male or female kid upto 4 months old Lodongong Castrated buck between 1 and 2 years Loangitou Young uncastrated male between 4 and 9 months Ebilarengoit Castrated buck over 2 years old Akale Young female between 4 and 9 months Cattle Namojong Old cow past reproductive age Emong Castrated bull of over 2 years Loangitou Uncastrated bull between 6 months and 1 year Aite Nakolup Infertile cow Emanik Breeding bull Camels Lodongong Castrated male of over 2 years Loangitou Uncastrated male between 6 months and 1 year Echekemuk Young male or female between 4 and 12 months Akaal Breeding female Namojong Female past reproductive age Lopuuwa Uncastrated male between 1 and 2 years Donkeys Lodongong Castrated male of over 2 years Asikiria Breeding female Loketepan Breeding male Loangitou Uncastrated male between 6 months and 1 year

72
4.3.2 Preference for selling different types of stock (species and their age sex
categories).
Informants reiterated that selling of a certain type of livestock depended on availability of
its market/ buyers, season of the year, consistent presence in the herd and therefore its
ability to counter emergencies, size and disposability, closeness to the owner, type of
commodity to be obtained, numbers and structure in the herd, type and magnitude of
problem (s) experienced by the family, traditional obligations, wealth status of an
individual, its reproductive and production status, and on whether one needs cash or
commodities or another type of stock, presence of different types of livestock in the herd.
4.3.2.1 Goats
There was no organized market for goats in Loima Division. Goats were the main recipes
for commercial livestock trade. Immature goats were bought both in cash and barter
while mature ones (mainly males) were bartered. Mature males were mostly sold in the
dry season to cater for increasing food demand while immature ones were sold
throughout the year to cater for minor family needs such as tobacco, sheets, shoes,
veterinary medicines and beads. Sale of mature females and males was restricted by their
role in breeding and thus being a source of future herd. However, they could be sold
when they are many in the herd and during extreme starvation occasioned by prolonged
drought despite low prices offered. Cultural obligations least impeded sale of goats.

73
There was complaint over availability of market-oriented age-sex categories of goats in
the herd due to their frequent sales. Almost all age-sex categories of goats were readily
sold, either through traditional system or directly to commercial systems of trade.
4.3.2.2. Donkeys
There was no organized market available for donkeys in Loima Division. Donkeys were
mostly sold in Moroto market in Uganda and Amakuriat market in West Pokot District.
Sale of large stock like donkey meant the family had many problems to settle. They could
also be sold to complement sale of small stock so as to avoid depletion or imbalance of
herd structure for small stock. Their use for transport, low numbers, recent tremendous
reduction in using them for transporting business commodities and their medicinal value
affected their market supply. Due to unreliability of their markets, they mainly went
through the traditional system by being exchanged for goats and bulls that were readily
sold.
4.3.2.3 Cattle
There was no organized market for cattle in Loima Division. They were mainly sold in
Moroto market in Uganda and in Kakuma. Just like donkeys, such large stock could be
sold to cover for many biting family problems. Immature cattle mainly entered traditional
marketing system while the mature ones (non-breeding males and females) dominated
commercial trading systems directly or indirectly through the traditional system. Mature

74
cattle (non-breeding males and females) were exclusively sold during the dry season to
purchase food stuffs and, when sold in the wet season it were for purchase of veterinary
medicines, paying school fees and medical bills and beads for cultural rituals. Though
traditionally, sale of breeding males and females was restricted, their sales could be
occasioned by starvation during prolonged droughts. Cultural values impacted negatively
on the sale of cattle. Emanik Lomojong (old breeding male) was never sold due to its vital
role in feasting at home; Aite Nakolup (Infertile cow) was a delicacy for home
consumption due to its good body condition, Emong/Emakudoit (castrated male) was a
source of pride and status to the owner.
4.3.2.4 Camels
There was no organized market for camels in the Division. They were mainly sold in
Moroto Market in Uganda and in Kakuma. Their sale was dictated by the magnitude of
family problems. Immature camels were mostly traditionally marketed while mature ones
(non-breeding) dominated commercial systems. Immature camels were mainly bartered
for beads. Sale of non-breeding mature males was mainly during the dry season (to cater
for food requirements) while their sale during wet season was for purchase of veterinary
medicines, paying school fees and medical expenses, buy beads for ladies and to buy
food for performing cleansing rituals on children. Cultural values impeded sale of camels.
They were a reliable source of milk for the family even during dry season. Ekaal
Lodongong/ Elekedeit (castrated male) was for major feasts at home, source of pride and
status to the owner and could be exchanged for nice females of breeding age.

75
4.3.3 Existing off take with regard to proportional measure of herds
Figures 15-18 show the mean annual proportion (%) in herd; and Table 2 shows the mean
annual proportion (%) sold of goats, cattle, camels and donkeys. It was observed that,
goats had the largest proportion (60.9%; 60.9/100) of livestock in the total population,
followed by camels (17.9%; 17.9/100) and then Cattle (11.5%; 11.5/100). Donkeys
recorded the least proportion (9.7%; 9.7/100). In the past one year, goats were mostly
sold (25.4%; 25.4/100) followed by cattle (1.99%; 1.99/100) while the least sold
livestock type were donkeys (1.26%; 1.26/100). Between adakar and gender groups there
was no significant difference in the proportion of goats, cattle and camels in the herd.
However differences were shown between wealth groups (goats=P<0.001; cattle=P<0.05;
camels=P<0.001). Though adakar and wealth groups did not show significant differences
in the proportion of donkeys in the herd, gender groups showed significant difference
(P<0.05) with women reporting a higher proportion (11.31%; 11.31/100) than men
(8.08%; 8.08/100). The proportion of goats in the herd was higher among the poor while
the proportion of large stock (cattle, camels and donkeys) was higher among the rich and
medium class. Between adakar, gender and wealth groups, no significant differences
were observed in the proportion of goats, cattle, camels and donkeys sold in the past year.
However, slight differences indicated that the poor had sold a large proportion of goats
and donkeys whereas the rich and medium class had sold more of camels and cattle than
the poor. Appendix 6 shows the significance levels and Appendix 7 shows the mean
annual proportion (%) of goats, cattle, camels and donkeys sold.
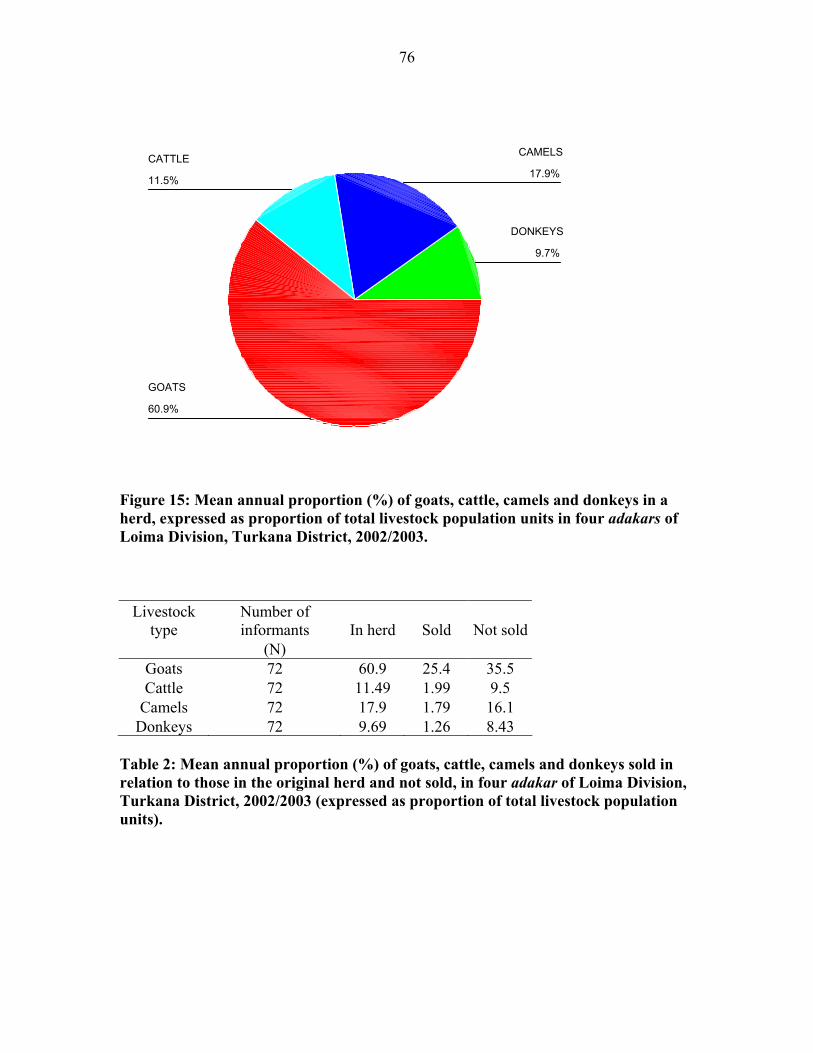
76
9.7%
17.9%11.5%
60.9%
DONKEYS
CAMELSCATTLE
GOATS
Figure 15: Mean annual proportion (%) of goats, cattle, camels and donkeys in a herd, expressed as proportion of total livestock population units in four adakars of Loima Division, Turkana District, 2002/2003.
Livestock
type Number of informants In herd Sold Not sold
(N) Goats 72 60.9 25.4 35.5Cattle 72 11.49 1.99 9.5
Camels 72 17.9 1.79 16.1Donkeys 72 9.69 1.26 8.43
Table 2: Mean annual proportion (%) of goats, cattle, camels and donkeys sold in relation to those in the original herd and not sold, in four adakar of Loima Division, Turkana District, 2002/2003 (expressed as proportion of total livestock population units).

77
-100
102030405060708090
Goats' herd Cattle herd Camel herd Donkeys herd
Livestock type
Mea
n an
nual
pro
porti
on (%
) and
95
%C
I
Adakar Natuba Adakar Kicono Adakar Acemie Adakar Aporon
Figure 16: Mean annual proportional measure (%) of goats, cattle, camels and donkeys expressed as proportion of total population of animals per adakar group, in four adakars of Loima Division, Turkana District, 2002/2003.
-10
0
10
20
30
40
50
60
70
80
Goats herd Cattle herd Camels herd Donkeys herd
Livestock type
Mea
n an
nual
pro
porti
on (%
) and
95%
CI
Men Women

78
Figure 17: Mean annual proportional measure (%) of goats, cattle, camels and donkeys expressed as proportion of total livestock population units per gender group, in four adakars of Loima Division, Turkana District, 2002/2003.
-100
102030405060708090
Goats herd Cattle herd Camels herd Donkeys herdLivestock type
Mea
n an
nual
pro
porti
on (%
) an
d 95
%C
I
Rich Medium class Poor
Figure 18: Mean annual proportional measure (%) of goats, cattle, camels and donkeys expressed as proportion of total livestock population units per wealth group, in four adakars of Loima Division, Turkana District, 2002/2003.
4.3.4 Existing off-take with regard to seasonality of sales
4.3.4.1 Seasonal variation in donkeys’ age-sex categories’ off takes
Figure 19 summarizes seasonal variation in the sale of different age-sex categories of
donkeys. There was good agreement between the four informant groups for seasonal
sales of Loketepan (W=0.750), Lodongong (W=0.750) and Asikiria (W=0.750). The
informant groups weakly agreed on the seasonal sale of Loangitou (W=0.250). This weak
agreement was rather insignificant. Some informant groups indicated that Loangitou was
never sold because it was a source of future breeding males and additionally, was not

79
accepted by traders because of its size and age; while some informant groups insisted that
it is commonly sold. This might have contributed to zero median score across the
seasons. Loketepan, Lodongong and Asikiria were commonly sold during Nakamu,
moderately sold during the Nait and least sold during Nakiporo. This was explained by
informant groups to be corresponding to the trend of food shortage that was high during
Nakamu, starts increasing at Nait and less felt during Nakiporo. Lodongong was either
sold alive to butchers or slaughtered by the owner in a local butchery (under a tree) and
meat sold by “hand” weighing. Loketepan and Asikiria were mostly sold to those with
intentions to develop a donkey’s herd. The donkeys’ population in the area was relatively
low and more threatened by raids from the neighbours (pokots of Kenya and the
Karamojong of Uganda). Donkeys were important to livestock owners during seasonal
movements (for carrying luggage) and also to traders (for carrying trade commodities
while following pastoralists wherever they move).
Donkeys age-sex categories
Nakiporo (Rainy season)- March-July
Nait (Interphase)-August
Nakamu (Dry season)- Sept-February
Loangitou (W=0.250ns)
0(0-1)
0(0-2)
0(0-12)
Loketepan (W=0.750*)
●
0.5(0-1)
●● ●● 3.5(0-6)
●●●● ●●●●● 9(0-12)
Lodongong (W=0.750*)
● 0.5(0-1)
● ●● 3(0-6)
●●●● ●●●●● 8.5(0-14)
Asikiria (W=0.750*)
● 1(0-3)
●● ●● 3.5(0-4)
●●●● ●●●●● 9(0-11)

80
Number of informant groups=4; Kendall’s coefficient of concordance (nsp=not significant; *p=0.05). W values vary from 0 to 1.0, the higher the value, the higher the level of agreement between the informant groups. The black dots represent the median scores (number of stones) that were used during the construction of the seasonal calendar. The minimum and maximum limits are shown in parenthesis. A higher number of dots indicated a relatively strong association between an age-sex structure of a species and season, whereas a low number of dots indicated a weak association. Figure 19: Summarized seasonal calendar for donkeys’ age-sex categories’ off-take in four adakars of Loima Division, Turkana District (2002/2003).
4.3.4.2 Seasonal variation in goats’ age-sex categories’ off takes
Figure 20 summarizes seasonal variation in the sale of various age-sex categories of
goats. Analysis of matrix scores demonstrated weak agreement between the four
informant groups for seasonal sale of Naminawoi (W=0.250). Loangitou received varied
scores and the level of agreement between informant groups was very poor (W=0.000).
The weak agreement and very poor agreement for seasonal sale of Naminawoi and
Loangitou respectively, was not significant. The four informant groups strongly agreed
on seasonal sales of Lokidingos/ Lodongong (W=1.000), Ebilarengoit/ Epachakitoit
(W=0.950) and Akale (W=0.750). Naminawoi and Loangitou were being sold throughout
the year, while Ebilarengoit, Lokidingos and Akale were mostly sold during Nakamu
when food requirements were explicitly high. Food requirements begin building during
Nait and this explained why sale of Ebilarengoit, Lokidingos and Akale started rising
during Nait. On further probing, sale of Naminawoi and Loangitou was mainly to obtain
bartered small items such as shoes, clothes, beadware for ladies, tobacco and to obtain
little cash for purchasing sugar and tea leaves. Cash was sometimes given for Naminawoi
and Loangitou because their prices were low and itinerant traders could afford offering

81
the corresponding little cash. During restocking, that is, after a severe drought of
1999/2001, Naminawoi and Loangitou were in high demand. During these moments, cash
was readily available for their purchase.
Ordinarily, traders could prefer buying Naminawoi (both male and female) when they
observed that, livestock owners were not ready to sell goats of market size especially
during Nakiporo. The traders take Naminawoi round the livestock camps to exchange for
market-desired mature bucks. This was traders’ mechanism to ensure that goats were
always available in the market (with ready market) at moments when pastoralists are
resistant to sell market-oriented types of goats, just because their food requirements are
low, especially during Nakiporo and during drought mitigation interventions when food
relief was distributed.
Akale in the context of this research referred to or combined all categories of females
sold, and commonly mentioned by informants were infertile females (Nakolup) and
females that had reached puberty (truly termed as Akale). Akale were the majority of
females sold and thus the name to also represent infertile females that were remotely
mentioned. In principle, females were rarely sold because they were a source of future
flock. However, infertile ones (Nakolup), though always rare in the flock, were
commonly sold to contribute to food requirements in the family especially during
Nakamu. Scores appearing in Nakiporo and Nait for Akale represented those that were
sold to traders who exchanged them with males of market size and age.
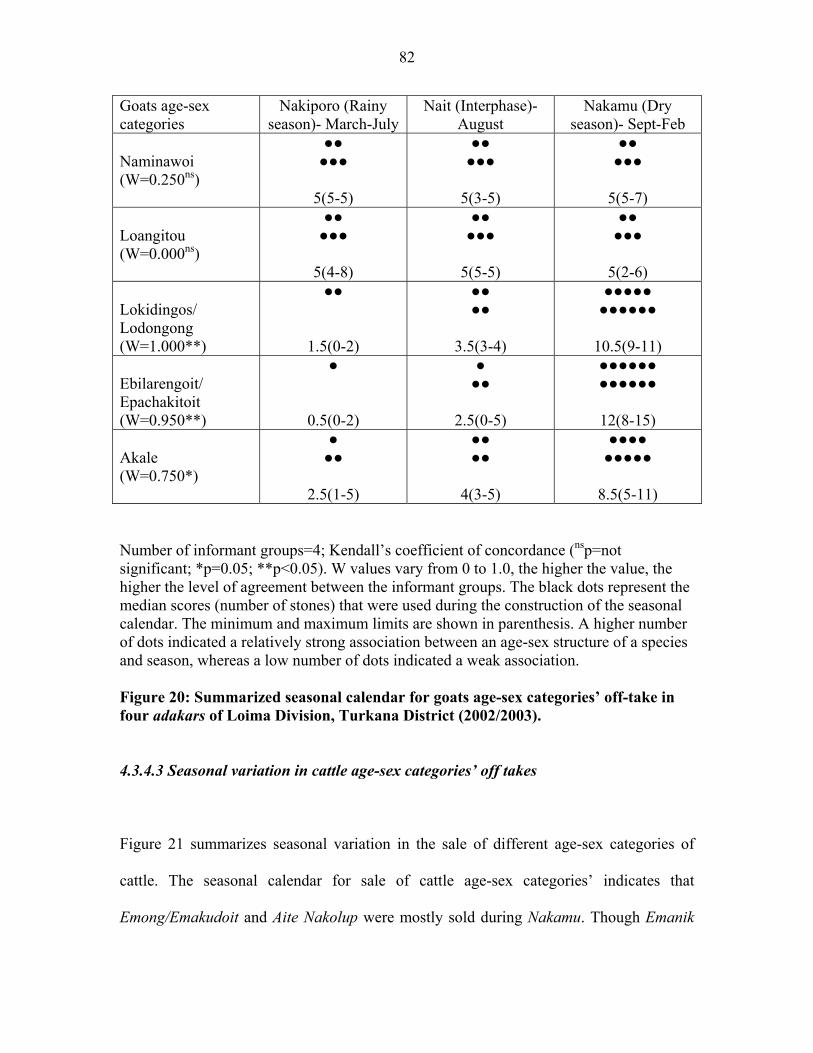
82
Goats age-sex categories
Nakiporo (Rainy season)- March-July
Nait (Interphase)- August
Nakamu (Dry season)- Sept-Feb
Naminawoi (W=0.250ns)
●● ●●●
5(5-5)
●● ●●●
5(3-5)
●● ●●●
5(5-7)
Loangitou (W=0.000ns)
●● ●●●
5(4-8)
●● ●●●
5(5-5)
●● ●●●
5(2-6)
Lokidingos/ Lodongong (W=1.000**)
●●
1.5(0-2)
●● ●●
3.5(3-4)
●●●●● ●●●●●●
10.5(9-11)
Ebilarengoit/ Epachakitoit (W=0.950**)
●
0.5(0-2)
● ●●
2.5(0-5)
●●●●●● ●●●●●●
12(8-15)
Akale (W=0.750*)
● ●●
2.5(1-5)
●● ●●
4(3-5)
●●●● ●●●●●
8.5(5-11)
Number of informant groups=4; Kendall’s coefficient of concordance (nsp=not significant; *p=0.05; **p<0.05). W values vary from 0 to 1.0, the higher the value, the higher the level of agreement between the informant groups. The black dots represent the median scores (number of stones) that were used during the construction of the seasonal calendar. The minimum and maximum limits are shown in parenthesis. A higher number of dots indicated a relatively strong association between an age-sex structure of a species and season, whereas a low number of dots indicated a weak association. Figure 20: Summarized seasonal calendar for goats age-sex categories’ off-take in four adakars of Loima Division, Turkana District (2002/2003).
4.3.4.3 Seasonal variation in cattle age-sex categories’ off takes
Figure 21 summarizes seasonal variation in the sale of different age-sex categories of
cattle. The seasonal calendar for sale of cattle age-sex categories’ indicates that
Emong/Emakudoit and Aite Nakolup were mostly sold during Nakamu. Though Emanik

83
was reported to be frequently sold during Nakamu, this was insignificant. Some groups
did not place any score for Emanik in any of the seasons, arguing that, Emanik was
mainly reserved for breeding. This resulted in zero minimum scores for Emanik across
the three seasons. However some informant groups explained that, Emanik could also be
sold when you have many in the herd and when you don’t have other types of animals of
market age and size. Lack of Emanik in the herd was not a major problem to some
informant groups because one could take his cows to a friend or neighbor’s herd to be
mated. Loangitou received varied scores throughout the year whereby many scores were
observed in Nakiporo. Further probing indicated that, Loangitou could not be commonly
sold during Nakamu because they appeared to be weak during this season. They were
sold (mainly bartered) during Nakiporo when they were strong so as to obtain luxury
commodities such as beads for ladies. Though in a minimal way, they could also be used
to purchase food. There was good agreement between the four informant groups for
seasonal sales of Emong/Emakudoit (W=1.000) and Aite Nakolup (W=0.929). Emanik
and Loangitou received varied scores and this resulted in insignificant moderate
agreement for seasonal sales of Emanik (W=0.464) and poor agreement for seasonal sales
of Loangitou (W=0.083).

84
Cattle age-sex categories
Nakiporo (Rainy season)- March-July
Nait (Interphase)- August
Nakamu (Dry season)- Sept-Feb
Emong/ Emakudoit (W=1.000**)
●●
2(1-3)
● ●●
3(3-4)
●●●●● ●●●●●
10(8-11)
Emanik (W=0.464ns)
0(0-1)
●
0.5(0-1)
●●● ●●●●
6.5(0-14)
Loangitou (W=0.083ns)
●●● ●●●
6(0-12)
● ●●
2.5(0-3)
●●
1.5(0-10) Aite Nakolup (W=0.929**)
●
1(0-2)
●●
1.5(1-2)
●●●●●● ●●●●●●●
12.5(11-14)
Number of informant groups=4; Kendall’s coefficient of concordance (nsp=not significant; **p<0.05). W values vary from 0 to 1.0, the higher the value, the higher the level of agreement between the informant groups. The black dots represent the median scores (number of stones) that were used during the construction of the seasonal calendar. The minimum and maximum limits are shown in parenthesis. A higher number of dots indicated a relatively strong association between an age-sex structure of a species and season, whereas a low number of dots indicated a weak association. Figure 21: Summarized seasonal calendar for cattle age-sex categories’ off-take in four adakars of Loima Division, Turkana District (2002/2003).
4.3.4.4 Seasonal variation in camels’ age-sex categories’ off takes
Seasonal variation in the sale of various age-sex categories of camels is summarized in
Figure 22. Analysis of scores demonstrated good agreement for seasonal variation in the
sale of Lodongong (W=0.750) and Lopuuwa (W=0.750). Age-sex categories for which
there was moderate agreement between the four informant groups were Loangitou
(W=0.500) and Akaal namojong (W=0.500). However, this moderate agreement was not

85
significant. Informant groups disagreed over the scoring of Echekemuk (W=0.250).
Echekemuk and Loangitou were observed to be sold throughout the year while
Lodongong, Lopuuwa and Akaal namojong were mostly sold during Nakamu. Some
informant groups could not place any score for seasonal variation in the sale of all camel
age-sex categories arguing that camels were never sold, resulting in zero minimum score
for every age-sex category across the seasons. On further questioning, they explained that
camels were few within their herds, there was no reliable market for camels and they
were very vital in provision of milk during dry season when production of other types of
livestock was impaired by scarcity of pasture and water. Akaal namojong was not sold
alive but slaughtered in open-air butchery (under a tree) where meat was sold by hand
weighing. No trader could buy Akaal namojong due to its age and poor body condition.
Camels age-sex categories
Nakiporo (Rainy season)- March-July
Nait (Interphase)- August
Nakamu (Dry season)- Sept-Feb
Echekemuk (W=0.250ns)
● ●●
3(0-5)
●● ●●
4(0-5)
●● ●●●
5(0-11)
Loangitou (W=0.500ns)
●
1(0-3)
● ●●
2.5(0-6)
●● ●●
3.5(0-7)
Lodongong (W=0.750*)
●
0.5(0-1)
●● ●●
3.5(0-5)
●●●●● ●●●●●
9.5(0-12)
Lopuuwa (W=0.750*)
●
1(0-1)
● ●●
2.5(0-4)
●●●●● ●●●●●●
10.5(0-12)
Akaal Namojong (W=0.500ns)
●
0.5(0-1)
●●
1.5(0-3)
●●● ●●●
5.5(0-11)

86
Number of informant groups=4; Kendall’s coefficient of concordance (nsp=not significant; *p=0.05). W values vary from 0 to 1.0, the higher the value, the higher the level of agreement between the informant groups. The black dots represent the median scores (number of stones) that were used during the construction of the seasonal calendar. The minimum and maximum limits are shown in parenthesis. A higher number of dots indicated a relatively strong association between an age-sex structure of a species and season, whereas a low number of dots indicated a weak association. Figure 22 Summarized seasonal calendar for camels’ age-sex categories’ off-take in four adakars of Loima Division, Turkana District (2002/2003).
4.4 LIVESTOCK MARKETING CONSTRAINTS
4.4.1 Livestock marketing constraints as perceived by herders, traders and
government livestock workers
Table 3 shows the four most important constraints to livestock marketing as perceived by
producers, traders and government livestock workers. In descending order, producers
gave high priority to low prices of livestock, long distances to markets, few livestock
buyers in markets and lack of cash as major problems affecting them in livestock
marketing. Traders in lower primary markets were mainly complaining about long
distances to markets, low working capital, high transport costs and low prices of
livestock. Traders in upper primary and secondary markets agreed on low working capital
as a major constraint affecting them in livestock trade. In the overall, priority problem
affecting livestock traders across types of livestock markets was low working capital.
Though producers had mentioned low prices as a major constraint affecting them in
livestock marketing, government livestock workers were for a different opinion that, the
major problems to producers were poor marketing infrastructure and lack of marketing
information. Traders and government livestock workers agreed on low capital as a major

87
problem affecting livestock traders. However, government livestock workers could not
leave behind poor marketing infrastructure and lack of marketing information as two
other major constraints affecting livestock traders. In search of a common livestock
marketing strategy that brings together producers and traders, government livestock
workers ranked poor marketing infrastructure and lack of marketing information as major
problems that need to be addressed in livestock marketing. Appendix 8 shows median
ranks of livestock marketing constraints affecting herders and traders as perceived by
government livestock workers whereas Appendix 9 shows the median ranks of livestock
marketing constraints as perceived by herders and traders themselves.
Table 3: Median ranks (range) of four most important livestock marketing constraints as perceived by herders, traders and government livestock workers in Loima Division, Turkana District (2002/2003). Rank Constraint Producers TLPM TUPM TSM TO GP GT G0 N=72 N=20 N=14 N=25 N=59 N=8 N=8 N=16
1 Prices Distance Capital Capital Capital Infrastructure Capital Infrastructure 1(1-5) 1(1-3) 1(1-5) 1(1-5) 2(1-5) 3.5(1-7) 1.5(1-3) 3(1-7)2 Distance Capital Buyers Transport Buyers Information Infrastructure Information 2(1-4) 2(1-4) 2(1-6) 2(1-7) 4(1-8) 4(2-7) 2(1-7) 4(1-7)3 Buyers Transport Producers Buyers Transport Buyers Information Distance 3(1-6) 4(1-8) 3.5(2-8) 3(1-7) 4(1-8) 4(2-8) 4(1-5) 5(3-8)4 Cash Prices Prices Information Diseases Distance Diseases Buyers 4(1-6) 5(1-8) 5(1-8) 4(1-6) 6(1-8) 4.5(3-8) 4.5(1-10) 5(2-10)
Key: N Number of informants Rank Order of priority; 1= Most important constraint; 4= Least important constraint TLPM Traders in lower primary markets TUPM Traders in upper primary markets TSM Traders in secondary markets TO Traders overall rank of constraints GP Government livestock workers perceptions of constraints affecting producers GT Government livestock workers perceptions of constraints affecting traders GO Government livestock workers overall rank (producers and traders inclusive)
88
4.5 HERDERS’ PREDICTION OF OFF-TAKE LEVELS IF MARKETING WAS
IMPROVED
4.5.1. General trend in off-take levels if marketing was improved.
Tables 4 and 5 show mean annual proportion (%) of livestock type in the herd, proportion
sold before marketing improves, proportion sold after marketing improves and
proportional change in sales. It was observed that the proportion of goats sold before and
after marketing improves was higher than of the other livestock types (25.4%; 25.4/100
or 41.7%; 25.4/60.9 before and 18.07%; 18.07/100 or 29.7%; 18.07/60.9 after). The
proportional change in goats’ sales when marketing improves was negative (-7.33%; -
7.33/100 or –12%; -7.33/60.9) reflecting a situation where, each adakar would reduce
sale of goats when marketing conditions improve and perhaps seek to sell more of other
types of livestock. The proportional change in sales of the other livestock species was
positive with camels taking a more positive proportional change (3.54%; 3.54/100 or
19.7%; 3.54/17.92). Between adakar, gender and wealth groups, there was no significant
difference in the proportion of goats, cattle, camels and donkeys sold before and after
marketing improves. Appendices 10-12 show significance levels, off-take predictions per
adakar, gender and wealth groups expressed as a proportion of total livestock population
units and off-take predictions per adakar, gender and wealth groups expressed as a
proportion of particular livestock species population, respectively.

89
Table 4: Mean annual proportion (%) of livestock type in the herd, proportion sold before marketing improves, proportion sold after marketing improves and proportional change in sales, expressed as a proportion of total livestock population units, in four adakar of Loima division, 2002/2003
Livestock type
N=Number of
informants
In total population
(%) Sold before (%) Sold after (%)Proportional change (%)
Goats 72 60.9 25.4 18.07 -7.33 Cattle 72 11.49 1.99 3.82 1.83
Camels 72 17.92 1.79 5.33 3.54 Donkeys 72 9.65 1.24 3.17 1.93
Table 5: Mean annual proportion (%) of livestock types sold before marketing improves, proportion sold after marketing improves and proportional change in sales, expressed as a proportion of population of particular livestock species, in four adakar of Loima division, 2002/2003
Livestock type
N=Number of
informants
In total population
(%) Sold before (%) Sold after (%)Proportional change (%)
Goats 72 60.9 41.7 29.7 -12 Cattle 72 11.49 17.3 33.2 15.9
Camels 72 17.92 10.0 29.7 19.7 Donkeys 72 9.65 12.8 32.9 20.1

90
5.0 DISCUSSION
Through mapping, the community defined some of the potential markets for livestock in
the Division and further produced criteria on which such premise could be established.
There was no organized livestock market in the division. Livestock market establishment
in pastoral areas is not uncommon but dilemmas based on pastoralists livestock
management system (seasonal movements in such of water and forage) have commonly
rendered such establishments redundant. In the division, during the wet season, livestock
were moved to the plains almost in close vicinity to urban settlements, whereas during
dry season, livestock was moved to high mountainous regions or even across
international borders thereby increasing distance to trading centers in the division.
Problem of distance is worsened by insecurity around livestock camps and also along
routes for driving animals to markets. This result in a situation where, during the dry
season, producers cannot easily access internal markets, poor body condition animals
cannot withstand stress due to trekking/hoofing to markets amid lack of water and pasture
along trek routes, starved pastoralists cannot stand the stress of walking for long
distances, traders have limited access to livestock, traders incur extra costs (overhead
costs) in venturing to reach livestock camps so as to buy livestock, and the general
economic fabric of the region weakens. This therefore implies that, in the efforts to
establish organized livestock markets within pastoral set-ups, seasonal mobility of
pastoralists need to be seriously considered to minimize its negative multiplier effect to

91
the structure and conduct of markets and to the economic well-being of the area.
Distances to internal markets could also be minimized by enhancing pastoralists access to
cross-border markets. However, this requires cross-border guidelines that prescribe
measures that enhance security to and in markets, and minimize inter-tribal or inter-
community conflict in markets. The study reveals that, livestock markets could easily be
accessible to traders and producers during the wet season. Stakeholders in the livestock
marketing chain should utilize such opportunity. Ambivalent pattern of low livestock
supply to markets by pastoralists during the wet season when demand by traders is high
could however impede utilization of this seasonal opportunity. Orre (2003) also reported
the same scenario in Marsabit markets. Mapping was also used by Eregae (2003) to
define a target area for establishment of veterinary private practice in Lapur Division of
Turkana District.
In Kenya, after the collapse of Kenya Meat Commission (KMC) and Livestock
Marketing Division (LMD) of Ministry of Agriculture (MoA), livestock marketing has
been in the hands of the private sector with the government offering regulatory services.
KMC and LMD used to be more identical to pastoralists as major marketing agents,
commonly referred to as “the government”. After their collapse, the government has been
relaxed to streamline the private sector, perhaps based on livestock markets liberalization
and decontrol policy that came as a result of Structural Adjustment Program (SAP) of
1980s. From then, pastoralists have been highly vulnerable to an array of traders that
dominate the private sector. Economists have made attempts to characterize these traders

92
based on age, level of operating capital, experience in trade and level of integration in to
business. The main aim of economists is to study conduct, structure and efficiency of
markets based on different levels of each of these traders. Classes of traders commonly
identified are itinerant, middlemen, butchers, medium-scale and Large-scale traders
(Orre, 2003). However, these criteria have not been able to penetrate producers so that
they can make decisions on whom to profitably deal with. They have therefore designed
their own criteria of traders’ classification and preference. In this study, the Turkana of
Loima Division classified traders based on tribe and marketing system they operate in,
and the qualities they preferred were good pricing of livestock, consistency in buying
livestock, trust worth, handling enough cash and friendly price negotiation. Tribe was
weakly agreed upon as a criterion for preferring livestock traders displaying a scenario
where a tribal inclination to a trader among the turkana is unnecessary. However, based
on the marketing system, clear distinctions between traders were made. Traders operating
in an auction system and those in an organized market system with market days (based on
person to person negotiation) were highly preferred. This gives the overall impression
that, livestock owners in Loima Division are in dire need of a marketing system where
traders of all tribal backgrounds would meet and compete for livestock. This renders
futile, the campaign by some development agencies to promote local turkana traders as a
strategy to improve livestock marketing in Turkana district. The message from producers
is that, an organized system of marketing should precede such trader-promotion attempts.
Perhaps they are for the idea that, a better marketing system would reorganize the
conduct and behavior of traders to minimize their collusion in markets and exploitation

93
that is common in “free-range” type of traders. The criteria used by producers to classify
traders would be familiar to them when used by extension agents to deliver marketing
messages that relate to livestock buyer-seller interaction and consensus building for
purposes of improving livestock trade. These criteria could therefore be part of those used
by economists to evaluate structure, conduct and efficiency of markets.
The class of traders referred to as brokers/ middlemen commonly appears in many
livestock marketing literature/studies. Though not making an independent or clear
perceptive description of a broker, the pastoralists of Loima Division likened this to a
mobile trader (Lo angakejen). This class of traders is often widely blamed for most trade
distortions (particularly price distortions) appearing in marketing chains. In a study
carried out in Marsabit District, Orre (2003) found that 36.7% of traders were
middlemen. Attempts to minimize their influence to livestock trade therefore require
dialogue between all the stakeholders in livestock marketing to discuss their destructive
role in marketing chains, understand benefits of eliminating them and propose workable
solutions towards their reduction in the marketing chain.
Turkanas in Loima Division recognized shopkeeper livestock traders as an alternative
point for selling their animals when no other buyers are available. A similar perception
was found among the Rendille pastoralists of Marsabit (Orre, 2003). Shopkeepers in
Marsabit were reported to be giving credits of household’s commodities to pastoralists,
which were paid in cash or in kind during the wet season. This form of transaction
94
(credit) did not clearly emerge from the turkana pastoralists of Loima Division. Just like
in Loima Division, the shopkeepers of Marsabit District were reported to mainly conduct
transactions through barter (payment in kind), which was to the disadvantage of
pastoralists due to livestock undervaluing. Butchers were highly recognized by Rendille
pastoralists as traders. This was not the same for Turkana Pastoralists of Loima Division.
This would mean that the Rendille pastoralists might have adopted a mechanism of
avoiding middlemen by selling directly to butchers. It was not clear whether these
producers also had their own butcheries, but this is an opportunity that can be explored.
In this study, pastoralists of Loima Division gave high preference to organized market
system with market days (based on person-to-person negotiation) and auction system.
Selling animals through a shop and itinerant (mobile) traders were considered as fallback
systems in the absence of the two above. The traditional way of livestock exchange was
almost being ignored in the preference list, pastoralists arguing that, it is their own and
could not deserve comparison with conventional livestock marketing systems. This could
be attributed to the fact that, due to the cash economy that is encroaching pastoral set-ups,
pastoralists are changing towards marketing systems that could directly offer them cash.
Auction has been the oldest marketing system that was established in Turkana District
since colonial time. This seems to be true for other pastoral areas. Sobania (1988)
reported the presence of auction livestock marketing system among the Rendille
community as early as 1946. In this study, besides organized market system with market
days, the pastoralists of Loima Divison need auctions to be re-introduced. However,
95
modalities of its re-emergence need a ‘full-house’ discussion by all the stakeholders in
livestock trade to avoid previous experiences that led to its collapse. Markets organized
and held on specific days of the week offer better prices. This was observed by Orre
(2003) in Sukuta market in Samburu District and Gitunu et al. (2001) in Maasai markets
of Kajiado District where the system was reported to be advanced. Gitunu et al. (2001)
also observed Kiserian livestock market yard among the Maasai pastoralists to be
attracting many producers, traders and butchers from the surrounding community. It is
apparent in the current study that pastoralists of Loima Division are in need of this
system.
Several studies conducted across pastoral communities in Kenya give reports that
pastoralists are changing towards a cash economy as they gradually get integrated into
the broader national economy and in such changing society where basic needs are
expanding (Gitunu et al., 2001; Orre, 2003). This opposes the common myth that pastoral
production and marketing is based on satisfaction of subsistence needs and social cultural
goals. Behnke (1983) and Frathkin (1991) reported that generation of cash income
especially from pastoral animals has gained considerable importance among the
pastoralists. In this study, the pastoralists of Loima division enumerated various sources
of income and subsequently assigned relative proportions of cash they got from each of
them. Sale of livestock, borrowing and sale of livestock products emerged the major
sources of cash. Livestock emerged as the leading source of cash income among the
pastoralists of Loima Division. This was consistent with findings among the pastoral

96
Rendille of Northern Kenya (Bekure and Chabari 1991; Orre, 2003) and the Maasai of
Kajiado District of Kenya (Gitunu et al., 2001) who were reported to be now more
dependent on using cash from livestock and livestock products to buy non-pastoral
products. The situation was reported to be more advanced in some pastoral communities
that have adopted some sedentary lifestyles such as the Maasai and Samburu, where as a
result of changing land tenure system that favours individual ownership of land, cash
economy is more pronounced and in high demand (Gitunu et al., 2001; Orre, 2003).
Rendille/Ariaal were reported to have recognized that, selling the animal for cash was
better than home slaughter whereby meat is eaten within 1-2 days after which the family
returns immediately to starvation (Orre, 2003).
In addition to sale of livestock as a source of cash, Orre (2003) reported a situation where
the Rendille were diversifying their livelihoods through engagement in other activities
that contributed to additional cash income. This is consistent with the findings of this
study whereby the pastoralists of Loima Division were engaging in additional income
sources (off-herd) such as casual labor, gold mining and business. Nyariki et al. (2002)
working among the agro-pastoral Akamba of Kibwezi and Kilome, also revealed off-farm
earnings that additionally contributed to household food availability. Webb and Reardon
(1992); Republic of Kenya (1999) and Nyariki et al. (2002) described this as pastoralists’
coping mechanisms/ strategies or responses to minimize chances of household collapse
(attempts to be food secure) following depletion of livestock herds due to phenomenon
such as drought, raids and diseases that make such communities’ food poverty incidence

97
to be the highest. There was little evidence among the pastoralists of Loima Division that
such cash income diversification strategies were investment-oriented. From the
considered income sources, only business appeared to be a commercial investment.
However, its low contribution to cash income could mean that its perspective was limited
(not profit making). Deliberate attempts should therefore be undertaken to educate,
encourage and support pastoralists on commercial ways of diversifying incomes given
livestock as capital. Some sources of cash income such as gold mining appeared to be
least exploited by the pastoralists of Loima division. This is consistent with observations
among the Rendille of Southwestern Marsabit where resources such as gum arabica, solar
and wind were reported to be unexploited (Orre, 2003). This could be attributed to
unequal concern of the government in addressing development in the country.
Considering goats, camels, cattle and donkeys sold by pastoralists of Loima Division,
goats emerged the primary source of cash. This was attributed to readily available goats
markets and large proportion of goats in the livestock holdings. This was similar to the
findings of Orre (2003) where goats highly contributed to cash and hence livelihoods of
the Rendille/ Ariaal of Northern Kenya. Frathkin (1991) reported that, goats greatly
improve liquidity of pastoral households by providing most of the cash that is important
in purchasing food, which is the bulk of pastoral diet. In this study, though not
significantly, goats contributed a larger proportion of cash income to the poor as
compared to the rich and medium class. This differs with the findings of Gitunu et al.
(2001) among the Maasai where goats least contributed to cash incomes of the poor. The

98
difference in findings could be attributed to the methodologies used. Gitunu et al (2001)
was computing actual figures while in this study, proportions were being computed using
Participatory Appraisal (PA) method known as proportion piling. Gitunu et al. (2001)
reported differences in the proportions of cash income from different types of livestock
between men and women among the Maasai. The Turkana of Loima Division did not
report any significant differences. This can be explained by the fact that among the
Maasai, men have upper hand in making decisions on sale of animals whereas among the
Turkana it is a consultative process between a man and a woman in a family. The
Rendille have a hybrid form of decision-making whereby, sale of shoats doesn’t require
any consultation between family members except when decision has to be made on the
sale of large stock (Orre, 2003). Goats (and where sheep are sold) are therefore important
source of cash to pastoral households and subsequently an important determinant of food
security, and should be given a lot of attention in research and development interventions
in Loima Division and/ or pastoral areas as a whole.
There has been a myth that most of the pastoralists’ labour goes to herding. However, this
research has shown that, pastoralists are able to divide or diversify the available labour to
spread to other activities that contribute to family income. Dictates of weather and the
uncertain production environment they are living in would also not allow them to over-
concentrate their labour on herding. In the current study, pastoralists of Loima division
were engaged in some casual labour activities though limited to NGO operations. Njiru
(1982) working among the Rendille of Kenya and Perckers (1997) working among the

99
Pokots of Kenya observed that a number of pastoralists were leaving to urban centers for
employment and children were going to school. Though this spells shortage on amount of
labour required for herding, this is not uncommon in a changing society. But we can not
undervalue the fact that, herding labour drain from pastoral areas may induce detrimental
changes in pastoral livestock management practices, which include reduction in
possibility of herd division, spatial diversion and species diversification. Dahl and Hjort
(1976) and Behnke (1983) also pointed out these expected effects.
Contrary to common belief that, pastoralists are poor in conducting business, the study
has significantly shown the kind of business attempt that could be appropriate to pastoral
areas. An organized group of pastoralists women in Loima Division was able to secure a
substantial amount of cash income from business. It is now evident that, what the
pastoralists need is to be organized and be imparted with business skills. Additionally, in
supporting the active nature of pastoral women, the study has revealed the vital role of
these women in doing business and thus contributing to household food security. Among
the Kamba of Kilome and Kibwezi, a study by Nyariki et al. (2002) revealed that
households headed by males were more food insecure than those headed by women. This
therefore directs that the role of women in household livelihood diversification and food
security is vital and needs to be explored and promoted, and with special reference to this
study, be used as entry points in diversifying livestock trade and any other kind of
business in pastoral areas. Important role of women in development has been echoed in
other interventions such as peace building (REF);

100
Borrowing, clearly identified in this study as a source of cash income among the Turkana
pastoralists of Loima Division, could be seen by others as a begging complex that
enhances dependency and promotes pastoralists’ resistance to sell livestock. However, in
such uncertain world where pastoralists live, relatives and friends would inevitably come
in as a support system to food security. Grandin (1987) also reported borrowing as a
source of cash income among the Maasai of Kenya and described it as a traditional
coping/ survival/ food security strategy against unpredictable phenomenon that deplete
livestock herds and there hence fuelling food insecurity. It was also consistent with the
findings of Orre (2003) among the Rendille/ Ariaal.
The pastoralists of Loima Division remarkably recognized sale of livestock products as a
major source of cash income. Milk was mentioned to be commonly sold compared to
hides and skins. Among the Maasai, milk was also reported to provide most money than
hides and skins (Gitunu et al., 2001). Markets for livestock products should therefore be
explored and studies undertaken on marketing opportunities and constraints to livestock
products’ trade and production.
From the current study, the commonly sold species of livestock were goats, cattle, camels
and donkeys. Sheep were not sold and were mostly used to meet socio-cultural
obligations. Except for goats that were exceptionally sold, large stock were substantially
tied to socio-cultural functions. This contrasts with the situation among the Maasai where

101
shoats (but sheep are rarely sold) are mostly slaughtered at home while cattle mostly sold
and only occasionally slaughtered at home in very inevitable customary ceremonies like
initiation, matrimonial and burial (Gitunu et al., 2001). This could be attributed to the fact
that, Turkana perceive small stock as ready cash because there markets are available
whereas the Maasai have acquired a sedentary lifestyle where cash needs are many and
could necessitate selling of cattle. This could polarize Maasai livestock markets to cattle
while those in Turkana to shoats. In addition to traditional uses, this study found that
donkeys are sold or eaten among the Turkana pastoralists. This contrasts with the
situation in other pastoral areas of Kenya where donkeys are mostly used as beasts of
burden (Gitunu et al., 2001). This expressed potential of donkeys as food animals need to
be explored and recognized.
The current study revealed that goats were highly sold because they had numerical
advantage over other species of livestock (dominant in the total livestock herd), always
closer to the owners, and with ready market and popular to consumers among other
reasons. Cattle and camels were sold when there was no other alternative and when there
was a pressing need for large amounts of cash. This was consistent with the findings of
Orre (2003) among the Rendille/Ariaal of Northern Kenya and further agrees with the
findings of Bekure and Chabari (1991) and that of Gitunu et al. (2001) among the Maasai
of Kenya.

102
In terms of proportion of every species in the total livestock holding, this study showed
that the proportion of goats (or shoats) was highest as compared to proportion of cattle,
camels and donkeys. This was similar to the findings of Spencer (1973) and Orre(2003)
among the pastoral tribes of Marsabit District and Wilson (1982) working among the
Pokots of Kenya. Dahl and Hjort (1976) also observed that the stockless Boran of
Northern Kenya who took paid jobs as policemen or herdsmen in commercial ranches
often invested in small stock. They also revealed that, the Kababish of Sudan could
exchange camels for shoats for them to be satisfied with livestock holding. Small stocks
are therefore crucial in pastoral systems’ economy.
Between wealth groups, there were significant differences in the proportions of livestock
species in the livestock holding. The poor had a large proportion of goats in the herds
compared to the rich and medium class; while the rich and medium class owned large
proportions of camels and cattle in their herds as compared to the poor. This agrees with
the findings of Orre (2003) among the Rendille/Ariaal and slightly disagrees with the
findings of Gitunu et al. (2001) where the rich Maasai were reported to own large
proportions of shoats as compared to the medium class and the poor. The difference can
be attributed to different methodologies used. Gitunu et al (2001) was computing actual
figures whereas in this study, proportions were being computed using Participatory
Appraisal (PA) method called proportional piling. Author’s experience during the study
supports the use of the PA method to minimize the behaviour of pastoralists to hide
actual numbers of livestock hoping for a sympathetic consideration by agencies, a

103
situation that was observed by Gitunu et al (2001) among the Maasai. Between men and
women there were no significant differences in the proportions of other livestock species
in the herd except for donkeys. This could be explained by the fact that during
migrations, women are solely responsible for loading luggage on donkeys and every
woman in a family has to have at least a donkey. They are therefore likely to give a
relatively realistic proportion of donkeys in the herd than their men counterparts.
Considering the age-sex categories of every species of livestock sold, most of the
categories sold were the mature male castrates. Females of every species were not
commonly sold because of their reproductive status and also because of social stigma
associated with them. Only donkeys of reproductive age (male and female) were sold
perhaps owing to the fact that most households had few of them in their herds and there
was need to buy more especially breeding ones. Productive females of other livestock
species could only be sold when there were no male animals or cull/infertile females. It
was explained that the number of female animals entering the market was an indicator of
poverty levels of pastoral households mostly occasioned by the effect of drought. During
drought, excessive sell of castrate males leaves households with no option but to extend
to sale of females. Young animals could only be sold when there was need for small
amounts of cash or when there was no old/infertile females or castrates in the flock/herd.
This would mean that few market oriented age-sex categories of animals in the herd
would force households to sell young males and females of reproductive age. This would
deprive households the future value of these animals. It also deprives households the

104
livestock capital necessary for flock growth in future, accentuating a downward spiral of
flock/herd decapitalization. It is therefore imperative to suggest that pastoralists should
always create a balance between market-oriented and non-marketed oriented age-sex
categories of animals in the herds through proper management strategies (traditional ones
exist). The need for them to sell non-market oriented (not preferred or commonly
undervalued by traders) species of livestock should be supported through price
improvement strategies like buying animals based on weight or organizing them in to
groups to directly slaughter these animals in butcheries for optimum returns (prices of
livestock are always low but meat retail prices are constantly high!) or explore market
outlets that are specifically inclined to them. Strategies should be devised to compensate
pastoralists’ livestock herd collapse during or after drought, for instance through
restocking (needs pastoralists’ drought mitigation policy!)
Proportion of livestock sold (off-take) in the past one year by pastoralists of Loima
Division was estimated in this study. The author was mainly interested with commercial
off-take of every species of livestock sold because it was the one expected to contribute
most to household’s access to cash. However, there were still attempts by informants to
include even non-commercial off-take. This could not be strictly avoided and thus off-
take computed could be slightly exaggerated. This complication made Grandin (1987) to
report pastoral total off-take rates among the Maasai in terms of commercial and non-
commercial sales or slaughter, and also Sobania (1979) to report off take as all that is
taken off the pastoral flock i.e. sales, slaughters and Deaths. From this study, total off

105
take rates of goats were higher, followed by cattle and least off take rates reported in
donkeys. Gender and wealth groups did not show any significant differences in the off-
take rates across livestock species sold. This could be because, those interviewed in this
study were families and Turkanas have a culture of consultation between husband and
wife when making decisions to sell an animal and could therefore report almost equal
proportions of sales. Between wealth groups, the author could attribute lack of significant
difference in proportional sales of all species, to methodology used (estimated
proportions and not actual figures that could have highlighted differences), and unsteady
nature of wealth status among turkana pastoralists that is occasioned by frequents raids.
Additionally, wealthier groups could even be having many other sources of income e.g.
from per diems, and borrowing and could therefore sell even smaller proportions of
animals. However slight differences indicated that, the poor had sold larger proportions
of goats and donkeys as compared to the rich and medium class, whereas the rich and
medium class had sold more of camels and cattle than the poor. This is in common with
the findings of Chabari (1986) among the Maasai and Orre (2003) among the
Rendille/Ariaal that poor households depended on sale of small stock for their cash needs
while the rich households depended on the sale of the large stock. These studies showed
significant differences in proportional sales of livestock between gender groups. This
could be because, among the Maasai, decision to sell and later taking the animal to the
market is a man’s job. Among the Rendille/Ariaal, consultation between family members
is only in the sale of large stock while the head of the household solely takes decision to
sell small stock.

106
Analysis of seasonality of sales indicated that most of market-oriented categories (large
sized and mature male castrates) of all species of livestock were mainly sold during the
dry season. This is the season when household food requirements were high and therefore
need for enough cash to purchase foodstuffs. This was consistent with the findings of
Orre (2003) among the Redille/Ariaal. Food insecurity is most serious during the dry
season. Orre (2003) calculated food poverty incidence (fpi) among the Rendille/Ariaal to
be 0.89 and 0.61 in the dry season and wet season respectively. Food poverty incidence
of households is the proportion of food-poor households compared to the total number of
households, and is used to measure food security status of households. Food-poor
households are those that do not have access to food that can supply 2250 calories/an
Active African Man Equivalent (AAME)/day for healthy living (Republic of Kenya,
1999).
During wet season, few of the animals were sold. This could be because, during this
season, milk production from herds and flocks is expected to greatly increase; demand for
purchased foodstuffs drops or play a supplementary role and pastoralists are unwilling to
sell animals. However, today, milk production status of animals is never like before. That
means, milk may not be sufficient for household nutritional diet even during the wet
season and therefore purchased foodstuffs could still be in demand. This was evident in
the current study, whereby animals could still be sold perhaps to supplement nutritional
requirements in the wet season besides other household needs (non-food requirements).

107
Animals sold during the wet season were mostly young ones. Orre (2003) found that
among the Rendille/Ariaal, animals could still be sold during the wet season to pay for
debts incurred on food during the dry season. In the current study, paying for debts
incurred during the dry season was not mentioned.
It has been widely reported that pastoralists sell most animals during the dry season when
national livestock prices are low (Ondegi-Awuondo, 1990; Orre, 2003). This was
consistent with the findings of this study. This could indicate that pastoralists are mainly
motivated to sell only by immediate requirement for cash rather than high livestock
prices. That means pastoralists do not enjoy the price incentive during the wet season.
This is exacerbated during the dry season when prices of cereals (highly demanded
during dry season) are high. Several recommendations have been suggested in order to
alleviate this perverse relationship. Orre (2003) suggested that, pastoralists need to sell
animals during wet season and buy enough foodstuffs for use during the dry season. The
big challenge to this recommendation is storage, given the fact that pastoralists are ever
mobile. The author recommends that pastoralists’ knowledge on price information need
to be expanded, their willingness to commercially invest and store wealth need to be
encouraged and supported, country’s traditional livestock market base need to be
expanded, and economic recovery programmes that increase consumers’ per capita and
hence demand for pastoral commodities need to be designed.

108
A lot of studies have been done on livestock marketing constraints in pastoral areas
(Lusigi, 1984; Grandin, 1987; Njiru, 1982; Gitunu et al., 2001; Orre, 2003) but priority
analysis of these constraints at community level is lacking. The current study has
revealed that producers regard low prices of livestock as the priority constraint affecting
them in livestock marketing whereas livestock traders give high priority to low operating
capital. Government livestock workers gave priority to poor marketing infrastructure and
lack of marketing information as priority problems that need to be addressed in order to
improve livestock marketing. Bekure and Chabari (1991) working among the Maasai also
found that low prices were a major concern of pastoralists. Even in Kajiado district where
pastoralists easily accessed organized markets, they could still complain of low prices
(Gitunu et al., 2001). Orre (2003) also reported that traders in Marsabit were grossly
complaining of low working capital as a hindrance to their business. These problems
seem to be worsened by market liberalization and decontrol that is in operation today.
Though these constraints are interrelated (one needs the other) and every group of
informants can be correct in their own right, the principles underlying community-based
development would dictate that the producers and traders are correct. Government
livestock workers could also be correct but their passive involvement in improving their
priorities makes them less felt. This could be attributed to financial, logistical and staff
constraints. This demonstrates that, the government as a service provider has misplaced
priorities or is malfunctioning as far as livestock marketing development in pastoral areas
is concerned. Being a policy development facilitator, it is now evident that, the wishes

109
and concerns of producers and traders are least reflected in the policy formulations that
seek to foster development in pastoral areas. There is therefore need to reconsider the
involvement of producers and traders in matters pertaining to livestock marketing
interventions and policy developments. Additionally, due to implementation constraints,
the government should consider revising its roles (including those reflected in SAP
changes), share them realistically with the private sector (and other development
partners) and subsequently enact legislations and policies that provide enabling
environment for operations of private sector, while safeguarding the interests of the
producer and trader.
There are common paradigms that pastoralists are emotionally attached to their livestock,
irrational and resistant to change. There willingness to sell animals even when prices are
conducive was considered as being unreasonable. This might have made national
governments or other development agents to give little emphasis on livestock marketing
in pastoral areas. The current study reveals that pastoralists are rational and are ready to
sell livestock when marketing improves and therefore recognize the value of marketing
livestock. However, they appeared to be unwilling to sell very large numbers of livestock.
Some reasons could be associated with this. Their unwillingness to sell very large
numbers of livestock could be attributed to the fact that, livestock to them is capital. It is
the only resource that can sustain their livelihoods in the unpredictable environments they
are living in and therefore need to be rational of their sales. This could therefore mean
that they are cautiously concerned about long-term food security than short-term gains of

110
selling at high prices. In this regard, when prices improve, pastoralists achieve the target
income by selling fewer animals compared to periods when livestock prices are low.
Also, it is widely known and rationally expected that, before a pastoralist sells an animal,
he first compares its present cash value to benefits foregone which include flow of milk,
blood, additional cash value gained through future sales and social value attached to the
animal. This behaviour of perverse response to price increase is expected in such non-
market oriented society. This was consistent with the findings of Orre (2001) working
with the Rendille/Ariaal, and Bekure and Chabari (1991) working among the Maasai. To
expand pastoralists’ willingness to sell animals when marketing conditions improve,
there is need to continuously educate them on diversification of livelihoods through
commercial investment of proceeds from livestock sales. Additionally, pastoralists should
be supported to produce surplus livestock for market while maintaining a balanced
herd/flock that enables them to withstand the effect of their harsh environment.
It was also found in the current study that, pastoralists of Loima Division were willing to
sell more of donkeys, cattle and camels in the herd and less of goats although goats
remained the principle livestock type highly sold. This could be attributed to the fact that,
when marketing conditions were poor, goats were the only livestock species that could
survive the intricate panorama of markets. As the situation improves, they could therefore
want to sell less of goats in order to build their stock/ stock structure. Additionally, they
might have realized that benefit lost in keeping other types of livestock as a result of poor
marketing conditions was high and thus the need to utilize any upcoming marketing

111
opportunities in the sale of those livestock types. Though the predicted future off-take of
goats is likely to sustain a goats’ market, there is need to establish and promote markets
for other types of livestock.
6.0 CONCLUSIONS AND RECOMMENDATIONS
6.1 CONCLUSIONS
• Turkana pastoralists of Loima Division recognized seasonal movements as a
constraint to access of markets and as a result could utilize cross-border markets
in West Pokot District of Kenya and Moroto market in Uganda along their
migration routes.
• Pastoralists gave high priority to establishment of organized market system with
market days (based on person-to-person negotiation) with auction system
supplementing it. Traders in these systems were also preferred.
• Sale of livestock (major one), borrowing and sale of livestock products were the
main sources of cash. Though rational, they appeared to be more driven by
household needs than commercial investments.
• Compared to other species, goats were highly sold, substantially contributing to
households’ cash incomes and hence food security.
• In every species of livestock sold, mostly marketed age-sex categories were
mature male castrates, and were sold mainly during the dry season when national
livestock prices are expected to be low.

112
• Pastoralists have recognized the value of marketing livestock and are ready to sell
more when marketing improves though not in very large numbers.
• Though improvement of livestock marketing information and infrastructure is
equally important, producers give high priority to improvement of prices while
traders want access to credit.
6.2 RECOMMENDATIONS
• In the efforts to establish internal organized livestock markets in pastoral set-ups,
seasonal mobility of pastoralists should be taken into consideration.
• Recognizing pastoralism as a way of life, pastoralists should be allowed to access
cross-border markets during seasonal movements. This therefore requires
common pastoral (cross-border) policy or procedures that would minimize inter-
community conflict and spread of livestock diseases at markets.
• In evaluating structure, conduct and efficiency of livestock markets based on
traders, technical economists should additionally use the tribal and system-of-
operation criteria so as to generate findings that are recognized, simply interpreted
and more informative to producers.
• Women should be used as entry points in educating, encouraging and supporting
pastoralists’ endeavors to commercially diversify their sources of income given
livestock as capital.
113
• Recognizing the role played by goats in food security of pastoral households,
livestock development efforts and policy should emphasize on their health,
production and marketing.
• Pastoralists’ demise is more pronounced during the dry season and therefore the
government and other development agencies should readily design mitigation
measures to counter excessive vulnerability.
• Analysis of livestock marketing constraints, interventions and policy/legislative
formulations should incorporate opinions and views of producers and traders so as
to achieve authenticity and practicability.
• Further study is necessary to look at root causes of livestock marketing
constraints, their effects and perceptive and economic analysis of various options
of intervention.

114
7.0 REFERENCES:
AGSEC Consultants (2000). Sourcing Livestock from Turkana for the Domestic and Export
Market. A Feasibility study for African Medical Research Foundation (AMREF),
Nairobi, Kenya.
Airey, J. L., Schwartz, J., Meriti, P and Adoyo, P. (1981). Turkana Livestock Marketing
Feasibili ty Study. Report for Ministry of Livestock Development, Nairobi, Kenya.
Akabwai, D. (2000). The Impact of Insecurity on Livestock Marketing in Turkana District.
Paper prepared for the Livestock Providers Thematic Workshop: Livestock Marketing in
Turkana (The Way Forward), Kitale, Kenya.
Akabwai, D. (2001). Livestock keeping and indigenous knowledge in the Horn of Africa:
Personal reflections on 25 years of Experience. In: Catley, A and Mariner, J (Eds).
Participatory Epidemiology- Lessons Learned and Future Directions. Proceedings of a
workshop held on November 15th to 17th 2001. Addis Ababa, Ethiopia.
Aklilu, Y., Irungu, P and Reda, A. (2002). An Audit of the Livestock Marketing Status in
Kenya, Ethiopia and Sudan. Vol. I. CAPE unit of PACE/ AU/IBAR, Nairobi, Kenya.

115
ALRMP (Arid Lands Resource Management Project). (2001). Quarantine Line and the
ASAL Districts: Final Consultancy Report on the Livestock Health Quarantine Measures
Study. African Technology Development Link (Techlink) International, Nairobi, Kenya.
Aronson, D. R. (1984). Pastoralism in Contemporary Development Perspective. Nomadic
Peoples, No. 16.
Behnke, R. H. (1983). Production rationales: The commercialization of subsistence pastoralism.
Nomadic Peoples No. 14, 3-33.
Bekure, S and Chabari, F. (1991). An economic analysis of Maasai livestock production. In:
Bekure, S., de Leew, P. N., Grandin, B. E and Neatle, J. H (Eds). An economic analysis
of the livestock production systems of Maasai in Eastern Kajiado District. ILCA, Addis
Ababa, Ethiopia.
Broch-Due, V. (1987). From Herds to Fish and from Fish to Food Aid. Report for NORAD.
NORAD, Lodwar, Kenya.
Broch-Due, V and Storaas, F. (1983). The Fields of the Foe-Amana Emoit: Factors
Constraining Agricultural Output and Farmers’ Capacity for Participation. University of
Bergen.

116
Catley, A. (2000). The Use of Participatory Appraisal by Veterinarians in Africa. Rev. Sci. Tech.
Office Int. Epizooties 19 (3), 702-714.
Catley, A. P and Ahmed, A. (1996). Use of Participatory Rural Appraisal (PRA) Tools for
Investigating Tick Ecology and Tick-borne Diseases in Somaliland. Trop. Anim. Hlth.
Prod. 28, 91-98.
Catley, A and Leyland, T. (2001). Community Participation and the Delivery of Veterinary
Services in Africa. Prev. Vet. Med. 49, 95-113.
Catley, A. P and Mohammed, A. A. (1996). The Use of Livestock-disease Scoring by a
Primary Animal Project in Somaliland. Prev. Vet. Med. 28, 175-186.
Catley, A., Osman, J., Mawien, C., Jones, B. A and Leyland, T, J. (2002). Participatory
Analysis of Seasonal Incidences of Diseases of Cattle, Disease vectors and Rainfall in
Southern Sudan. Prev. Vet. Med. 53, 275-284.
Central Bureau of Statistics. (2001). 1999 Population and Housing Census, Counting our
People for Development Vol. 1 Ministry of Finance and Planning, Nairobi.

117
Chabari, F. N. (1994). Livestock Marketing. In: Range Management Handbook of Kenya Vol.
II, 9, Turkana District. Republic of Kenya, Ministry of Agriculture, Livestock
Development and Marketing (MALDM) and GTZ, Nairobi.
Chabari, F. N. (1986). The Marketing of Sheep and Goats from two Pastoral Systems in Kenya:
A Comparison of Market Off-take from Maasailand and Baringo. MSc thesis, University
of Nairobi.
DALEO (District Agriculture and Livestock Extension Office)- Turkana District (2002).
Turkana Annual Report- 2002, Lodwar.
DALEO (District Agriculture and Livestock Extension Office)- Turkana District (2001).
Turkana Annual Report- 2001, Lodwar.
Dahl, G and Hjort, A. (1976). Having Herds: Pastoral Herd Growth and Household Economy.
Stockholm studies in Social Anthropology #2. Stockholm Department of Social
Anthropology, University of Stockholm, United kingdom.
Director of Veterinary Services (DVS) (2000). Hides and Skins Improvement and Leather
Development Status Report for the last ten years. DVS, Nairobi.
118
Dyson-Hudson, R. (1982). South Turkana Herd Structures and Livestock Human Ratios.
Cornell University, Department of Anthropology, Ithaca, New York.
Eregae, E. M. (2003). Participatory Market Research in Business Planning for Private Pastoral
Veterinary Practice in Turkana District, Kenya. MSc Thesis, University of Nairobi.
Frathkin, E. (1991). Surviving drought and development: Ariaal pastoralists of Northen Kenya.
Wet View press, Colorado, USA.
Galvin, K. (1984). Diet and Nutrition of Turkana Pastoralists in a Social and Ecological Context.
PhD Dissertation. State University of New York, Binghamton.
Gatere, K and Dow, K. (1980). Improving Price Information Systems in Beef Marketing in
Kenya. Development Planning Division, Ministry of Agriculture and Livestock
Development, Nairobi.
Gathuma, J., Bloxom, W., Inamdar, A., Ndiritu, C., Byrne, P and Storaas, F. (1989).
Turkana Livestock Review-Phase II. Report for NORAD in Cooperation with the
Ministry of Livestock Development and Turkana Rural Development Programme.
Norconsult,A.S, Nairobi.

119
Gitunu, A. M. M., Ruto, E. S. K. and Muindi, J. K. (2001). Socioeconomics of the current
livestock marketing production, utilization and marketing in arid and semi-arid lands,
with special reference to Kajiado District. National Range Research center, Kiboko,
Kenya.
Grandin, B. E. (1987). Pastoral culture and range management: Recent lessons from
Maasailand. ILCA Bulletin No. 28. Nairobi, Kenya.
Gufwoli, P. N. K and Behnke, R. (1990). Livestock Marketing Study. Report for NORAD,
Ministry of Livestock Development and Turkana Rural Development Programme.
NORAD, Nairobi.
Gulliver, P. H. (1951). A Preliminary Survey of the Turkana. Communications from the School
of African Studies, University of Capetown. New Series # 26, Capetown.
Guvele, C and Lautze, S. (2000). Unofficial Cross-Border Livestock Exports from Southern
Sudan to Kenya. Paper prepared for the Livestock Providers Thematic Workshop:
Livestock Marketing in Turkana (The Way Forward), Kitale, Kenya.
Helland, J. (1987). Turkana Briefing Notes- A Background Study to the Turkana Rural
Development Programme. DERAP.

120
Jahnke, H. E. (1982). Livestock Production Systems and Livestock Development in Tropical
Africa. Kieler Wissenschaftsverlag Vauk, West Germany.
Kaitho, D. T. (2003). A Participatory Epidemiologic Study on Contagious Bovine
Pleuropneumonia in Lapur Division, Turkana District, Kenya. MSc Thesis, University of
Nairobi.
Kariuki, R. (2000). Livestock Marketing from Pastoral Areas of Kenya: A strategy for Pastoral
Development. Report for ALRMP, SNV, OXFAM (GB), World Concern, Nairobi.
Kivunja, C. D. (1976). The Economics of Cattle and Beef Marketing in Kenya. MSc thesis,
University of Nairobi.
Little, M. A., Dyson-Hudson, N., Dyson-Hudson, R., Ellis, J. E and Swift, D. M. (1983).
Human Biology and the Development of the Ecosystem Approach: Past Studies and the
South Turkana Ecosystem Project. In: The Ecosystems Approach in Anthropology. Ed.
Moran, E.F. Westview Press, Boulder.
Livestock Marketing Division (LMD). (Undated (a)). Marketing of Livestock and Livestock
Products in ASAL areas. Ministry of Agriculture and Rural Development, Animal
Production Division, Nairobi.

121
Livestock Marketing Division (LMD). (Undated (b)). Development Proposal for the Arid and
Semi-Arid Lands. Ministry of Agriculture and Rural Development, Animal Production
Division, Nairobi.
Lusigi, J. W. (1984). Integrated resource management plan for western Marsabit District of
Northern Kenya. IPAL report No. A-6. Nairobi, Kenya.
Mariner, J. C. (1999). Participatory Epidemiology: Methods for the Collection of Action-
oriented Epidemiological Intelligence. Vetwork, UK, Edinburgh and RDP Livestock
Services, Zeist, 59 pp.
Mbogoh, H. G., Kimaru, L. W., Imana, I. I., Akabwai, D. M. O., Mirega, S. O., Erukudi, C
and Wekesa, N. (1989). Preliminary Study of the Livestock Sector-Turkana District.
Report for Turkana Rural Development Programme, NORAD and GoK.
McCabe, J. T. (1984). Livestock Management Among the Turkana: A social and Ecological
Analysis of Herding in an East African Pastoral Production. PhD Dissertation, Cornell
University, Department of Anthropology.
McDermott, J. J., Randolph, T. F and Staal, S. J. (1999). The Economics of Optimal Health
and Productivity in Smallholder Livestock Systems in Developing Countries. Revue
Scientifique et Technique Office International des Epizooties; 18(2), 399-424.

122
Ministry of Agriculture and Rural Development (MoARD) (2001). Animal Production
Division Annual Report, Hill Plaza, Nairobi.
Ministry of Agriculture (MoA) (1996). Animal Production Division Annual Report, Hill Plaza,
Nairobi.
Mochabo, M. O. K. (2003). Community Participatory Approaches in the Epidemiology and
Control of Trypanosomosis in Camels in Turkana District, Kenya. MSc Thesis,
University of Nairobi.
Njenga, P. (2000). Livestock Marketing in Arid and Semi-Arid areas in Kenya: A description of
Opportunities and Bottlenecks. Report for SNV-Kenya, Nairobi.
Njiru, G. K. (1982). The Rendille economy: Some preliminary findings in trading activities. IDS
Working Paper No. 385. Nairobi, Kenya.
Njiru, G. K. (1987). Studies in to Pastoral Economics. Presentation at the UNESCO Orientation
Seminar, UNESCO, Nairobi.
Nyariki, D. M., Wiggins, S. L and Imungi, J. K. (2002). Levels and causes of household food
and nutrition insecurity in dryland Kenya. Ecology of food and nutrition, 41 (2), 155-167.

123
OIE (Office International Des Epizooties). (1998). International Animal Health Code-
Mammals, Birds and bees. 7th Ed. Office International Des epizooties, Paris, France.
Ondegi-Awuondo, C. (1990). The life in the balance: Ecology and sociology of Turkana
Nomads. African Centre for Technology studies, Nairobi, Kenya.
Organization of African Unity/ Inter-African Bureau of Animal Resources (OAU/IBAR).
(1999). Karamojong Cluster Harmonization Meeting held in Lodwar between December
6th and 8th. Lodwar, Kenya. OAU/ IBAR/Community-Based Animal Health and
Participatory Epidemiology (CAPE) Unit, Nairobi.
Organization of African Unity/ Inter-African Bureau of Animal Resources (OAU/IBAR).
(2001). Pastoralists Harmonization Initiative- Second International Meeting held in
Mbale between 19th and 25th May. Mbale, Uganda. OAU/ IBAR/ CAPE, Nairobi.
Organization of African Unity/ Inter-African Bureau of Animal Resources (OAU/IBAR).
(Undated). Concept note for the Red Sea Livestock Trade Commission. OAU/ IBAR/
Pastoral Livelihood Programme (PLP). Nairobi, Kenya.
Orre, S. (2003). Marketing of sheep and goats and their role in food security among pastoral
communities in Marsabit District. MSc Thesis, University of Nairobi. Nairobi, Kenya.

124
Perckers, U. (1997). Nomadic pastoralists in Kenya: human-ecological aspect of East-Pokot.
IIED Issue Paper No. 73.
Range management Handbook of Kenya. (1994). Turkana District. Vol. II, 9.
Republic of Kenya. (1972). The Animal Diseases Act, Chapter 364, Revised Edition 1989.
Government Printer, Nairobi.
Republic of Kenya. (1986). Sessional paper No.1 – Economic Management for Renewed
Growth. Government printer, Nairobi.
Republic of Kenya. (1999). National poverty eradication plan 1999-2015. A plan presented by
office of the president- department of development and co-ordination. Government
printer, Nairobi, Kenya.
Republic of Kenya (2002). Turkana District Development Plan (TDDP)-2002-2008. Office of
the Vice-President and Ministry of Planning and National Development. Government
Printer, Nairobi.
Sandford, R. (1983). Turkana District Livestock Development Plan. OXFAM, Nairobi.
125
Schwartz, H. J. (1981). Pastoral Livestock Production in Northern Kenya- Constraints and
Potential. Discussion Paper for the International Workshop on “Strategies for Developing
the Resources of the Arid and Semi-arid Areas of Kenya”, Nairobi.
Skjerdal, K. (1979). Report on the Development of Turkana District. NORAD, Kenya.
Sobania, N. (1988). Pastoralism migration and colonial policy: A case study from northen
Kenya, In: Johnson, D. H and Anderson, D. M (Eds) The ecology of Survival: Case
studies from NorthEastern African History, Lester Crook Academic Publishing, London.
Spencer, P. (1973). Nomads in alliance: Symbiosis and growth among the Rendille and
Samburu of Kenya. Oxford University Press, New York.
Storaas, F. (1989). Cattle Complex or Begging Complex: Livestock Transactions and the
Construction of Turkana Society. University of Bergen, Department of Anthropology.
Wario, A. (2001). Background Information, Kenya Livestock Marketing Council. ALRMP,
Nairobi.
Webb, P and Reardon, P. (1992). Drought impact and household response in East Africa.
Quarterly Journal of International Agriculture, 31(3), 230-244.
126
Wilson, T. R. (1982). The economic and social importance of goats and their products of semi-
arid arc of Northern tropical Africa. In: proceedings of the third International conference
on goat production and diseases. Department of Agriculture, Tucson University, Tucson,
Arizona, USA.

127
8.0 APPENDICES
Source of Adakar Gender WealthCash income Goats 0.79 0.65 0.81Cattle 0.79 0.46 0.82Camels 0.099 0.78 0.32Donkeys 0.19 0.51 0.81 Labour 0.88 0.57 0.56Gold mining 0.09 0.96 0.49Borrowing 0.83 0.68 0.15Hunting and gathering 0.08 0.95 0.34Livestock products 0.71 0.72 0.69Business 0.036** 0.05** 0.43Others 0.37 0.59 0.61Appendix 1: Significance levels between adakar, gender and wealth groups, of sources of cash income in four adakars of Loima Division, Turkana District, 2002/2003.

128
Sources Adakar Gender group Wealth group of cash Natuba Kicono Acemie Aporon Men Women Rich Medium class Poor income N=18 N=18 N=18 N=18 N=36 N=36 N=24 N=24 N=24 Goats 43.22 47.11 44.33 50.89 47.69 45.08 46.125 44.25 48.79 Cattle 4.83 2.83 4.28 4.67 4.72 3.58 4.75 4.17 3.54 Camels 8.72 4.28 4.61 2.44 5.28 4.75 6.67 5.125 3.25 Donkeys 1.33 2 4.06 5 2.64 3.56 2.5 3.21 3.58 Labour 2.83 1.89 1.11 1.94 2.36 1.53 2.375 2.625 0.83 Gold mining 5.72 2 0 2.89 2.69 2.61 1.29 3.58 3.08 Borrowing 11.17 12.44 14.28 13.61 13.39 12.36 13 15.79 9.83 Hunting and gathering 2.89 0.78 0 0 0.94 0.89 1.125 0 1.625 Livestock products 8.79 9.57 11.89 8.61 9.31 10.11 10.96 8.67 9.5 Business 2.17 6.22 0.78 0.56 0.89 3.97 2.21 1.29 3.79 Others 8.33 10.89 14.67 9.39 10.08 11.56 9 11.29 12.17 Appendix 2: Mean annual cash proportion (%) of sources of cash income in four adakars of Loima Division, Turkana District, 2002/2003.

129
Livestock Age-sex Mean annual
type categories Proportion sold sold
Goats Naminawoi 3.78 Lodongong 6.82 Loangitou 2.94 Ebilarengoit 8.72 Akale 3.14
Cattle Namojong 0.07 Emong 1.29 Loangitou 0.25 Aite Nakolup 0.33 Emanik 0.04
Camels Lodongong 0.65 Loangitou 0.21 Echekemuk 0.28 Akaal 0.18 Namojong 0.32 Lopuuwa 0.15
Donkeys Lodongong 0.22 Asikiria 0.64 Loketepan 0.38 Loangitou 0.03
Appendix 3: Grand mean annual proportion (%) of age-sex categories of goats, cattle, camels and donkeys sold in four adakars of Loima Division, Turkana District, 2002/2003 (expressed as proportion of total livestock population units)

130
Livestock Age-sex Adakar Gender WealthType category sold Goats Naminawoi 0.007** 0.73 0.39 Lodongong 0.54 0.46 0.59 Loangitou 0.06 0.76 0.4 Ebilarengoit 0.0008** 0.93 0.81 Akale 0.13 0.18 0.29 Cattle Namojong 0.12 0.78 0.59 Emong 0.91 0.82 0.14 Loangitou 0.61 0.67 0.41 Aite 0.34 0.5 0.4 Emanik 0.14 0.66 0.55 Camels Lodongong 0.92 0.85 0.12 Loangitou 0.026** 0.38 0.76 Echekemuk 0.15 0.33 0.83 Akaal 0.27 0.43 0.49 Namojong 0.59 0.16 0.41 Lopuuwa 0.44 0.83 0.73 Donkeys Lodongong 0.12 0.36 0.53 Asikiria 0.68 0.72 0.41 Loketepan 0.16 0.91 0.24 Loangitou 0.58 1 0.61Appendix 4: Significance levels of age-sex categories of goats, cattle, camels and donkeys sold in four adakars of Loima Division, Turkana District, 2002/2003

131
Livestock Age-sex Adakar Gender group Wealth group
type categories Natuba Kicono Acemie Aporon Men Women Rich Medium class Poor
sold N=18 N=18 N=18 N=18 N=36 N=36 N=24 N=24 N=24 Goats Naminawoi 6.11 4.39 1.94 2.67 3.61 3.94 2.92 3.92 4.5
Lodongong 7 7.5 7.67 5.11 6.31 7.33 7.13 5.83 7.5 Loangitou 4.56 3.67 2 1.56 2.81 3.08 3.33 2.08 3.42 Ebilarengoit 2.83 9.89 10.28 11.89 8.81 8.64 8.21 9.54 8.42 Akale 3.72 4.78 1.89 2.17 3.81 2.47 2.5 2.67 4.25
Cattle Namojong 0.28 0 0 0 0.08 0.06 0 0.13 0.083 Emong 1.11 1.39 1.06 1.61 1.36 1.22 2.08 1.17 0.63 Loangitou 0.44 0 0.39 0.17 0.19 0.31 0.13 0.5 0.13 Aite 0.11 0 0.44 0.78 0.22 0.44 0.083 0.63 0.29 Emanik 0.17 0 0 0 0.06 0.028 0 0.083 0.042
Camels Lodongong 0.61 0.89 0.44 0.67 0.61 0.69 1.21 0.67 0.08 Loangitou 0.61 0.11 0.11 0 0.28 0.14 0.25 0.25 0.125 Echekemuk 0.72 0.22 0.06 0.11 0.17 0.39 0.21 0.25 0.375 Akaal 0.44 0.06 0 0.22 0.11 0.25 0.21 0.042 0.29 Namojong 0.67 0.33 0.28 0 0.08 0.56 0.46 0 0.5 Lopuuwa 0.06 0.11 0.33 0.11 0.17 0.14 0.21 0.17 0.08
Donkeys Lodongong 0.06 0.11 0 0.72 0.11 0.33 0.125 0.42 0.125 Asikiria 0.39 0.44 0.61 1.11 0.56 0.72 0.21 0.79 0.92 Loketepan 0 0.33 0.39 0.78 0.36 0.39 0.125 0.375 0.625 Loangitou 0 0.06 0 0.06 0.028 0.028 0 0.04 0.04
Appendix 5: Mean annual proportion (%) of age-sex categories of goats, cattle, camels and donkeys sold in four adakars of Loima Division, Turkana District, 2002/2003 (expressed as proportion of total livestock population units)

132
Livestock Variable Adakar Gender WealthType Goats In herd 0.21 0.71 0.0000** Sold 0.35 0.96 0.47 Not sold 0.68 0.62 0.0001** Cattle In herd 0.33 0.32 0.049** Sold 0.84 0.88 0.44 Not sold 0.25 0.21 0.07 Camels In herd 0.1 0.69 0.0005** Sold 0.16 0.29 0.32 Not sold 0.09 0.91 0.001** Donkeys In herd 0.09 0.03** 0.2 Sold 0.12 0.55 0.27 Not sold 0.35 0.045** 0.02**Appendix 6: significance levels of goats, cattle, camels and donkeys sold in relation to those in the original herd and not sold, in four adakar of Loima Division, Turkana District, 2002/2003 (expressed as proportion of total livestock population units).

133
Livestock Variable Adakar Gender group
Wealth group
type Natuba Kicono Acemie Aporon Men Women Rich Medium class Poor N=18 N=18 N=18 N=18 N=36 N=36 N=24 N=24 N=24
Goats In herd 58.22 68.56 60.78 56.06 61.75 60.06 51.67 57.75 73.29 Sold 24.22 30.22 23.78 23.89 25.33 25.47 24.08 24.04 28.08 Not sold 34 38.33 37 32.67 36.42 34.58 27.58 33.71 45.21
Cattle In herd 13.56 11.11 7.72 13.56 12.78 10.19 13.54 13.83 7.08 Sold 2.11 1.39 1.89 2.56 1.92 2.06 2.29 2.5 1.17 Not sold 11.44 9.72 5.83 11 10.86 8.14 11.25 11.33 5.92
Camels In herd 20.33 12.5 20.72 18.11 17.39 18.44 23.29 19.08 11.38 Sold 3.11 1.72 1.22 1.11 1.42 2.17 2.54 1.38 1.46 Not sold 17.22 10.78 19.5 17 15.97 16.28 20.75 17.71 9.92
Donkeys In herd 7.89 7.83 10.78 12.28 8.08 11.31 11.5 9.33 8.25 Sold 0.44 0.94 1 2.67 1.06 1.47 0.46 1.63 1.71 Not sold 7.44 6.89 9.78 9.61 7.03 9.83 11.04 7.71 6.54
Appendix 7: Mean annual proportion (%) of goats, cattle, camels and donkeys sold in relation to those in the original herd and not sold, in four adakars of Loima Division, Turkana District, 2002/2003 (expressed as proportion of total livestock population units).

134
Appendix 8: Median ranks (range) of livestock marketing constraints affecting herders and traders as perceived by government livestock workers, Loima Division, Turkana District (2002/2003) Constraint Producers Traders Overall rank N=8 N=8 N=16Long distances to markets 4.5(3-8)** 5.5(3-8) 5(3-8)** Insecurity to markets 5(1-9) 7.5(4-10) 6.5(1-10) Poor infrastructure 3.5(1-7)** 2(1-7)** 3(1-7)** Lack of market information 4(2-7)** 4(1-5)** 4(1-7)** Lack of cash 5.5(1-8) 10(10-10) 9(1-10) Low prices of livestock 5(1-7) 10(10-10) 8.5(1-10) Few external buyers 4(2-8)** 6.5(2-10) 5(2-10)** Livestock diseases 8(1-9) 4.5(1-10)** 6.5(1-10) Drought 9(4-10) 9(6-10) 9(4-10) Poor government policy 10(1-10) 8(3-10) 9(1-10) Low capital 10(10-10) 1.5(1-3)** 6.5(1-10) Disorganized traders (brokers) 10(10-10) 7.5(5-10) 10(5-10) Producer-associated problems 10(10-10) 9(6-10) 10(6-10) 1= Most important constraint; 10= least important constraint. The range of ranks is shown in parenthesis.

135
Appendix 9: Median ranks (range) of livestock marketing constraints as perceived by herders and traders themselves, Loima Division, Turkana District (2002/2003) Constraint ProducersTraders Lower primary marketsUpper primary markets Secondary markets Overall rank N=72 N=20 N=14 N=25 N=59 Low prices of livestock 1(1-5)** 5(1-8)** 5(1-8)** 8(8-8) 7(1-8) Long distances to markets 2(1-4)** 1(1-3)** 8(8-8) 8(8-8) 8(1-8) Few livestock buyers 3(1-6)** 8(8-8) 2(1-6)** 3(1-7)** 4(1-8)** Lack of cash 4(1-6)** Insecurity to markets 5(2-6) 6(2-8) 6.5(2-8) 8(3-8) 7(2-8) Livestock diseases 5(4-6) 5(2-8) 6(1-8) 6(3-8) 6(1-8)** Low working capital 2(1-4)** 1(1-5)** 1(1-5)** 2(1-5)** Disorganized traders 7(3-8) 5.5(2-8) 8(8-8) 8(2-8) Lack of information 8(8-8) 8(8-8) 4(1-6)** 8(1-8) High transport costs 4(1-8)** 5(2-8) 2(1-7)** 4(1-8)** Producers and family problems 6(3-8) 3.5(2-8)** 6(3-8) 6(2-8) Drought 8(8-8) 8(8-8) 6(1-7) 8(1-8) 1= Most important constraint; 8= least important constraint. The range of ranks is shown in parenthesis.

136
Appendix 10: Significance levels for proportion of livestock types sold before marketing improves, proportion after marketing improves and proportional change in sales, in four adakar of Loima Division, Turkana District, 2002/2003. Type of livestock Variable Adakar Gender Wealth Goats In herd 0.21 0.71 0.00009** Sold before 0.35 0.96 0.47 Sold after 0.12 0.44 0.07 Proportional change 0.16 0.39 0.54 Cattle In herd 0.33 0.32 0.049** Sold before 0.84 0.88 0.44 Sold after 0.13 0.56 0.29 Proportional change 0.16 0.44 0.75 Camels In herd 0.097 0.69 0.0005** Sold before 0.16 0.29 0.33 Sold after 0.06 0.16 0.097 Proportional change 0.49 0.51 0.34 Donkeys In herd 0.097 0.027** 0.2 Sold before 0.15 0.5 0.29 Sold after 0.37 0.058 0.75 Proportional change 0.97 0.15 0.09** statistically significant difference

137
Appendix 11: Table showing off-take prediction per adakar, gender and wealth groups expressed as a proportion of total livestock population units in four species of livestock sold by pastoralists of Loima Division, Turkana District, 2002/2003.
Livestock Variable Gender group
Wealth group Adakar
type Men Women Rich Medium class Poor Natuba Kicono Acemie Aporon N=36 N=36 N=24 N=24 N=24 N=18 N=18 N=18 N=18 Goats In herd 61.75 60.06 51.67 57.75 73.29 58.22 68.56 60.78 56.06 Sold before 25.33 25.47 24.08 24.08 28.08 24.22 30.22 23.78 23.39 Sold after 19.19 16.94 16.67 14.88 22.67 21.56 21 12.83 16.89 Prop change -6.14 -8.53 -7.42 -9.17 -5.42 -2.67 -9.22 -10.94 -6.5 Cattle In herd 12.78 10.19 13.54 13.83 7.08 13.56 11.11 7.72 13.56 Sold before 1.92 2.06 2.29 2.5 1.17 2.11 1.39 1.89 2.56 Sold after 4.14 3.5 4.67 4.13 2.67 5.56 3.33 2.11 4.28 Prop change 2.22 1.44 2.38 1.63 1.5 3.44 1.94 0.22 1.72 Camels In herd 17.39 18.44 23.29 19.08 11.38 20.33 12.5 20.72 18.11 Sold before 1.42 2.17 2.54 1.38 1.46 3.11 1.72 1.22 1.11 Sold after 4.58 6.08 6.63 5.54 3.83 7.72 3.89 4.94 4.78 Prop change 3.17 3.92 4.08 4.17 2.38 4.61 2.17 3.72 3.67 Donkeys In herd 8 11.31 11.46 9.33 8.17 7.83 7.83 10.78 12.17 Sold before 1 1.47 0.46 1.63 1.63 0.44 0.94 1 2.56 Sold after 2.44 3.89 3.33 2.75 3.42 2.61 2.94 2.78 4.33 Prop change 1.44 2.42 2.88 1.13 1.79 2.17 2 1.78 1.78
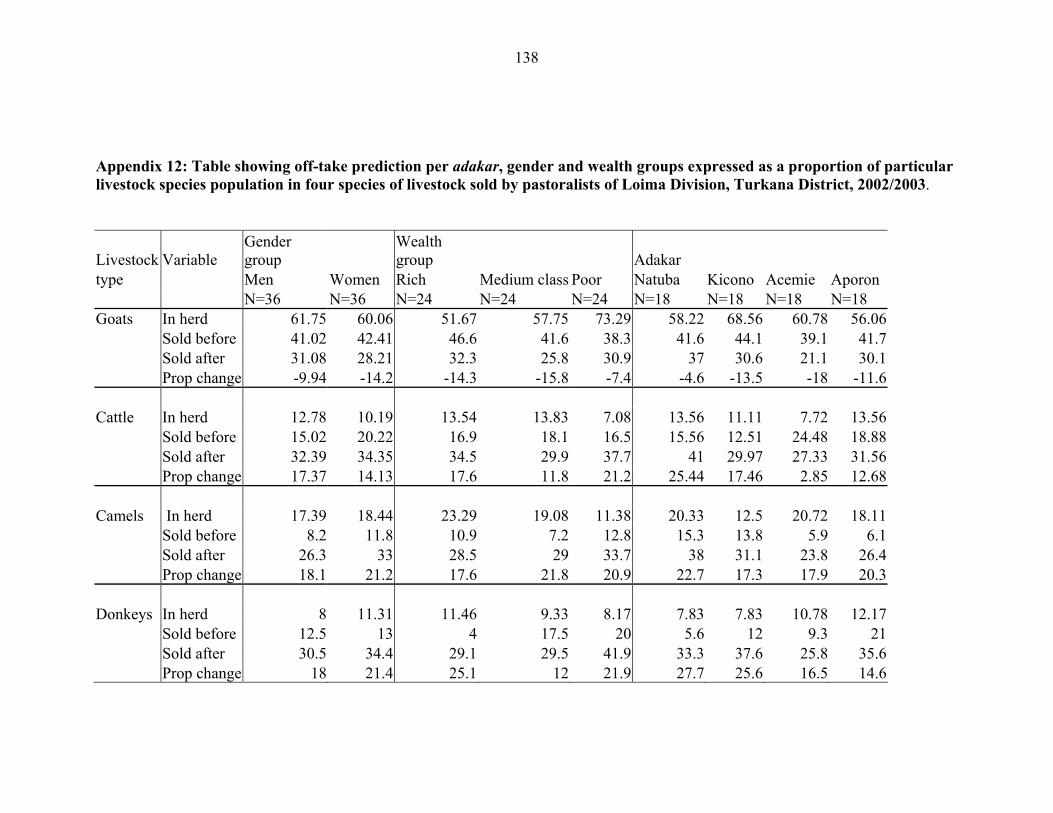
138
Appendix 12: Table showing off-take prediction per adakar, gender and wealth groups expressed as a proportion of particular livestock species population in four species of livestock sold by pastoralists of Loima Division, Turkana District, 2002/2003.
Livestock Variable Gender group
Wealth group Adakar
type Men Women Rich Medium class Poor Natuba Kicono Acemie Aporon N=36 N=36 N=24 N=24 N=24 N=18 N=18 N=18 N=18 Goats In herd 61.75 60.06 51.67 57.75 73.29 58.22 68.56 60.78 56.06 Sold before 41.02 42.41 46.6 41.6 38.3 41.6 44.1 39.1 41.7 Sold after 31.08 28.21 32.3 25.8 30.9 37 30.6 21.1 30.1 Prop change -9.94 -14.2 -14.3 -15.8 -7.4 -4.6 -13.5 -18 -11.6 Cattle In herd 12.78 10.19 13.54 13.83 7.08 13.56 11.11 7.72 13.56 Sold before 15.02 20.22 16.9 18.1 16.5 15.56 12.51 24.48 18.88 Sold after 32.39 34.35 34.5 29.9 37.7 41 29.97 27.33 31.56 Prop change 17.37 14.13 17.6 11.8 21.2 25.44 17.46 2.85 12.68 Camels In herd 17.39 18.44 23.29 19.08 11.38 20.33 12.5 20.72 18.11 Sold before 8.2 11.8 10.9 7.2 12.8 15.3 13.8 5.9 6.1 Sold after 26.3 33 28.5 29 33.7 38 31.1 23.8 26.4 Prop change 18.1 21.2 17.6 21.8 20.9 22.7 17.3 17.9 20.3 Donkeys In herd 8 11.31 11.46 9.33 8.17 7.83 7.83 10.78 12.17 Sold before 12.5 13 4 17.5 20 5.6 12 9.3 21 Sold after 30.5 34.4 29.1 29.5 41.9 33.3 37.6 25.8 35.6 Prop change 18 21.4 25.1 12 21.9 27.7 25.6 16.5 14.6

139