particle development in a fluidized bed …whitty/documents/naranjo msc thesis 2006.pdf · particle...
TRANSCRIPT

PARTICLE DEVELOPMENT IN A FLUIDIZED BED
BLACK LIQUOR STEAM REFORMER
by
Mauricio Naranjo
A thesis submitted to the faculty of The University of Utah
in partial fulfillment of the requirements for the degree of
Master of Science
Department of Chemical Engineering
The University of Utah
August 2006
Copyright © Mauricio Naranjo 2006
All Right Reserved
ABSTRACT
Low-temperature gasification of black liquor is a new alternative to the conventional
Tomlinson recovery boiler for recovering pulping chemicals and energy from black
liquor in pulp and paper mills. This process can be carried out in a fluidized bed based on
steam reforming at 600 oC using indirect heat supplied via heat exchangers built into the
fluid bed. As black liquor is injected into the bed, bed particles evolve through different
mechanisms, exhibiting variations in size and characteristics. Coating, agglomeration,
attrition and fragmentation are mechanisms that have been identified as contributing to
bed particle evolution.
Four experimental approaches were used to develop fundamental understanding of
these mechanisms, and to qualitatively address particle development in this unit. Visual
analysis of cross-sectional areas of bed solids from two commercial steam reforming
units showed that bed particles grow by deposition of one to two superimposed layers of
residue rich in Na and K, which are more distinctive on bed particles larger than 250 µm.
Lab-scale fluidized bed reactor experiments showed important effects of adding large
liquor droplets on bed particle characteristics, particularly on particle size distribution and
shape, which promotes the formation of droplet-induced agglomerates. Cold fluidization
of bed solids in a Plexiglas column indicated that considerable mechanical attrition
initially occurs with bed particles larger than 300 µm, followed by a rapid attrition decay

as particles are rounded off. Compression, glass cyclone and tube furnace experiments
showed that chemical consumption of the organic matter remaining in the char residue
combined with vigorous solids fluidization presumably leads to significant fragmentation
of agglomerates, which leads to the formation of indirectly coated particles.
It was concluded from this study that particle development in a fluidized bed black
liquor steam reformer is a complex combination of mechanisms and submechanisms that
simultaneously participate in bed particle evolution. Coating and attrition seem to be the
most significant mechanisms, followed by agglomeration which results from poorly
controlled conditions. Once agglomeration has occurred, fragmentation then controls the
excessive particle growth caused by agglomeration.
v

Mi vida, la fuerza de nuestro amor nos brindará una vida llena de mutuos éxitos.

CONTENTS
ABSTRACT iv ACKNOWLEDGMENTS viii 1 INTRODUCTION 1
1.1 World and U.S. Pulp and Paper Industry 1 1.2 Pulping Process 2
1.2.1 Black Liquor 2 1.2.2 Black Liquor Recovery Process 5
1.3 Fluidized-bed Steam Reforming of Black Liquor 10 1.3.1 Particle Mechanisms 11
1.4 Research Objectives 16
2 LITERATURE REVIEW 17
2.1 Platform for the Implementation of Black Liquor Gasification 17 2.2 Black Liquor Gasification Technologies 19 2.3 Fluidized Bed Technology 22
2.3.1 Coating 25 2.3.2 Agglomeration 27 2.3.3 Attrition 29 2.3.4 Fragmentation 31
3 EXPERIMENTAL 34
3.1 Introduction 34 3.2 Experimental Set-up 34
3.2.1 Coating Studies 34 3.2.2 Agglomeration Studies 35 3.2.3 Attrition Studies 36 3.2.4 Fragmentation Studies 41
4 RESULTS AND DISCUSSION 51
4.1 Coating Visual Analysis 51 4.2 Agglomeration Results 60 4.3 Attrition Results 78

4.4 Fragmentation Results 91 4.4.1 Compression Results 91 4.4.2 Cyclone Results 93 4.4.3 Agglomerate Break-up by Chemical Reaction 95
5 CONCLUSIONS 101
5.1 Particle Development in a Fluidized Bed Black Liquor Steam Reformer 101 5.2 Recommendations for Future Work 105
APPENDIX STEAM REFORMER BED MEDIA CHEMICAL
ANALYSIS PROCEDURE 107 REFERENCES 109
vii

ACKNOWLEDGMENTS
I would like to truly thank Dr. Kevin Whitty for his guidance and total support toward
completion of this thesis.
Special thanks to Dr. Eric Eddings for giving me the opportunity to work for the
Institute of Combustion and Energy Studies (ICES), and trusting in my professionalism.
This experimental work would not have been possible without the help of the
technical staff of ICES, particularly, Mr. Dana Overacker.
The financial support for this research was provided by DOE cooperative agreement
DE-FC26-02NT41490. The technical contribution of Georgia-Pacific Corporation,
Norampac Corporation and ThermoChem Recovery International is also acknowledged.
CHAPTER 1
INTRODUCTION
1.1 World and U.S. Pulp and Paper Industry
The pulp and paper industry is quite integrated and plays a very important role in both
world and U.S. economies. More than 300 billion tons per year of finished paper products
are produced globally with annual revenues over 500 billion dollars, about 166 billion
dollars are attributable to U.S. industry.1 Economically, the forest products industry (of
which the pulp and paper industry is a major part) ranks as the ninth largest industry in
the U.S. manufacturing sector,2 contributing nearly 5% to the U.S. gross domestic
product (GDP).3 Pulp, paper and paperboard mills account for 12% of the total
manufacturing energy use in the U.S.4 However, the advent of strong competitors in the
global market, such as Asia and South America, and the modernization of European
counterparts, are forcing the U.S. pulp and paper industry to reevaluate its business
models and processes to remain competitive.5
One key factor in this repositioning process is to make U.S. pulp and paper mills
more energetically efficient, which ultimately would contribute to improve the U.S. pulp
and paper industry’s economy. A U.S. government-industry program, Agenda 2020, has
identified technological advancements the U.S. pulp and paper industry must reach in
order to obtain its economic objectives.6 Among those advancements, black liquor
2
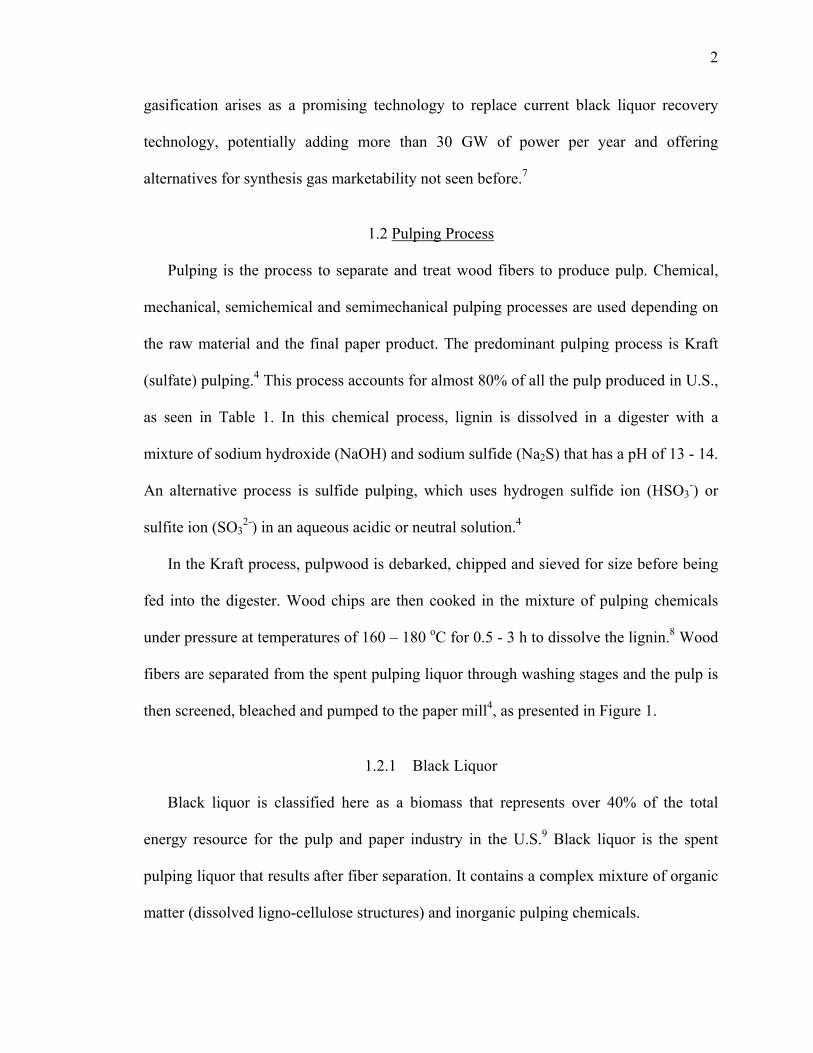
gasification arises as a promising technology to replace current black liquor recovery
technology, potentially adding more than 30 GW of power per year and offering
alternatives for synthesis gas marketability not seen before.7
1.2 Pulping Process
Pulping is the process to separate and treat wood fibers to produce pulp. Chemical,
mechanical, semichemical and semimechanical pulping processes are used depending on
the raw material and the final paper product. The predominant pulping process is Kraft
(sulfate) pulping.4 This process accounts for almost 80% of all the pulp produced in U.S.,
as seen in Table 1. In this chemical process, lignin is dissolved in a digester with a
mixture of sodium hydroxide (NaOH) and sodium sulfide (Na2S) that has a pH of 13 - 14.
An alternative process is sulfide pulping, which uses hydrogen sulfide ion (HSO3-) or
sulfite ion (SO32-) in an aqueous acidic or neutral solution.4
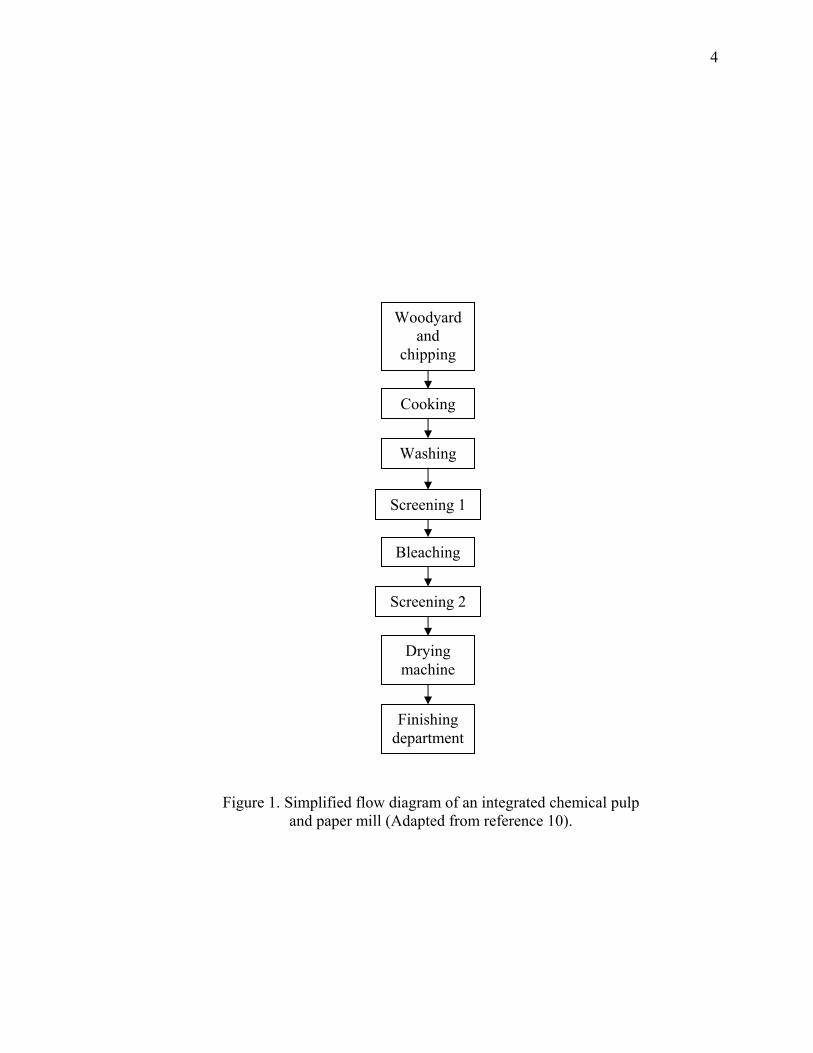
In the Kraft process, pulpwood is debarked, chipped and sieved for size before being
fed into the digester. Wood chips are then cooked in the mixture of pulping chemicals
under pressure at temperatures of 160 – 180 oC for 0.5 - 3 h to dissolve the lignin.8 Wood
fibers are separated from the spent pulping liquor through washing stages and the pulp is
then screened, bleached and pumped to the paper mill4, as presented in Figure 1.
1.2.1 Black Liquor
Black liquor is classified here as a biomass that represents over 40% of the total
energy resource for the pulp and paper industry in the U.S.9 Black liquor is the spent
pulping liquor that results after fiber separation. It contains a complex mixture of organic
matter (dissolved ligno-cellulose structures) and inorganic pulping chemicals.

3
Table 1. Estimated pulp production in United States in 2000.9
Process Thousand Tons Percentage (%)
Mechanical 6501 6.13
Semi-chemical 3976 10.02
Chemical 54375 83.84
- Sulfide 1116 1.72
- Kraft 53259 82.12
- Unbleached 21281 32,81
- Bleached 31978 49.31
Total 64852 100
4
Figure 1. Simplified flow diagram of an integrated chemical pulp and paper mill (Adapted from reference 10).
Woodyard and
chipping
Cooking
Washing
Screening 1
Bleaching
Screening 2
Drying machine
Finishing department

5
Due to its chemical complexity, black liquor presents unique physical and chemical
properties. Among these properties, the percentage of dry solids, viscosity, heating value,
heat capacity, surface tension, inorganic component solubility, density and thermal
conductivity are of most importance.11 Chemical composition and molecular structure are
also important parameters that determine the physical and transport properties of black
liquor. For example, black liquor can behave as a Newtonian or non-Newtonian fluid,
depending on lignin and polysaccharides molecular size, shape and conformation.11
Typically, concentrated black liquor has viscosity, density and heating values of 70 – 120
cP, 1400 kg/m3, and 13.5 – 14 MJ/kg dry basis (HHV), respectively.12
1.2.2 Black Liquor Recovery Process
Black liquor recovery is a crucial component of the chemical pulping process. It
recovers pulping chemicals for reuse, and is a source of energy by conversion of the
remaining organic content. Pulp and paper mills experience considerable financial
benefits as a result of utilizing this process, as costs related to the purchase of chemicals
and energy are reduced. In addition, there are environmental benefits, with black liquor
recovery reducing the amount of waste discharge to the environment.
The weak black liquor (solids content of approximately 15% by weight) obtained
from the fiber separation stage is concentrated by evaporation to a solids content between
60 to 80%. At this point, black liquor is burned or gasified to release its chemical energy
and recover its inorganic content. This inorganic residue undergoes a further
causticization process, in which calcium hydroxide (Ca(OH)2) is reacted with the sodium
carbonate residue (Na2CO3) to regenerate sodium hydroxide (NaOH), one of the starting
6
pulping chemicals (white liquor). A schematic of the recovery process is presented in
Figure 2.
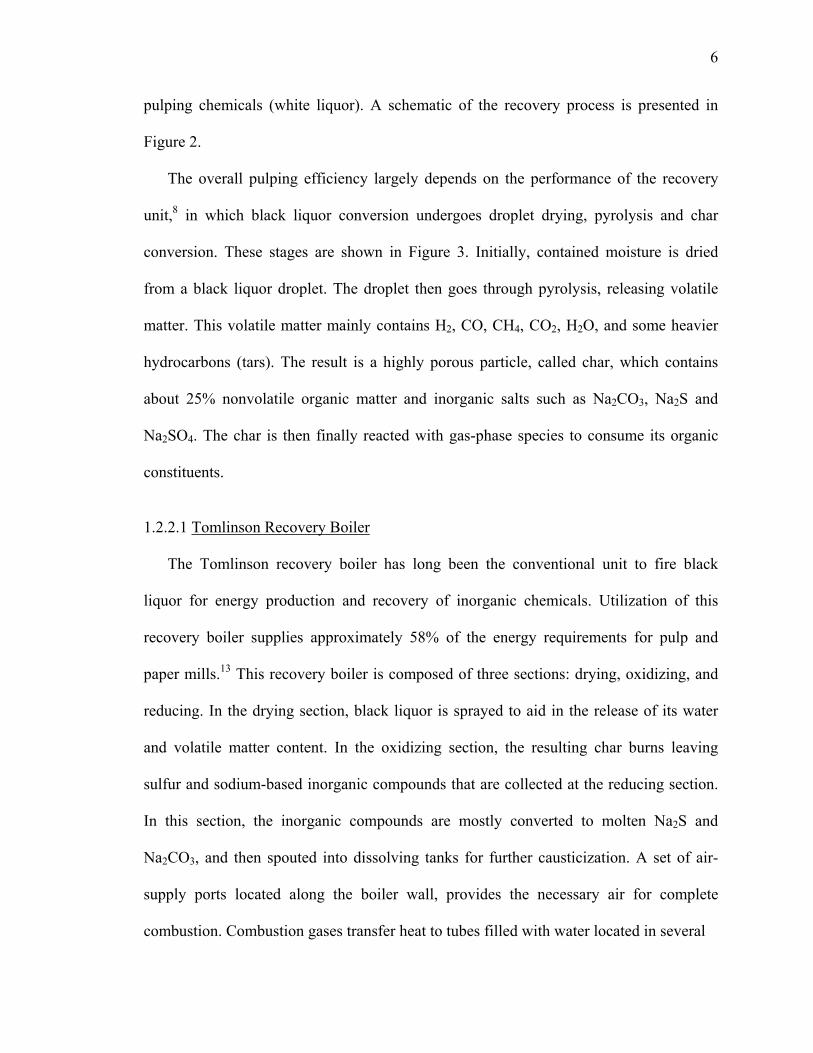
The overall pulping efficiency largely depends on the performance of the recovery
unit,8 in which black liquor conversion undergoes droplet drying, pyrolysis and char
conversion. These stages are shown in Figure 3. Initially, contained moisture is dried
from a black liquor droplet. The droplet then goes through pyrolysis, releasing volatile
matter. This volatile matter mainly contains H2, CO, CH4, CO2, H2O, and some heavier
hydrocarbons (tars). The result is a highly porous particle, called char, which contains
about 25% nonvolatile organic matter and inorganic salts such as Na2CO3, Na2S and
Na2SO4. The char is then finally reacted with gas-phase species to consume its organic
constituents.
1.2.2.1 Tomlinson Recovery Boiler
The Tomlinson recovery boiler has long been the conventional unit to fire black
liquor for energy production and recovery of inorganic chemicals. Utilization of this
recovery boiler supplies approximately 58% of the energy requirements for pulp and
paper mills.13 This recovery boiler is composed of three sections: drying, oxidizing, and
reducing. In the drying section, black liquor is sprayed to aid in the release of its water
and volatile matter content. In the oxidizing section, the resulting char burns leaving
sulfur and sodium-based inorganic compounds that are collected at the reducing section.
In this section, the inorganic compounds are mostly converted to molten Na2S and
Na2CO3, and then spouted into dissolving tanks for further causticization. A set of air-
supply ports located along the boiler wall, provides the necessary air for complete
combustion. Combustion gases transfer heat to tubes filled with water located in several

7
Figure 2. Schematic of the recovery process (Adapted from reference 14).
Figure 3. Conversion stages of black liquor (Adapted from reference 14)
Digestion
Concentrators
Recovery unit
Causticizing
Wood
Pulp
Weak black liquor
Strong black liquor
Gases
Water
Smelt
Green liquor
White liquor
Drying Smelt Char conversion Pyrolysis
H2O
Gasifying agent
Fuel gases Volatile
matter
8
areas: the walls of the recovery boiler in the radiant zone, the boiler tube bank and the
economizer section. A schematic of a Tomlinson recovery boiler is presented in Figure 4.
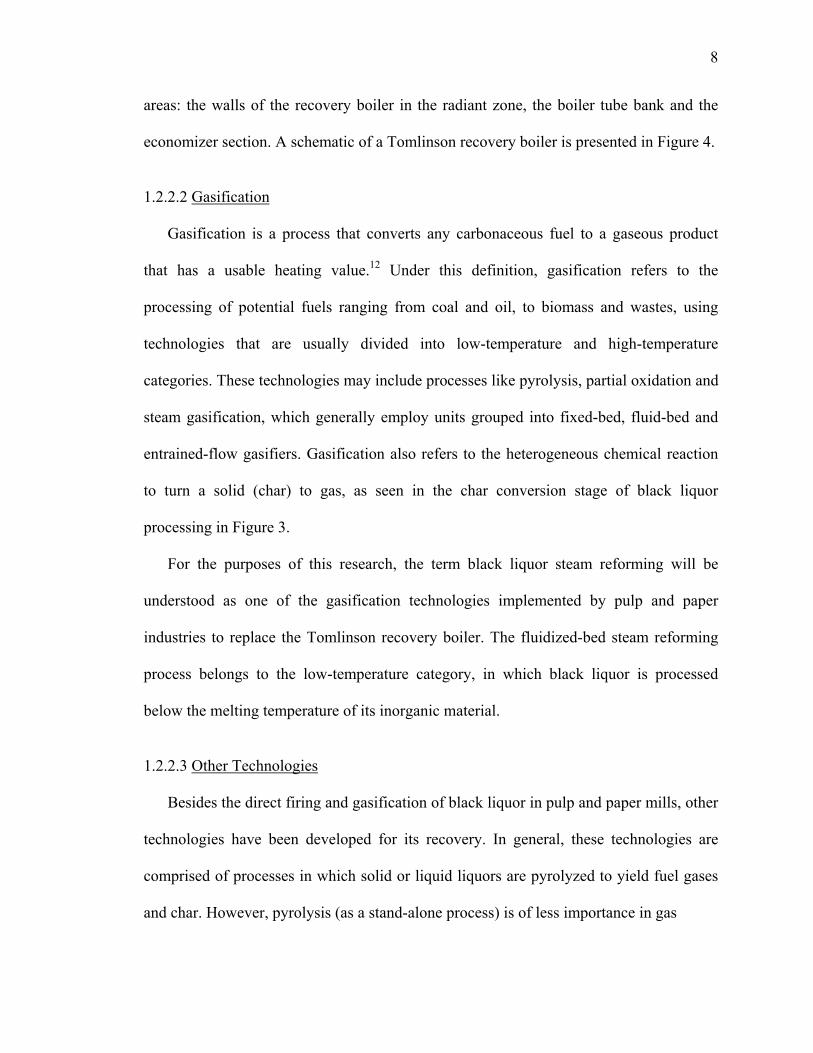
1.2.2.2 Gasification
Gasification is a process that converts any carbonaceous fuel to a gaseous product
that has a usable heating value.12 Under this definition, gasification refers to the
processing of potential fuels ranging from coal and oil, to biomass and wastes, using
technologies that are usually divided into low-temperature and high-temperature
categories. These technologies may include processes like pyrolysis, partial oxidation and
steam gasification, which generally employ units grouped into fixed-bed, fluid-bed and
entrained-flow gasifiers. Gasification also refers to the heterogeneous chemical reaction
to turn a solid (char) to gas, as seen in the char conversion stage of black liquor
processing in Figure 3.
For the purposes of this research, the term black liquor steam reforming will be
understood as one of the gasification technologies implemented by pulp and paper
industries to replace the Tomlinson recovery boiler. The fluidized-bed steam reforming
process belongs to the low-temperature category, in which black liquor is processed
below the melting temperature of its inorganic material.
1.2.2.3 Other Technologies
Besides the direct firing and gasification of black liquor in pulp and paper mills, other
technologies have been developed for its recovery. In general, these technologies are
comprised of processes in which solid or liquid liquors are pyrolyzed to yield fuel gases
and char. However, pyrolysis (as a stand-alone process) is of less importance in gas

9
Figure 4. Tomlinson recovery boiler.
Primary air supply
Secondary air supply
Tertiary air supply
Black liquor spray nozzles
Reduction section
Drying section
Oxidation section
Char bed
Superheater
Boiler tube bank
Screen tubes
Smelt spout
10
production today.12
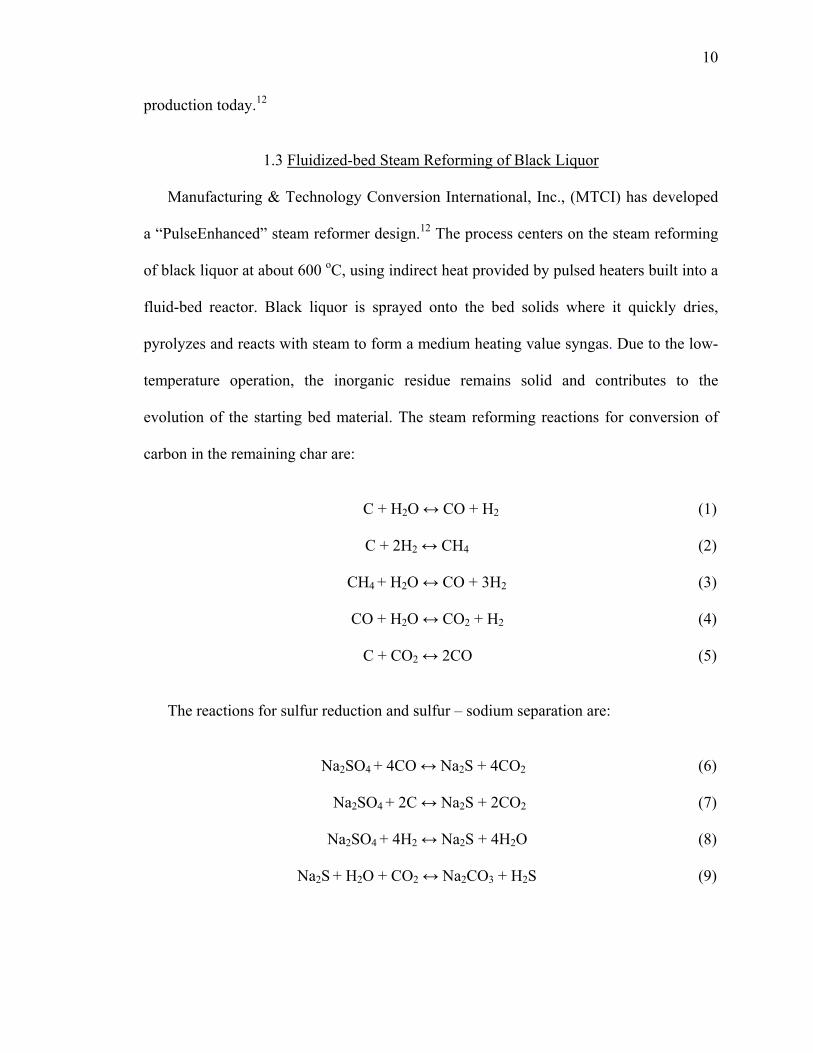
1.3 Fluidized-bed Steam Reforming of Black Liquor
Manufacturing & Technology Conversion International, Inc., (MTCI) has developed
a “PulseEnhanced” steam reformer design.12 The process centers on the steam reforming
of black liquor at about 600 oC, using indirect heat provided by pulsed heaters built into a
fluid-bed reactor. Black liquor is sprayed onto the bed solids where it quickly dries,
pyrolyzes and reacts with steam to form a medium heating value syngas. Due to the low-
temperature operation, the inorganic residue remains solid and contributes to the
evolution of the starting bed material. The steam reforming reactions for conversion of
carbon in the remaining char are:
C + H2O ↔ CO + H2 (1)
C + 2H2 ↔ CH4 (2)
CH4 + H2O ↔ CO + 3H2 (3)
CO + H2O ↔ CO2 + H2 (4)
C + CO2 ↔ 2CO (5)
The reactions for sulfur reduction and sulfur – sodium separation are:
Na2SO4 + 4CO ↔ Na2S + 4CO2 (6)
Na2SO4 + 2C ↔ Na2S + 2CO2 (7)
Na2SO4 + 4H2 ↔ Na2S + 4H2O (8)
Na2S + H2O + CO2 ↔ Na2CO3 + H2S (9)

11
1.3.1 Particle Mechanisms
Particle development plays an important role in the performance of fluidized beds. As
black liquor is injected into the fluid-bed reactor, bed solids evolve through different
particle mechanisms, exhibiting variations in particle size distribution and solids
characteristics. The spraying of black liquor on bed solids forms a coating process that
leads to particle growth by layer formation. However, other particle mechanisms occur
depending on the operating conditions. Four basic particle development mechanisms
have been identified. Coating and agglomeration correspond to particle size growth, and
attrition and fragmentation correspond to particle size reduction.
1.3.1.1 Coating
Coating is defined as the particle growth mechanism in which one or several
consecutive layers of a substance accumulate on the particle surface.15 This mechanism
occurs when bed solids, which are usually the inorganic residue of steam reforming, pass
through the black liquor spraying zone. Liquor droplets and bed solids randomly collide,
forming coated solids to undergo drying, pyrolysis and steam reforming steps. A
schematic of the coating mechanism is presented in Figure 5.
1.3.1.2 Agglomeration
Agglomeration is defined as the particle growth mechanism in which two or more
particles adhere uncontrollably, yielding large undesirable agglomerates that can result in
bed defluidization and system shutdown.16 In general, agglomerates can be formed by: 1)
“sticky” particles and 2) droplet-particle collisions. The former occurs when the inorganic
residue of black liquor melts, and creates molten phases on particles that cause them to

12
Figure 5. Schematic of coating mechanism.
Heat
H2O(g) VOC H2O(g)
H2O(g)
H2
CO
CH4
Drying Pyrolysis
Steam reforming
Coating Inorganic residue
Bed solids
Liquor droplets
Collision Spray Nozzle
~Na2CO3 ~Na2CO3 ~Na2CO3 ~Na2CO3 ~Na2CO3
13
stick together. The latter occurs when large droplets capture several particles to create a
“cluster” of individual particles bound by liquor. Such agglomerates nevertheless
undergo drying, pyrolysis and steam reforming. The agglomeration mechanism is
presented in Figure 6.
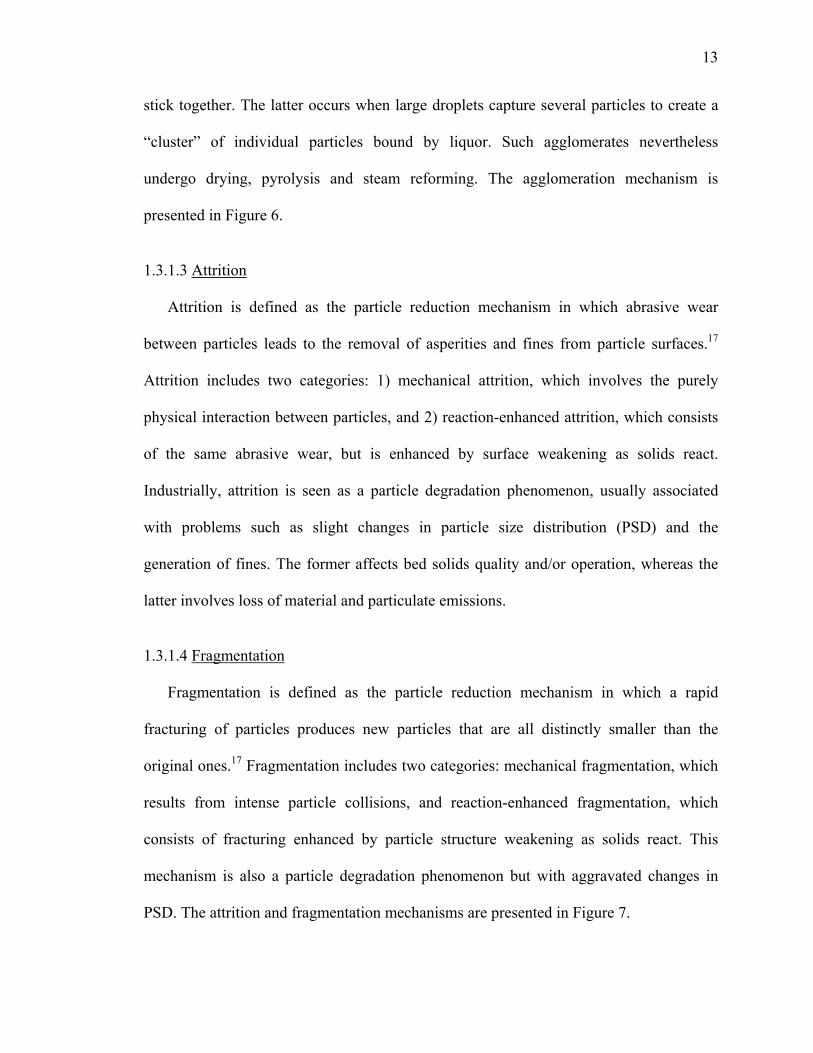
1.3.1.3 Attrition
Attrition is defined as the particle reduction mechanism in which abrasive wear
between particles leads to the removal of asperities and fines from particle surfaces.17
Attrition includes two categories: 1) mechanical attrition, which involves the purely
physical interaction between particles, and 2) reaction-enhanced attrition, which consists
of the same abrasive wear, but is enhanced by surface weakening as solids react.
Industrially, attrition is seen as a particle degradation phenomenon, usually associated
with problems such as slight changes in particle size distribution (PSD) and the
generation of fines. The former affects bed solids quality and/or operation, whereas the
latter involves loss of material and particulate emissions.
1.3.1.4 Fragmentation
Fragmentation is defined as the particle reduction mechanism in which a rapid
fracturing of particles produces new particles that are all distinctly smaller than the
original ones.17 Fragmentation includes two categories: mechanical fragmentation, which
results from intense particle collisions, and reaction-enhanced fragmentation, which
consists of fracturing enhanced by particle structure weakening as solids react. This
mechanism is also a particle degradation phenomenon but with aggravated changes in
PSD. The attrition and fragmentation mechanisms are presented in Figure 7.

14
Figure 6. Agglomeration mechanism: (a) agglomerate formation due to particle-particle collision and (b) agglomerate formation due to droplet-particle collision.
Drying +
Pyrolysis +
Steam reforming
CapturingBed solids
Liquor droplets
CollisionSpray Nozzle
Agglomerate
Molten phase Agglomerate
Collision(a)
(b)
15
Figure 7. Particle reduction mechanisms: (a) attrition and (b) fragmentation.
Collision
Bed particles Fragments
(a)
(b)
Abrasive contact
Fines Attriting particles
16
1.4 Research Objectives
The research described in this thesis was conducted to achieve the following
objectives:
1. Identify and describe mechanisms that participate in particle size development in
a fluidized bed black liquor steam reformer;
2. Experimentally decouple each particle mechanism to study it separately;
3. Identify the important process variables for each particle mechanism under lab-
scale conditions, and
4. Interpret the experimental data to qualitatively address particle development in a
fluidized bed black liquor steam reformer.
17
CHAPTER 2
LITERATURE REVIEW
2.1 Platform for the Implementation of Black Liquor Gasification
Pulp and paper mills are large and complex facilities that consume significant
amounts of energy. Energy consumption represents the second largest cost among
material inputs and accounts for an average of 17% of the total material and energy costs
to the pulp and paper industry. However, pulp and paper mills generate about half of their
total fuel and electricity use.4
Energy use in integrated pulp and paper mills consists of the production of steam and
electricity. Steam is mainly used in wood digestion, black liquor evaporation, and pulp
and paper drying. Electricity is more uniformly distributed around the mill, but mostly
used in pumping, air-handling and lighting.18 The energy demand in pulp and paper mills
is partially satisfied by Tomlinson recovery boilers that produce high pressure steam to
generate electricity in steam turbines. The low pressure steam exhaust is then used for
process heating.19
This conventional steam cycle technology has certain drawbacks: (1) aging recovery
equipment, (2) low electricity-to-heat ratio, (3) high capital cost and (4) risk of
smelt/water explosions.20 This combination of factors makes this industry a good
candidate to adopt new energy technologies. However, any energy-related investment for
this industry represents a large portion of its economic resources and competes with other

18
capital investments; therefore, promising energy improvement projects must have
additional benefits such as improvements in productivity, chemical recovery,
environmental performance, and/or worker safety.4
Integrated gasification combined cycle (IGCC) technologies (based on biomass
gasification and gas turbine cycle configuration) have been identified as potential
alternatives to substitute for the conventional steam cycle, generating significantly (3 to
4.5 times) more electricity21, 22 and important reductions in carbon emissions.23 The
reason for this increment in electricity output is the high fuel calorific value of product
gases when biomass is gasified rather than combusted,24 whereas the reduction in
emissions is because more electricity is generated from gasification, thereby reducing the
import of fossil-based power to the mill. Thus, there is less net CO2 emitted into the
atmosphere.25 Economic studies focused on black liquor gasification combined cycle
(BLGCC) have shown that capital costs are similar to those for an equivalent Tomlinson
recovery boiler/steam turbine configuration, but that 100 – 175% more electric power is
generated.26, 27 In fact, a technical energy study in the Swedish pulp and paper industry
has manifested the potential of BLGCC technologies to minimize CO2 emissions.28
Black liquor gasification may also facilitate the implementation of autocausticization,
which is the direct regeneration of NaOH from Na2CO3 using a metal oxide like Al2O3,
Fe2O3 or TiO2. The generalized reactions for autocausticization are:
aNa2CO3 + bMxOy → aNa2O•bMxOy + aCO2 (10)
aNa2O•bMxOy + (a+z)H2O → 2aNaOH + bMxOy•zH2O (11)

19
This process may completely eliminate the lime cycle, and thus bring out some extra
energy and cost savings for the whole recovery system.29 A study on TiO2-based direct
causticization during black liquor gasification in a fluidized bed30 showed that this
process is technically possible and can achieve a causticizing efficiency of 97% as long
as temperature, air ratio and Na2O/TiO2 ratio are about 750 oC, 0.3, and 0.35,
respectively. Moreover, low-temperature black liquor gasification, where carbon
conversion is achieved below the melting temperature of the inorganic matter, prevents
smelt formation, thus avoiding smelt/water explosions and increasing worker safety. On-
site availability of biomass fuels, particularly black liquor, in pulp and paper mills makes
the implementation of such technologies less costly.
Despite the fact that some studies have exposed technical difficulties of black liquor
gasification as compared to Tomlinson recovery boilers, for instance costly gas cleaning
systems19 and the need for advanced building materials;31, 32 black liquor gasification is
nevertheless gaining more attention from the pulp and paper industry and has the
potential to attain the additional benefits that this industry seeks for significant capital
investments.
2.2 Black Liquor Gasification Technologies
Although several studies have evaluated the potential benefits of the overall BLGCC
process,20-30 a large portion of the pulp and paper industry’s attention has been centered
on alternative units to the Tomlinson recovery boiler. A comprehensive review33 of these
alternative technologies classified them into: solid-phase nongasification processes,
liquid-phase coking processes, and low and high temperature gasification processes.
Among the reviewed configurations, two process alternatives are on the verge of

20
becoming commercially successful: Chemrec high-temperature, downwards-flowing,
entrained-flow gasifier and MTCI low-temperature, bubbling fluidized bed steam
reformer.
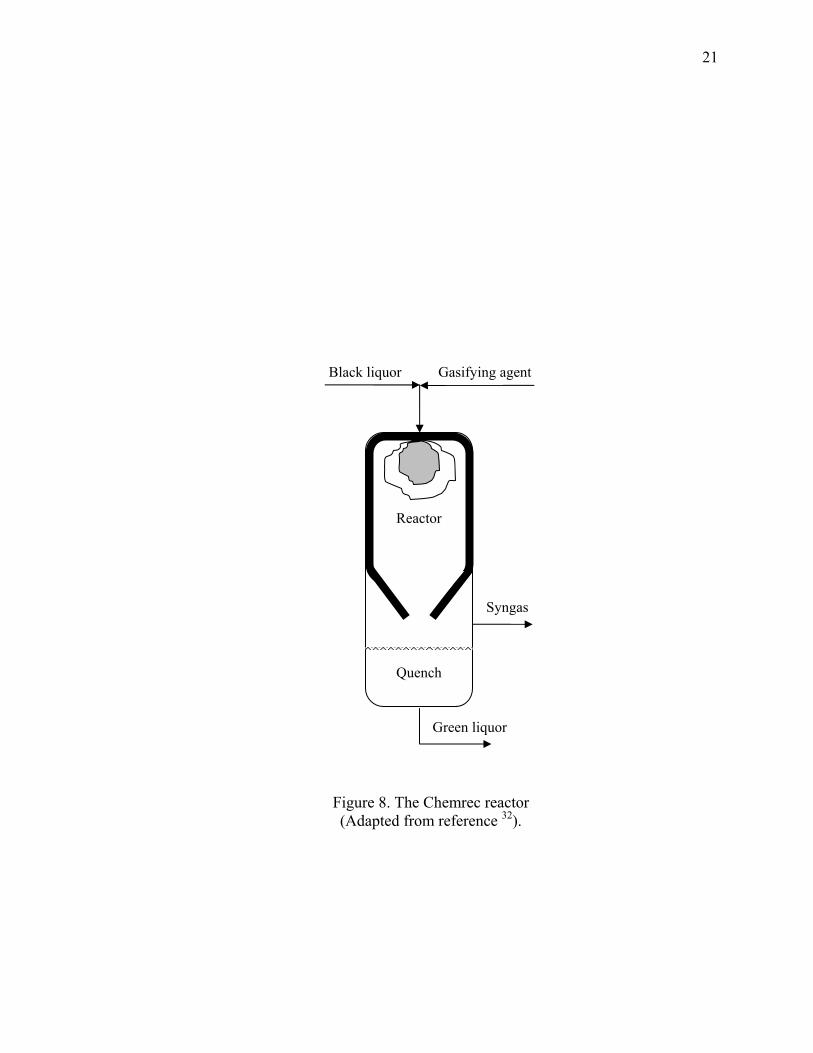
The Chemrec system is a partial oxidation process carried out in a refractory-lined
entrained-flow quench reactor that operates at 950-1000 oC, above the melting point of
the inorganic matter in black liquor. This reactor is divided into a reaction zone and a
quench zone. In the reaction zone, organic material is gasified to yield fuel gases and
smelt droplets composed of sodium and sulfur compounds. In the quench zone, smelt
droplets are then separated from fuel gases and dissolved in a quench bath to form a
green liquor solution.12 A diagram of the Chemrec reactor is presented in Figure 8. One
of the main advantages of this system is its low tar production due to the high
temperature operation. However, molten inorganic compounds can create a severely
corrosive environment for both metals and refractories. Indeed, new phases, e.g. NaAlO2
formed as a result of reaction of the alumina refractory phase with sodium compounds,
can expand to generate significant stresses on the surface refractory.34 In addition, high
temperature processes may generate alkali aerosols (fume), which are known to cause
significant gas turbine blade corrosion.20 This major corrosion problem must be
overcome to be able to operate this unit reliably and economically for sufficient periods
of time.
The MTCI system is a gasification process based on steam reforming of black liquor
and carried out in a fluidized bed reactor that operates at about 600 oC, below the melting
point of the inorganic matter in black liquor. This reactor supplies the necessary heat for
the endothermic reactions by a set of “Pulsed-Enhanced” combustor tubes located within
21
Figure 8. The Chemrec reactor (Adapted from reference 32).
Gasifying agent Black liquor
Reactor
Quench
Syngas
Green liquor
22
the reactor.12 Black liquor is sprayed onto the bed solids where it quickly dries, pyrolyzes
and reacts with steam to form a fuel syngas that is hydrogen rich (63 – 65%)35 and has a
medium heating value of 9 – 11 MJ/Nm3.36 The inorganic residue remains solid and
contributes to the evolution of the starting bed material. As residue is being formed,
batches of bed solids are periodically drained to proceed for further causticization. A
diagram of the MTCI reactor is presented in Figure 9.
The principal advantage of the MTCI system over the Tomlinson recovery boiler or
Chemrec technology is its low-temperature operation. This prevents smelt formation and
involves less heat loss, no risk of smelt/water explosions and a reduced corrosive
environment for both metals and refractories.34 Although low-temperature operation
decreases the rate of carbon conversion, alkali compounds in the remaining char act as
catalysts for the steam reforming reactions.37 In addition, the resulting H2/CO gas
environment contributes to the reduction of sulfur compounds into hydrogen sulfide24
while achieving near complete sulfur-sodium separation from the salts present in the
black liquor,38 as shown by equations 6-9. However, the tendency for bed
agglomeration39 and the efficient removal of tars40 still remain as major technical barriers
for successful implementation of MTCI’s fluidized bed system.
2.3 Fluidized Bed Technology
Industrial applications of fluidized beds range from basic physical operations (drying,
coating, adsorption, etc.) to complicated chemical operations such as synthesis reactions
(Fischer-Tropsch synthesis, polymerization, etc.), hydrocarbon cracking, calcination,
incineration, combustion and gasification.41 Among the many contacting methods
between liquid, gas and solids, fluidized beds provide a fluid-like behavior of solids that

23
Figure 9. The MTCI reactor
(Adapted from reference 42).
Fluidized bed
Syngas
Steam
Black liquor
Bed solids
Tube heaters
24
greatly enhances phase mixing, isothermal operation, and heat and mass transfer rates.41
Such features make fluidized bed technology suitable for steam reforming of black
liquor. Indeed, gasification via steam reforming of straw black liquor using a fluidized
bed reactor achieved 75% carbon conversion to gas, and cold gas efficiency of 90%.43
Moreover, bed solids provide enough surface area for black liquor to dry, pyrolyze and
react with the gasifying agent.
Numerous studies have been carried out on fluidized bed applications in thermo-
chemical conversion of biomass fuels.39, 43-55 In general, it can be said that fluidized bed
performance is strongly dependent on bed particle characteristics, which result from
physical and chemical phenomena inherent in this type of solid-gas-liquid configuration.
Such phenomena will be called particle mechanisms from now on.
Fluidization of particles varies greatly among gas-solid systems and numerous factors
affect it, including type of solids, process, geometry, and PSD.41 PSD is of fundamental
importance to the performance and operation of fluidized beds, because it influences
fluidization behavior, transport and kinetic properties, and process considerations for
operation.56 Effects of PSD in fluidized beds have been extensively investigated. For
example, a wide PSD of a fluid cracking catalyst during ozone decomposition showed to
have high chemical conversion, reactor efficiency and regime transition (from bubbling
to turbulent).57 Kunii et al.41 also noted that with a wide PSD, the presence of fines act as
a lubricant for large particles helping to improve the quality of fluidization. Lv et al.44
observed that smaller particles produced more CH4, CO, C2H4 and less CO2, being more
favorable for gas quality and yield, when gasifying biomass particles in a fluidized bed.
Attempts to measure PSD in fluidized beds56, 58, 59 have been made in order to obtain

25
accurate, on-line measurements of this important parameter to improve plant safety,
product quality, and process performance in many fluidized bed processes.
PSD is influenced by many factors, including gas-liquid injection, solids feed,
discharge, elutriation, and particle growth and shrinkage.56 However, PSD seems to be
mostly dependent on the changes to the size of individual particles.60 In general, typical
mechanisms that change the size of individual particles are particle coating,
agglomeration, attrition and fragmentation. These mechanisms comprise chemical and
physical particle interactions that can have a significant effect on their microscopic and
macroscopic behavior.61
2.3.1 Coating
Coating is defined as the particle growth mechanism in which one or several
consecutive layers of a substance accumulate on a particle surface.15 Beyond thermo-
chemical conversion of biomass fuels, fluidized bed coating and agglomeration are
broadly practiced in areas such as detergent manufacturing, food processing, and
especially in the pharmaceutical industry.16 Some of the reasons for particle size
enlargement by coating are: 1) to improve the flow and physical properties of powders; 2)
to produce a desired PSD or product geometry; 3) to improve appearance, taste, odors of
particles, and 4) to protect particles from oxygen, humidity, light, etc.15 The influence of
this mechanism on bed solids has been investigated, e.g., studies on fluidized bed coating
and agglomeration using sand particles under spraying of an aqueous solution of NaCl
concluded that coating is a size-dependent phenomenon, which occurs principally on
particles larger than 200 µm.15, 16 Calculation of heat-transfer coefficients from fluidizing
particles to immersed metallic spheres reported lower values for the coated particles than

26
those for the uncoated ones.62 Seville et al.61 also found that bed particles in a fluidized
bed can become more cohesive with the addition of thin layers of liquids. These studies
clearly show that coating can have important effects on the particle size as well as on the
thermo-physical properties of the bed material.
The importance of coating in fluidized bed combustors and gasifiers relies on the
direct relation between coating and agglomeration. Fluidizing particles provide surface
area for ash deposition during either combustion or gasification. Cammarota et al.45
showed that co-deposition of sodium compounds and carbon resulted in a compact
coating on sand particles during incineration of slurry waste in a fluidized bed.
The formation of coating layers on different bed materials was studied in the fluidized
bed combustion of various biomasses.25 This study concluded that the composition of the
coating layers depended on both the nature of bed material and fuel. One to three
superimposed layers were observed on bed particles, with the innermost layer rich in
alkali silicates, whereas the outermost layer was rich in calcium and magnesium. Coating
layers containing sodium or potassium may be adhesive and can cause the formation of
agglomerates, while coating layers containing magnesium may protect the bed particles
from agglomeration.25
For high-alkali-containing biomass fuels, direct attack by potassium compounds into
quartz sand results in low-melting potassium silicates.51 Visser et al.63 suggested that
coating layers formed with time on the surface of the bed material might form necks
between coatings of individual particles at certain critical conditions (coating thickness,
temperature, etc.), which initiates agglomeration. Coating of bed solids during steam
reforming of black liquor may follow the formation of superimposed layers driven by
27
physical residue deposition, since bed solids used as fluidization media result from the
same inorganic residue of the black liquor processing. Therefore, any agglomeration
tendency in the MTCI system would derive from factors other than the formation of new
phases. Typically, coating has been studied by using scanning electron microscopy
(SEM) and electron dispersive X-ray spectroscopy (EDS) to observe layer build up and
elemental distribution.15, 25, 50, 52
2.3.2 Agglomeration
Agglomeration is defined as the particle growth mechanism in which several particles
adhere uncontrollably,16 yielding large undesirable agglomerates that might result in bed
defluidization and system shutdown.46-52, 64-67 To avoid early defluidization during
operation of full-scale fluidized bed combustors or gasifiers, frequent bed change is the
common method applied to ensure problem-free operation, but this is associated with
additional costs and is generally not sustainable on a long-term basis.66 Typically,
agglomeration is studied using bench-scale fluidized beds to perform controlled
agglomeration tests46-52, 64, 65 where correlations between ashing temperature, fuel/bed
material chemical composition, flow rates, defluidization time, etc., can be determined.
This mechanism has been also studied by sampling and analyzing (with SEM/EDS
techniques) bed materials collected in commercial fluidized beds.63, 66-71
Agglomeration is a particle phenomenon that occurs in both combustion and
gasification. With regard to these operational modes, Öhman et al.50 showed no
differences in bed agglomeration tendencies or bed particle layer characteristics when
performing controlled agglomeration tests of six biomass fuels. Three different routes for
agglomeration have been suggested in the literature: 1) melt-induced agglomeration,63 for

28
bed material glued together by ash-derived melt phases attributed to local peak
temperatures; 2) coating-induced agglomeration,63 for the formation of consecutive layers
on bed particles that at certain conditions (coating thickness, temperature, chemical
composition, etc.) might form necks between the coated layers of individual particles,
thus initiating agglomeration, and 3) droplet-induced agglomeration,72 whereby several
bed particles are captured by a droplet of liquid fuel.
Characterization studies46-48, 50 of bed materials during combustion and gasification of
biomass fuels have demonstrated the strong chemical role of the inorganic constituents in
both fuels and bed materials and their dependence on temperature. Öhman et al.47
reported that the composition of coatings on bed particles was mostly constricted to the
ternary systems K2O-CaO-SiO2 during combustion of biomass fuel in a bench-scale
fluidized bed. This study also pointed out to the limited participation of sulfur or chlorine
in agglomeration. In addition, Ghaly et al.67 depicted the chemical interaction between
the silica (SiO2) and potassium oxide (K2O) at elevated temperatures (850-1000 oC) when
burning sand-straw ash mixtures using a high-temperature furnace. Studies performed by
Lin et al.48 and Brus et al.52 agreed on the formation of layers of low-melting potassium
silicates as precursors to molten phases directly associated with melt-induced and
coating-induced agglomeration. This chemical activity has also been observed during
coal combustion in fluidized beds.49, 64, 65, 68 Similar conclusions were drawn from these
studies, in which high ash content is linked to coating molten phases and subsequent
particle bonding and loss of fluidization.
Physical interactions between liquid droplets and bed particles in fluidized beds can
initiate droplet-induced agglomeration. Leclère et al.72 stated that agglomeration
29
processes may occur when liquid droplets are injected into a hot fluidized bed following
these paths: 1) when droplets are larger than a critical value and capture several particles,
and 2) when the amount of liquid injected per unit area is larger than a critical value and
the bed is saturated. The second path resembles what Visser et al.63 discussed about
coating formation at certain conditions; that is, a tendency for agglomeration as a result
of increasing coating thickness due to liquid overfeeding. In a complementary manner,
liquid-solid distribution in the spraying region plays another important role in
agglomeration. McMillan et al.73 developed an experimental method to measure the
quality of the liquid-solid mixing when a gas-liquid jet is injected into a fluidized bed of
coke particles. The measuring technique used temperature to characterize the liquid-solid
distribution and to determine the mixing uniformity. House et al.74 also noted that good
and uniform contact of liquid droplets with solid particles enhances the transport
mechanisms between gas, liquid and solids species. On the other hand, droplet-induced
agglomeration may see interparticle bond breakage as a result of increasing fluidization
velocity as was shown by Smith et al.75
Steam reforming of black liquor in a fluidized bed has operational characteristics that
make it susceptible to agglomeration tendency. Care must be taken to prevent the
occurrence of this mechanism to improve performance and reliability.
2.3.3 Attrition
Attrition is defined as the particle reduction mechanism in which an abrasive wear
between particles leads to the removal of asperities and fines from particle surfaces.17
This mechanism is intrinsic of fluidized beds and has been often associated with material
loss and particle degradation.76 This situation is seen in fluidized-bed catalytic cracking
30
units, where losses of catalyst come directly from catalyst attrition.77 Forsythe et al.77
developed an accelerated-attrition test for measuring the relative resistance of a catalyst
to attrit. This study concluded that attrition caused a rounding off of sharp edges of
catalyst particles, which led to their degradation. Gwyn78 expressed the rate of catalyst
attrition as a function of particle size and time and indicated the influence of initial PSD
and mean particle diameter on attrition. However, attrition on shrinking fuel particles in
fluidized beds seems to be more complex. Chirone et al.79 experimentally described
differences between two types of char attrition during combustion of coal particles in a
fluidized bed: 1) mechanical attrition, and 2) reaction-enhanced attrition. The former is
characterized by the rapid decay of the elutriation of attrited carbon from an initial high
rate typical of angular solids to a lower stationary rate when particles are rounded off.
The latter is characterized by the enhanced detachment of asperities due to weakening of
the particle surface as the solid reaction progresses. Results from this study showed that
reaction-enhanced attrition is 10 times larger than mechanical attrition. Ray et al.80
pointed out the importance of the interactions between coal particles and bed particles
(limestone) and suggested that large coal particles and small limestone particles are more
desirable to reduce attrition in a fluidized-bed coal combustor.
With respect to biomass conversion, Scala et al.55 and Leckner et al.54 concluded that
biomass char conversion during combustion is largely due to generation of carbon fines,
followed by postcombustion during their residence time in the bed. Both studies noted
percolative fragmentation,81 or loss of particle connectivity due to enlargement and
overlapping of pores, as the prevailing mechanism of carbon fines generation in the bed.
This result coincides with Chirone’s work on coal combustion; therefore, it can be said
31
that percolative fragmentation refers to reaction-enhanced attrition. In general, models
and experimental observation have found attrition to be proportional to fluidization
velocity, as well as mass inventory and particle characteristics (size, strength, etc.).17, 82, 83
Despite the fact that attrition has been mostly conceptualized on coal processing, it is
valuable to include it into the general particle description for steam reforming. Although
black liquor steam reforming is not based on injection of liquor particles, it makes sense
to recognize that liquor-coated particles may suffer some size reduction due to attrition
and may possibly offset particle growth by reducing coating thickness at the cost of fines
generation.
2.3.4 Fragmentation
Fragmentation is defined as the particle reduction mechanism in which a rapid
fracturing of particles produces new particles that are all distinctly smaller than the
original ones.17 This mechanism has been coupled with attrition in some experimental
and modeling studies of coal combustion.84-87 Walsh et al.87 measured the formation of
small char particles to determine the parallel occurrence of attrition and fragmentation
during combustion of large coal char particles. The conclusion of this study resembles the
work of Chirone et al.79 and Salatino et al.81 Brown et al.84 also reported that percolative
fragmentation makes coal particle surfaces susceptible to mechanical abrasion.
Additionally, Zhang et al.85 and Stubington et al.86 suggested that fragmentation occurs
early in the devolatilization stages and that the content of volatile matter can drastically
influence the degree of fragmentation of coal particles. Stubington et al.86 also defined
two types of fragmentation: 1) primary fragmentation, occurring during devolatilization

32
and 2) secondary fragmentation, occurring during conversion of the char by consumption
of carbon bridges connecting parts of the particles.
In terms of biomass processing, Miccio et al.53 confirmed that percolative
fragmentation takes place in parallel with carbon postconversion during bubbling
fluidized bed gasification of a biomass fuel. The results of these experiments showed that
fines generation is relevant during gasification, and postconversion of particles takes
place after their release from the bed. Fragmentation is conceptualized on the framework
of coal conversion; however, results from fluidized-bed biomass studies indicate that the
same conceptualization is valid for such systems. The configuration of the liquor feeding
in the black liquor steam reforming system points toward fragmentation as a mechanism
that might not be expected to occur at all.
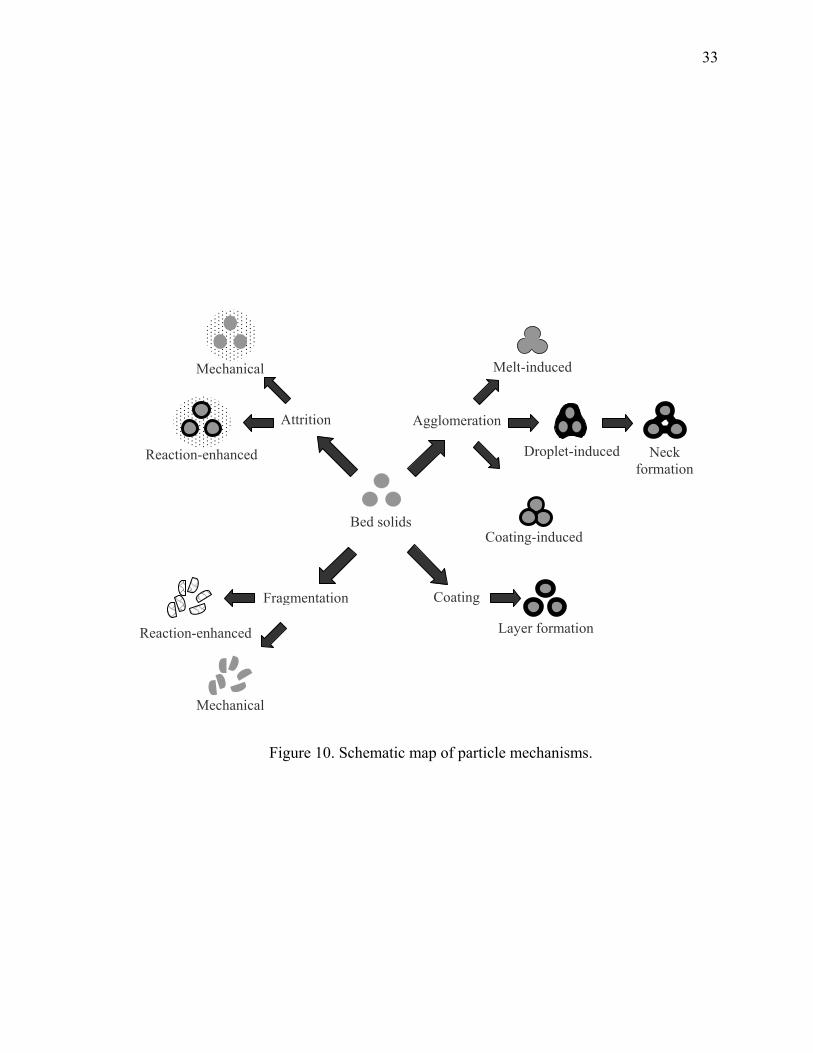
In summary, fluidized bed steam reforming of black liquor has operational
characteristics that may involve the participation of the various particle mechanisms
described above. This fluidized bed system is intended to convert black liquor while
taking advantage of the available surface area of the bed material, through the process of
coating. However, operational parameters such as temperature, liquor feed rate and
spraying, and fluidizing velocity make this system susceptible to agglomeration, attrition
and possibly fragmentation. A compilation of these mechanisms is shown in Figure 10.
From this diagram, the relevance of each mechanism with respect to each other, as well
as overall particle size development, can help to qualitatively address particle
development in this process.
33
Figure 10. Schematic map of particle mechanisms.
Coating
Agglomeration Attrition
Fragmentation
Bed solids
Layer formation
Mechanical
Reaction-enhanced
Mechanical
Melt-induced
Coating-induced
Droplet-induced Neck formation
Reaction-enhanced
34
CHAPTER 3
EXPERIMENTAL
3.1 Introduction
The different experimental apparatus and procedures used to study mechanisms that
contribute to particle size evolution in this fluidized bed system are described in this
chapter. Experimental decoupling of these mechanisms was necessary in order to provide
basic understanding of each one under specific laboratory conditions.
Samples of bed solids from two commercial steam reforming units (Georgia-Pacific
Corporation and Norampac Inc.) were used for different testing campaigns. These
commercial units are based on the MTCI design. All the bed solids samples used in this
study were within a size range of 75 – 1300 µm and had a chemical composition of 75 –
80% wt. Na2CO3, 10 – 20% wt. C and 0 – 5% wt. CaCO3. Samples of black liquor from
Georgia-Pacific’s Big Island mill with 40% solids content were used for all tests that
required liquor feed.
3.2 Experimental Set-up
3.2.1 Coating Studies
Coating was studied by visual inspection of cross-sectional areas of samples of bed
solids. Layer formation was then addressed by characterization of layers observed around
cores of cross-sectioned particles. Scanning electron microscopy (SEM) and Energy
35
dispersive X-ray spectroscopy (EDS) were the analytical techniques used to characterize
the cross-sections. In SEM, an electron beam is scanned across the samples surface and
when the electrons strike the sample, a variety of signals are generated. The detection of
such signals is what produces images for analysis. SEM can provide high-quality imaging
of samples at large magnifications. In EDS, interaction of the primary electron with
atoms in the sample causes shell transitions, which result in the emission of an X-ray.
The emitted X-ray has an energy characteristic of the parent element. The detection and
measurement of such energy is what permits elemental analysis. EDS can provide rapid
qualitative and quantitative analysis of elemental composition as well as maps or line
profiles for elemental distribution in a sample surface.
Samples of bed solids from Georgia-Pacific were sieved using meshes No. 30, 40, 50,
70, 100, 140, and 200. Samples were mounted in epoxy discs and polished for
approximately 10 h to obtain cross-sectional areas. Three kinds of sandpaper (240, 400
and 600 grit), diamond paste and kerosene were used as polishing agents. After polishing,
the epoxy discs were coated with a very thin film of gold for imaging and elemental
distribution analyses.
3.2.2 Agglomeration Studies
Agglomeration was studied by identifying the effect of liquor droplets on PSD and
solids characteristics. A lab-scale fluidized bed reactor was used to pyrolyze black liquor
droplets in a hot bubbling fluidized bed. Liquor droplets were added from the open top of
the reactor and limestone, glass beads and Norampac bed solids were used as bed
materials. Nitrogen (N2) was used as fluidizing gas. The experimental apparatus was
comprised of three sections: the reactor, the heating system and the pumping system. The

36
reactor was a stainless steel (SS) tube of 0.047 m ID and 0.254 m height placed vertically
on a SS-machined cup. This cup held inside two perforated SS discs compressing a fine
mesh used for even distribution of the fluidizing gas. The heating system was composed
of an 1100 W heating rod placed inside of a 1900 W tube furnace. The pumping system
used a peristaltic tubing pump that transported black liquor from a hot reservoir to the top
of the reactor. A schematic of the experimental set-up is presented in Figure 12.
Samples of bed materials (approx. 200 g) were loaded into the reactor and hot air was
circulated through the system. At the desired bed temperature, air was switched to N2 and
heated black liquor was pumped from the reservoir. Experiments were carried out at bed
temperatures between 450 – 600 oC with flowing N2 at 15 scfh and liquor flow rates of
0.5 and 1 ml/min over periods of 8 – 12 h. A summary of the experimental conditions of
the agglomeration tests is presented in Table 2. Bed samples were generally taken at 45
min, 1.5, 3, 6 and 12 h. It is important to note that samples of 40%-solids black liquor
from Georgia-Pacific were diluted to 12% solids in order to facilitate liquor pumping at
lab scale.
3.2.3 Attrition Studies
Mechanical attrition was studied by tracking the generation of fines and the bed’s
PSD evolution during cold fluidization of samples of bed solids from Georgia-Pacific and
Norampac. A cold flow model of the University of Utah fluidized bed steam reformer
was built and used for visualization of reactor flows and interpretation of data. It was
designed to simulate the bed behavior of the real system such that the dimensionless
scaling parameters (Reynolds number, density ratio, Froude number and geometric
similarity of distributor, bed, particles) were the same as the real unit. For this reason, the

37
Figure 12. Schematic of the agglomeration apparatus.
N2
Black liquor reservoir
Heating section
Pumping section
SS tube Air
Rod
Furnace
SS-machined cup
Reaction section
Flow meter
Peristalticpump
T
T
T
T

38
Table 2. Summary of experimental conditions for agglomeration tests.
Note:
• Harmonic mean particle diameter (HMDp) is the reciprocal of the sum of the
reciprocals divided by the total.
• Standard cubic feet per hour (scfh).
Experiment Parameter
1 2 3 4 5
Pyrolysis time (h) 8 12 12 10 8.5
Bed material: Limestone Glass beads Norampac Norampac Norampac
Weight (g) 150 200 200 200 200
Size range (µm) 180 – 351 0 – 2800 0 – 2800 180 – 351 180 – 351
HMDp (µm): 265.5 231.31 176.36 265.5 265.5
Temperature(oC): 547 547 600 525 450
Fluidizing gas: N2 N2 N2 N2 N2
Flow rate (scfh): 15 15 15 15 15 Fluidizing velocity
(m/s) 0.21 0.21 0.22 0.19 0.17
Black liquor:
Solids (%) 3 12 12 12 12
Flow rate (ml/min) ~1 ~1 ~ 1 ~ 0.5 ~0.5

39
study of purely mechanical attrition could reliably be accomplished in this unit. This cold
flow model was made of a Plexiglas column of 0.165 m ID and 1.52 m height with four
tube bundles that were transversely located along the height of the bed. Each bundle
contained 20 glass tubes of 0.011 m OD. The distributor was made of two plates with
forty-two 0.014 m holes evenly distributed over the area. Two layers of tight-weave
fabric were sandwiched between these plates to create high-pressure drop across the
distributor to ensure even distribution of the fluidizing gas. A 90-degree elbow was
placed at the top of the unit to hold a fine filter that collected elutriated material. A
photograph of the cold flow model is shown in Figure 13.
Samples of bed solids were loaded to approximately 0.31 m height and fluidized with
air at room temperature. The fluidization velocity (Uf) was set to 0.24, 0.32 and 0.43 m/s,
which correspond to 3, 4.5 and 6 times the calculated minimum fluidization velocity
(Umf), respectively. The Umf is given by Kunni et al.41:
( ) ( )
μ
ρ−ρρ=⎟⎟
⎠
⎞⎜⎜⎝
⎛μ
ρ
φεε−
+⎟⎟⎠
⎞⎜⎜⎝
⎛μ
ρ
φε
gdUd1150Ud75.1 gsg3pgmfp
2S
3mf
mf
2gmfp
S3mf
(12)
where
dp is the mean particle diameter (µm),
g is the acceleration of gravity (9.8 m/s2),
Umf is the minimum fluidization velocity (m/s),
εmf is the voidage at minimum fluidization conditions,
µ is the gas viscosity (kg/m-s),
ρg is the gas density (kg/m3),
ρs is the particle density (kg/m3), and

40
Figure 13. Photograph of the University of Utah cold flow model of the fluidized bed steam reformer unit.
41
Sφ is the sphericity.
Each test was carried out for 9 h and bed samples were collected at different lengths
of time (0, 4, and 9 h) through a sampling port located at the bottom of the cold flow
model. Elutriated fines were collected hourly from the top filter for weighing and sieving.
A summary of the operational parameters used in these mechanical attrition tests is
presented in Table 3.
3.2.4 Fragmentation Studies
Fragmentation was studied by two experimental approaches, physical and chemical.
The physical approach included compression tests and cyclone tests. Compression tests
were performed to determine the load required to break individual particles of bed solids
into fragments. Cyclone tests were performed to determine the superficial velocity
required to break samples of bed solids into fragments. The chemical approach included
gasification tests. These tests were performed to determine reaction conditions at which
samples of bed solids broke into fragments, because the carbon-based bridges between
particles reacted away. Samples of bed solids from Georgia-Pacific and Norampac were
only used in the physical tests. Agglomerate samples generated during agglomeration
tests were used in both physical and chemical tests.
3.2.4.1 Compression Tests
The department of Mechanical Engineering at the University of Utah has an
INSTRON 4303 load cell for material testing. It consists of a vertical movable load cell
that compresses samples placed between two parallel plates. A lab telescope located in
front of the fixed-bottom plate is used to follow particle breakage as load is exerted. A

42
Table 3. Summary of experimental conditions for mechanical attrition tests.
Note:
• * Sample without fine particles of size below 106 µm.
• Minimum fluidization velocity (Umf).
Test #
Sample Weight (kg)
Time (h)
Gas flow rate (scfh)
Uf (m/s)
1 Norampac 8 9 500 3 x Umf = 0.2313
2 Norampac* 8 9 515 3 x Umf = 0.2406
3 Georgia-Pacific 8 9 910 6 x Umf = 0.426
4 Georgia-Pacific 8 9 680 4.5 x Umf = 0.3195
43
picture of this equipment is shown in Figure 14.
One single particle or agglomerate was selected and placed on the fixed-bottom plate.
The top plate was lowered enough to barely touch the sample. The starting distance
between plates was reset and load was exerted on the sample until breakage. Ten
compression tests were performed for each selected size range. Readings of exerted load
versus plate displacement were collected for each sample. A summary the experimental
conditions of the compression tests is presented in Table 4.
3.2.4.2 Cyclone Tests
A glass cyclone of 0.33 m height with a reducing body diameter of 0.063 m to 0.012
m was used for these tests. This cyclone has an inlet of 0.02 m ID and 0.063 m length and
a top gas outlet of 0.025 m ID and 0.09 m length. A nozzle was inserted in the inlet to
generate a circulating stream of air and solids. Air flow was regulated by a flow meter
located upstream. A fine filter was placed at the top outlet in order to retain any elutriated
material. A picture of the glass cyclone is shown in Figure 15.
Samples of bed solids as single particles and agglomerates were circulated through
the cyclone at different superficial velocities for 1 h. Material carried away with the
exiting air was recovered in a fine filter. After circulation, the samples were weighed and
sieved to determine the percentage of fragmented material. This percentage was
calculated by taking the ratio between the weight of the final sample that passed through
the screen corresponding to the lower limit size of the initial sample, to the weight of the
initial sample.88 A list of the experimental conditions used in these tests is presented in
Table 5.

44
Figure 14. The University of Utah INSTRON 4304 load cell.
45
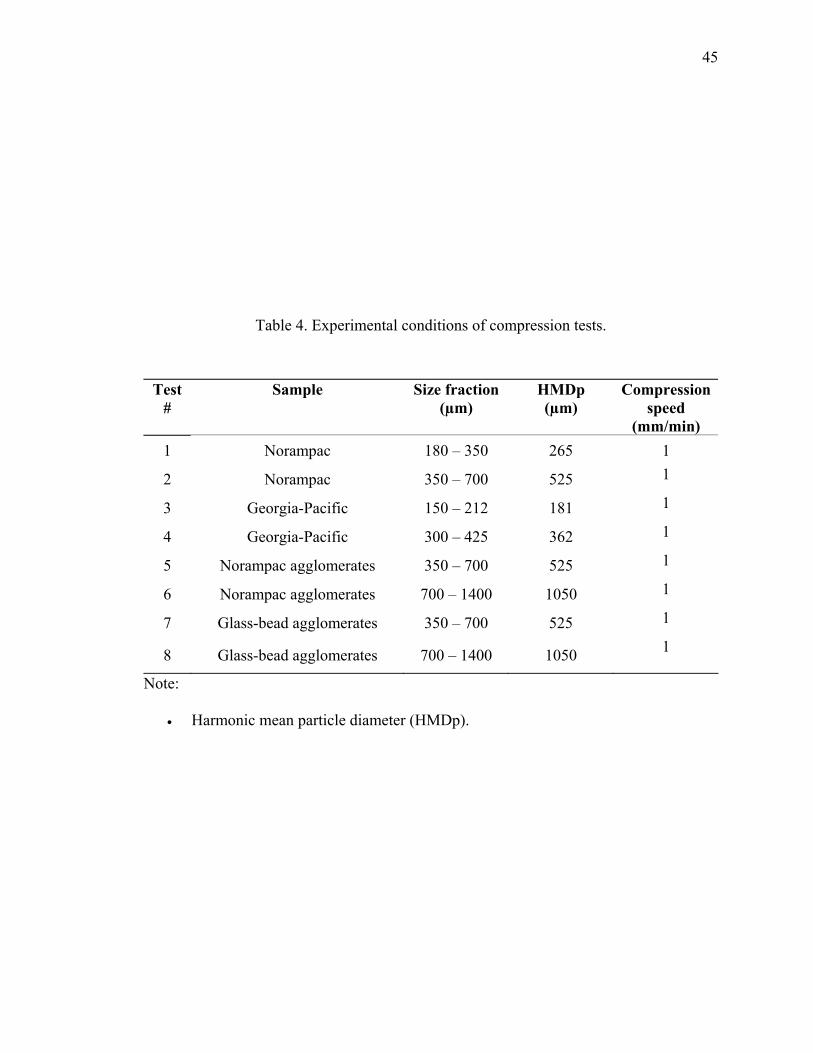
Table 4. Experimental conditions of compression tests.
Note:
• Harmonic mean particle diameter (HMDp).
Test #
Sample Size fraction (µm)
HMDp (µm)
Compression speed
(mm/min) 1 Norampac 180 – 350 265 1
2 Norampac 350 – 700 525 1
3 Georgia-Pacific 150 – 212 181 1
4 Georgia-Pacific 300 – 425 362 1
5 Norampac agglomerates 350 – 700 525 1
6 Norampac agglomerates 700 – 1400 1050 1
7 Glass-bead agglomerates 350 – 700 525 1
8 Glass-bead agglomerates 700 – 1400 1050 1

46
Figure 15. Glass cyclone set-up.

47
Table 5. Summary of experimental conditions of cyclone tests.
Note:
• Norampac agglomerates refer to samples of Norampac bed solids used during
agglomeration studies.
Test #
Sample Size range (µm)
Initial weight
(g)
Air flow rate
(scfh)
Air superficial
velocity (m/s)
1 180 – 350 10 75 8.8
2 180 – 350 10 100 11.7
3 180 – 350 10 125 14.6
4 180 – 350 10 150 17.6
5
Norampac single particles
180 – 350 10 175 20.5
6 350 – 700 10 75 8.8
7 350 – 700 10 100 11.7
8 350 – 700 10 125 14.6
9 350 – 700 10 150 17.6
10
Norampac agglomerates
350 – 700 10 175 20.5
48
3.2.4.3 Agglomerate Break-up by Chemical Reaction
This experimental set-up consisted of a quartz tube of 0.025 m ID and 0.5 m length
placed horizontally along a rapid-heating tube furnace. A type-K thermocouple was
radially centered into the quartz tube, which held a ceramic boat of 0.065 m length. Gases
were regulated by two flow meters located upstream of the furnace. A picture of the
experimental apparatus is shown in Figure 16.
Samples of glass-bead agglomerates were placed into the ceramic boat and heated up
to temperatures between 600 – 800 oC. A gasifying agent (CO2) was circulated through
the quartz tube to react with the sample according to reaction 5. Experiments were carried
out for times ranging from 30 min to 24 h. Final samples were then weighed and sieved
to determine the percentage of fragmented material. This percentage was calculated by
taking the ratio between the weight of the final sample that passed through the screen
corresponding to the lower limit size of the initial sample, to the weight of the initial
sample.88 The experimental conditions of gasification tests are presented in Table 6.
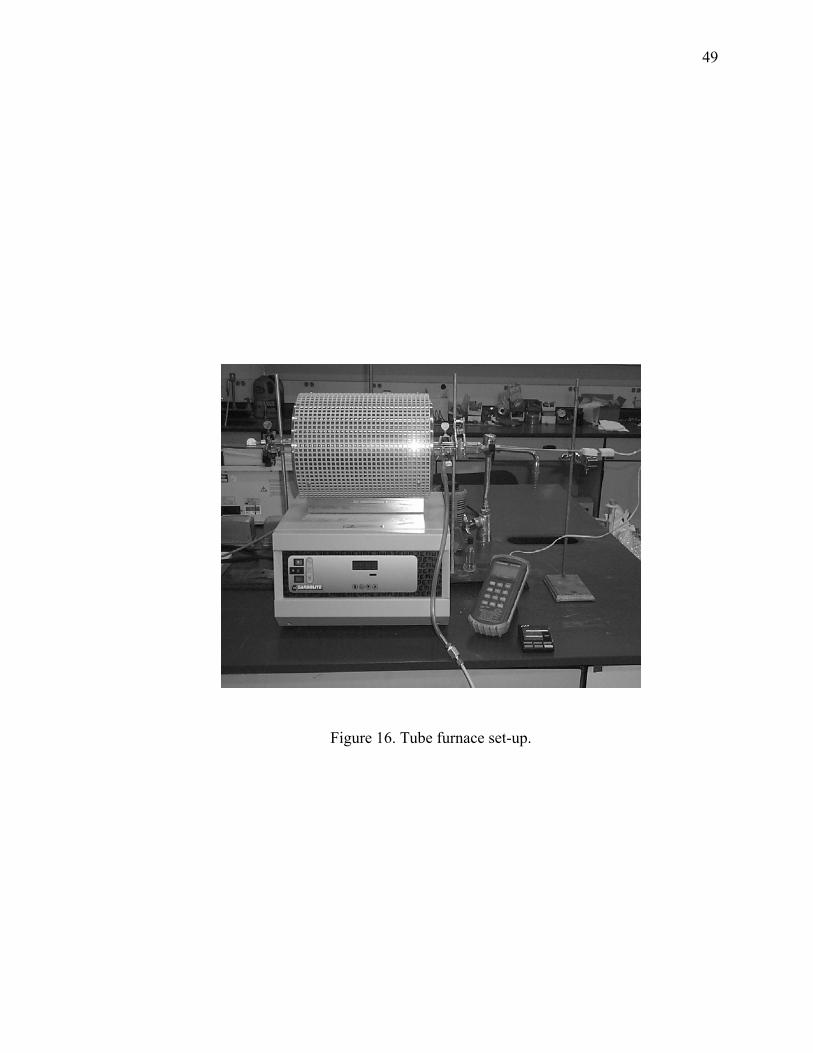
49
Figure 16. Tube furnace set-up.

50
Table 6. Summary of experimental conditions of gasification tests.
Note:
• Glass-bead agglomerates refer to samples of glass beads used during
agglomeration studies.
Test #
Sample Size range (µm)
Initial weight (g)
Temperature (oC)
Time (h)
1 350 – 700 1 600 0.5
2 350 – 700 1 650 24
3 350 – 700 1 700 1.75
4 350 – 700 1 720 2
5 700 – 1400 1 730 1.25
6
Glass-bead agglomerates
350 – 700 1 800 2
51
CHAPTER 4
RESULTS AND DISCUSSION
4.1 Coating Visual Analysis
Mounted samples of bed solids from Georgia-Pacific were visualized using SEM at
different levels of magnification. Some bulk images of selected size ranges at 15 kV and
x35 magnification are shown in Figure 17. Important characteristics are observed when
comparing this set of images. Individual particles are present in all samples regardless of
their particle size. No agglomerates are seen and certain fragments are observed in
samples within 150 – 212 and 300 – 425 µm. It is difficult to say whether these fragments
derive from some kind of fragmentation mechanism. Perhaps, these fragments are the
result of sections of mounted particles not taken through the center of the particle, or the
result of incomplete sieving. Cracking on some cross-sectional areas is seen in most of
the size ranges. Some cracks are located in the center of particles while others are
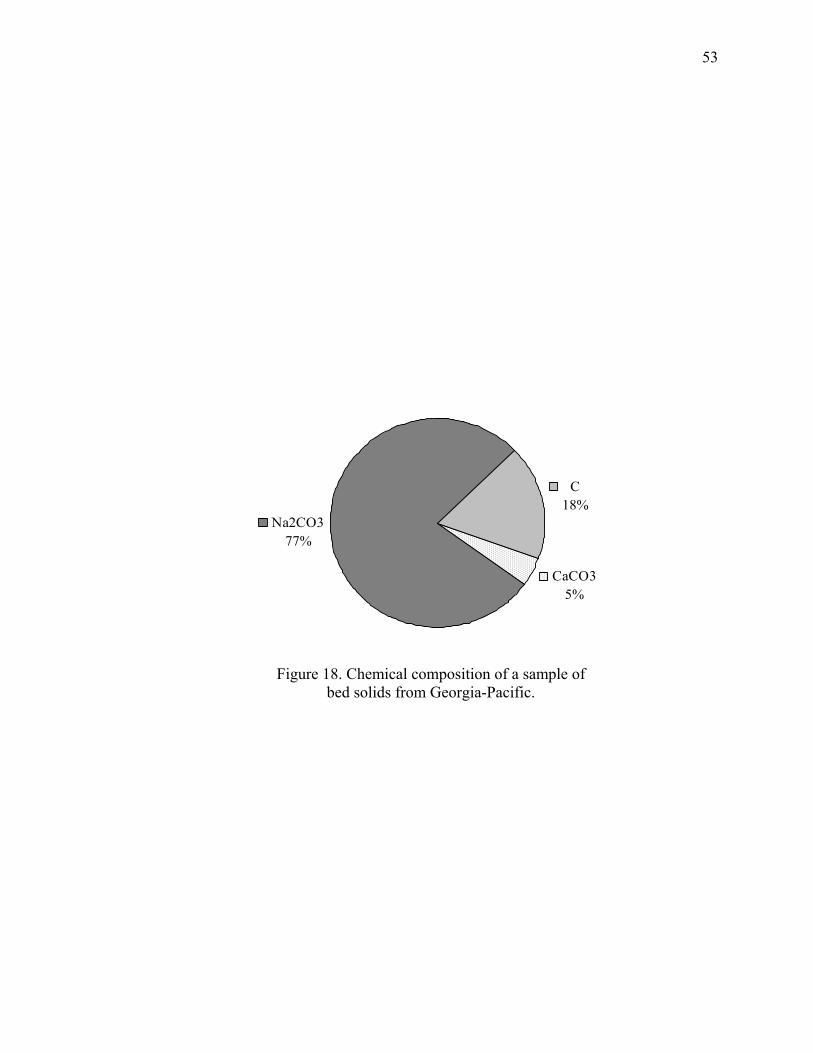
forming a type of round groove around cores. Analysis of carbon content in a sample of
bed solids yields about 18% wt. carbon, as shown in Figure 18. More details about the
analysis of carbon content are presented in the Appendix. Possibly, this cracking results
from removal of the portion of localized nonvolatile organic matter of the sample during
the polishing process. This localized nonvolatile organic matter does not mean it is not
well distributed across the particle matrix, but such round grooves would indicate the
place of initial contact between a bed particle and a coating layer. It is also possible that

52
Figure 17. SEM images of selected size fractions of bed solids from Georgia-Pacific at 15kV and x35. Size: (a) 75 – 106 µm, (b) 150 – 212 µm, (c) 300 – 425 µm, and (d) 425 – 600 µm.
(a) (b)
(c) (d)
53
Figure 18. Chemical composition of a sample of bed solids from Georgia-Pacific.
CaCO35%
Na2CO377%
C 18%
54
cracks result simply from thermal shock of particles as they are heated and cooled for
multiple testing campaigns. Another general characteristic of these bed particles is
roundness due to solids agitation and inherent attrition of fluidized beds, helping shape
particles in this way.
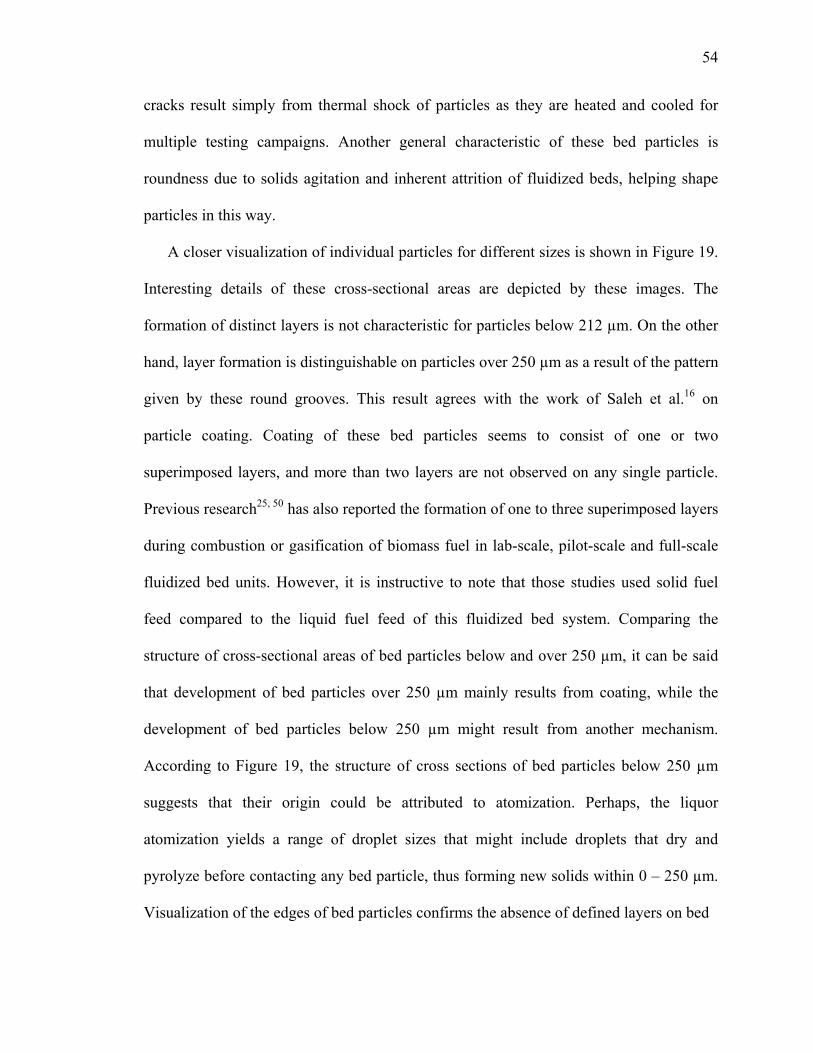
A closer visualization of individual particles for different sizes is shown in Figure 19.
Interesting details of these cross-sectional areas are depicted by these images. The
formation of distinct layers is not characteristic for particles below 212 µm. On the other
hand, layer formation is distinguishable on particles over 250 µm as a result of the pattern
given by these round grooves. This result agrees with the work of Saleh et al.16 on
particle coating. Coating of these bed particles seems to consist of one or two
superimposed layers, and more than two layers are not observed on any single particle.
Previous research25, 50 has also reported the formation of one to three superimposed layers
during combustion or gasification of biomass fuel in lab-scale, pilot-scale and full-scale
fluidized bed units. However, it is instructive to note that those studies used solid fuel
feed compared to the liquid fuel feed of this fluidized bed system. Comparing the
structure of cross-sectional areas of bed particles below and over 250 µm, it can be said
that development of bed particles over 250 µm mainly results from coating, while the
development of bed particles below 250 µm might result from another mechanism.
According to Figure 19, the structure of cross sections of bed particles below 250 µm
suggests that their origin could be attributed to atomization. Perhaps, the liquor
atomization yields a range of droplet sizes that might include droplets that dry and
pyrolyze before contacting any bed particle, thus forming new solids within 0 – 250 µm.
Visualization of the edges of bed particles confirms the absence of defined layers on bed
55
Figure 19. SEM images of individual bed particles. Size range and magnification: (a) 75 – 106 µm and x900, (b) 150 – 212 µm and x400, (c) 300 – 425 µm and x200, and (d) over 600 µm and x90.
(a) (b)
(c) (d)

56
particles smaller than 250 µm, as shown in Figure 20.
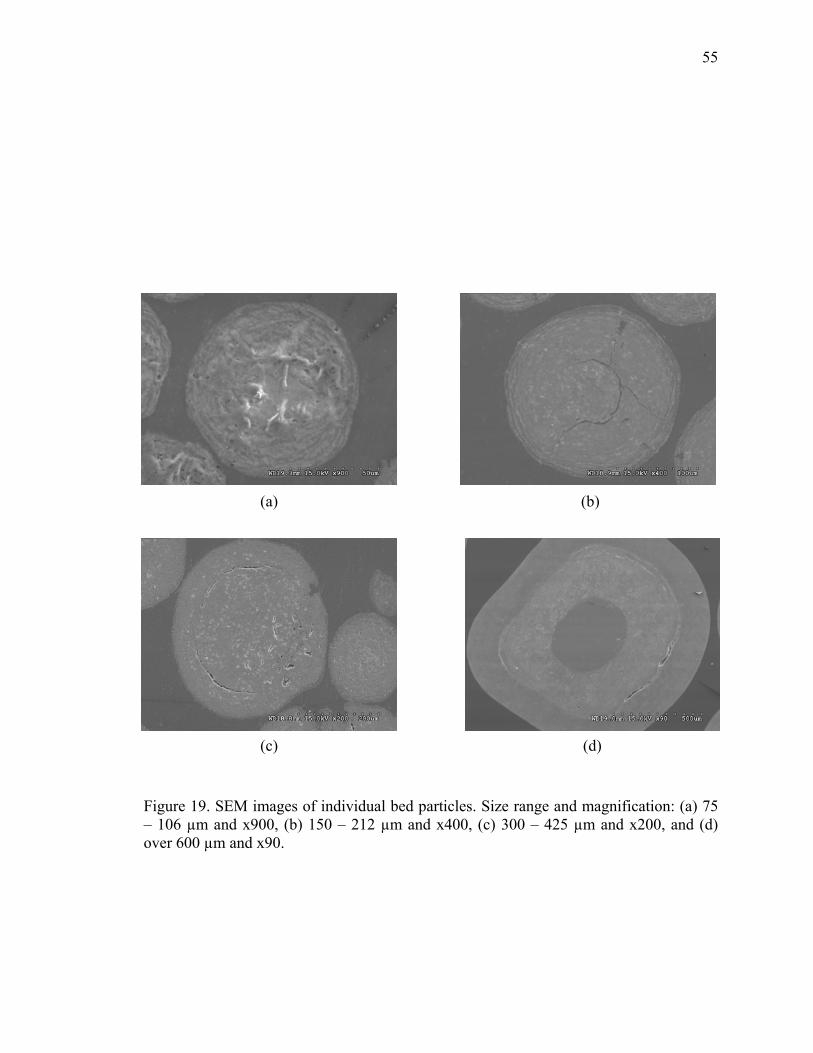
Estimated measures of layers for large bed particles show thickness to increases with
particle size, as shown in Figure 21. For particle sizes within 300 – 425, 425 – 600 and
over 600 µm, layer measures were about 67, 87 and 181 µm, respectively. Although,
similar layer thicknesses were reported by Nuutinen et al.,25 typically within a range of 50
– 70 µm, with a maximum thickness of 100 µm, the cores of coated particles analyzed in
that study yielded sizes over 100 µm. Coating occurs on smaller particles because of fuel
feeding. In that study, solid fuel particles react to yield an ash, which deposits on bed
particles to form layers of residue. In this fluidized bed system, liquid liquor directly
coats bed particles to react and form layers of residue. This direct coating process may
become self-inducing if coated particles reach sizes that make their Umf larger than the
Uf. This difference in velocity might contribute to localize relatively large particles lower
in the bed, which in turn would make them more susceptible to reach again the spraying
zone. Moreover, Georgia-Pacific’s samples have about 85% of bed particles over 250 µm
(see Figure 22), which makes them more likely to grow by coating. Although it is
important to recognize that there exists a growth pattern on bed particles over 250 µm, it
is very difficult to determine the exact correlation between particle size and layer
thickness from these samples, since these have undergone multiple testing campaigns in
the Georgia-Pacific’s Big Island unit.
EDS analysis on cross-sectional areas shows that major elements are: Na, Ca, K, Cl
and Mg. Some traces of S were detected but in very low proportions compared to the
other components. This relative absence of S in the solid inorganic residue is caused by
the reduction of Na2S to H2S as shown by equation 9.

57
Figure 20. SEM images of edges of small bed particles. Size, magnification and thickness: (a) 75 – 106 µm, 15kV x1.8k, (b) 106 – 150 µm, 15kV x1.2k, and (c) 150 – 212 µm, 15kV x1.2k.
(a)
(b)
(c)
58
Figure 21. SEM images of edges of large bed particles. Size, magnification and thickness: (a) 300 – 425 µm, 15kV x700, 66.8 µm, (b) 425 – 600 µm, 15kV x150, 87 µm, and (c) over 600 µm, 15kV x90, 263 µm and 181 µm.
(a)
(b)
(c)

59
Figure 22. PSD of bed solids from Georgia-Pacific’s Big Island steam reforming unit
0
0.1
0.2
0.3
0.4
0.5
0-75 75-106 106-150 150-212 212-300 300-425 425-600 >600
Size range (micron)
Mas
s fra
ctio
n
60
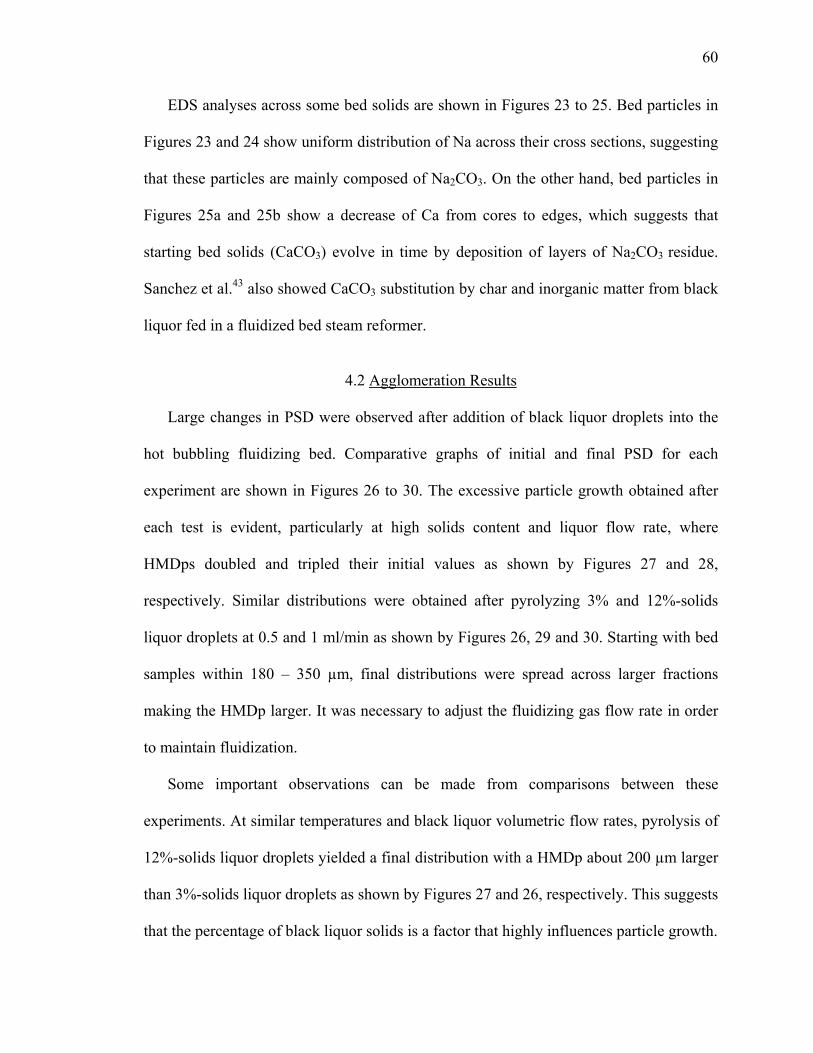
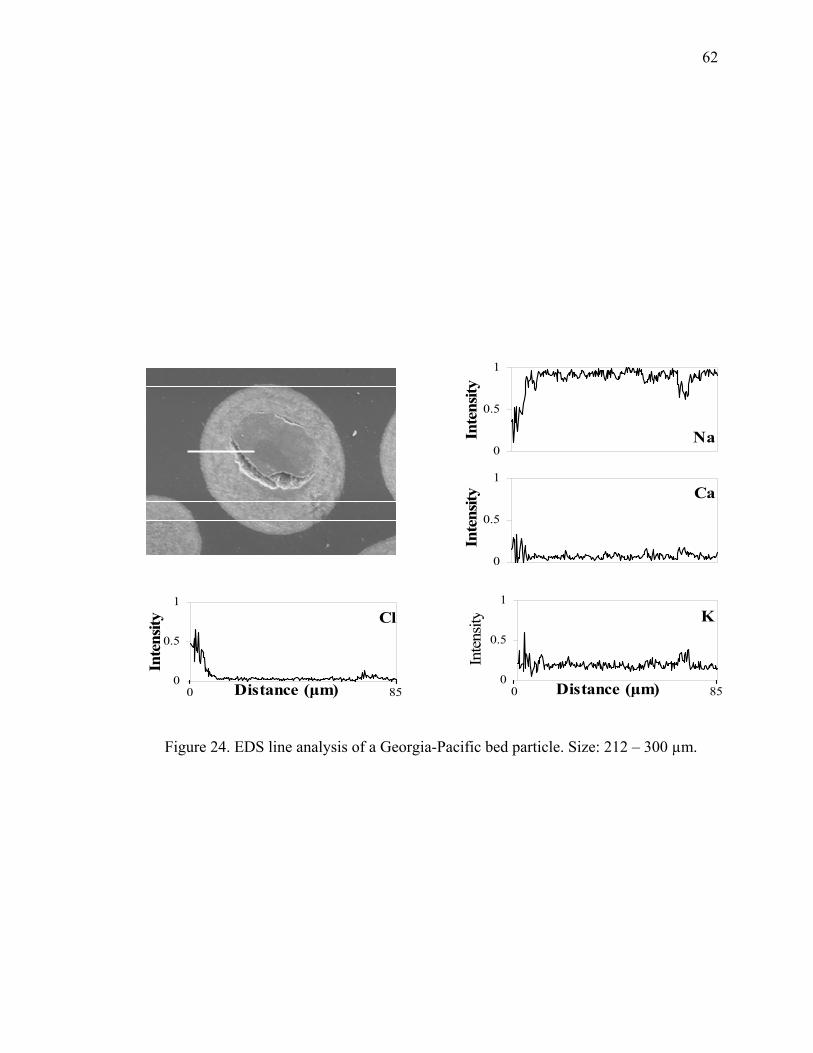
EDS analyses across some bed solids are shown in Figures 23 to 25. Bed particles in
Figures 23 and 24 show uniform distribution of Na across their cross sections, suggesting
that these particles are mainly composed of Na2CO3. On the other hand, bed particles in
Figures 25a and 25b show a decrease of Ca from cores to edges, which suggests that
starting bed solids (CaCO3) evolve in time by deposition of layers of Na2CO3 residue.
Sanchez et al.43 also showed CaCO3 substitution by char and inorganic matter from black
liquor fed in a fluidized bed steam reformer.
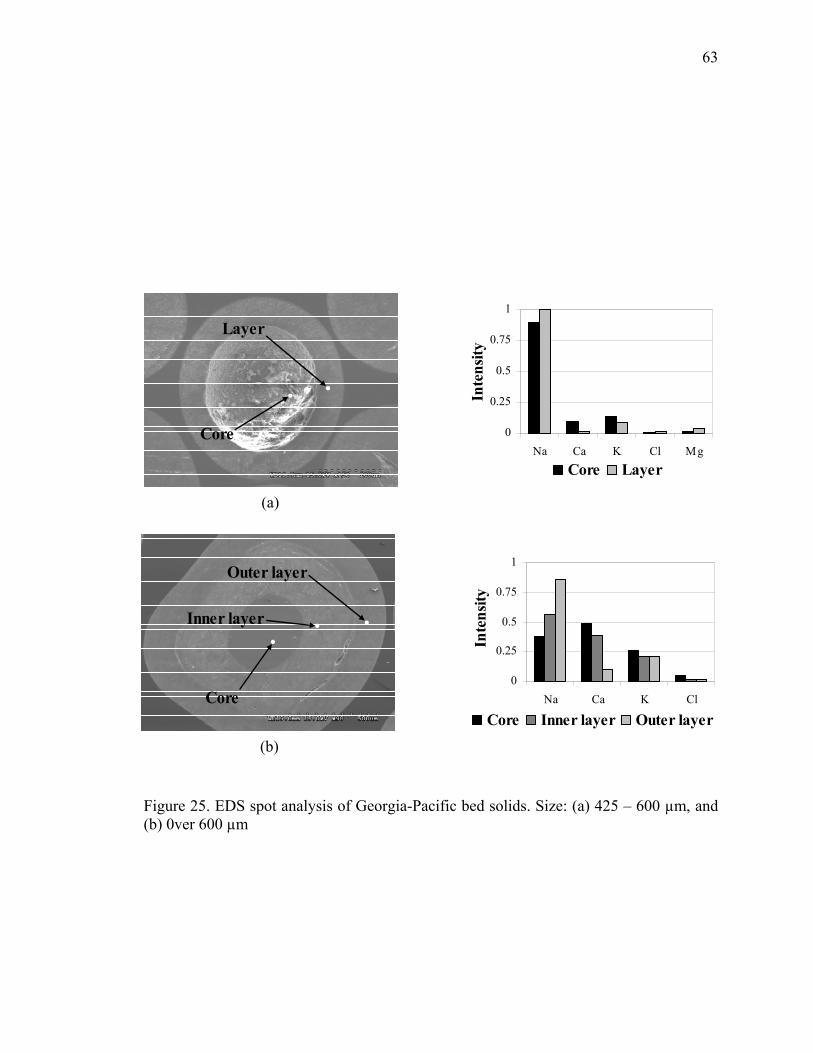
4.2 Agglomeration Results
Large changes in PSD were observed after addition of black liquor droplets into the
hot bubbling fluidizing bed. Comparative graphs of initial and final PSD for each
experiment are shown in Figures 26 to 30. The excessive particle growth obtained after
each test is evident, particularly at high solids content and liquor flow rate, where
HMDps doubled and tripled their initial values as shown by Figures 27 and 28,
respectively. Similar distributions were obtained after pyrolyzing 3% and 12%-solids
liquor droplets at 0.5 and 1 ml/min as shown by Figures 26, 29 and 30. Starting with bed
samples within 180 – 350 µm, final distributions were spread across larger fractions
making the HMDp larger. It was necessary to adjust the fluidizing gas flow rate in order
to maintain fluidization.
Some important observations can be made from comparisons between these
experiments. At similar temperatures and black liquor volumetric flow rates, pyrolysis of
12%-solids liquor droplets yielded a final distribution with a HMDp about 200 µm larger
than 3%-solids liquor droplets as shown by Figures 27 and 26, respectively. This suggests
that the percentage of black liquor solids is a factor that highly influences particle growth.

61
Figure 23. EDS line analysis of a Georgia-Pacific bed particle. Size: 75 – 106 µm.
Cl
0
0.5
1
Inte
nsity
Distance (μm) 0 45
Ca
0
0.5
1In
tens
ity
Na
0
0.5
1
Inte
nsity
K
0
0.5
1
Inte
nsity
0 45Distance (μm)
62
Figure 24. EDS line analysis of a Georgia-Pacific bed particle. Size: 212 – 300 µm.
Na0
0.5
1
Inte
nsity
Ca
0
0.5
1In
tens
ity
Cl
0
0.5
1
Inte
nsity
0 85Distance (μm)
K
0
0.5
1
Inte
nsity
0 85Distance (μm)
63
Figure 25. EDS spot analysis of Georgia-Pacific bed solids. Size: (a) 425 – 600 µm, and (b) 0ver 600 µm
0
0.25
0.5
0.75
1
Na Ca K Cl
Inte
nsity
Core Inner layer Outer layer
0
0.25
0.5
0.75
1
Na Ca K Cl Mg
Inte
nsity
Core Layer
Core
Outer layer
Inner layer
(b)
Core
Layer
(a)
64
Figure 26. Initial and final PSD of limestone particles during pyrolysis of black liquor droplets at 1 ml/min, 3% solids, and 547 oC for 8 h. Initial HMDp = 265 µm and final HMDp = 325 µm.
0
0.2
0.4
0.6
0.8
1
0-43 43-88 88-180 180-351 351-701 701-1397 >1397Size range (micron)
Mas
s fra
ctio
n
Initial weight = 200 gFinal weight = 224 g

65
Figure 27. Initial and final PSD of glass beads during pyrolysis of black liquor droplets at 1 ml/min, 12% solids, and 547 oC for 12 h. Initial HMDp = 231 µm and final HMDp = 525 µm.
0
0.2
0.4
0.6
0.8
1
0-43 43-88 88-180 180-351 351-701 701-1397 >1397Size range (micron)
Mas
s fra
ctio
n
Initial weight = 200 gFinal weight = 264 g

66
Figure 28. Initial and final PSD of Norampac bed solids during pyrolysis of black liquor droplets at 1 ml/min, 12% solids, and 600 oC for 12 h. Initial HMDp = 176 µm and final HMDp = 567 µm.
0
0.2
0.4
0.6
0.8
1
0-43 43-88 88-180 180-351 351-701 701-1397 >1397Size range (micron)
Mas
s fra
ctio
n
Initial weight = 200 gFinal weight = 220 g
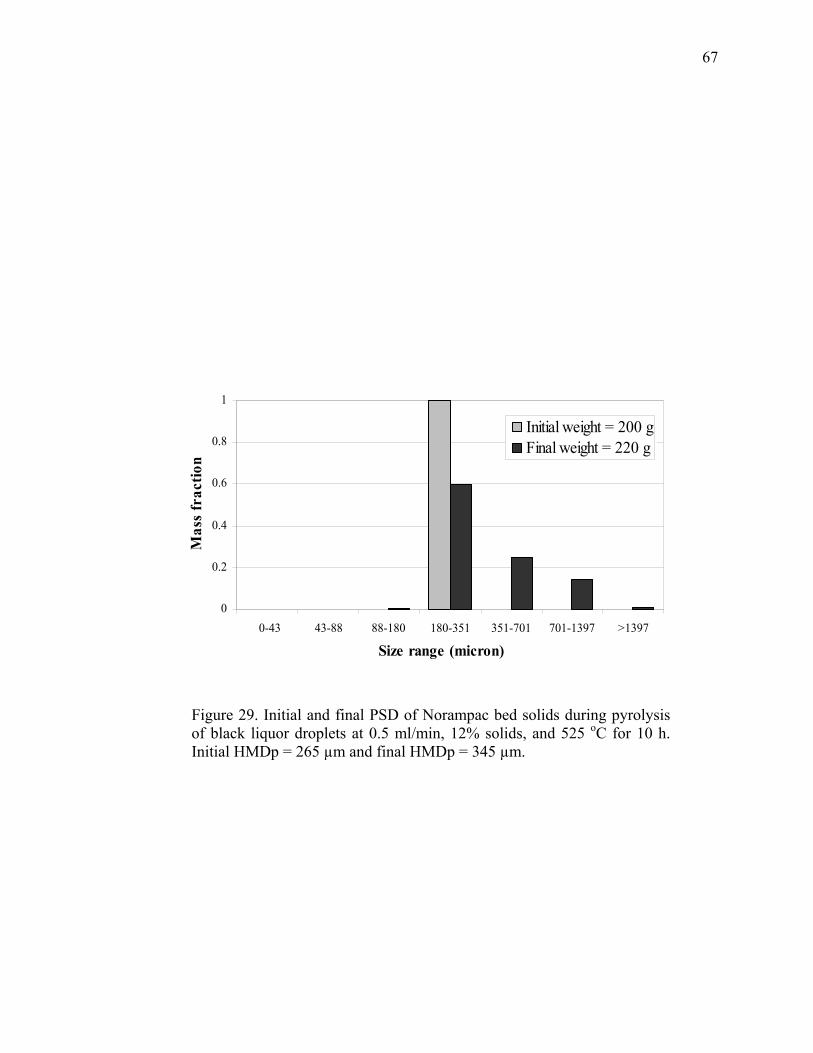
67
Figure 29. Initial and final PSD of Norampac bed solids during pyrolysis of black liquor droplets at 0.5 ml/min, 12% solids, and 525 oC for 10 h. Initial HMDp = 265 µm and final HMDp = 345 µm.
0
0.2
0.4
0.6
0.8
1
0-43 43-88 88-180 180-351 351-701 701-1397 >1397
Size range (micron)
Mas
s fr
actio
n
Initial weight = 200 gFinal weight = 220 g

68
Figure 30. Initial and final PSD of Norampac bed solids during pyrolysis of black liquor droplets at 0.5 ml/min, 12% solids, and 450 oC for 8.5 h. Initial HMDp = 265 µm and final HMDp = 395 µm.
.
0
0.2
0.4
0.6
0.8
1
0-43 43-88 88-180 180-351 351-701 701-1397 >1397Size range (micron)
Mas
s fra
ctio
n
Initial weight = 200 gFinal weight = 276 g

69
When bed particles grow very rapidly, as seen in all of these tests, the particle shape
drastically changes (see Table 7), which in turn affects fluidization.41 The formation of
agglomerates that are within large size fractions is the result of capturing several bed
particles with large liquor droplets during liquor injection, which clearly refers to droplet-
induced agglomeration. Leclère et al.72 noted that droplet diameter was found to be a
dominant factor for particle growth, and that the relative size of the droplets compared to
the solid particles is very important. Large droplets, as in this study (approx. 2 mm in
diameter), are then the reason for the formation of agglomerates.
Pyrolysis of liquor droplets at different temperatures shows little influence on final
PSDs of glass beads and Norampac solids when 12%-solids liquor droplets are pyrolyzed
at 0.5 and 1 ml/min as shown by Figures 27 to 30. On the other hand, the effect of black
liquor flow rate on HMDp is shown in Figure 31; where doubling the liquor feed rate
makes bed particles grow faster. This is the result of uneven deposition of residue on bed
particles; that is, the formation of droplet-induced agglomerates. This uneven deposition
of residue can be depicted by comparing the experimental results with the expected
particle growth from coating alone for both liquor feed rates. The experimental HMDp at
1 ml/min grows faster than the predicted by coating alone because more and larger
agglomerates are formed (see Figure 28) and counted in the calculation of HMDp. On the
other hand, the experimental HMDp at 0.5 ml/min grows slower that the predicted by
coating alone because less and smaller agglomerates are formed (see Figure 29) and
counted in the calculation of HMDp. This result clearly shows that the way in which
black liquor was added to the system is what most affects particle growth. In this system,
the addition of liquor by large droplets localizes the residue on some bed particles, which

70
Table 7. Comparative optical-microscopy images of agglomerates
Sample
Glass beads 1 ml/min
12% solids 547 oC 12 h
Norampac bed solids 1 ml/min
12% solids 600 oC
12 h
Norampac bed solids 1 ml/min
12% solids 525 oC 10 h
Initial
~ 200 µm 0 – 2800 µm 180 – 351 µm
Final
701 – 1397 µm 351 – 701 µm 180 – 1397 µm

71
Figure 31. Evolution of HMDp for two different liquor flow rates. (▲) Norampac bed solids within 0 – 2800 µm during pyrolysis of 12%-solids liquor droplets at 600 oC for 12 h. (♦) Norampac bed solids within 180 – 351 µm during pyrolysis of 12%-solids liquor droplets at 525 oC for 10 h. (Δ) Assuming uniform char residue deposition (specific volume 25 cc/g89) on mono-size bed particles of 176 µm. (◊) Assuming uniform char residue deposition (specific volume 25 cc/g89) on mono-size bed particles of 265 µm.
0
100
200
300
400
500
600
0 2 4 6 8 10 12
Pyrolysis time (h)
HM
Dp
(mic
ron)
Experimental growth at 1 ml/minExperimental growth at 0.5 ml/minExpected growth by coating at 1 ml/minExpected growth by coating at 0.5 ml/min
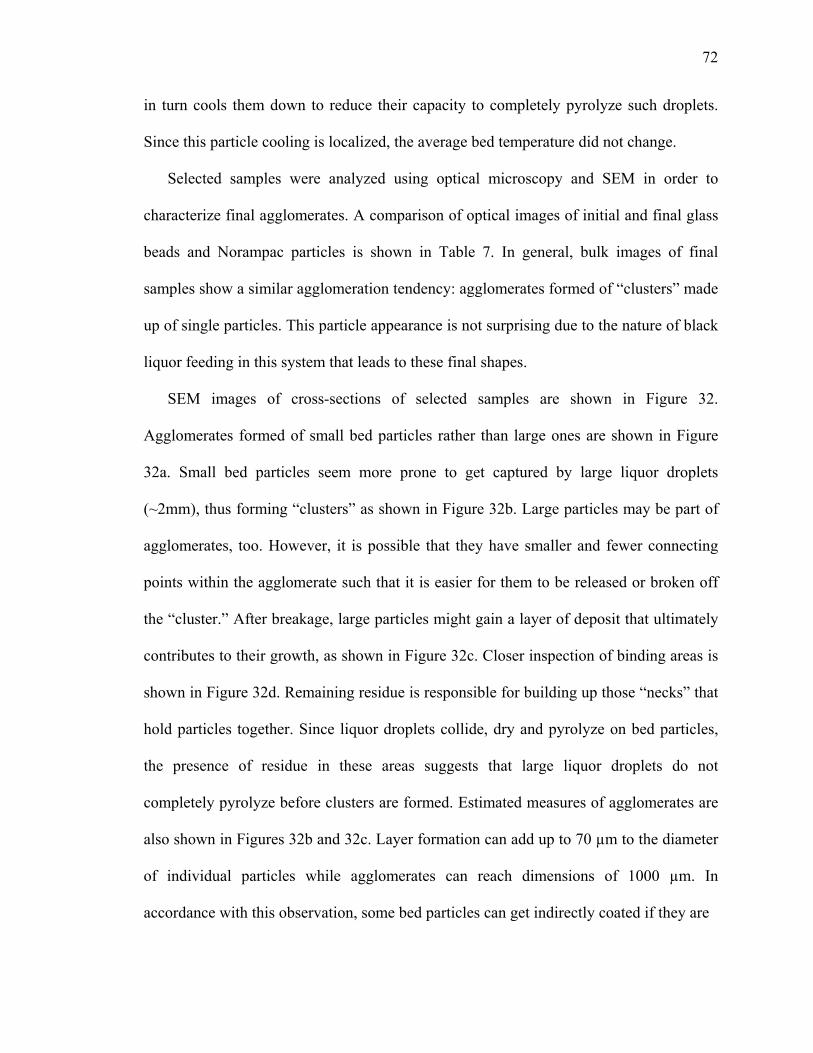
72
in turn cools them down to reduce their capacity to completely pyrolyze such droplets.
Since this particle cooling is localized, the average bed temperature did not change.
Selected samples were analyzed using optical microscopy and SEM in order to
characterize final agglomerates. A comparison of optical images of initial and final glass
beads and Norampac particles is shown in Table 7. In general, bulk images of final
samples show a similar agglomeration tendency: agglomerates formed of “clusters” made
up of single particles. This particle appearance is not surprising due to the nature of black
liquor feeding in this system that leads to these final shapes.
SEM images of cross-sections of selected samples are shown in Figure 32.
Agglomerates formed of small bed particles rather than large ones are shown in Figure
32a. Small bed particles seem more prone to get captured by large liquor droplets
(~2mm), thus forming “clusters” as shown in Figure 32b. Large particles may be part of
agglomerates, too. However, it is possible that they have smaller and fewer connecting
points within the agglomerate such that it is easier for them to be released or broken off
the “cluster.” After breakage, large particles might gain a layer of deposit that ultimately
contributes to their growth, as shown in Figure 32c. Closer inspection of binding areas is
shown in Figure 32d. Remaining residue is responsible for building up those “necks” that
hold particles together. Since liquor droplets collide, dry and pyrolyze on bed particles,
the presence of residue in these areas suggests that large liquor droplets do not
completely pyrolyze before clusters are formed. Estimated measures of agglomerates are
also shown in Figures 32b and 32c. Layer formation can add up to 70 µm to the diameter
of individual particles while agglomerates can reach dimensions of 1000 µm. In
accordance with this observation, some bed particles can get indirectly coated if they are
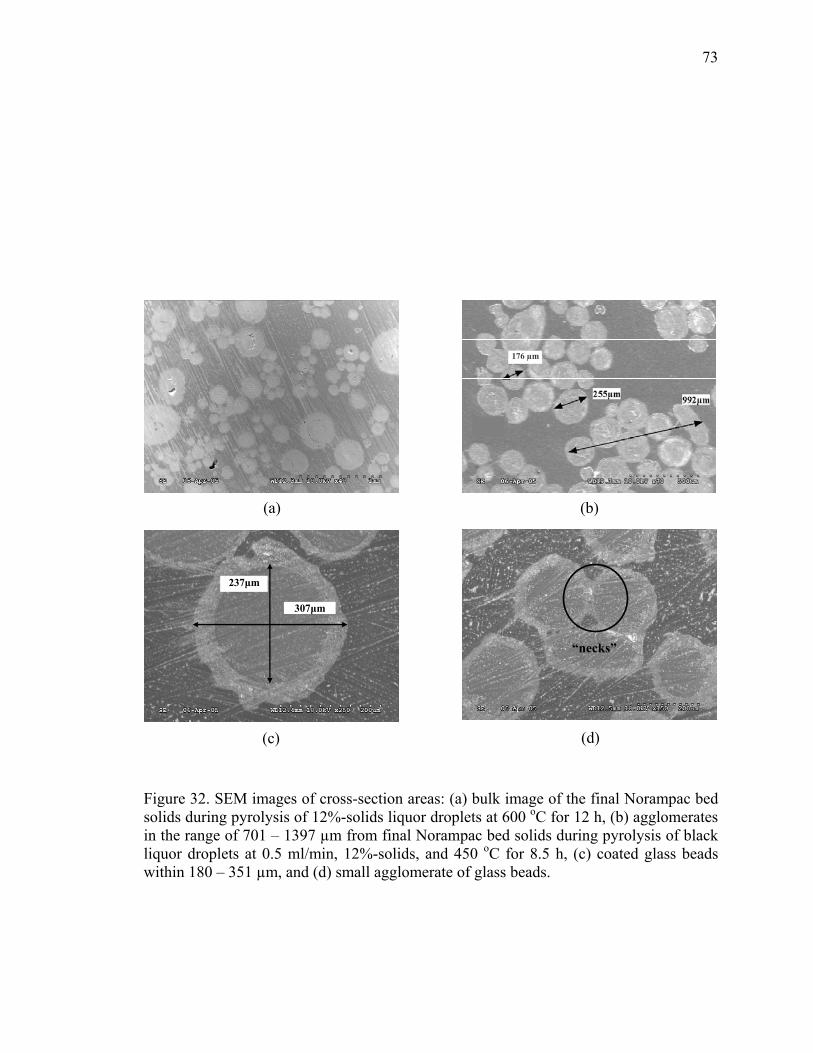
73
Figure 32. SEM images of cross-section areas: (a) bulk image of the final Norampac bed solids during pyrolysis of 12%-solids liquor droplets at 600 oC for 12 h, (b) agglomerates in the range of 701 – 1397 µm from final Norampac bed solids during pyrolysis of black liquor droplets at 0.5 ml/min, 12%-solids, and 450 oC for 8.5 h, (c) coated glass beads within 180 – 351 µm, and (d) small agglomerate of glass beads.
“necks”
237μm
307μm
(a) (b)
(c) (d)
176 µm
74
released off a droplet-induced agglomerate. Therefore, it is possible to conclude that this
experimental configuration lacked vigorous fluidization and complete liquor conversion
to balance the excessive particle growth given by these large droplets.
A general elemental scanning of coated limestone particles is shown in Figure 33.
The largest peak on the spectrum corresponds to Na, whereas the second largest
corresponds to Ca. Very small peaks of K, S, Al and Mg elements also appear on the
spectrum. Mapping of some elements such as Na on limestone particles and glass beads
shows no intra-particle deposition of the inorganic fuel constituents into the structure of
the bed particles, as shown in Figure 34. Contrary to what Brus et al. 52 have reported
during formation of layers by direct attack of potassium compounds on quartz bed
particles at high temperatures, here the observed deposition seems to be a physical
phenomenon instead of a chemical one.
A line scan over an agglomerate from experiment three is shown in Figure 35. Both
inorganic and organic elements are scanned to observe their distribution across the drawn
line. The line crosses layers, cores and “necks” of those two particles. S is uniform across
the line, except for a peak on the “neck” area. This peak indicates that Na2S is not
reduced according to equations 6 to 9. The line scan of C is fairly uniform. However, it is
relevant to note that C is contained in Na2CO3 as well as in the remaining organic matter.
Since these line scan data collect relative intensity of an element with respect to previous
scanned points on the same line, larger peaks of C indicate that more C exists (in any
form) in a region relative to another, i.e. the core (mainly Na2CO3). On the other hand,
Na is highly intensive in the core relative to the “neck”; therefore, it can be said non-
reacted C (nonvolatile matter) might compose a large portion of these binding areas.
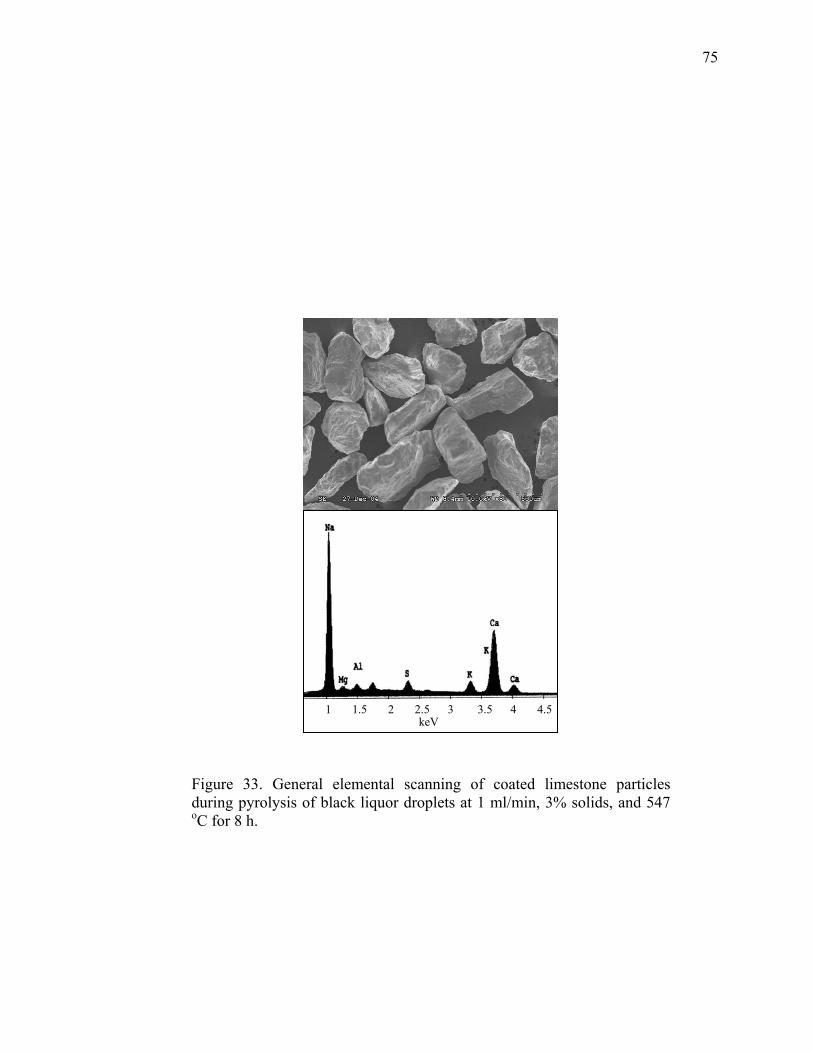
75
Figure 33. General elemental scanning of coated limestone particles during pyrolysis of black liquor droplets at 1 ml/min, 3% solids, and 547 oC for 8 h.
1 1.5 2 2.5 3 3.5 4 4.5 keV

76
Figure 34. Elemental mapping of cross-section areas of: (a) Ca on a coated limestone particle, (b) Na on a coated limestone particle, (c) Si on a coated glass bead, and (d) Na on a coated glass bead.
(a) (b)
(c) (d)
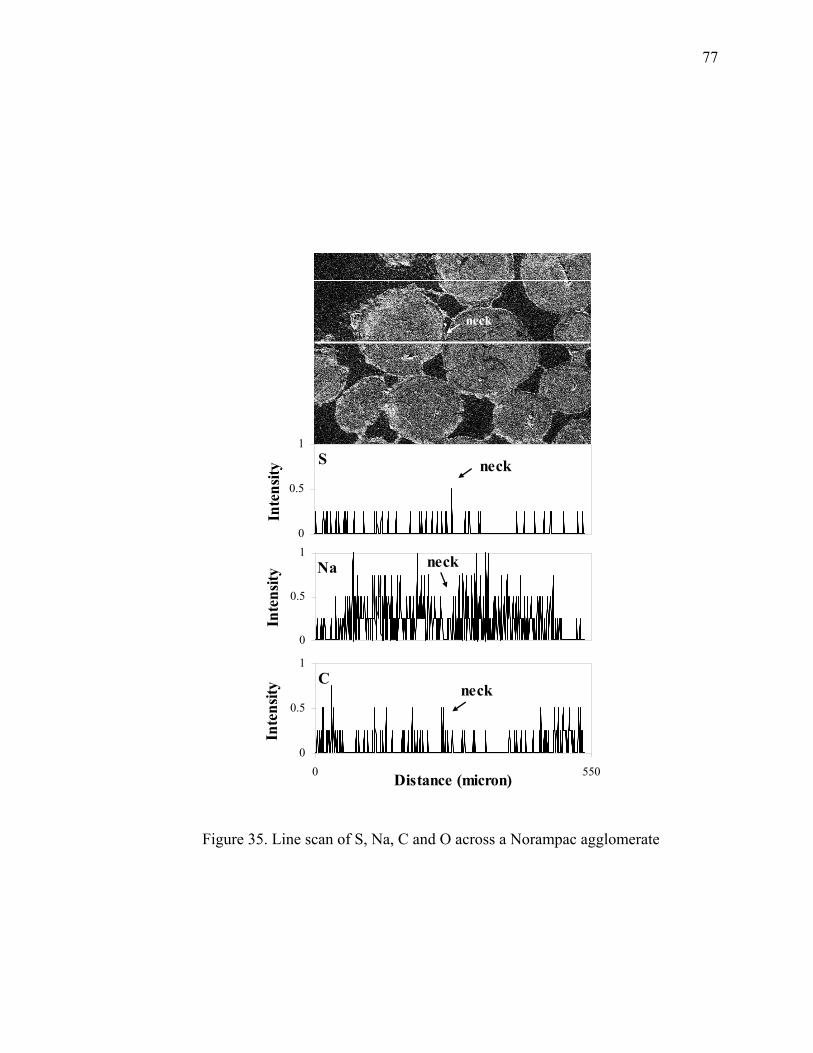
77
Figure 35. Line scan of S, Na, C and O across a Norampac agglomerate
S
0
0.5
1
Inte
nsity
Na
0
0.5
1
Inte
nsity
C
0
0.5
1
0 550Distance (micron)
Inte
nsity
neck
neck
neck
neck

78
4.3 Attrition Results
Attriting particles suffer a gradual size reduction due to the inherent abrasive wear
between particles, and particles and vessel components in a fluidized bed. This reduction
can be determined by tracking changes of PSD with time. Figures 36 to 39 show the PSD
evolution for four different attrition tests using samples of bed solids from Norampac and
Georgia-Pacific steam reforming units. The main difference between these starting
samples is the concentration of the Norampac’s bed solids within 212 – 300 µm
compared to Georgia-Pacific’s bed solids.
Without considering the source of material, initial PSD or fluidization velocity, a
similar PSD transition is observed for these experiments. This trend shows a reduction of
material for size fractions over 300 µm and a respective accumulation of material for size
fractions below that size. This result suggests that bed particles over 300 µm seem to
contribute more to attrition, providing fines and attrited particles to the size fractions
below 300 µm. It is important to recognize the complexity associated with the attrition
phenomenon on bed particles below 300 µm, because there could be overlap between
small attriting particles and migrating material from larger size fractions. However,
Wether et al.76 stated that attrition depends on factors related to material properties and
process conditions; often related to the availability of the external surface area and
dynamic condition of attriting particles. Hence, attrition likely decreases as particle size
decreases due to less available external surface areas and lower particle momentum. For
that reason, it is believed that attrition is also a size-dependent phenomenon, occurring
here principally on bed particles over 300 µm. Alternatively, the fact that attrition occurs
on large bed particles is important to establish the existence of a natural offset between
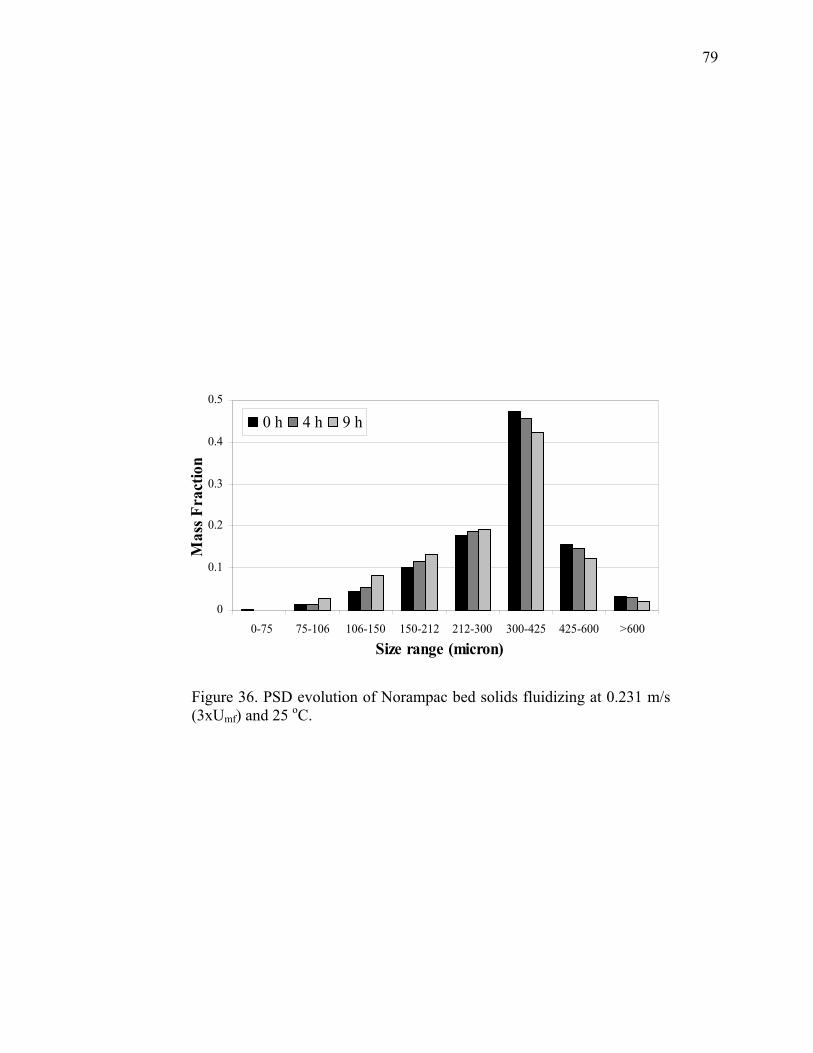
79
Figure 36. PSD evolution of Norampac bed solids fluidizing at 0.231 m/s (3xUmf) and 25 oC.
0
0.1
0.2
0.3
0.4
0.5
0-75 75-106 106-150 150-212 212-300 300-425 425-600 >600
Size range (micron)
Mas
s Fra
ctio
n
0 h 4 h 9 h

80
Figure 37. PSD evolution of Norampac bed solids, without initial particles below 106 µm, fluidizing at 0.241 m/s (3xUmf) and 25 oC.
0
0.1
0.2
0.3
0.4
0.5
0-75 75-106 106-150 150-212 212-300 300-425 425-600 >600Size range (micron)
Mas
s Fra
ctio
n
0 h 4 h 9 h
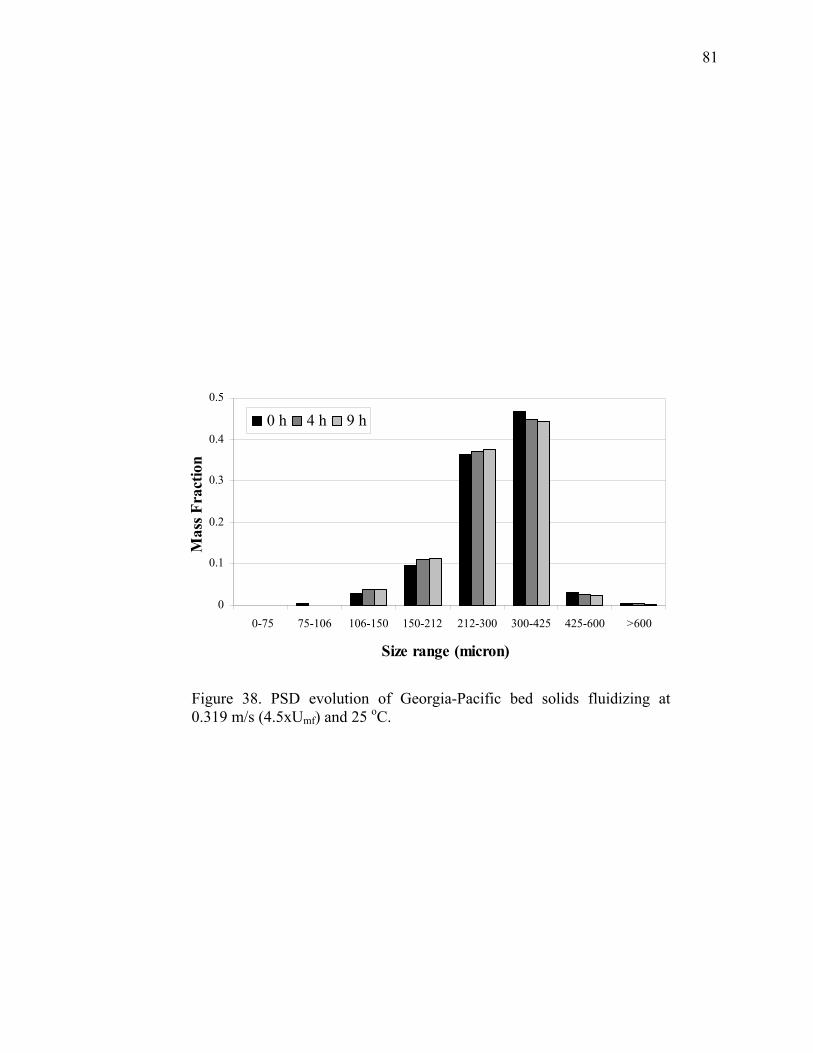
81
Figure 38. PSD evolution of Georgia-Pacific bed solids fluidizing at 0.319 m/s (4.5xUmf) and 25 oC.
0
0.1
0.2
0.3
0.4
0.5
0-75 75-106 106-150 150-212 212-300 300-425 425-600 >600
Size range (micron)
Mas
s Fra
ctio
n
0 h 4 h 9 h
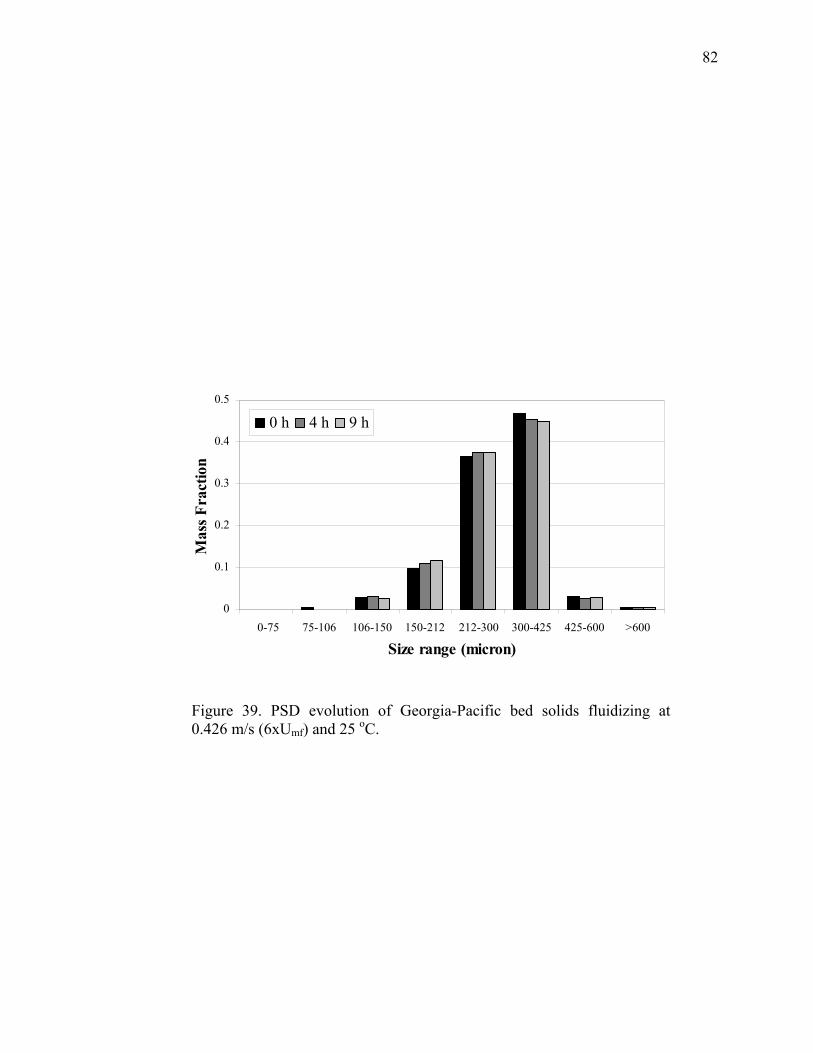
82
Figure 39. PSD evolution of Georgia-Pacific bed solids fluidizing at 0.426 m/s (6xUmf) and 25 oC.
0
0.1
0.2
0.3
0.4
0.5
0-75 75-106 106-150 150-212 212-300 300-425 425-600 >600
Size range (micron)
Mas
s Fra
ctio
n
0 h 4 h 9 h
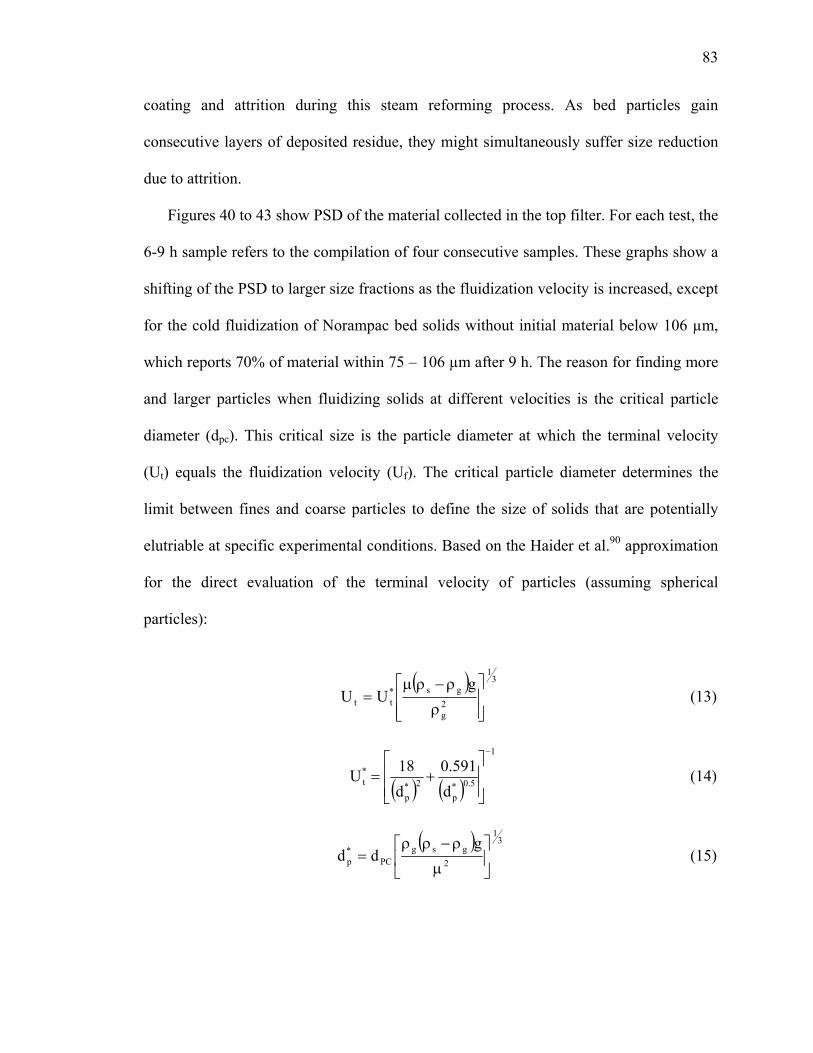
83
coating and attrition during this steam reforming process. As bed particles gain
consecutive layers of deposited residue, they might simultaneously suffer size reduction
due to attrition.
Figures 40 to 43 show PSD of the material collected in the top filter. For each test, the
6-9 h sample refers to the compilation of four consecutive samples. These graphs show a
shifting of the PSD to larger size fractions as the fluidization velocity is increased, except
for the cold fluidization of Norampac bed solids without initial material below 106 µm,
which reports 70% of material within 75 – 106 µm after 9 h. The reason for finding more
and larger particles when fluidizing solids at different velocities is the critical particle
diameter (dpc). This critical size is the particle diameter at which the terminal velocity
(Ut) equals the fluidization velocity (Uf). The critical particle diameter determines the
limit between fines and coarse particles to define the size of solids that are potentially
elutriable at specific experimental conditions. Based on the Haider et al.90 approximation
for the direct evaluation of the terminal velocity of particles (assuming spherical
particles):
( ) 31
2g
gs*tt
gUU
⎥⎥⎦
⎤
⎢⎢⎣
⎡
ρ
ρ−ρμ= (13)
( ) ( )
1
5.0*p
2*p
*t
d591.0
d18U
−
⎥⎥⎦
⎤
⎢⎢⎣
⎡+= (14)
( ) 3
1
2gsg
PC*p
gdd ⎥
⎦
⎤⎢⎣
⎡μ
ρ−ρρ= (15)
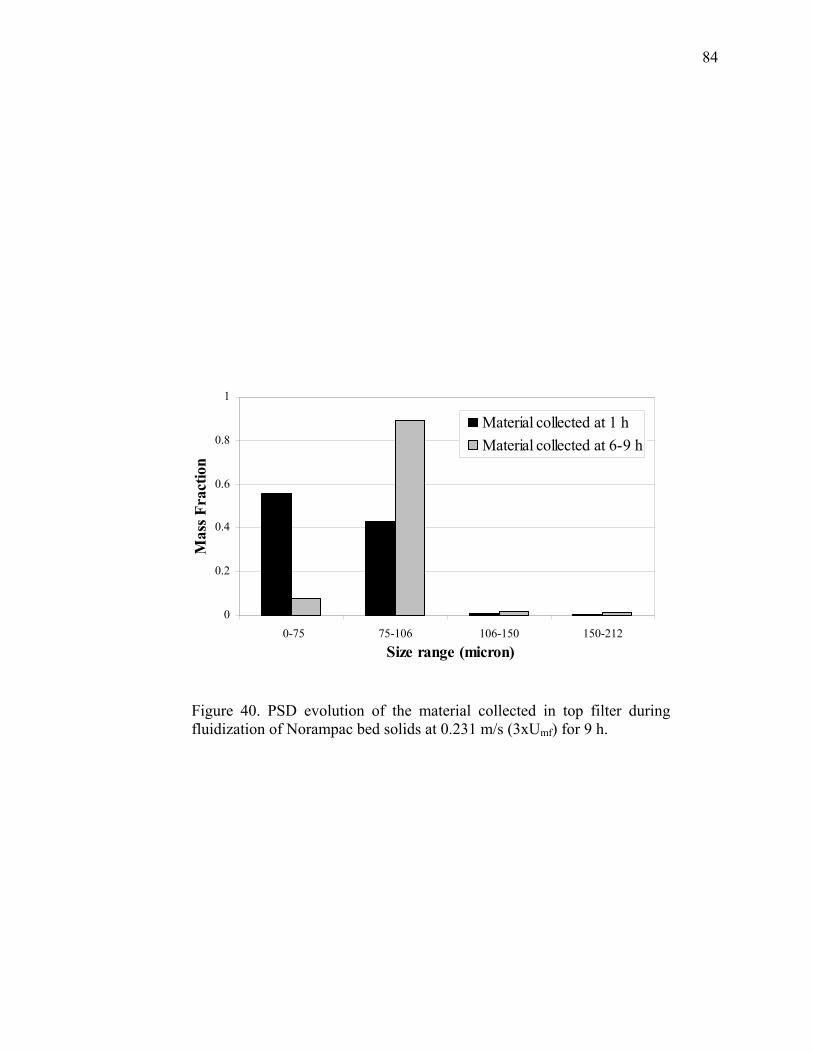
84
Figure 40. PSD evolution of the material collected in top filter during fluidization of Norampac bed solids at 0.231 m/s (3xUmf) for 9 h.
0
0.2
0.4
0.6
0.8
1
0-75 75-106 106-150 150-212
Size range (micron)
Mas
s Fra
ctio
n
Material collected at 1 hMaterial collected at 6-9 h

85
Figure 41. PSD evolution of the material collected in top filter during fluidization of Norampac bed solids, without initial material below 106 µm, at 0.241 m/s (3xUmf) for 9 h.
0
0.2
0.4
0.6
0.8
1
0-75 75-106 106-150 150-212
Size range (micron)
Mas
s Fra
ctio
n
Material collected at 6-9 h
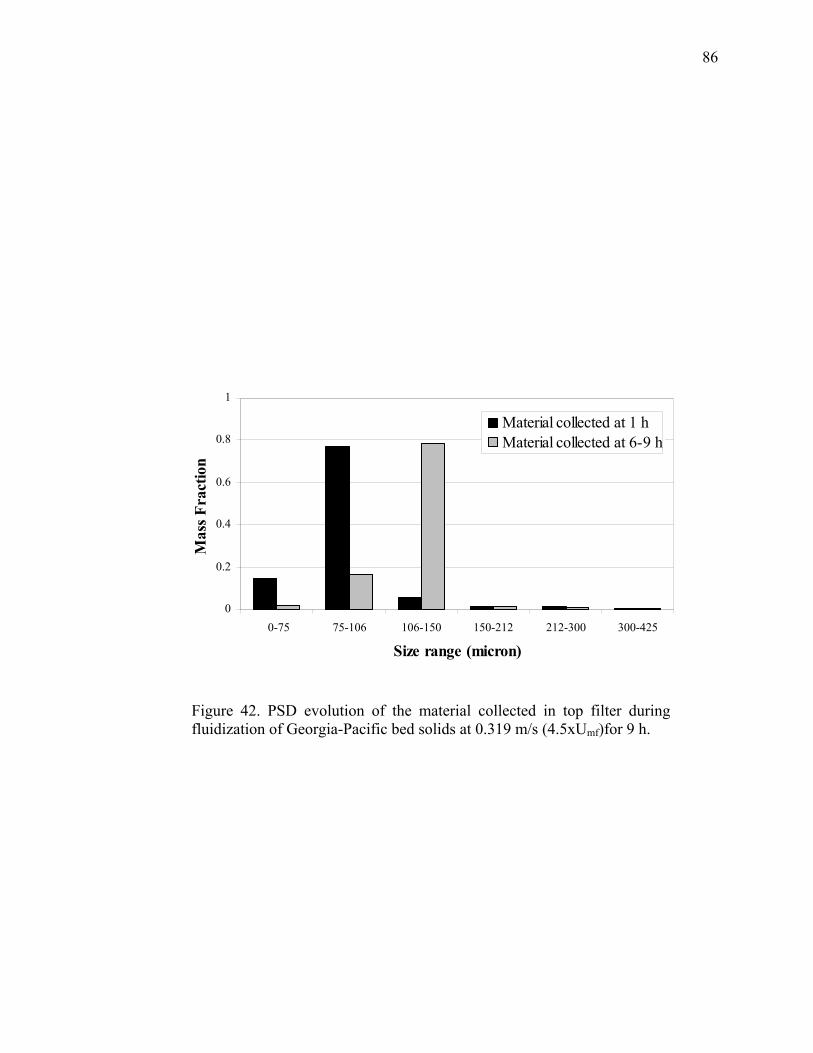
86
Figure 42. PSD evolution of the material collected in top filter during fluidization of Georgia-Pacific bed solids at 0.319 m/s (4.5xUmf)for 9 h.
0
0.2
0.4
0.6
0.8
1
0-75 75-106 106-150 150-212 212-300 300-425
Size range (micron)
Mas
s Fra
ctio
n
Material collected at 1 hMaterial collected at 6-9 h
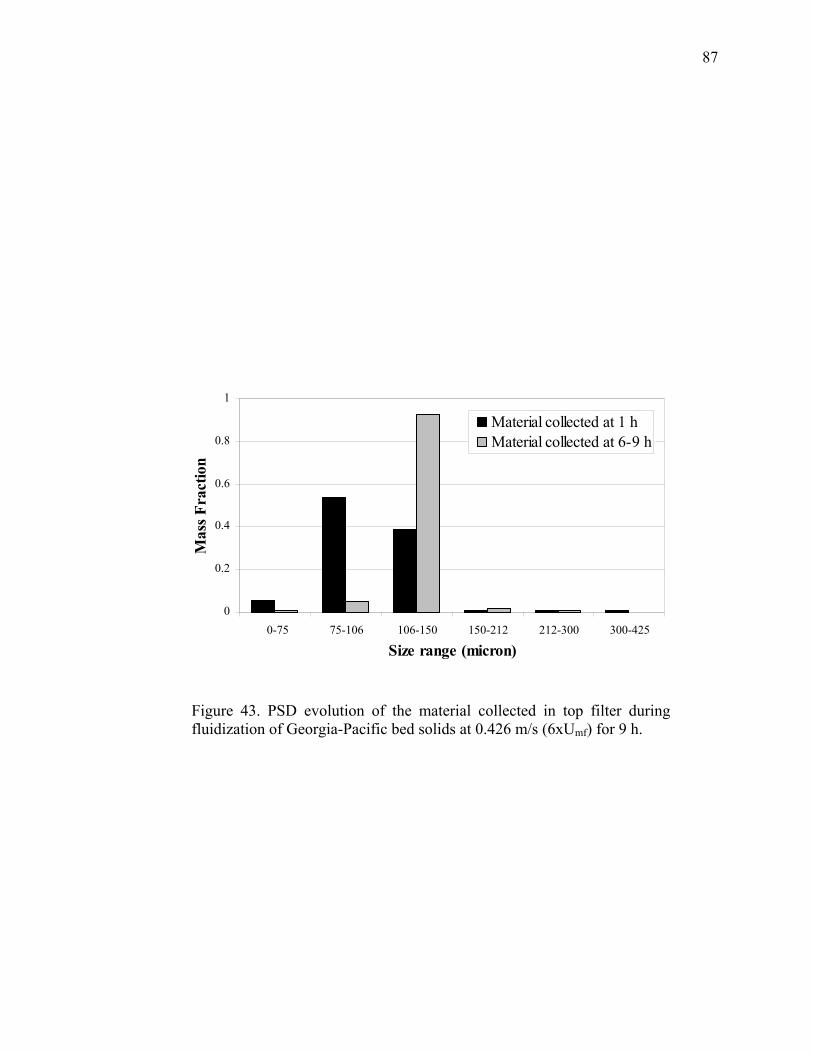
87
Figure 43. PSD evolution of the material collected in top filter during fluidization of Georgia-Pacific bed solids at 0.426 m/s (6xUmf) for 9 h.
0
0.2
0.4
0.6
0.8
1
0-75 75-106 106-150 150-212 212-300 300-425
Size range (micron)
Mas
s Fra
ctio
n
Material collected at 1 hMaterial collected at 6-9 h
88
where
dPC is the critical particle diameter (µm),
dP* is the dimensionless critical particle diameter,
g is the acceleration of gravity (9.8 m/s2),
Ut is the terminal velocity (m/s),
Ut* is the dimensionless terminal velocity,
µ is the gas viscosity (kg/m-s),
ρg is the gas density (kg/m3), and
ρs is the particle density (kg/m3).
The dpc for tests one to four are: 59, 60, 84 and 71 µm, respectively. One would expect to
find only particles of size smaller than dpc in the top filter. However, particles of sizes
greater than these calculated diameters were also carried over. The reason for such
elutriation is based on the relation between the freeboard height (Hf =1.21 m), which is
the section of the vessel between the surface of the dense phase and the exit of the gas
stream, and the transport disengaging height (TDH), which is the height above the
surface of the dense phase required for the solids to disengage and fall back into the bed.
Above the TDH, only fines are found. Using the empirical correlation proposed by
Amitin et al.91:
( )f10
2.1f Ulog2.133.7U85.0TDH −= (16)
the TDHs for tests one to four are: 1.19, 1.24, 2.37 and 1.71 m, respectively. Clearly, the
available Hf is below TDH, except for test one, and particles larger than each critical size
(59, 60, 84 and 71 µm) are carried over as well. Based on the assumption that elutriated
89
fines are the product of mechanical attrition, this result shows that the practice of direct
collection of elutriated material using the cold flow model can be misleading for the
correct assessment of attrition on this type of bed solids. Hence, to make a better
estimation of this mechanism, it was necessary to calculate the amount of fines produced
in each experiment by using the mass fractions shown in Figures 36 to 39 and 40 to 43,
and the amount of collected material at each sampling time. For this calculation, two
aspects are considered: (1) according to Figures 36 to 39, the amount of initial fines, 0 –
75 µm, of starting samples is negligible compared to other size fractions; which means
that fines collected in the top filter are in fact the result of attrition, and (2) assuming that
the distribution of 75 – 106 µm of elutriated fines from Georgia-Pacific bed solids
fluidized at 0.426 m/s is linear, about half of the elutriated mass within this size range is
also fines resulting from attrition, since its calculated dpc is within that size range. The
results of this calculation are shown in Figure 44.
These results highlight the following aspects of attrition on these bed solids. First,
when increasing the fluidization velocity the amount of elutriated material increases, as
shown in Figure 44. Because the size of that material is below each corresponding dpc,
this material is called fines and assumed to be the product of attrition. The fluidization of
Norampac bed solids at 0.231 m/s reports more elutriated fines than fluidization of
Georgia-Pacific solids at 0.319 m/s. This may be due differences between Norampac and
Georgia-Pacific samples. The fluidization of Norampac bed solids at 0.241 m/s reports no
elutriated fines at 1 h because initial fines below 106 µm were pre-sieved. Second,
comparing the amount of total elutriated fines after 1 h and 6 – 9 h, a sharp decay in
attrition can be seen, being almost equivalent for cold fluidization at 0.231, 0.319, and

90
Figure 44. Estimation of fines produced by mechanical attrition during cold fluidization of Norampac and Georgia-Pacific bed solids.
0
0.2
0.4
0.6
0.8
1
0.231 0.241 0.319 0.426
Uf (m/s)
Tot
al m
ass o
f fin
es p
er in
itial
be
d w
eigh
t (kg
/kg
x 10
2 ) 1 h 6-9 h
No
ram
pa
c
Ge
org
ia-P
aci
fic
GP
No
ram
pa
c
0
0.2
0.4
0.6
0.8
1
0.231 0.241 0.319 0.426
Uf (m/s)
Tot
al m
ass o
f fin
es p
er in
itial
be
d w
eigh
t (kg
/kg
x 10
2 ) 1 h 6-9 h
No
ram
pa
c
Ge
org
ia-P
aci
fic
GP
No
ram
pa
c

91
0.426 m/s. At this point, attriting particles have lost a large portion of their asperities and
attached fines such that the rate of attrition decreases considerably. Third, it is important
to consider the influence of liquor atomization and vigorous particle dynamics due to
high temperatures on fines generation when evaluating attrition in the real system.
4.4 Fragmentation Results
4.4.1 Compression Results
Typical curves for compression tests on both a single particle and an agglomerate are
shown in Figure 45. The x-axis represents the cell displacement (µm) and the y-axis
represents the cell load (kg-f). These curves follow a similar pattern with different load
magnitudes. The first plateau seen at the origin of each curve corresponds to the small
gap between the top plate and the particle at the beginning of the test. The first load slope
represents the initial contact between the top plate and the sample. Once the exerted load
reaches the second plateau, it is assumed that the particle is reorganizing its internal
structure to withstand the exerted load. After passing the third plateau, the particle no
longer withstands the exerted load and ends up breaking into fragments.
The dashed circles on Figure 45 show the point of fragmentation while the dotted
circles show the point of complete crushing for each sample. This first point of
fragmentation was visually followed using a lab telescope placed in front of the bottom
plate. Points of crushing are not considered in this characterization because it is believed
that this fluidized bed system would not see extreme forces necessary for particle
crushing. Despite the fact that compression curves in Figure 45 are presented only for
descriptive purposes and do not represent accurate values of the tested samples, the same
behavior is seen for all the tested particles regardless their size or shape (either single
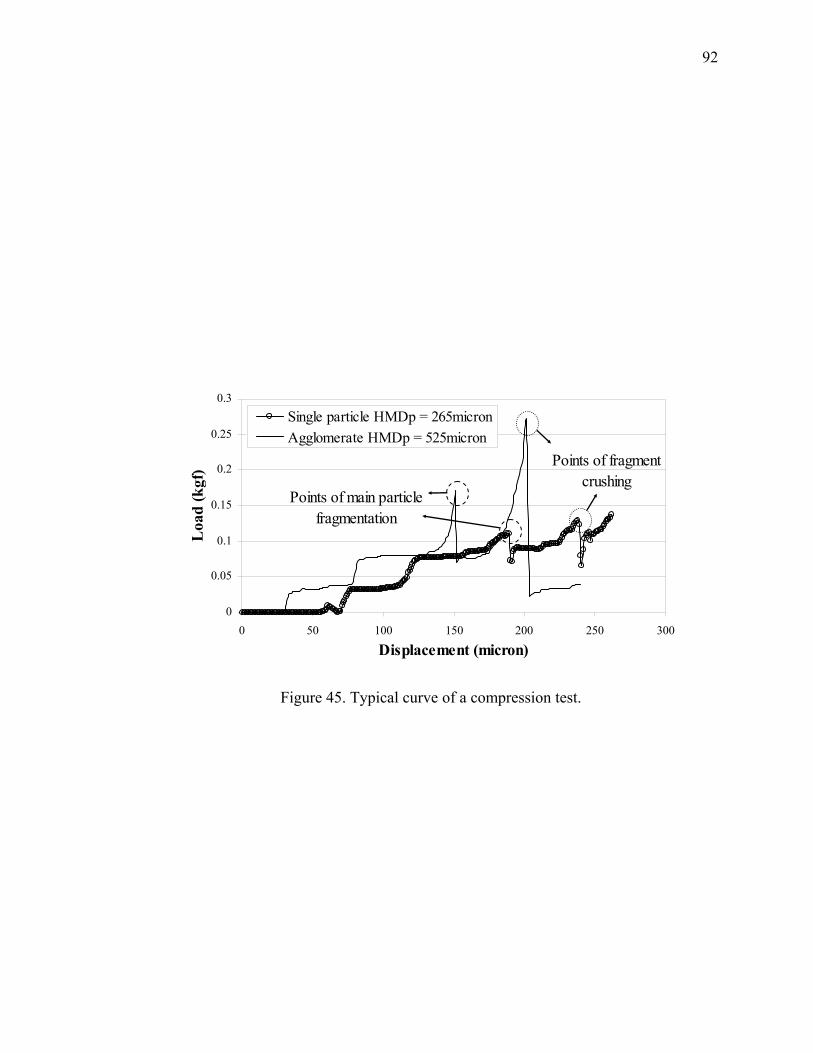
92
Figure 45. Typical curve of a compression test.
0
0.05
0.1
0.15
0.2
0.25
0.3
0 50 100 150 200 250 300
Displacement (micron)
Loa
d (k
gf)
Single particle HMDp = 265micronAgglomerate HMDp = 525micron
Points of main particle fragmentation
Points of fragment crushing
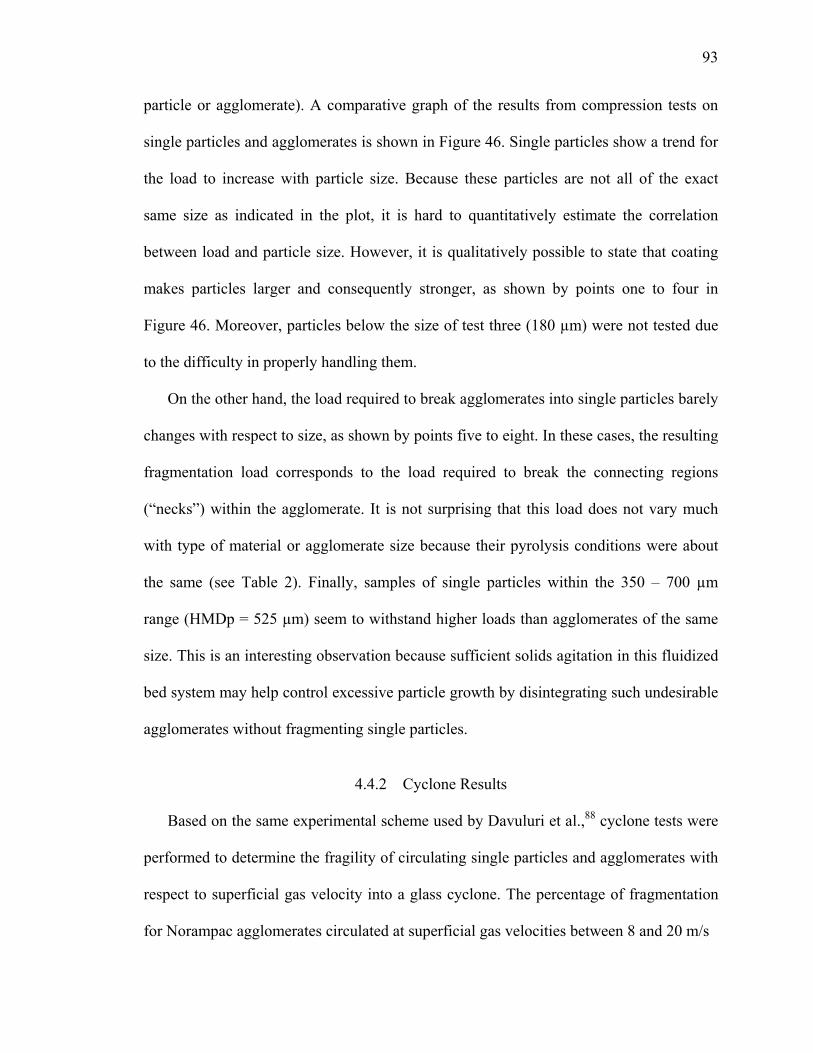
93
particle or agglomerate). A comparative graph of the results from compression tests on
single particles and agglomerates is shown in Figure 46. Single particles show a trend for
the load to increase with particle size. Because these particles are not all of the exact
same size as indicated in the plot, it is hard to quantitatively estimate the correlation
between load and particle size. However, it is qualitatively possible to state that coating
makes particles larger and consequently stronger, as shown by points one to four in
Figure 46. Moreover, particles below the size of test three (180 µm) were not tested due
to the difficulty in properly handling them.
On the other hand, the load required to break agglomerates into single particles barely
changes with respect to size, as shown by points five to eight. In these cases, the resulting
fragmentation load corresponds to the load required to break the connecting regions
(“necks”) within the agglomerate. It is not surprising that this load does not vary much
with type of material or agglomerate size because their pyrolysis conditions were about
the same (see Table 2). Finally, samples of single particles within the 350 – 700 µm
range (HMDp = 525 µm) seem to withstand higher loads than agglomerates of the same
size. This is an interesting observation because sufficient solids agitation in this fluidized
bed system may help control excessive particle growth by disintegrating such undesirable
agglomerates without fragmenting single particles.
4.4.2 Cyclone Results
Based on the same experimental scheme used by Davuluri et al.,88 cyclone tests were
performed to determine the fragility of circulating single particles and agglomerates with
respect to superficial gas velocity into a glass cyclone. The percentage of fragmentation
for Norampac agglomerates circulated at superficial gas velocities between 8 and 20 m/s
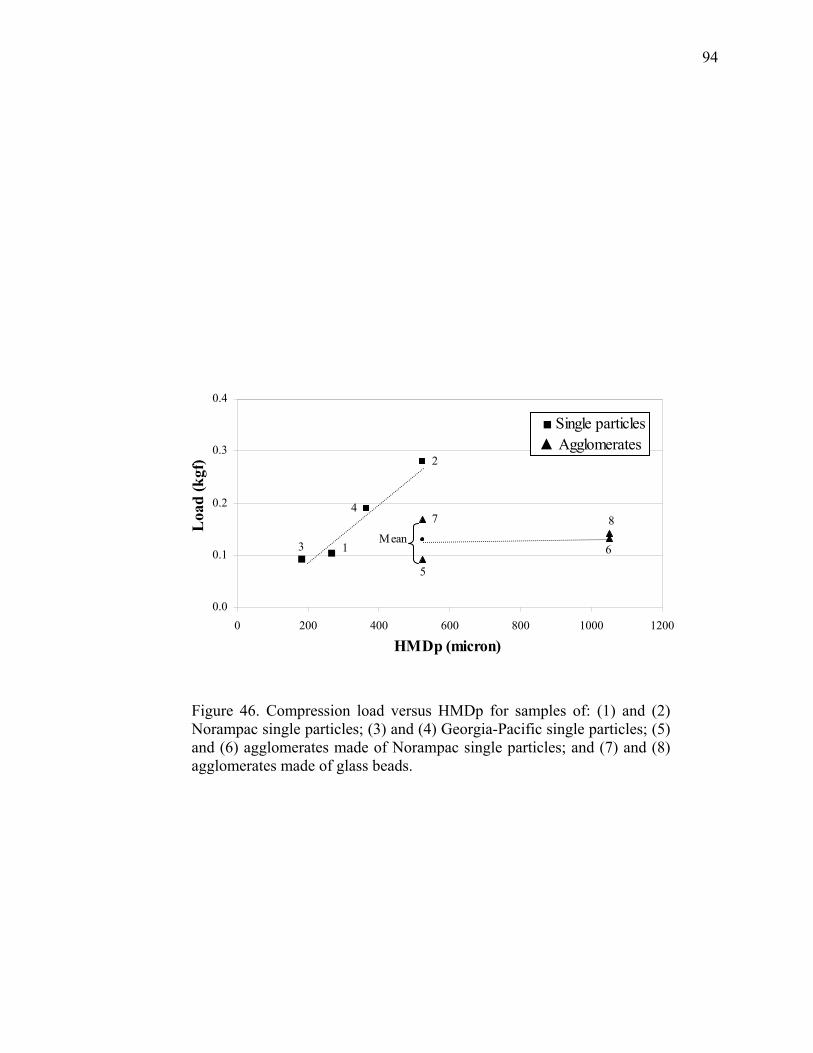
94
Figure 46. Compression load versus HMDp for samples of: (1) and (2) Norampac single particles; (3) and (4) Georgia-Pacific single particles; (5) and (6) agglomerates made of Norampac single particles; and (7) and (8) agglomerates made of glass beads.
4
2
7
3 1
5
6
8Mean
0.0
0.1
0.2
0.3
0.4
0 200 400 600 800 1000 1200
HMDp (micron)
Loa
d (k
gf)
■ Single particles▲ Agglomerates

95
is shown in Figure 47. This percentage is defined as the ratio between the weight of the
final sample that passed through the screen corresponding to the lower limit size of the
initial sample, to the weight of the initial sample. The resulting plot linearly correlates
this percentage with superficial gas velocity for agglomerates of HMDp of 525 µm.
Clearly, high superficial gas velocities are required to break these agglomerates into
single particles. Linear extrapolation of these velocity points estimates that 100%
fragmentation is achieved at about 29 m/s of superficial gas velocity. This means that
these connecting or bridging “necks” are sufficiently strong that they are not easy to
break at superficial gas velocities found within the bulk of the dense phase, which would
be very detrimental to the particle development in this system once agglomerates are
formed. However, high superficial gas velocities can be found at the distributor and
internal cyclones of the fluidized bed steam reformer, which can promote fragmentation.
Following the same experimental procedure, single particles were circulated at
different superficial gas velocities as well. Results show that no fragmentation occurs on
these particles but slight attrition does occur, as shown in Figure 48. This percentage of
attrition is also defined as the ratio between the weight of the final fines collected at the
exit gas filter, to the weight of the initial sample. This result shows that single particles
are definitely not fragile, which agrees with the results of compression tests.
4.4.3 Agglomerate Break-up by Chemical Reaction
This experiment was meant to determine the percentage of fragmentation of samples
of agglomerates created by droplet-induced agglomeration. The char residue holding the
glass beads together was reacted away according to equation 5:
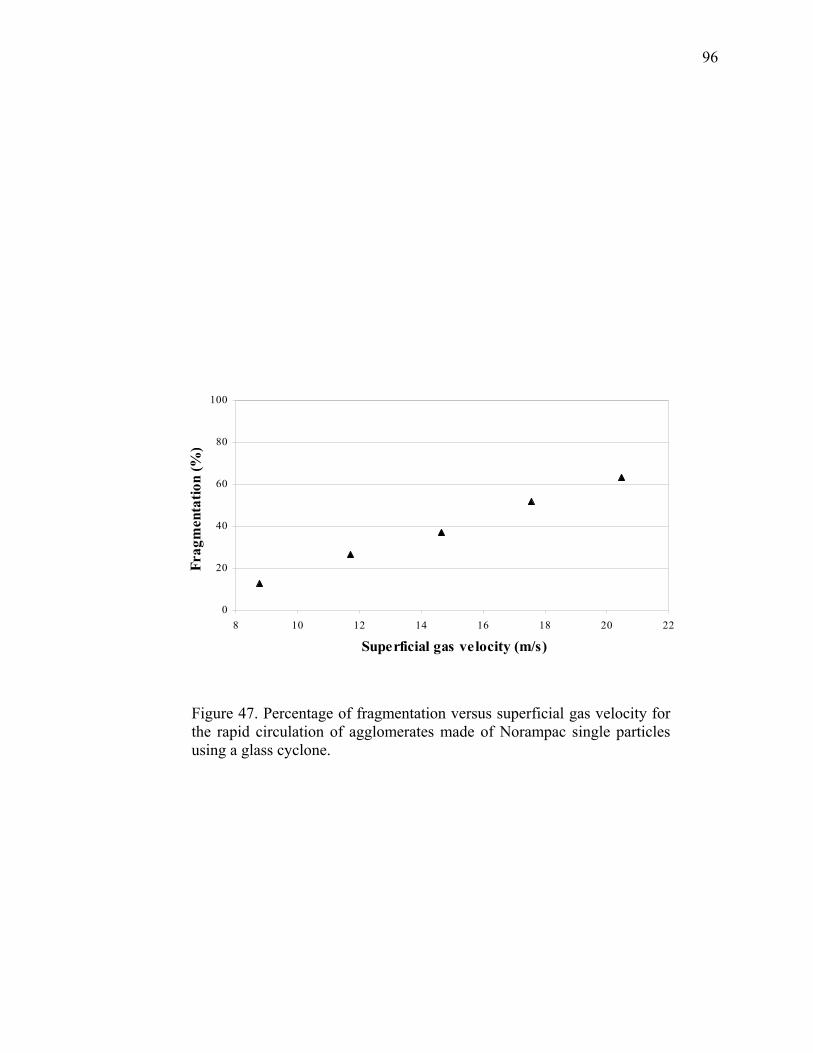
96
Figure 47. Percentage of fragmentation versus superficial gas velocity for the rapid circulation of agglomerates made of Norampac single particles using a glass cyclone.
0
20
40
60
80
100
8 10 12 14 16 18 20 22
Superficial gas velocity (m/s)
Frag
men
tatio
n (%
)

97
Figure 48. Percentage of attrition versus superficial gas velocity for the rapid circulation of Norampac single particles using a glass cyclone.
0
1
2
3
8 10 12 14 16 18 20 22
Superficial gas velocity (m/s)
Attr
ition
(%)

98
C + CO2 ↔ 2CO (5)
Based on the results of the agglomeration tests, a mass balance on test 2 shows that
64 g of char residue was deposited on the bed material (200 g of starting glass beads)
after a 12-h pyrolysis test with a feed of 1 ml/min of 12%-solids black liquor droplets.
This calculation means that 24% wt. corresponds to char residue and 76% wt.
corresponds to glass beads. Using these percentages, the consumption of organic matter
via CO2 gasification was then determined as the ratio of the difference of the weight loss
of gasified samples and the initial char weight in the samples of agglomerates, to that
initial char weight. Glass-bead agglomerates were selected for all tests in order to direct
the gasifying agent only to the organic matter in the holding char residue. Similarly, the
degree of fragmentation is defined as the ratio between the weight of the final sample that
passed through the screen corresponding to the lower limit size of the initial sample, to
the weight of the initial sample.
A comparative graph of the percentages of gasification and fragmentation for tests
one to six during CO2 gasification of glass-bead agglomerates at different temperatures
and times is shown in Figure 49. The x-axis refers to the amount of time that samples
were exposed to the gasifying agent at the temperature of interest. This plot clearly shows
the percentage of gasification to increase with respect to temperature and time. This is not
surprising due to the nature of this reaction, as described by Li et al.37 The percent of
fragmentation was observed to be most significant between temperatures 700 oC and 800
oC. However, as the system temperature approaches 800 oC, the inorganic constituents in
the liquor char (mostly Na2CO3) melt and agglomerate the whole sample. This is what
happened during test six. The percentage of gasification is very high (almost 80%), but
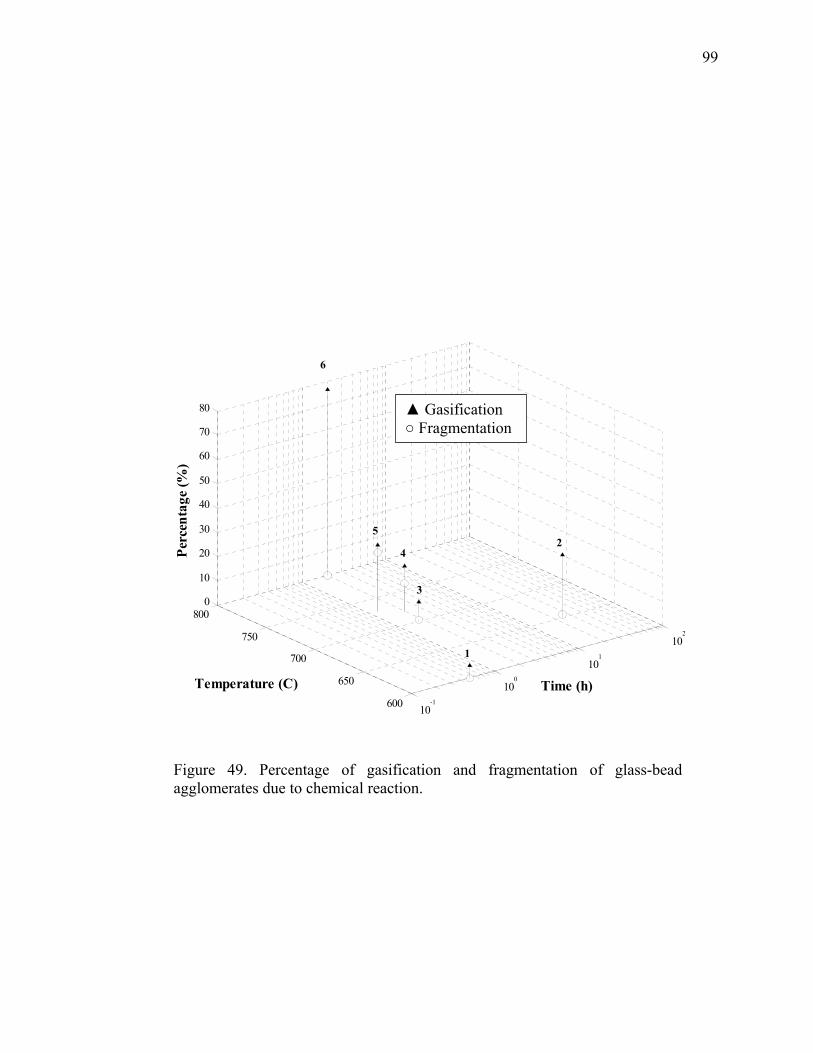
99
Figure 49. Percentage of gasification and fragmentation of glass-bead agglomerates due to chemical reaction.
10-1
100
101
102
600
650
700
750
8000
10
20
30
40
50
60
70
80
Time (h)Temperature (C)
Perc
enta
ge (%
)
1
2
3
4
5
6
▲ Gasification ○ Fragmentation
100
the final gasified sample ended up agglomerated. There is some consumption of organic
matter in these agglomerates when reacting samples below 700 oC, but too little to induce
fragmentation. Considerable fragmentation is seen at temperatures between 700 and 730
oC for 1 to 2 h. This might be the result of the consumption of organic matter located in
the connecting regions. It is very important to point out that it was previously said that
non-reacted C (nonvolatile matter) might compose a large portion of these binding areas.
Therefore, consumption of such organic matter might help reduce the strength of such
“necks,” thus leading to fragmentation. However, it would be important to consider that
the chemical consumption of the binding areas, combined with physical interactions,
should lead to higher percentages of fragmentation.
101
CHAPTER 5
CONCLUSIONS
5.1 Particle Development in a Fluidized Bed Black Liquor Steam Reformer
The work presented in this thesis contributes to the understanding of mechanisms
responsible for particle development in a fluidized bed black liquor steam reformer.
Coating, agglomeration and attrition seem to be important mechanisms for this system.
Based on the characterization of bed solids from two commercial steam reformer units, it
was possible to identify the mechanisms that most influence particle size in these units.
Additionally, experimental decoupling of four mechanisms showed important aspects of
coating, droplet-induced agglomeration, mechanical attrition and fragmentation.
A visual analysis of cross-sectional areas of bed solids from the commercial steam
reforming units showed that coating, which results from liquor atomization into the
fluidizing bed, is a very important mechanism for particle development in theses systems.
This mechanism mainly occurs on bed particles larger than 250 µm, as one to two
superimposed layers of inorganic residue rich in Na and K are seen on their external
surfaces. According to the visualization and EDS analysis of bed particles smaller than
250 µm, the coating seems not to participate in their evolution, which suggests that their
development could be attributed to the atomization of liquor droplets that dry and
pyrolyze before contacting with any bed particles. Therefore, liquor atomization appears
to be influential parameter to promote particle coating in this fluidized bed system.
102
Lab-scale fluidized bed reactor experiments showed that excessive particle growth
occurs when large liquor droplets capture several particles upon injection, and this
phenomenon is referred as droplet-induced agglomeration. Results showed that liquor
feed rate and percentage of solids content have a greater influence on the occurrence of
this submechanism than temperature. In addition, the injection of large liquor droplets
might promote particle cooling, which in turn might reduce the capacity of particles to
fully convert such liquor droplets. This observation thus highlights liquor atomization as
a key factor in particle agglomeration. On the other hand, the vigorousness of fluidization
may contribute to the successful fragmentation of droplet-induced agglomerates to
subsequently form indirect-coated particles.
Cold fluidization experiments of samples of bed solids from two commercial steam
reforming units showed that the fluidization velocity has strong influence on both the
mechanical attrition of these particles and the elutriation of material. The generation of
fines that results from mechanical attrition increases with increasing fluidization velocity.
This observation suggests that the fluidization velocity promotes particle size reduction
due to the inherent particle abrasion during fluidization. On the other hand, the elutriation
of material increases with increasing fluidization velocity. That is, more and larger
particles are carried over at higher fluidization velocities. Therefore, for a given fluidized
bed gasifier geometry, it is necessary to consider the fluidization velocity as a factor that
might deplete the amount of material that is potentially elutriable at specific fluidization
conditions; particularly, material that might derive from fine liquor atomization or
reaction-enhanced attrition.
103
Compression tests showed that the force to fragment single particles increases with
increasing particle size, but remains constant with increasing size of droplet-induced
agglomerate. This result is particularly beneficial because the fluidization velocity can
provide vigorous solids agitation to control the excessive particle growth by
disintegrating undesirable agglomerates without fragmenting single particles. On the
other hand, the rapid circulation of single particles and droplet-induced agglomerates in a
glass cyclone unit showed that agglomerates do not fragment at superficial gas velocities
found within the bulk of a bubbling fluidized bed, which might be very detrimental to
particle development in this system once agglomerates are formed.
Chemical consumption of the organic matter within the char residue of droplet-
induced agglomerates showed that this process of fragmentation is very sensitive to the
reaction temperature because it strongly affects the rate of the reaction as well as the
physical state of the inorganic content. Therefore, chemical consumption of the organic
matter, combined with a vigorous fluidization, presumably minimizes the excessive
particle growth caused by agglomeration.
Based on these experimental results, particle development in a fluidized bed black
liquor steam reformer is qualitatively addressed as shown in Figure 50. This figure
combines the most important aspects of each mechanism obtained in this study. The
width of each arrow estimates the relative participation of each mechanism in overall
particle development. This figure can be interpreted as follows:
1) Initial bed solids and liquor droplets interact to form coated particles.
2) Liquor droplets that do no reach bed solids upon injection may form new solids.
3) Initial bed solids and coated solids attrit to generate fines.

104
6a
Def
luid
izat
ion
and
syst
em
shut
dow
n
Bed
solid
sLa
yer f
orm
atio
n
Attr
ition
Mel
t-ind
uced
ag
glom
erat
e
Coa
ting-
indu
ced
aggl
omer
ate
Dro
plet
-indu
ced
aggl
omer
ate
“Nec
k”fo
rmat
ion
Stea
dy-s
tate
co
nditi
onAgg
lom
erat
ion
Liqu
or d
ropl
ets
Cha
r res
idue
1
Liqu
or d
ropl
ets
1
2
2
3
3
4
4
5
6a
6a
6a
6b
6b
8
9
6a
77
Elut
riatio
n
6a6a
Def
luid
izat
ion
and
syst
em
shut
dow
n
Bed
solid
sB
ed so
lids
Laye
r for
mat
ion
Laye
r for
mat
ion
Attr
ition
Attr
ition
Mel
t-ind
uced
ag
glom
erat
eM
elt-i
nduc
ed
aggl
omer
ate
Coa
ting-
indu
ced
aggl
omer
ate
Coa
ting-
indu
ced
aggl
omer
ate
Dro
plet
-indu
ced
aggl
omer
ate
Dro
plet
-indu
ced
aggl
omer
ate
“Nec
k”fo
rmat
ion
“Nec
k”fo
rmat
ion
Stea
dy-s
tate
co
nditi
onSt
eady
-sta
te
cond
itionAgg
lom
erat
ion
Agg
lom
erat
ion
Liqu
or d
ropl
ets
Liqu
or d
ropl
ets
Cha
r res
idue
Cha
r res
idue
11
Liqu
or d
ropl
ets
1
22
22
33
33
4
44
55
6a6a
6a
6a6a
6b
6b6b
88
99
6a6a
7777
Elut
riatio
nEl
utria
tion
Figu
re 5
0. S
chem
atic
map
of p
artic
le d
evel
opm
ent i
n a
fluid
ized
bed
bla
ck li
quor
stea
m re
form
er
105
4) Fines from attrition and liquor atomization are elutriated.
5) Elutriated fines may be returned to the bed to contribute to the bed evolution.
6) Three types of agglomerates may appear under the following circumstances:
a. Poor atomization may form either droplet-induced or coating-induced
agglomerates.
b. Local temperature peaks may form melt-induced agglomerates.
7) Droplet-induced and coating-induced agglomerates may fragment to form
indirect-coated particles.
8) Excessive amounts of agglomerates may lead to defluidization and system
shutdown.
9) Bed solids may continuously evolve to reach a steady-state condition.
5.2 Recommendations for Future Work
Experimental work should continue using the recently built University of Utah
fluidized bed black liquor steam reformer. As previously mentioned, coating is an
essential mechanism for particle development in this system. Therefore, it is very
important to analyze the layer build-up characteristics as a function of the different
process variables, specifically; liquor feed rate and droplet size distribution. However,
addition of a significant portion of inert material to the bed, chemically different from the
black liquor residue, is recommended to facilitate the analysis of layer formation on
coated particles. In addition, the characterization of fines generated and elutriated under
steam reforming conditions due to attrition demands further study, since an inherent
offset should exist between coating and attrition as particle growth and reduction
mechanisms.
106
The occurrence of particle agglomeration during steam reforming at different
operating conditions deserves special attention. The observed operating conditions that
lead to agglomeration should be reported and compared with the result of SEM/EDS
analysis of samples of agglomerates in order to establish safe operating limits to assure a
reliable operation of fluidized bed steam reformers. Once the type of agglomerates and
the operating conditions leading to their formation have been experimentally identified, it
will be necessary to study the factors that might contribute to the fragmentation of such
agglomerates. One approach to promoting this fragmentation would be to vary the
fluidization velocity and measure the superficial velocities across different heights of the
bed. As a result, velocity profiles would be obtained and used to determine whether
fragmentation occurs to control the excessive particle growth caused by agglomeration.
Another suggestion for investigating particle development in a fluidized bed black
liquor steam reformer is to model the particle size distribution. Based on the experimental
observations during testing campaigns using the pilot unit, each mechanism can be
modeled by including the most important operating aspects that promote its participation.
This modeling work should help predict the evolution of the bed material for a wide set
of experimental conditions.
107
APPENDIX
STEAM REFORMER BED MEDIA CHEMICAL
ANALYSIS PROCEDURE
This procedure involves the determination of both water insoluble and acid insoluble
content of the media. From these analyses, the water-soluble media content is
“interpreted” as sodium carbonate (Na2CO3), the acid soluble as carbon content and the
difference as limestone (CaCO3). The carbon content determined by this method
overstates to some extent the actual carbon content due to the presence of other
compounds that are also insoluble in acid. The sample handling and procedure consists of
grinding approximately 10 g of sample in a mortar and pestle to add it into two tared
glass beakers (one for acid soluble determination and one for water soluble
determination). The exact weight of sample added to each beaker is recorded.
For the water soluble content, 100 ml of distilled water is added to the beaker
containing the pre-weighed ground sample for soluble content determination. A magnetic
stirrer bar is placed into the beaker, which is then placed on a hot plate stirrer. The
contents are brought to approximately 180 oF and held at this temperature for 30 min
while stirring. After 30 min, the contents are filtered through a pre-tared paper filter using
a vacuum apparatus. Any residual material from the beaker is washed onto the filter using
additional distilled water. Approximately 50 ml more of distilled water is used to
108
wash the filter cake to remove any residual dissolved solids from the filter and cake. The
filter is removed from the Buckner funnel and placed in a drying oven at 120 oC for 1 h.
Once dried, the filter and cake are placed into a desiccator to cool before final weighing.
The percentage (wt. %) of water soluble content is then reported as 100% minus the ratio
of the difference between the dry weight of filter and cake and the filter tare weight, to
the weight of the ground sample.
For the acid soluble content, 40 ml of distilled water and 60 ml of hydrochloric acid
(HCl) are added to the beaker containing the pre-weighed ground sample for insoluble
content determination. A magnetic stirrer bar is placed into the beaker, which is then
placed on a hot plate stirrer. The contents are brought to approximately 180 oF and held at
this temperature for 30 min while stirring. After 30 min, the contents are filtered through
a pre-tared paper filter using a vacuum apparatus. Any residual material from the beaker
is washed onto the filter using additional distilled water. Approximately 50 ml more of
distilled water is used to wash the filter cake to remove any residual dissolved solids from
the filter and cake. The filter is removed from the Buckner funnel and placed in a drying
oven at 120 oC for 1 h. Once dried, the filter and cake are placed into a desiccator to cool
before final weighing. The percentage (carbon wt. %) of acid insoluble content is then
reported as the ratio of the difference between the dry weight of filter and cake and the
filter tare weight, to the weight of the ground sample. The percentage of limestone is then
reported as 100% minus the percentages of sodium carbonate and carbon.

109
REFERENCES
1. Profits Leap Ahead in '99; Standard & Poor's: New York, 2000; pp 1-10.
2. Paper and Allied Products. In U.S. Industry & Trade Outlook '99, McGraw-Hill and U.S. Department of Commerce/International Trade Administration: New York, 1999.
3. Freeman, M., North American industry overview: Introduction. In Pulp and Paper North American Factbook, Miller Freeman Inc.: San Francisco, 1999.
4. Nilsson, L. J.; Larson, E. D.; Gilbreath, K. R.; Gupta, A., Energy Efficiency and the Pulp and Paper Industry. In ACEEE Summer Study on Energy Efficiency in Industry: "Partnership, Productivity and Environment," Grand Island, New York, 1995.
5. Kinstrey, R., Invest to improve: North America struggles to maintain its global cost competitiveness. Pulp & Paper 2004, 78, (1), 34.
6. Agenda 2020 Forest Products Industry Technology Alliance; American Forest & Paper Association: Washington, D.C., 2003.
7. Raymond, D.; Thorp, B., Meeting The Challenge: Agenda 2020 program developing breakthrough technology. The PIMA Post 2004, pp 6-7.
8. Biermann, C. J., Handbook of Pulping and Papermaking. Second ed.; Academic Press Inc.: San Diego, California, 1996.
9. Profile of the Pulp and Paper Industry 2nd Edition. In U.S. Environmental Protection Agency 2002.
10. Smook, G. A., Handbook for Pulp & Paper Technologists. Second ed.; Angus Wilde Publications: Vancouver, 1992.
11. Adams, T. N.; Frederick, W. J.; Grace, T. M.; Hupa, M.; Lisa, K.; Jones, A. K.; Tran, H., Kraft Recovery Boilers. TAPPI: Georgia, 1997; p 380.
12. Higman, C.; Burgt, M. v. d., Gasification. Gulf Professional Publishing: Burlington, MA, 2003; p 391.
13. 1999 Statistics: Data Through 1998; American Forest & Paper Association: Washington, D.C., 1999.
110
14. Marklund, M. Black Liquor Recovery: How Does It Work? http://etcpitea.se/blg/document/PBLG_or_RB.pdf
15. Hemati, M.; Cherif, R.; Saleh, K.; Pont, V., Fluidized bed coating and agglomeration: influence of process-related variables and physicochemical properties on the growth kinetics. Powder Technology 2003, 130, 18-34.
16. Saleh, K.; Steinmetz, D.; Hemati, M., Experimental study and modeling of fluidized bed coating and agglomeration. Powder Technology 2003, 130, 116-123.
17. Shamlou, P. A.; Liu, Z.; Yates, J. G., Hydrodynamics influences on particles breakage in fluidized beds. Chemical Engineering Journal 1990, 45, (4), 809-817.
18. Axelsson, L. E., Detailed electricity audit of two Swedish mills. In The Swedish Forest Industries Association, Stockholm, 1990.
19. Vakkilainen, E. K., Kraft Recovery Boilers - Principles and Practice. Suomen Soodakattilayhdistys r.y.: Helsinki, Finland, 2005; p 244.
20. Dickinson, J. A.; Verrill, C. L.; Kitto, J. B., Development and Evaluation of a Low-Temperature Gasification Process for Chemical Recovery from Kraft Black Liquor. In International Chemical Recovery Conference, TAPPI: Tampa, Florida, 1998.
21. Marbe, Å.; Harvey, S.; Berntsson, T., Biofuel gasification combined heat and power - new implementation opportunities resulting from combined supply of process steam and distric heating. Energy 2004, 29, 1117-1137.
22. Eriksson, H.; Harvey, S., Black liquor gasification - consequences for both industry and society. Energy 2004, 29, 581 - 612.
23. Khrushch, M.; Worrel, E.; Price, L.; Martin, N.; Einstein, D., Carbon Emissions Reduction Potential in the U.S. Chemical and Pulp and Paper Industries by Applying CHP Technologies. In Industry and Innovation in the 21st century: 1999 ACEEE Summer Study on Energy Efficiency in Industry, Lawrence Berkeley National Laboratory: Saratoga Springs, New York, 1999.
24. Mansour, M. N.; Chandran, R. R.; Rockvam, L., The Evolution of and Advances in Steam Reforming of Black Liquor. In 2002 TAPPI Fall Conference & Trade Fair, San Diego, California, 2002.
25. Nuutinen, L. H.; Tiainen, M. S.; Virtanen, M. E.; Enestam, S. H.; Laitinen, R. S., Coating layers of bed particles during biomass fuel combustion in fluidized-bed boilers. Energy & Fuels 2004, 18, 127-139.
26. Larson, E. D.; Consonni, S.; Kreutz, T. G., Preliminary economics of black liquor gasifier/gas turbine cogeneration at pulp and paper mills. Journal of Engineering for Gas Turbines and Power 2000, 122, 255-261.
111
27. Larson, E. D.; Mcdonald, G. W.; Yang, W.; Frederick, W. J.; Iisa, K.; Kreutz, T. G.; Malcom, E. W.; Brown, C. A., A cost-benefit assessment of BLGCC technology. TAPPI Journal 2000, 83, (6), 1-16.
28. Möllersten, K.; Yan, J.; Westermark, M., Potential and cost-effectiveness of CO2 reductions through energy measures in Swedish pulp and paper mills. Energy 2003, 28, 691-710.
29. Fleischman, E.; Sobczynski, S. F. Pulp and Paper Mill of the Future, A Workshop, Final Report; U.S. Department of Energy, Office of Industrial Technologies: Report CONF-930252-(DE94013841); Washington, D.C., 1993. 30. Zeng, L. Kraft Black Liquor Gasification and Direct Causticization with TiO2 in a Fluidized Bed. Ph.D. Dissertation, The University of New Brunswick, Canada, 1997.
31. Tucker, P., Changing the balance of power. Solutions! for People, Processes and Paper 2002, 85, (2), 34-38.
32. Olofsson, I.; Nordin, A.; Söderlind, U. Initial Review and Evaluation of Process Technologies and Systems Suitable for Cost-Efficient Medium-Scale Gasification for Biomass to Liquid Fuels; Energy Technology & Thermal Process Chemistry, Univeristy of Umeå, and Department of Engineering, Physics and Mathematics, Mid Sweden University: Umeå, Sweden, 2005; p 95.
33. Whitty, K.; Verrill, C. L., A Historical Look at the Development of Alternative Black Liquor Recovery Technologies and the Evolution of Black Liquor Gasifier Designs. In 2004 International Chemical Recovery Conference, TAPPI: Charleston, South Carolina, 2004.
34. Keiser, J. R.; Peascoe, R. A.; Hubbard, C. R., Corrosion Issues in Black Liquor Gasifiers. In Corrosion 2003, National Association of Corrosion Engineers International: San Diego, California, 2003.
35. Empie, H. J., Alternative kraft recovery processes. TAPPI Journal 1991, 74, (5), 272-276.
36. Tam, P.; Mazzi, E.; Cheng, K.; Edwards, W. Forest Sector Table: Assessment of Gasification Technologies and Prospect for their Commercial Application; Levelton Engineering Ltd.: Richmond, B.C., 1999; p 68.
37. Li, J.; Heiningen, A. R. P. v., Kinetics of CO2 gasification of fast pyrolysis black liquor char. Industrial & Engineering Chemistry Research 1990, 29, 1776 - 1785.
38. Frederick, W. J.; Lisa, K.; Malcolm, E., How Will Integrated Gasification - Combined Cycle Recovery Technology Impact Kraft Pulping and Chemical Recovery? In TAPPI 1998 International Engineering Conference, Miami, Florida, 1998.
112
39. Olazar, M.; Aguado, R.; Sánchez, J. L.; Bilbao, R.; Arauzo, J., Thermal processing of straw black liquor in fluidized and spouted bed. Energy & Fuels 2002, 16, 1417-1424.
40. Maniatis, K., Progress in biomass gasification: An overview. In Progress in Thermochemical Biomass Conversion, Bridgwater, A., Ed. Blackwell Publising Ltd.: Oxford, United Kingdom, 2001; Vol. 2, pp 1-31.
41. Kunii, D.; Levenspiel, O., Fluidization Engineering. 2nd ed.; Butterworth-Heinemann: Stoneham, Massachusetts, 1991; p 491.
42. Rockvam, L. N.; Tenore, F. M., Black Liquor Steam Reforming and Recovery. In TAPPI 1996 International Engineering Conference, Chicago, Illinois, 1996.
43. Sánchez, J. L.; Gonzalo, A.; Gea, G.; Bilbao, R.; Arauzo, J., Straw black liquor steam reforming in a fluidized bed reactor. Effect of temperature and bed substitution at pilot scale. Energy & Fuels 2005, 19, 2140-2147.
44. Lv, P. M.; Xiong, Z. H.; Chang, J.; Wu, C. Z.; Chen, Y.; Zhu, J. X., An experimental study on biomass air-steam gasification in a fluidized bed. Bioresource Technology 2004, 95, 95-101.
45. Cammarota, A.; D'amore, M.; Donsì, G.; Massimilla, L., Fluidized Bed Incineration of Slurry Waste from Caprolactam Production. In 18th Symposium (International) on Combustion, The Combustion Institute: Waterloo, Ontario, Canada, 1981.
46. Öhman, M.; Nordin, A., A new method for quantification of fluidized bed agglomeration tendencies: A sensitivity analysis. Energy & Fuels 1998, 12, 90-94.
47. Öhman, M.; Nordin, A., Bed agglomeration characteristics during fluidized bed combustion of biomass fuels. Energy & Fuels 2000, 14, 169-178.
48. Lin, W.; Dam-Johansen, K.; Frandsen, F., Agglomeration in bio-fuel fluidized bed combustors. Chemical Engineering Journal 2003, 96, 171-185.
49. Ergüdenler, A.; Ghaly, A. E., Agglomeration of alumina sand in a fluidized bed straw gasifier at elevated temperatures. Bioresource Technology 1993, 43, 259-268.
50. Öhman, M.; Pommer, L.; Nordin, A., Bed agglomeration characteristics and mechanisms during gasification and combustion of biomass fuels. Energy & Fuels 2005, 19, 1741-1748.
51. Brus, E.; Öhman, M.; Nordin, A.; Boström, D., Bed agglomeration characteristics of biomass fuels using blast-furnace slag as bed material. Energy & Fuels 2004, 18, 1187-1193.

113
52. Brus, E.; Öhman, M.; Nordin, A., Mechanisms of bed agglomeration during fluidized-bed combustion of biomass fuels. Energy & Fuels 2005, 19, 825-832.
53. Miccio, F.; Moersch, O.; Spliethoff, H.; Hein, K. R. G., Generation and conversion of carbonaceous fine particles during bubbling fluidized bed gasification of a biomass fuel. Fuel 1999, 78, (12), 1473-1481.
54. Leckner, B.; Palchonok, G.; Borodulya, A.; Tullin, C.; Samuelsson, J., Influence of Attrition on Combustion of Biomass Pellet Char. In 41st IEA - Fludized bed conversion meeting, International Energy Agency (IEA): Fisciano, Italy, 2000.
55. Scala, F.; Salatino, P., Fluidized bed combustion of a biomass char (Robinia pseudoacacia). Energy & Fuels 2000, 14, 781-790.
56. Cooper, D. J.; Clough, D. E., Experimental tracking of particle-size distribution in a fluidized bed. Powder Technology 1985, 44, 169-177.
57. Sun, G.; Grace, J. R., Effect of particle size distribution in different fluidization regimes. AIChE Journal 1993, 38, (5), 716-722.
58. Cooper, D. J.; Clough, D. E., Real-time estimation of dynamic particle-size distributions in a fluidized bed: theoretical foundation. AIChE Journal 1985, 31, (7), 1202-1212.
59. Cooper, D. J.; Clough, D. E., Optimal, real-time monitoring of particle size distribution in a fluidized bed. AIChE Journal 1986, 32, (3), 389-396.
60. Hill, P. J.; Ng, K. M., Simulation of solids processes accounting for particle size distribution. AIChE Journal 1997, 43, (3), 715-726.
61. Seville, J. P. K.; Willett, C. D.; Knight, P. C., Interparticle forces in fluidisation: a review. Powder Technology 2000, 113, 261-268.
62. Sjösten, J.; Golriz, M. R.; Nordin, A.; Grace, J. R., Effect of particle coating on fluidized-bed heat transfer. Industrial & Engineering Chemistry Research 2004, 43, 5763-5769.
63. Visser, H. J. M.; Hofmans, H.; Huijnen, H.; Kastelein, R.; Kiel, J. H. A., Biomass ash-bed material interactions leading to agglomeration in fluidized bed combustion and gasification. In Progress in Thermochemcial Biomass Conversion, Bridgwater, A., Ed. Blackwell Science: Cornwall, United Kingdom, 2001; Vol. 1, pp 272-286.
64. Dawson, M. R.; Brown, R. C., Bed material cohesion and loss of fluidization during fluidized bed combustion of midwestern coal. Fuel 1992, 71, (5), 585-592.
65. Manzoori, A. R.; Agarwal, P. K., The role of inorganic matter in coal in the formation of agglomerates in circulating fluid bed combustors. Fuel 1993, 72, (7), 1069-1075.

114
66. Brus, E.; Öhman, M.; Nordin, A.; Skrifvars, B.-J.; Backman, R., Bed material consumption in biomass fired fluidized bed boilers due to risk of bed agglomeration - Coating formation and possibilities for regeneration. IFRF Combustion Journal 2003.
67. Ghaly, A. E.; Ergüdenler, A.; Laufer, E., Study of agglomeration characteristics of silica sand-straw ash mixtures using scanning electronic microscopy and energy dispersion X-ray techniques. Bioresource Technology 1994, 48, 127-134.
68. Ishom, F.; Harada, T.; Aoyagi, T.; Sakanishi, K.; Korai, Y.; Mochida, I., Problems in PFBC boiler (2): characterization of bed materials found in a commercial PFBC boiler at different load levels. Fuel 2004, 83, 1019-1029.
69. Moilanen, A.; Sørensen, L. H.; Gustafsson, T. E.; Laatikainen-Luntama, J.; Kurkela, E., Characterisation method of biomass ash for gasification. In Progress In Thermochemical Biomass Conversion, Bridgwater, A., Ed. Blackwell Science: Cornwall, United Kingdom, 2001; Vol. 1, pp 122-136.
70. Virtanen, M. E.; Tiainen, M. S.; Pudas, M.; Laitinen, R. S., Visualization and analysis of SEM-EDS data of quartz-bed agglomerates. In Progress In Thermochemical Biomass Conversion, Bridgwater, A., Ed. Blackwell Science: Cornwell, United Kingdom, 2001; Vol. 1, pp 671-677.
71. Daavitsainen, J. H. A.; Nuutinen, L. H.; Tiainen, M. S.; Laitinen, R. S., Agglomeration and the content of amorphous material in FB combustion. A full-scale boiler test. In Progress In Themochemical Biomass Conversion, Bridgwater, A., Ed. Blackwell Science: Cornwell, United Kingdom, 2001; Vol. 1, pp 779-788.
72. Leclère, K.; Briens, C.; Gauthier, T.; Bayle, J.; Bergougnou, M.; Guigon, P., Liquid vaporization in a fluidized bed. Industrial & Engineering Chemistry Research 2001, 40, 5415-5420.
73. McMillan, J.; Zhou, D.; Ariyapadi, S.; Briens, C.; Berruti, F.; Chan, E., Characterization of the contact between liquid spray droplets and particles in a fluidized bed. Industrial & Engineering Chemistry Research 2005, 44, 4932-4939.
74. House, P. K.; Saberian, M.; Briens, C. L.; Berruti, F.; Chan, E., Injection of a Liquid Spray into a Fluidized Bed: Particle-Liquid Mixing and Impact on Fluid Coker Yields. Industrial & Engineering Chemistry Research 2004, 43, 5663-5669.
75. Smith, P. G.; Nienow, A. W., Particle growth mechanisms in fluidised bed granulation. Chemical Engineering Science 1983, 38, (8), 1223-1231.
76. Werther, J.; Reppenhagen, J., Attrition in fluidized beds and pneumatic conveying lines. In Fluidization, Solids Handling, and Processing - Industrial Applications, Yang, W. C., Ed. William Andrew Publishing/Noyes: Westwood, New Jersey, 1998; p 890.
77. Forsythe, W. L.; Hertwig, W. R., Attrition characteristics of fluid cracking catalysts. Industrial & Engineering Chemistry 1949, 41, (6), 1200-1206.

115
78. Gwyn, J. E., On the particle size distribution function and the attrition of cracking catalysts. AIChE Journal 1969, 15, (1), 35-38.
79. Chirone, R.; D'amore, M.; Massimilla, L.; Mazza, A., Char attrition during the batch fluidized bed combustion of a coal. AIChE Journal 1985, 31, (5), 812-820.
80. Ray, Y.; Jiang, T., Particle attrition phenomena in a fluidized bed. Powder Technology 1987, 49, 193-206.
81. Salatino, P.; Chirone, R., A Survey of Attrition Research in Naples. In 41st IEA - Fludized bed conversion meeting, International Energy Agency (IEA): Fisciano, Italy, 2000.
82. Tardin., P. R.; Goldstein, L., On the mechanical attrition and fragmentation of particles in a fast fluidized bed. Industrial & Engineering Chemistry Research 2001, 40, 4141-4150.
83. Lin, L.; Sears, J. T.; Wen, C. Y., Elutriation and attrition of char from a large fluidized bed. Powder Technology 1980, 27, 105-115.
84. Brown, R. C.; Ahrens, J.; Christofides, N., The contribution of attrition and fragmentation to char elutriation from fluidized beds. Combustion and Flame 1992, 89, 95-102.
85. Zhang, H.; Cen, K.; Yan, J.; Ni, M., The fragmentation of coal particles during the coal combustion in a fluidized bed. Fuel 2002, 81, (14), 1835-1840.
86. Stubington, J. F.; Linjewile, T. M., The effect of fragmentation on devolatilization of large coal particles. Fuel 1989, 68, (2), 155-160.
87. Walsh, P. M.; Li, T., Fragmentation and attrition of coal char particles undergoing collisions during combustion at temperatures from 900 to 1000K. Combustion and Flame 1994, 99, 749-757.
88. Davuluri, R. P.; Knowlton, T. M., Development of a standardized attrition test procedure. In Fluidization IX, Engineering Foundation: New York, 1998; p 405.
89. Lee, S. R.; Verrill, C. L.; Nichols, K. M., Kraft black liquor char density. In 1992 Annual Meeting of the American Institute of Chemical Engineers, Institute of Paper Science and Technology: Miami Beach, Florida, 1992.
90. Haider, A.; Levenspiel, O., Drag coefficient and terminal velocity of spherical and nonspherical particles. Powder Technology 1989, 58, (1), 63-70.
91. Amitin, A. V.; Martyushin, I. G.; Gurevich, D. A., Dusting in the space above the bed in converters with a fluidized catalyst bed. Chemistry and Technology of Fuels and Oils 1968, 4, (3), 181-184.