particle emission reduction
TRANSCRIPT

June 2014
Particle Emission Reduction Cost Analysis for Existing 1-20 MWfuel Solid Biofuel Plants
in Finland

Report
1 (18)
13 June 2014
ÅF-Consult Ltd Bertel Jungin aukio 9, FI-02600, Finland Phone +358 (0)40 348 5511. Fax +358 (0)9 3487 0810. www.afconsult.com.
VAT no. FI1800189-6. Registered office Helsinki.
Authors Checked by, Date
L. Pirhonen
J. Salamäki, 13.6.2014
Distribution Approved by, Date
J. Makkonen, Finnish Energy Industries
F. Blomfelt, Finnish Forest Industries
M. Kätkä, Finnish Technology Industries
P. Kling, 13.6.2014
Particle Emission Reduction Cost Analysis for Existing 1-20 MWfuel Solid
Biofuel Plants in Finland

Report
2 (18)
13 June 2014
© ÅF-Consult Ltd 2014
Contents
1 EXECUTIVE SUMMARY .................................................................................................................................. 3
2 INTRODUCTION ............................................................................................................................................. 4
3 SOLID BIOFUEL COMBUSTION IN FINLAND ............................................................................................. 4
3.1 SOLID BIOFUELS FUELS ............................................................................................................................................ 4 3.2 BOILER AND PARTICLE EMISSION CONTROL TECHNOLOGY (PLANTS 1-20 MWFUEL) ..................................................... 5
4 PARTICLE EMISSION REDUCTION .............................................................................................................. 7
4.1 MULTICYCLONE ...................................................................................................................................................... 7 4.2 ELECTROSTATIC PRECIPITATOR (ESP) ....................................................................................................................... 7 4.3 FABRIC FILTER ......................................................................................................................................................... 8 4.4 SCRUBBER .............................................................................................................................................................. 9
5 COST ANALYSIS ........................................................................................................................................... 10
5.1 ASSUMPTIONS ...................................................................................................................................................... 10 5.2 INVESTMENT COSTS .............................................................................................................................................. 11
5.2.1 Equipment ................................................................................................................................................ 11 5.2.2 Additional Investment Cost Factors ....................................................................................................... 11 5.2.3 Investment Cost Estimates ..................................................................................................................... 12
5.3 OPERATION AND MAINTENANCE COSTS .................................................................................................................. 13 5.3.1 Operating Income – Low Temperature Heat From Scrubber .............................................................. 14
5.4 SENSITIVITY ANALYSIS ........................................................................................................................................... 14 5.4.1 Boiler Size ................................................................................................................................................ 14 5.4.2 Operating Hours ...................................................................................................................................... 15 5.4.3 Investment Cost ....................................................................................................................................... 16 5.4.4 Emission Level ......................................................................................................................................... 16
5.5 COMPARISON TO OTHER PARTICLE EMISSION REDUCTION COST EFFECT STUDIES ..................................................... 16 5.5.1 Amec Study .............................................................................................................................................. 17 5.5.2 Nussbaumer Study .................................................................................................................................. 18
Appendix 1 CHP-plants and stationary district heating plants in Finland and fuel mix in district heating
Appendix 2 An example of the calculation of the cost of particle emission reduction in a 10 MWfuel plant

Report
3 (18)
13 June 2014
© ÅF-Consult Ltd 2014
1 EXECUTIVE SUMMARY
ÅF-Consult Ltd (Consultant) prepared the cost analysis for particle emission reduction in solid
biofuel plants with a size range of 1-20 MWfuel. The main focus of this report is on the solid
biofuels and technologies that are used in Finland.
The costs of particle emissions were estimated based on existing plants, cost estimations in
literature, and the information received from equipment suppliers. The main results are shown
in the figure below. The cost estimates in this study are generally higher than in similar
studies. The cost of particle reduction in the plants operating 5000 hour per year differs from
5 000 – 22 000 EUR/t. If the operating hours decrease the cost of particle reduction increases
rapidly e.g. from 10 000 EUR/t to 35 000 EUR/t when the operating hours decrease from 5000
h/a to 1000 h/a.
Figure 5.1 from page 15
-10 000
-5 000
0
5 000
10 000
15 000
20 000
25 000
1 2 3 4 5 6 7 8 9 10 11 12 13 14 15 16 17 18 19 20
Co
ts o
f p
arti
cle
em
issi
on
re
du
ctio
n (
EU
R/t
)
Boiler size (MWfuel)
ESP Fabric filter Scrubber Scrubber (heat recovery)
Operating hours 5000 h/a
Main Conclusions
In general, for small biofuel combustion plants the emission levels of 20-45
mg/Nm³ are achieved mainly with fabric filter and ESP, with some solid biofuels
(e.g. pellets) these emission levels might be achieved also with scrubber. Typically
scrubber technology in these plant sizes can achieve an emission level 50
mg/Nm³. Heat recovery scrubber investment can be profitable investment due to
the additional heat production, if there is need for low temperature heat.
The cost of particle ton reduced increases rapidly when the size of the boiler
decreases (5 000 - 22 000 EUR/t operating hours 5000 h/a).
The case specific costs, such as flue gas ducts, can play a significant role in the
total investment cost of the particle reduction system. Especially with small
boilers and sites where the space is limited.
Investment cost for particle reduction differs from 200 000 - 1 200 000 EUR
depending on particle reduction technology and plant size. The site specific costs
are not included.

Report
4 (18)
13 June 2014
© ÅF-Consult Ltd 2014
2 INTRODUCTION
In December 2013 European Commission released a clean air policy package. A part of the
package is a proposal for new Directive to control emissions from medium-sized
combustion installations (MCP-directive), such as energy plants for street blocks or large
buildings, and small industry installations.
The emission limits for the particulate matter in the MCP-directive proposal are:
Fuel input MCP directive Current legislation in Finland
Existing solid biomass combustion plants
10-50 MWfuel solid biomass 30 mg/Nm³ 50 mg/Nm³
5-10 MWfuel solid biomass 150 mg/Nm³
1-5 MWfuel solid biomass 45 mg/Nm³ 200 mg/Nm³
New solid biofuel combustion plants
10-50 MWfuel solid biomass 20 mg/Nm³ 40 mg/Nm³
5-10 MWfuel solid biomass 50 mg/Nm³
1-5 MWfuel solid biomass 25 mg/Nm³ 200 mg/Nm³
The cost effect of lowering the particle emission limits from the current levels to the MCP-
directive proposal limits for solid biomass is studied in this report. An overview of Finnish 1-
20 MWfuel plants is presented in the chapter 3.
3 SOLID BIOFUEL COMBUSTION IN FINLAND
The energy produced in a small scale solid biofuel combustion plants (1-20 MWfuel) in Finland
is typically used for production of district heat or heat for industry. There are also few small
scale combined heat and power production plants. At the moment electricity production from
renewable energy sources is subsidized in Finland.
The annual operating time for the plants depends on the heat demand. A small solid biomass
combustion plant can be e.g. a base load district heat producer in a small district heating
network with operating hours over 7500 hours per year, or a short period heat producer for a
greenhouse with operating hours less than 3000 hours per year.
3.1 SOLID BIOFUELS FUELS
Solid biofuels are produced from wood, plants, and/or fruits. Solid biofuels include fuels such
as wood chips, bark, saw dust, briquettes, pellets, cutter chips, fuel wood, straw, grain hull etc.

Report
5 (18)
13 June 2014
© ÅF-Consult Ltd 2014
In Finland especially forest residues and by products from forest industry are used as a fuel in
solid biofuel combustion plants. CHP-plants and stationary heating plants in Finland and the
fuel mix in district heating are shown in the Appendix 1.
In the following table is presented some of the basic properties of forest residues, bark and
saw dust used in Finland.
Table 3.1. Typical Fuel Properties in Finland (VTT, 2000; Suomessa käytettävien polttoaineiden
ominaisuuksia; http://www.vtt.fi/inf/pdf/tiedotteet/2000/T2045.pdf )
Fuel Forest residues Bark (pine) Saw dust
(pine, no bark)
LHV (lower heat value) MJ/kg (db)
(dry base)
19,3 20,0 19,0
Moisture m-% (mass-%) 50-60 40-85* 5-15**
Ash m-% (db) 1,3 1,7 0,08
S m-% (db) 0,02 0,03 0
* 40-50 % after dry debarking, 60-70 % after wet debarking, 70-85 % after wet storing
** Saw dust from dried lumber
3.2 BOILER AND PARTICLE EMISSION CONTROL TECHNOLOGY (PLANTS 1-20 MWFUEL)
Solid biofuel boiler technology depends mainly on the size of the plant. Although both grate
and bubbling fluidized bed (BFB) combustion technologies can be used nearly for the entire
size range of 1-20 MWfuel, grate boiler is more typical when the boiler size is less than 10
MWfuel.
Picture 3.1. Grate boiler furnace Picture 3.2. BFB boiler furnace
(KPA Unicon Ltd) (Valmet Ltd)

Report
6 (18)
13 June 2014
© ÅF-Consult Ltd 2014
Particle emission limits in Finland require a particle emission control system after solid biofuel
boilers. The particle emission limits and control technology used depends on the size of the
plant.
Currently in most of the plants with size less than 10 MWfuel the particle emission control
technology is based on a multicyclone. With multicyclone particle emissions can be reduced
to 100-300 mg/Nm³ depending on the fuel properties. The result in the particle emission
measurements can vary significantly depending on the combustion conditions and fuel
properties at the moment of the measurement.
In some cases a scrubber is placed after the multicyclone and an emission level of 45 mg/Nm³
can be achieved. However, typically the emission level for scrubber in particle emission
reduction for this size of plants is 50-150 mg/Nm³.
When the plant size is over 10 MWfuel the most common particle emission control technology
used in existing plants is electrostatic precipitator (ESP). In most of the plants with ESP the
emission limit 30 mg/Nm³ is already achieved.
The particle emission after the boiler, cyclone, scrubber, ESP, and fabric filter are summarized
in the following figure. The values used for the particle emissions after the boiler are at the
high end of the range presented in a Ohlström (1998) study1. The emission level after fabric
filter is a rough estimate. For cyclone, scrubber, and ESP the results from a particle emission
measurements2 were used. The emission levels (mg/Nm
3) are presented in a logarithmic scale.
The reduction is presented in a regular scale.
Figure 3.1. Particle emission levels and reduction level
1 Ohlström, 1998, Energiantuotannon pienhiukkaspäästöt Suomessa, VTT, http://www.vtt.fi/inf/pdf/tiedotteet-
/1998/T1934.pdf, in Finnish 2 Sippula, 2010, Fine Particle Formation and Emissions in Biomass Combustion, University of Eastern Finland,
http://www.atm.helsinki.fi/faar/reportseries/rs-108.pdf, in English
0 %
10 %
20 %
30 %
40 %
50 %
60 %
70 %
80 %
90 %
100 %
1
10
100
1 000
10 000
Boiler Cyclone Scrubber ESP Fabric Filter
Red
uct
ion
%
Par
ticl
e Em
issi
on
s (m
g/N
m3)
(lo
g 10-s
cale
)
Emission level after the applied technology
Reduction from the amount after the boiler (%)

Report
7 (18)
13 June 2014
© ÅF-Consult Ltd 2014
4 PARTICLE EMISSION REDUCTION
The commonly used particle emission control technologies currently on the market are
cyclone/multicyclone, ESP, fabric filter, and scrubber. Based on information received from the
equipment suppliers and literature, the particle emission limits in the MCP-directive proposal
can only be achieved with ESP or fabric filter.
4.1 MULTICYCLONE
Cyclone and multicyclone are widely used particle emission controls systems in Finland. The
cyclone separates particles by centrifugal force. Multicyclone consists of several cyclones. The
flue gas is fed to the multicyclone from the side and the spread evenly to the top of the
cyclones. The clean gas exits from the top of the multicyclone and the separated particles fall
off to the bottom of the multicyclone.
Cyclone and multicyclone are simple technology, and the investment and the operating and
maintenance costs are low.
Picture 4.1. Cyclone (Oksanen, 2007, Air Pollution Control course material, Tampere University
of Technology)
4.2 ELECTROSTATIC PRECIPITATOR (ESP)
The basic particle separating principle for ESP is similar to cyclones. As in cyclone the particles
are collected to the wall of the device.

Report
8 (18)
13 June 2014
© ÅF-Consult Ltd 2014
Picture 4.2. Simplified ESP with two plates, four high voltage cables, and one flue gas path. In
practice there is always several of these units. (Oksanen, 2007)
In the ESP the particles are first electrically charged, and the taken to electric field. In the
electric field the particles are drawn to the walls. On the walls the particles lose their electrical
charge, and form a “filter cake”. The “filter cakes” are removed by shaking the walls in regular
basis, when the particles fall to the bottom of the ESP.
The charging phase is rapid, thus the size of the ESP mainly depends on the required
collection area. The separation efficiency of the ESP increases when the size of the ESP
increases, because the particle spends a longer time in the electric field. Gas mixing is
important in ESP to assure that all the flue gas passes through an electric field where the
separation efficiency is good.
4.3 FABRIC FILTER
In fabric filter the particles are separated by directing the flue gas through the filter bag. The
particles are collected on the surface of the filter fabric forming a filter cake. The flue gas flows
through both the filter cake and the filter fabric. The bags are cleaned in regular basis for an
example by an air pulse. Depending on the fabric filter type, the cleaning either can or cannot
be done during operation. The particle separation efficiency is lower right after the cleaning
compared to the efficiency before cleaning due to the fact that filter cake improves separation
efficiency.
The investment cost of the fabric filter is in the same magnitude with the ESP, but the
operating and maintenance costs are higher. In general, the bags have to be changed to new
ones in every 2-4 years. Also pressure loss and adhesive particles cause operating and
maintenance costs.

Report
9 (18)
13 June 2014
© ÅF-Consult Ltd 2014
Picture 4.3. Fabric filter (Oksanen, 2007)
4.4 SCRUBBER
Scrubber particle separations are based on water drop injection to the flue gas stream. The
particles are mixed into the water that circulates in the scrubber. The separation efficiency
increases when the size of the water drops decreases and the velocity difference between the
flue gas and the water drops increases. The particle suppression is based on the collision of
the water drop and the particle, and diffusion (small particles). The efficiency increases if the
water vapor condensates on the small particles, as in venturi scrubbers. Also the amount of
the particles in the flue gases effects to the separation efficiency. If the amount of particles is
high, a pre-particle separator, e.g. cyclone, might be required.
There are many different scrubber technologies, and the investment cost can differ
significantly. The operation and maintenance cost are high due to the treatment of the dirty
condensate. If there is demand for low temperature heat, such as district heating, the scrubber
can also work as a heat recovery system. The heat recovery scrubber is more expensive than a
regular scrubber, but the heat recovery can be significant and the payback time for the whole
scrubber investment can be short. At many sites there is no need for the low temperature
heat, such as industrial site where the processes produce low temperature heat as a by-
product.

Report
10 (18)
13 June 2014
© ÅF-Consult Ltd 2014
Picture 4.4. Scrubber (Oksanen, 2007)
5 COST ANALYSIS
The cost of particle emission reduction is presented in this chapter.
5.1 ASSUMPTIONS
In this study the emission levels achieved are assumed to be fixed for the different
technologies. The values are presented in the following table. It is assumed that these
emission levels can be achieved with different fuels and boiler technologies. The emission
level achieved with ESP depends on the fuel used. Thus, to achieve the same emission levels
with different kind of biofuels, the investment cost of an ESP might be higher for forest
residue, saw dust, and bark than for pellets.

Report
11 (18)
13 June 2014
© ÅF-Consult Ltd 2014
Table 5.1. Emission levels with different technologies for solid biofuels such as forest residue,
bark, and saw dust
Technology Achievable Emission
Level
Emission Level Used In
Calculations
Multicyclone ~200 mg/Nm³ -
ESP (two fields) < 30 mg/Nm³ 30 mg/nm3
Fabric filter < 20 mg/Nm³ 30 mg/nm3
Cyclone/Multicyclone + Scrubber ~45 mg/Nm³ 50 mg/Nm³
The current emission level is assumed to be 200 mg/Nm³ for existing bio boilers, and the
technology used is cyclone/multicyclone. The emission levels after the investment to ESP or
fabric filter would be as required in the MCP directive. The emission level after scrubber
investment would be 50 mg/Nm³.
5.2 INVESTMENT COSTS
It is assumed that all the solid bio fuel plants in Finland with sizes over 1 MWfuel have at least
cyclone as a particle reduction system. The additional investment for particle reduction
depends on the efficiency of the existing system.
5.2.1 Equipment
The required emission levels in the directive proposal cannot be achieved with the
cyclone/multicyclone. The required investment in these cases is either ESP or fabric filter. Also
the scrubber investment is analyzed, even though the emission level that can be achieved is
50 mg/Nm³. The investment cost of a heat recovery scrubber is estimated to be 30 % more
than for the scrubber without heat recovery system. Scrubber investment includes a new stack.
If the required emission levels are not achieved with the existing ESP, the required investment
comes from adding a field to the ESP. The investment cost of an ESP (two fields) achieving 30
mg/Nm³ emission level is approximately 30 % more than the investment cost of an ESP (one
field) achieving 50 mg/Nm³ emission level.
The investment cost estimates are based on the ÅF cost knowledge base, information received
from equipment suppliers, and literature.
5.2.2 Additional Investment Cost Factors
Besides the particle reduction equipment several other factors influences to the investment
cost. In this study, estimates for foundation and project management costs are included in the
investment cost, but the costs of integration of automation and flue gas ducts and other
connections are not included to the investment cost estimate.

Report
12 (18)
13 June 2014
© ÅF-Consult Ltd 2014
Investment costs, which are included to the investment cost estimate, are
- Equipment (55 000 – 1 000 000 EUR)
o ESP (72 000 - 790 000 EUR)
o Fabric filter (55 000 - 610 000 EUR)
o Scrubber with heat recovery (88 000 - 1 000 000 EUR)
- foundations (50 000 - 100 000 EUR),
- project management and other costs (70 000 - 100 000 EUR).
Additional highly site specific investment costs, which are difficult to estimate in general and
therefore not included in the investment cost estimate, comes from
- integration of automation to existing system,
- a new ID fan (if the pressure drop increases significantly),
- flue gas ducts (especially, if there is no space near the current particle reduction system)
(20 000 - 200 000 EUR), and
- demolition work for the old system.
However, it should be noted that in some cases these costs might have an important role.
Especially in cases, where there is limited space for the equipment at the site. The site specific
costs can double the investment cost of the particle reduction system.
5.2.3 Investment Cost Estimates
The investment options and the costs are presented in the following table. The estimates are
indicative and for information only. It is assumed that the existing particle reduction system is
cyclone/multicyclone. The new investment would be placed after the existing system.

Report
13 (18)
13 June 2014
© ÅF-Consult Ltd 2014
Table 5.2. Investment costs (the site specific costs are not included)
Plant size New system Equipment, foundations and
project and other costs*
1-2 MWfuel ESP (two fields) /
fabric filter /
scrubber (heat recovery)
190 000 - 250 000 /
170 000 - 220 000 /
200 000 - 260 000
2-5 MWfuel ESP (two fields) /
fabric filter /
scrubber (heat recovery)
250 000 - 400 000 /
220 000 - 340 000 /
260 000 - 470 000
5-10 MWfuel ESP (two fields) /
fabric filter /
scrubber (heat recovery)
400 000 - 610 000 /
340 000 - 510 000 /
470 000 - 650 000
10-20 MWfuel ESP (two fields) /
fabric filter /
scrubber (heat recovery)
610 000 - 990 000 /
510 000 - 810 000 /
650 000 – 1 170 000
*Excluding the site specific costs such as flue gas ducts. These costs can be 5-100 % of the
equipment investment cost.
5.3 OPERATION AND MAINTENANCE COSTS
Operation and maintenance cost (O&M costs) for different particle reduction systems are
presented in the following table. The estimates are indicative and for information only.
The operating cost include the consumption of electricity and other consumables, increased
electricity consumption in flue gas fan due to the increased pressure loss. The main factors
that influences on the operating and maintenance costs are electricity consumption for ESP,
frequency of bag changes for fabric filter, and amount of waste water for scrubber.
Table 5.3. O&M Costs
Particle reduction O&M cost
ESP 0,1 EUR/MWhfuel
Fabric Filter 0,4 EUR/MWhfuel
Scrubber 2 EUR/MWhfuel *
* Based on the assumption that the waste water treatment cost is 4 EUR/t.

Report
14 (18)
13 June 2014
© ÅF-Consult Ltd 2014
5.3.1 Operating Income – Low Temperature Heat From Scrubber
Scrubber can also work as a flue gas condenser and heat recovery system. If there is use for
low temperature heat at the site, the flue gas condenser can be a profitable investment
because of the value of the heat recovered.
In this report, the value of the heat is assumed to be 20 EUR/MWh based on decreased usage
of wood chips (Price of Forest energy: 19.73 EUR/MWh, 13.5.2014 / FOEX).
The heat available from the scrubber is calculated for flue gas moisture 28 v-% at inlet, and
flue gas temperature 55 °C at outlet. It is assumed that all the heat recovered can be used.
5.4 SENSITIVITY ANALYSIS
The sensitivity of the cost of particle reduction to the operation hours, to the boiler size, and
to the emission level are presented in this chapter. An example of the particle reduction costs
calculations for a 10 MWfuel plant is presented in the appendix 1. The interest rate used is 5 %
and the calculation period 10 years. Site specific costs are excluded from the investment cost
estimate. If these costs are 50 % of the equipment investment cost it can increase the cost of
particle reduction by 20-40 %, and even more in the case of the heat recovery scrubber.
5.4.1 Boiler Size
The sensitivity of the cost of particle reduction in relation to the boiler size is presented in the
following figure. As can be seen from figure, the cost of particle emission reduction per ton of
particles reduced is significantly more for smaller boilers than for the boilers larger than 10
MWfuel.
The emission reduction cost for the heat recovery scrubber is negative, which indicates that
the income from heat is more than the total costs. The economy of heat recovery scrubber
depends on many factors. From particle reduction point of view, it should be noticed that the
emission level of ~50 mg/Nm³ might be possible to achieve with a technology that can be
feasible investment in some cases from the heat production point of view.

Report
15 (18)
13 June 2014
© ÅF-Consult Ltd 2014
Figure 5.1. Sensitivity of the Costs to Boiler Size (site specific costs are excluded from the
investment cost estimate) (Lower end of the costs range presented in the table 5.2 is used for the
lower end in the size range, and the higher cost for the larger size in the range.)
5.4.2 Operating Hours
The sensitivity of the cost of particle reduction in relation to the operation hours of the boiler
is presented in the following figure. As can be seen from figure, the cost of particle emission
reduction increases rapidly from under 10 000 EUR/t to over 50 000 EUR/t when the operating
hours of the boiler decreases.
Figure 5.2. Sensitivity of the Costs to Operation Hours (site specific costs are excluded from the
investment cost estimate)
-10 000
-5 000
0
5 000
10 000
15 000
20 000
25 000
1 2 3 4 5 6 7 8 9 10 11 12 13 14 15 16 17 18 19 20
Co
ts o
f p
arti
cle
emis
sio
n r
edu
ctio
n (
EUR
/t)
Boiler size (MWfuel)
ESP Fabric filter Scrubber Scrubber (heat recovery)
Operating hours 5000 h/a Emission level before the new investment 200 mg/Nm3
-20 000
-10 000
0
10 000
20 000
30 000
40 000
50 000
60 000
70 000
80 000
0 1000 2000 3000 4000 5000 6000 7000 8000
Co
ts o
f p
arti
cle
emis
sio
n r
edu
ctio
n (
EUR
/t)
Operating hours (h/a)
ESP Fabric filter Scrubber Scrubber (heat recovery)
Boiler size 10 MWfuel
Emission level before the new investment 200 mg/Nm3

Report
16 (18)
13 June 2014
© ÅF-Consult Ltd 2014
5.4.3 Investment Cost
As mentioned in the previous chapter the site specific costs can be high. In the following
figure the investment of the site specific cost is added to the investment cost estimate. The
amount of the site specific costs is specified as a percentage of the equipment investment
cost.
Figure 5.3. Sensitivity of the Reduction Costs to Investment Costs (site specific costs included)
5.4.4 Emission Level
The investment cost of an ESP is less if the required emission level can be achieved with one
field ESP. As discussed in the investment costs chapter, the investment cost can be roughly 30
% less for ESP with one field compared to the ESP with two fields. If it is assumed that the
emission level 50 mg/Nm³ can be achieved with ESP with one field, the reduction in the cost
of particle emission reduction would be 17-20 % in EUR/t.
5.5 COMPARISON TO OTHER PARTICLE EMISSION REDUCTION COST EFFECT STUDIES
In this chapter the results from this study are compared to the results from the following
studies:
- Amec: Amec Environment & Infrastructure UK Ltd.; February 2014; Analysis of the impacts
of various options to control emission from the combustion of fuels in installations with a total
rated thermal input below 50 MW
- Nussbaumer: Nussbaumer, Thomas; June 2010; Overview on Technologies for Biomass
Combustion and Emission Levels of Particulate Matter
-10 000
-5 000
0
5 000
10 000
15 000
20 000
0 50 100 150 200 250 300 350 400 450 500
Co
ts o
f p
arti
cle
emis
sio
n r
edu
ctio
n (
EUR
/t)
Additional Site Specific Costs (flue gas ducts , demolition etc.) (kEUR)
ESP Fabric filter Scrubber Scrubber (heat recovery)
Boiler size 10 MWfuel Operation hours 5000 h/aEmission level before the new investment 200 mg/Nm3

Report
17 (18)
13 June 2014
© ÅF-Consult Ltd 2014
5.5.1 Amec Study
In the Amec study, the cost for fabric filter and cyclone are estimated. It was also indicated
that the emission level below 45 mg/Nm³ cannot be achieved with cyclone. The total annual
costs for fabric filter in the Amec study are presented in the following table. The interest rate
used is 4 % and the calculation period 10 year. The operating hours related to the costs in the
previous table were not clearly mentioned in the study. It is here assumed that the operating
hours given on the page 22 in the Amec study, are also applicable for the costs mentioned in
the appendix 1.
Table 5.5. Total Annual Costs in Amec Study
Case Total Annual Costs
(Amec, 2014, Appendix 1)
Operating hours
(Amec, 2014, p.22)
1-5 MWth LOW 2 768 EUR/a 1847 h/a
1-5 MWth HIGH 6 617 EUR/a
5-20 MWth LOW 13 838 EUR/a 2945 h/a
5-20 MWth HIGH 30 077 EUR/a
The inlet particle emissions were 300 mg/Nm³ for size 1-5 MWth, and 250 mg/Nm³ for size 5-
20 MWth. However, in the following comparison the amount of reduced particle emission is
calculated from the same assumption as in this study 200 mg/Nm³.
In the following figures the results from Amec study are compared to the results in this study.
The flue gas amount was estimated for the Amec study.
Figure 5.3. Boiler size Figure 5.4. Operating hours
As can be seen from the figures, the assumption of the operating hours used in Amec study
might be incorrect. Despite of this inconsistence, it can be conducted from the figures that the
0
10 000
20 000
30 000
40 000
50 000
60 000
1 4 7 10 13 16 19
Co
st o
f p
arti
cle
emis
sio
n r
edu
ctio
n (
EUR
/t)
Boiler size (MWfuel)
Fabric filter (Amec HIGH)Fabric filter (Amec LOW)Fabric filter (this study)
02 5005 0007 500
10 00012 50015 00017 50020 00022 50025 00027 50030 00032 50035 00037 500
1000 3000 5000 7000
Co
st o
f p
arti
cle
emis
sio
n r
edu
ctio
n (
EUR
/t)
Operating hours (h/a)
Fabric filter (Amec HIGH)Fabric filter (Amec LOW)Fabric filter (this study)
Report
18 (18)
13 June 2014
© ÅF-Consult Ltd 2014
cost estimates in this study are in the high end of the Amec study. The difference is significant,
especially with low operating hours and small boilers.
The Amec study has used the same literature sources for the cost estimates, as used in this
study. The cost division is not show in the study. Thus, it cannot be indicated whether the
difference is in operating cost or in investment cost.
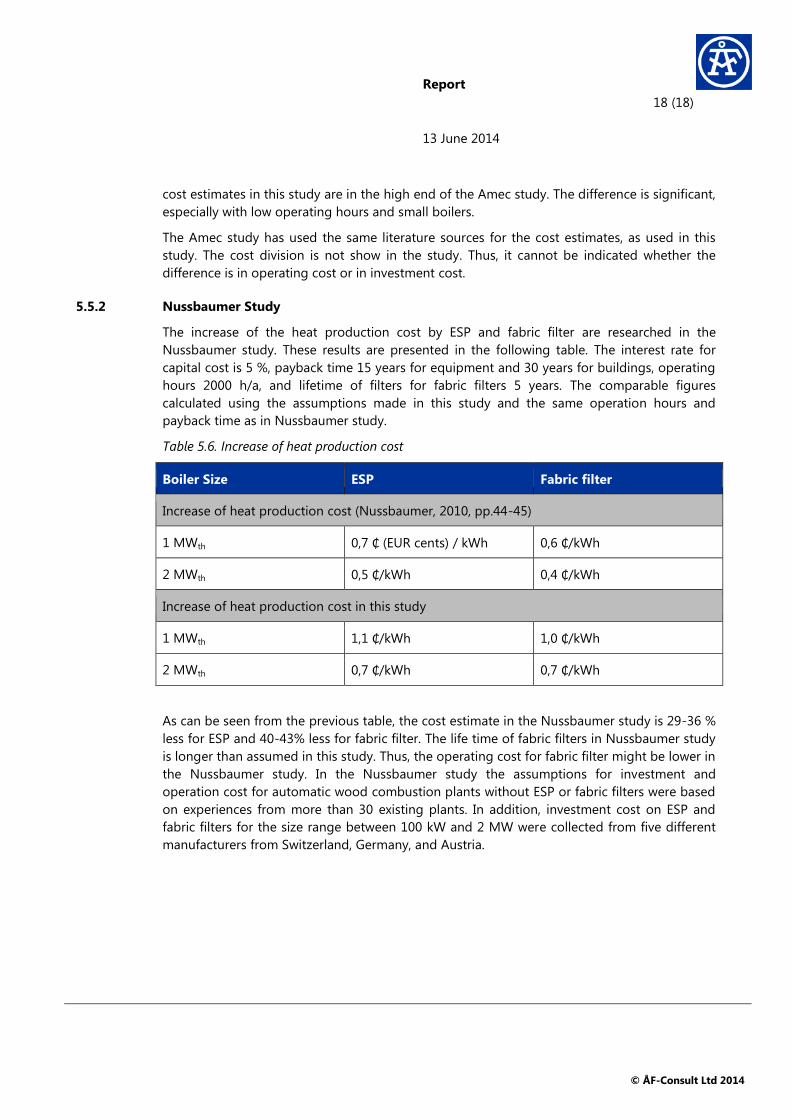
5.5.2 Nussbaumer Study
The increase of the heat production cost by ESP and fabric filter are researched in the
Nussbaumer study. These results are presented in the following table. The interest rate for
capital cost is 5 %, payback time 15 years for equipment and 30 years for buildings, operating
hours 2000 h/a, and lifetime of filters for fabric filters 5 years. The comparable figures
calculated using the assumptions made in this study and the same operation hours and
payback time as in Nussbaumer study.
Table 5.6. Increase of heat production cost
Boiler Size ESP Fabric filter
Increase of heat production cost (Nussbaumer, 2010, pp.44-45)
1 MWth 0,7 ₵ (EUR cents) / kWh 0,6 ₵/kWh
2 MWth 0,5 ₵/kWh 0,4 ₵/kWh
Increase of heat production cost in this study
1 MWth 1,1 ₵/kWh 1,0 ₵/kWh
2 MWth 0,7 ₵/kWh 0,7 ₵/kWh
As can be seen from the previous table, the cost estimate in the Nussbaumer study is 29-36 %
less for ESP and 40-43% less for fabric filter. The life time of fabric filters in Nussbaumer study
is longer than assumed in this study. Thus, the operating cost for fabric filter might be lower in
the Nussbaumer study. In the Nussbaumer study the assumptions for investment and
operation cost for automatic wood combustion plants without ESP or fabric filters were based
on experiences from more than 30 existing plants. In addition, investment cost on ESP and
fabric filters for the size range between 100 kW and 2 MW were collected from five different
manufacturers from Switzerland, Germany, and Austria.

Particle Emission Reduction Appendix 1
Cost Analysis for Existing 1-20 MWfuel Solid Biofuel Plants
in Finland 1 (1)
13 June 2014
ÅF-Consult Ltd Bertel Jungin aukio 9, FI-02600, Finland Phone +358 (0)40 348 5511. Fax +358 (0)9 3487 0810. www.afconsult.com.
VAT no. FI1800189-6. Registered office Helsinki.
APPENDIX 1: CHP-PLANTS AND STATIONARY HEATING PLANTS IN FINLAND AND
FUEL MIX IN DISTRICT HEATING
CHP-plants and stationary heating plants in Finland Fuel mix in district heating in Finland

Particle Emission Reduction Appendix 2
Cost Analysis for Existing 1-20 MWfuel Solid Biofuel Plants in
Finland 1 (1)
13 June 2014
ÅF-Consult Ltd Bertel Jungin aukio 9, FI-02600, Finland Phone +358 (0)40 348 5511. Fax +358 (0)9 3487 0810. www.afconsult.com.
VAT no. FI1800189-6. Registered office Helsinki.
APPENDIX 2: AN EXAMPLE OF THE CALCULATION OF THE COST OF PARTICLE
EMISSION REDUCTION IN A 10 MWFUEL PLANT
The summary of the costs for particle emission reductions indicated in the report are
presented in the following table for a 10 MWfuel plant. The emission level before the
investment is 200 mg/Nm³. For this case, as can be seen from the table, the lowest cost for
particle emission reductions is for ESP. The particle emission reduction costs increases the
heat production cost by 2 EUR/MWh, which can be 10 % of the total heat production costs.
Cost of the particle emission reduction
Assumptions
Calculation period 10 a
Interest rate 5 %
Boiler size 10 MWfuel
Operation hours 5000 h/a
Particle emission before the new investment (dry, 6 % O2) 200 mg/Nm³
Amount of flue gases (dry, 6 % O2) 14 400 Nm³/h
Technology ESP Fabric
filter Scrubber
Scrubber (heat
recovery)
Investment cost
612 000 508 000 555 000 716 000 EUR
79 000 66 000 72 000 93 000 EUR/a
O&M costs 5 000 20 000 30 000 50 000 EUR/a
Income from low
temperature heat 0 0 0 203 000 EUR/a
Cost of particle emission
reduction 84 000 86 000 102 000 -60 000 EUR/a
Particle emissions 30 30 50 50 mg/Nm³
Particle emission reduced
170 170 150 150 mg/Nm³
12,2 12,2 10,8 10,8 t/a
Cost of particle emission
reduction 6 900 7 000 9 400 -5 600 EUR/t
Effect to the cost of heat
produced (boiler efficiency
0,85)
2,0 2,0 2,4 -1,4 EUR/MWhth