particle swarm optimization: method and...
TRANSCRIPT
1© Rania Hassan 3/2004
Engineering Systems Division - Massachusetts Institute of Technology
Rania HassanRania HassanPostPost--doctoral Associatedoctoral Associate
Engineering Systems DivisionEngineering Systems Division
Particle Swarm Optimization:Method and Applications
Particle Swarm Optimization:Particle Swarm Optimization:Method and ApplicationsMethod and Applications

2© Rania Hassan 3/2004
Engineering Systems Division - Massachusetts Institute of Technology
Particle Swarm OptimizationParticle Swarm OptimizationA pseudo-optimization method (heuristic) inspired by the collective intelligence of swarms of biological populations.
Flocks of Birds Colonies of Insects

3© Rania Hassan 3/2004
Engineering Systems Division - Massachusetts Institute of Technology
Particle Swarm OptimizationParticle Swarm OptimizationA pseudo-optimization method (heuristic) inspired by the collective intelligence of swarms of biological populations.
Schools of Fish Herds of Animals

4© Rania Hassan 3/2004
Engineering Systems Division - Massachusetts Institute of Technology
InventorsInventors
James KennedySocial Psychologist
US Department of Labor
Russell EberhartDean of Engineering Research
Indiana Univ. Purdue Univ. Indianapolis
Introduced in 1995: Kennedy, J. and Eberhart, R., “Particle Swarm Optimization,” Proceedings of the IEEE International Conference on Neural Networks, Perth, Australia 1995, pp. 1942-1945.

5© Rania Hassan 3/2004
Engineering Systems Division - Massachusetts Institute of Technology
Swarming in System DesignSwarming in System Design
• Swarming theory has been used in system design. Examples of aerospace systems utilizing swarming theory include formation flying of aircraft and spacecraft.
Flocks of birds fly in V-shaped formations to reduce drag and save energy on long migrations.

6© Rania Hassan 3/2004
Engineering Systems Division - Massachusetts Institute of Technology
Swarming in System DesignSwarming in System Design
A study of great white pelicans has found that birds flying in formation use up to a fifth less energy than
those flying solo (Weimerskirch et al.).
Weimerskirch, H. et al. "Energy saving in flight formation." Nature 413, (18 October 2001): 697 - 698.

7© Rania Hassan 3/2004
Engineering Systems Division - Massachusetts Institute of Technology
Swarming in System DesignSwarming in System Design• A space system in formation flying combines data from several
spacecraft rather than flying all the instruments on one costly satellite.
• It also allows for the collection of data unavailable from a single satellite, such as stereo views or simultaneously collecting data of the same ground scene at different angles.
Image taken from NASA's website. http://www.nasa.gov.

8© Rania Hassan 3/2004
Engineering Systems Division - Massachusetts Institute of Technology
Lecture OverviewLecture Overview
• Introduction• Motivation• PSO Conceptual Development• PSO Algorithm
– Basic Algorithm– Constraint Handling– Discretization
• Applications– PSO Demo– Benchmark test problems
• Unconstrained• Constrained
– System Problem: Spacecraft Design
• Final Comments on PSO• References

9© Rania Hassan 3/2004
Engineering Systems Division - Massachusetts Institute of Technology
““Personal” MotivationPersonal” MotivationPSO
– is a zero-order, non-calculus-based method (no gradients are needed).– can solve discontinuous, mutlimodal, non-convex problems.– includes some probabilistic features in the motion of particles.– is a population-based search method, i.e. it moves from a set of points
(particles’ positions) to another set of points with likely improvement in one iteration (move). [is that good or bad ??]
Does it remind you of another heuristic?
The Genetic Algorithm (GA)– The GA is inherently discrete (in terms of handling design variables)– PSO is inherently continuous (in terms of handling design variables)
– Some researchers report that PSO requires less function evaluations than the GA (most problems studied are continuous).
– In Compindex: there are 18150 hits for the GA from 1990 to 2004,whereas there are only 105 hits for PSO - many version of PSO are likely to appear.

10© Rania Hassan 3/2004
Engineering Systems Division - Massachusetts Institute of Technology
PSO Conceptual DevelopmentPSO Conceptual Development
• Social Behavior Simulation Optimizer
• The social model was intended to answer the following questions:
– How do large numbers of birds (or other populations exhibiting swarming behavior) produce seamless, graceful flocking choreography, while often, but suddenly changing direction, scattering and regrouping?
– Are there any advantages to the swarming behavior for an individual in a swarm?
– Do humans exhibit social interaction similar to the swarming behavior in other species?
• Keep these questions in mind while watching clips from the French documentary “Winged Migration” by Jacques Perrin.

11© Rania Hassan 3/2004
Engineering Systems Division - Massachusetts Institute of Technology
PSO Conceptual DevelopmentPSO Conceptual Development
• How do large numbers of birds produce seamless, graceful flocking choreography, while often, but suddenly changing direction, scattering and regrouping?
– “Decentralized” local processes.– Manipulation of inter-individual distances (keep pace and avoid collision).
• Are there any advantages to the swarming behavior for an individual in a swarm?
– Can profit from the discoveries and previous experience of other swarm members in search for food, avoiding predators, adjusting to the environment, i.e. information sharing yields evolutionary advantage.
• Do humans exhibit social interaction similar to the swarming behavior in other species?
– Absolutely, humans learn to imitate physical motion early on; as they grow older, they imitate their peers on a more abstract level by adjusting their beliefs and attitudes to conform with societal standards.
12© Rania Hassan 3/2004
Engineering Systems Division - Massachusetts Institute of Technology
PSO Conceptual DevelopmentPSO Conceptual Development
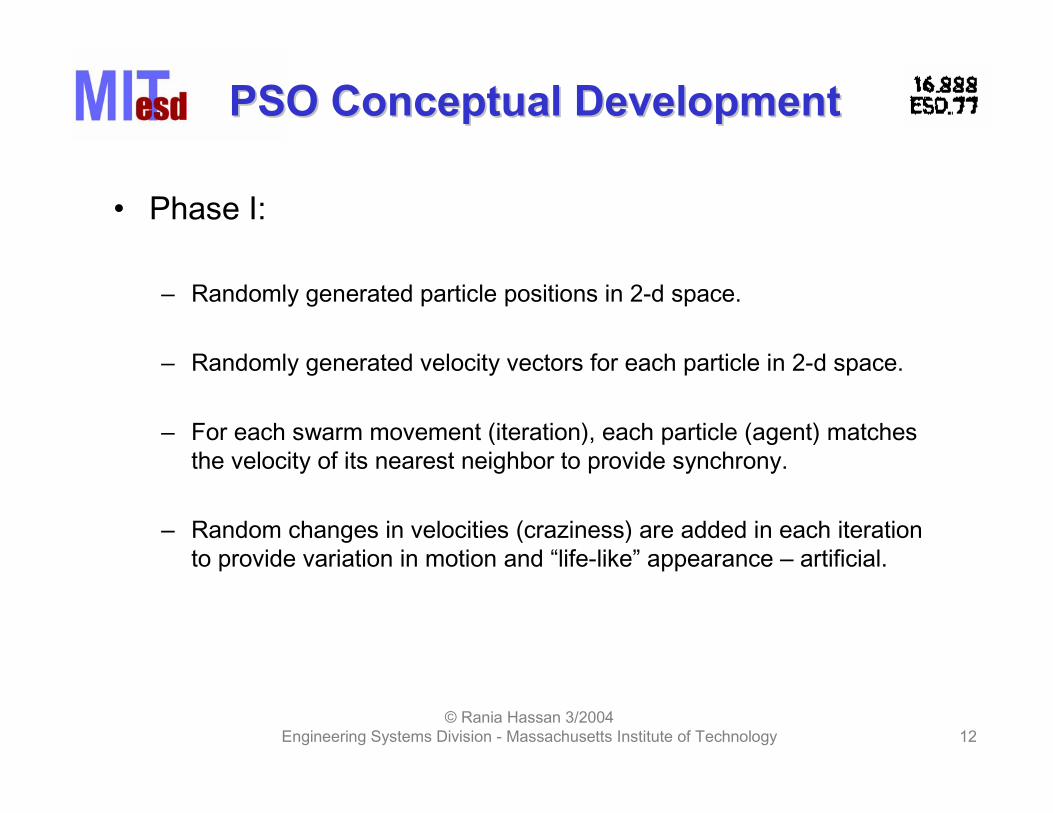
• Phase I:
– Randomly generated particle positions in 2-d space.
– Randomly generated velocity vectors for each particle in 2-d space.
– For each swarm movement (iteration), each particle (agent) matches the velocity of its nearest neighbor to provide synchrony.
– Random changes in velocities (craziness) are added in each iteration to provide variation in motion and “life-like” appearance – artificial.

13© Rania Hassan 3/2004
Engineering Systems Division - Massachusetts Institute of Technology
PSO Conceptual DevelopmentPSO Conceptual Development
• Phase II:– Heppner’s simulation used a roost (cornfield), that the birds
flocked around before landing there – eliminating the need for “craziness “.
– The mathematical formulation for the roosting model included:
• each particle evaluates its current fitness by comparing its position to the roost position (100, 100).
• each particle remembers its best ever fitness value, , and theposition associated with it, , and adjusts its velocity accordingly.
( ) ( )−+−= ik
ik
ik yxfkth time unit
ith particle
ifiii yxp =
randcVxVxxx
randcVxVxxxik
ik
iik
ik
ik
iik
+=∴<
−=∴>
+
+ Uniformly distributed random number
update the velocity in the y-direction in the same manner
14© Rania Hassan 3/2004
Engineering Systems Division - Massachusetts Institute of Technology
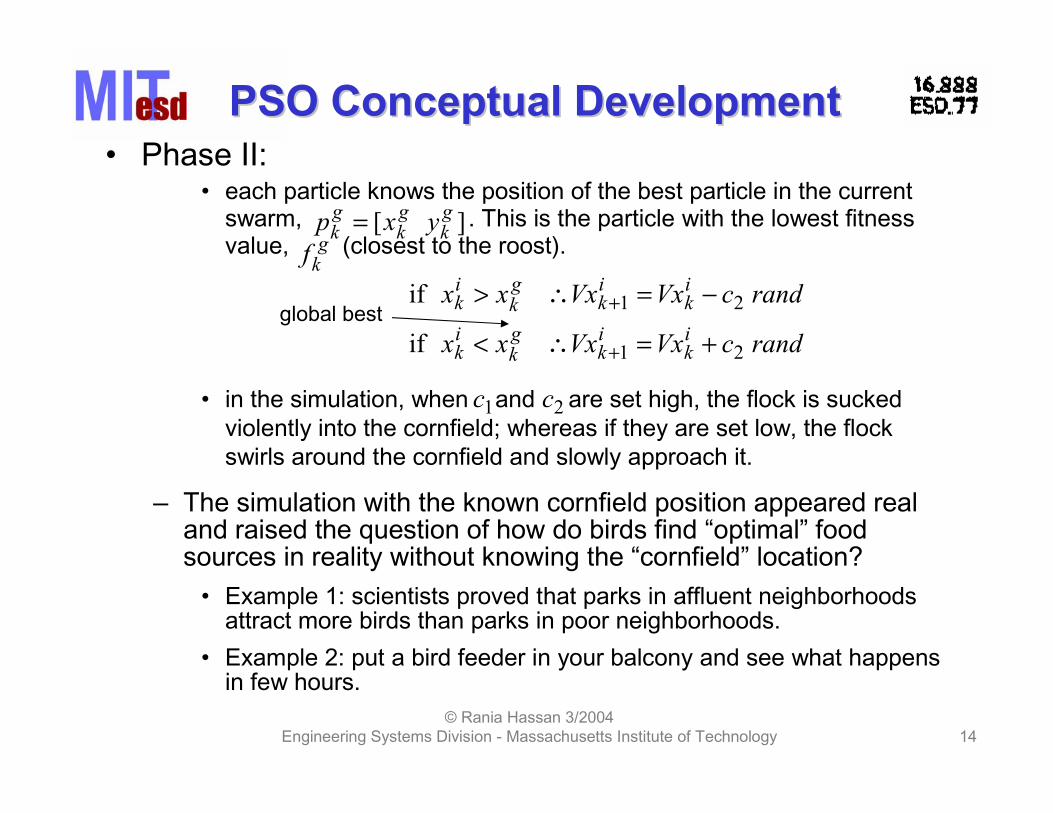
PSO Conceptual DevelopmentPSO Conceptual Development• Phase II:
• each particle knows the position of the best particle in the current swarm, . This is the particle with the lowest fitness value, (closest to the roost).
• in the simulation, when and are set high, the flock is sucked violently into the cornfield; whereas if they are set low, the flock swirls around the cornfield and slowly approach it.
– The simulation with the known cornfield position appeared real and raised the question of how do birds find “optimal” food sources in reality without knowing the “cornfield” location?
• Example 1: scientists proved that parks in affluent neighborhoods attract more birds than parks in poor neighborhoods.
• Example 2: put a bird feeder in your balcony and see what happens in few hours.
global best
gkf
gk
gk
gk yxp =
randcVxVxxx
randcVxVxxx
ik
ik
gk
ik
ik
ik
gk
ik
+=∴<
−=∴>
+
+
c c

15© Rania Hassan 3/2004
Engineering Systems Division - Massachusetts Institute of Technology
PSO AlgorithmPSO Algorithm

16© Rania Hassan 3/2004
Engineering Systems Division - Massachusetts Institute of Technology
Basic PSO AlgorithmBasic PSO Algorithm
• Phase III
– The swarming behavior of the birds could be the reason for finding optimal food resources.
– The model developed in Phase II could be used (with minor modifications) to find optimal solutions for N-dimensional, non-convex, multi-modal, nonlinear functions.
– In this current basic version of PSO, craziness and velocity matching are eliminated.
Algorithm Description
• Particle Description: each particle has three features
– Position (this is the ith particle at time k, notice vector notation) – Velocity (similar to search direction, used to update the position)– Fitness or objective (determines which particle has the best value in
the swarm and also determines the best position of each particle over time.
ikxikv
( )ikf x

17© Rania Hassan 3/2004
Engineering Systems Division - Massachusetts Institute of Technology
Basic PSO AlgorithmBasic PSO Algorithm
• Initial Swarm– No well established guidelines for swarm size, normally 15 to 30.– particles are randomly distributed across the design space.
where and are vectors of lower and upper limit values respectively.
– Evaluate the fitness of each particle and store:• particle best ever position (particle memory here is same as )• Best position in current swarm (influence of swarm )
– Initial velocity is randomly generated.
( )xxxx −+= randi
x x
( ) =−+=t
randi xxxv
ixipgp

18© Rania Hassan 3/2004
Engineering Systems Division - Massachusetts Institute of Technology
Basic PSO AlgorithmBasic PSO Algorithm
• Velocity Update– provides search directions– Includes deterministic and probabilistic parameters.– Combines effect of current motion, particle own memory,
and swarm influence.
( )t
randct
randcw
ik
gk
ik
iik
ik ∆
−+
∆
−+=+
xpxpvv
New velocity
current motion particle memory influence
swarm influence
inertia factor
0.4 to 1.4
self confidence
1.5 to 2
self confidence
2 to 2.5

19© Rania Hassan 3/2004
Engineering Systems Division - Massachusetts Institute of Technology
Basic PSO AlgorithmBasic PSO Algorithm
• Position Update– Position is updated by velocity vector.
• Stopping Criteria– Maximum change in best fitness smaller than specified
tolerance for a specified number of moves (S).
tik
ik
ik ∆+= ++ vxx
ik
x ik
v
gk
pip
ik
x +
( ) ( ) ,..S,qff gqk
gk =≤− − εpp

20© Rania Hassan 3/2004
Engineering Systems Division - Massachusetts Institute of Technology
Constraint HandlingConstraint Handling
• Side Constraints– Velocity vectors can drive particles to “explosion”.– Upper and lower variable limits can be treated as regular constraints.– Particles with violated side constraints could be reset to the nearest
limit.
• Functional Constraints– Exterior penalty methods (linear, step linear, or quadratic).
– If a particle is infeasible, last search direction (velocity) was not feasible. Set current velocity to zero.
( ) ( ) [ ]( )+==
conN
iii ,grf xx φ
fitness function
objective function penalty function
penalty multipliers
( )t
randct
randc
ik
gk
ik
iik ∆
−+
∆
−=+
xpxpv

21© Rania Hassan 3/2004
Engineering Systems Division - Massachusetts Institute of Technology
DiscretizationDiscretization
• System problems typically include continuous, integer, and discrete design variables.
• Basic PSO works with continuous variables.
• There are several methods that allows PSO to handle discrete variables.
• The literature reports that the simple method of rounding particle position coordinates to the nearest integers provide the best computational performance.

22© Rania Hassan 3/2004
Engineering Systems Division - Massachusetts Institute of Technology
ApplicationsApplications

23© Rania Hassan 3/2004
Engineering Systems Division - Massachusetts Institute of Technology
PSO DemoPSO Demo
• Demo provided by Gerhard Venter of Vanderplatts R&D.• Smooth function with three local minima and a known global
minimum of [0,0] and an optimal function value of 0.
Courtesy of Gerhard Venter. Used with permission.

24© Rania Hassan 3/2004
Engineering Systems Division - Massachusetts Institute of Technology
PSO DemoPSO Demo
• Demo provided by Gerhard Venter of Vanderplatts R&D.• Noisy function with many local minima and a known global
minimum of [0,0] and an optimal function value of 1000.
Courtesy of Gerhard Venter. Used with permission.

25© Rania Hassan 3/2004
Engineering Systems Division - Massachusetts Institute of Technology
Unconstrained Benchmark ProblemsUnconstrained Benchmark ProblemsEggcrate FunctionEggcrate Function
w
• Known global minimum of [0,0] and an optimal function value of 0.
• PSO parameters: – Swarm Size = 30– Inertia, = 0.5 (static)– Self Confidence, = 1.5– Swarm Confidence, = 1.5– Stopping Tolerance, = 0.001
( ) ( )xxxxf +++=xMinimize
ccε

26© Rania Hassan 3/2004
Engineering Systems Division - Massachusetts Institute of Technology
Unconstrained Benchmark ProblemsUnconstrained Benchmark ProblemsEggcrate FunctionEggcrate Function
-6 -4 -2 0 2 4 6-8
-6
-4
-2
0
2
4
6Results for move0
x1
x2
-8 -6 -4 -2 0 2 4 6 8 10-2.5
-2
-1.5
-1
-0.5
0
0.5
1
1.5
2
2.5Results for move5
x1
x2
-5 -4 -3 -2 -1 0 1 2 3 4-2.5
-2
-1.5
-1
-0.5
0
0.5
1
1.5
2
2.5Results for move10
x1
x2
-6 -5 -4 -3 -2 -1 0 1 2-0.4
-0.2
0
0.2
0.4
0.6
0.8
1Results for move28
x1
x2
Statistics
Min = 15.1
Mean = 49.9
Max = 92.6
Statistics
Min = 0.3E-5
Mean = 4.69
Max = 41.9
Statistics
Min = 0.25
Mean = 26.5
Max = 86.6
Statistics
Min = 0.02
Mean = 13.6
Max = 66.5

27© Rania Hassan 3/2004
Engineering Systems Division - Massachusetts Institute of Technology
Unconstrained Benchmark ProblemsUnconstrained Benchmark ProblemsBanana (Rosenbrock) FunctionBanana (Rosenbrock) Function
w
• Known global minimum of [1,1] and an optimal function value of 0.
• PSO parameters: – Swarm Size = 30– Inertia, = 0.5 (static)– Self Confidence, = 1.5– Swarm Confidence, = 1.5– Stopping Tolerance, = 0.001
Minimize
ccε
( ) ( ) ( )xxxf −+−=x

28© Rania Hassan 3/2004
Engineering Systems Division - Massachusetts Institute of Technology
Unconstrained Benchmark ProblemsUnconstrained Benchmark ProblemsBanana (Rosenbrock) FunctionBanana (Rosenbrock) Function
-5 0 5-5
-4
-3
-2
-1
0
1
2
3
4
5Results for move0
x1
x2
-4 -2 0 2 4 6-2
-1
0
1
2
3
4Results for move5
x1
x2
-4 -2 0 2 4 6 8 10-0.2
0
0.2
0.4
0.6
0.8
1
1.2Results for move25
x1
x2
-5 -4 -3 -2 -1 0 1 2 3 40
0.2
0.4
0.6
0.8
1
1.2
1.4
1.6Results for move53
x1
x2
Statistics
Min = 1.03
Mean = 1.4E4
Max = 5.3E4
Statistics
Min = 0.6E-3
Mean = 1.3E3
Max = 2.7E4
Statistics
Min = 0.26
Mean = 5.8E3
Max = 6.9E4
Statistics
Min = 0.36
Mean = 2.6E4
Max = 7.2E5

29© Rania Hassan 3/2004
Engineering Systems Division - Massachusetts Institute of Technology
Constrained Benchmark ProblemsConstrained Benchmark ProblemsGolinski Speed ReducerGolinski Speed Reducer
w
• Full problem description can be found at http://mdob.larc.nasa.gov/mdo.test/class2prob4.html
• This problem represents the design of a simple gear box such as might be used in a light airplane between the engine and propeller to allow each to rotate at its most efficient speed.
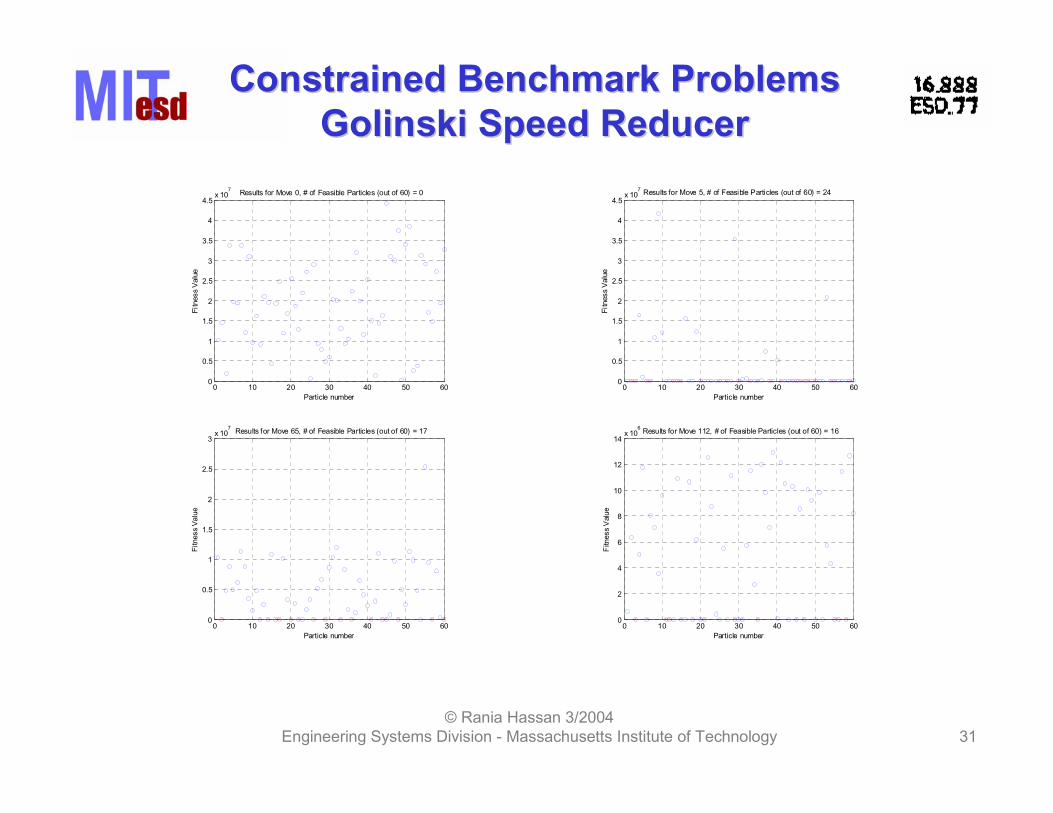
• The objective is to minimize the speed reducer weight while satisfying a number of constraints (11) imposed by gear and shaft design practices.
• Seven design variables are available to the optimizer, and each has an upper and lower limit imposed.
• PSO parameters: – Swarm Size = 60– Inertia, = 0.5 (static)– Self Confidence, = 1.5– Swarm Confidence, = 1.5– Stopping Tolerance, = 5 kg
ccε
Image taken from NASA's website. http://www.nasa.gov.

30© Rania Hassan 3/2004
Engineering Systems Division - Massachusetts Institute of Technology
Constrained Benchmark ProblemsConstrained Benchmark ProblemsGolinski Speed ReducerGolinski Speed Reducer
0 20 40 60 80 100 1200
0.5
1
1.5
2
2.5
3
3.5
4
4.5
5x 10
7 PSO Statistics
Move
Min
, M
ean,
and
Max
Fitn
ess
( )xf= [3.50 0.7 17 7.3 7.30 3.35 5.29]= 2985 kg
x• Known solution
• PSO solution
( )xf= [3.53 0.7 17 8.1 7.74 3.35 5.29]= 3019 kg
x
31© Rania Hassan 3/2004
Engineering Systems Division - Massachusetts Institute of Technology
Constrained Benchmark ProblemsConstrained Benchmark ProblemsGolinski Speed ReducerGolinski Speed Reducer
0 10 20 30 40 50 600
0.5
1
1.5
2
2.5
3
3.5
4
4.5x 10
7 Results for Move 0, # of Feasible Particles (out of 60) = 0
Particle number
Fitn
ess
Val
ue
0 10 20 30 40 50 600
0.5
1
1.5
2
2.5
3
3.5
4
4.5x 10
7 Results for Move 5, # of Feasible Particles (out of 60) = 24
Particle number
Fitn
ess
Val
ue
0 10 20 30 40 50 600
0.5
1
1.5
2
2.5
3x 10
7 Results for Move 65, # of Feasible Particles (out of 60) = 17
Particle number
Fitn
ess
Val
ue
0 10 20 30 40 50 600
2
4
6
8
10
12
14x 10
6 Results for Move 112, # of Feasible Particles (out of 60) = 16
Particle number
Fitn
ess
Val
ue
32© Rania Hassan 3/2004
Engineering Systems Division - Massachusetts Institute of Technology
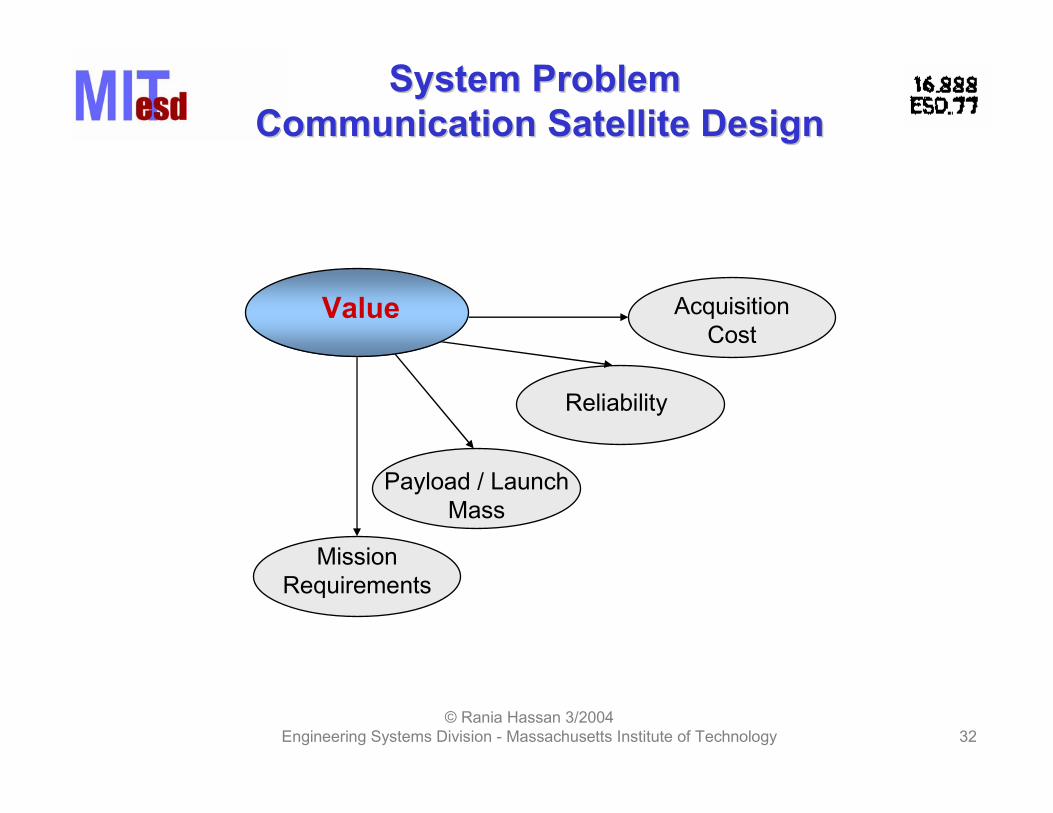
System ProblemSystem ProblemCommunication Satellite DesignCommunication Satellite Design
MissionRequirements
Acquisition Cost
Reliability
Payload / Launch Mass
Value

33© Rania Hassan 3/2004
Engineering Systems Division - Massachusetts Institute of Technology
System ProblemSystem ProblemCommunication Satellite DesignCommunication Satellite Design
Combinatorial Problem discreteintegercontinuous
OptimizationAlgorithm
Performance Estimation
Tools
Multidisciplinary Framework many design variablescomputationally-expensive disciplinary design tools
Use non-calculus based search methods like the Genetic Algorithm (GA)
Focus on the conceptual design stage (less variables, simpler models)
Challenges
Solutions

34© Rania Hassan 3/2004
Engineering Systems Division - Massachusetts Institute of Technology
System ProblemSystem ProblemCommunication Satellite DesignCommunication Satellite Design
Launch vehicle choice from 8 options14
E/W STK thruster technology (bi-propellant or hydrazine)13
N/S STK thruster technology (xenon plasma, arcjets, bi-propellant, and hydrazine monopropellant)
12
N/S thermal coupling (no coupling or coupling)11
Battery cell type (NiCd or NiH2)10
Solar array cell type (GaAs single junction, GaAs multi-junction, Si thin, Si normal, or hybrid Si with GaAs multi-junction)
9
HPA type (TWTA or SSPA)1 to 8
Description and discrete valuesDesign
parameter
Design VariablesThere are 27 design variables that can be combined into 2.2 trillion different designs.

35© Rania Hassan 3/2004
Engineering Systems Division - Massachusetts Institute of Technology
System ProblemSystem ProblemCommunication Satellite DesignCommunication Satellite Design
Design Variables continued …
Solar array area redundancy level (0, 1.02, 1.04 or 1.06 × Area redundancy level)
27
TCR subsystem redundancy level (0 or full redundancy)26
ADCS subsystem redundancy level (0 or full redundancy)25
Propulsion subsystem redundancy level (0 or full redundancy)24
Redundancy levels for last C-band transponder that has 2 operating HPAs (0 or 1 redundant HPA)
23
Redundancy levels for C-band transponders, each has 12 operating HPAs (0, 1, 2, or 4 redundant HPAs)
16 to 22
Redundancy level for Ku-band transponder that has 12 operating HPAs (0, 1, 2, or 4 redundant HPAs)
15
Description and discrete valuesDesign
parameter
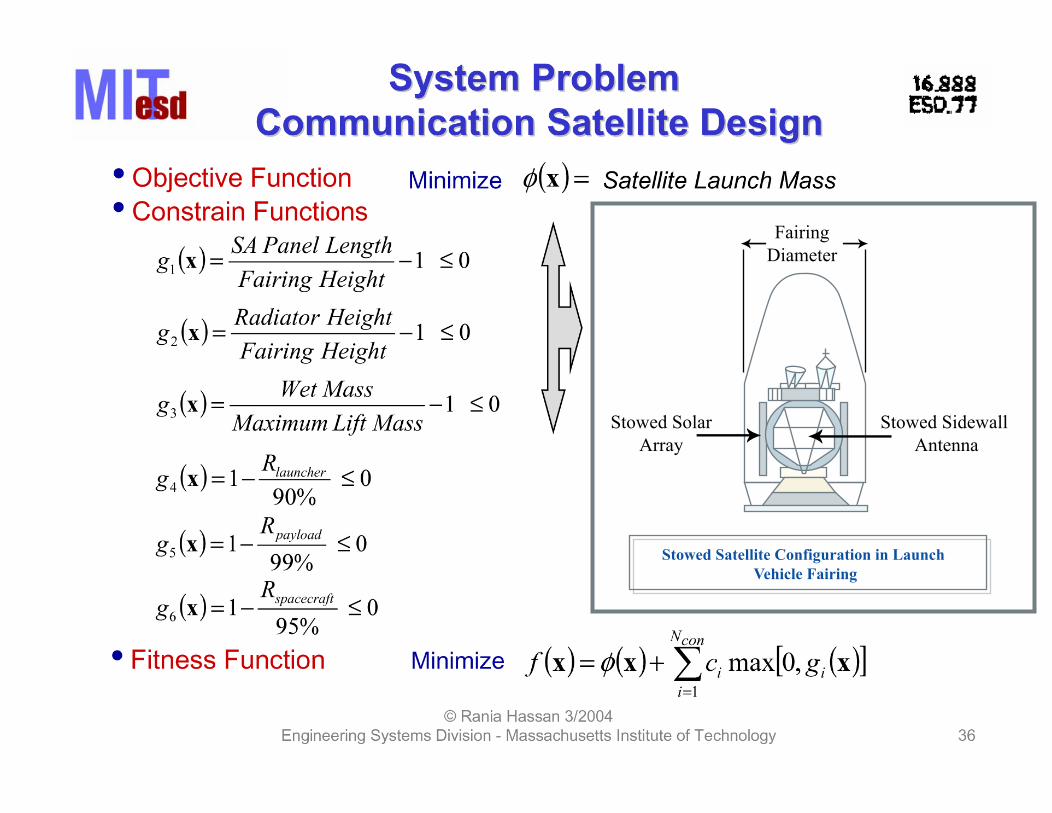
Stowed Sidewall Antenna
Stowed SolarArray
FairingDiameter
Stowed Satellite Configuration in Launch Vehicle Fairing

37© Rania Hassan 3/2004
Engineering Systems Division - Massachusetts Institute of Technology
System ProblemSystem ProblemCommunication Satellite DesignCommunication Satellite Design
w
• PSO parameters: – Swarm Size = 60– Inertia, = 0.5 (static)– Self Confidence, = 1.5– Swarm Confidence, = 1.5– Stopping Tolerance, = 5 kg
ccε
( )xf= [1 0 1 1 1 1 1 1 4 2 1 1 0 0 1 1 0 1 1 1 0 0 1 1 0 0 3]= 3443 kg
x• Known solution
• PSO solution
( )xf= [1 1 1 0 1 1 1 1 4 2 1 1 0 1 0 2 1 1 0 1 1 0 1 0 1 1 2]= 3461 kg
x

38© Rania Hassan 3/2004
Engineering Systems Division - Massachusetts Institute of Technology
System ProblemSystem ProblemCommunication Satellite DesignCommunication Satellite Design
0 10 20 30 40 50 600
2
4
6
8
10
12
14
16x 10
5 Results for Move 0, # of Feasible Particles (out of 60) = 0
Particle number
Fitn
ess
Val
ue
0 10 20 30 40 50 600
1
2
3
4
5
6
7
8
9x 10
5 Results for Move 5, # of Feasible Particles (out of 60) = 28
Particle number
Fitn
ess
Val
ue
0 10 20 30 40 50 600
2
4
6
8
10
12
14x 10
5 Results for Move 15, # of Feasible Particles (out of 60) = 50
Particle number
Fitn
ess
Val
ue
0 10 20 30 40 50 600.2
0.4
0.6
0.8
1
1.2
1.4
1.6
1.8x 10
4 Results for Move 33, # of Feasible Particles (out of 60) = 58
Particle number
Fitn
ess
Val
ue

39© Rania Hassan 3/2004
Engineering Systems Division - Massachusetts Institute of Technology
Final Comments on PSOFinal Comments on PSO
• This is a method “in the making” - many versions are likely to appear.
• Poor repeatability in terms of:– finding optimal solution– computational cost
• More robust constraint (side and functional) handling approaches are needed.
• Guidelines for selection of swarm size, inertia and confidence parameters are needed.

40© Rania Hassan 3/2004
Engineering Systems Division - Massachusetts Institute of Technology
ReferencesReferences
• Kennedy, J. and Eberhart, R., “Particle Swarm Optimization,” Proceedings of the IEEE International Conference on Neural Networks, Perth, Australia 1995, pp. 1942-1945.
• Venter, G. and Sobieski, J., “Particle Swarm Optimization,” AIAA 2002-1235, 43rd AIAA/ASME/ASCE/AHS/ASC Structures, Structural Dynamics, and Materials Conference, Denver, CO., April 2002.
• Kennedy, J. and Eberhart, R., Swarm Intelligence, Academic Press, 1st ed., San Diego, CA, 2001.