particulate emissions from biomass combustion
TRANSCRIPT
8/14/2019 Particulate emissions from biomass combustion
http://slidepdf.com/reader/full/particulate-emissions-from-biomass-combustion 1/40
Particulate Emissions from BiomassCombustion in IEA Countries
Survey on Measurements and Emission Factors
Thomas Nussbaumer1,2, Claudia Czasch1, Norbert Klippel1
Linda Johansson3, Claes Tullin3
1 Verenum, CH–8006 Switzerland, www.verenum.ch2 University of Applied Sciences Lucerne, CH–6048 Horw, www.hslu.ch3
SP Technical Research Institute of Sweden, SE–50115 Boras, www.sp.se
On behalf of
International Energy Agency (IEA) Bioenergy Task 32
Swiss Federal Office of Energy (SFOE)
Download www.ieabcc.nl or www.verenum.ch
Zürich, January 2008 ISBN 3-908705-18-5
8/14/2019 Particulate emissions from biomass combustion
http://slidepdf.com/reader/full/particulate-emissions-from-biomass-combustion 2/40
2
Content
1 Abstract ...................................................................................................................................................3 2 Introduction ............................................................................................................................................4 2.1 Motivation..............................................................................................................................................4 2.2 Objectives..............................................................................................................................................4 2.3 Work programme..................................................................................................................................4 3 Particulate matter in the ambient air..................................................................................................5 3.1 Characteristics of particulate matter (PM) ..........................................................................................5 3.2 Health relevance of PM........................................................................................................................6 3.3 Immission limit values for PM ..............................................................................................................8 4 Combustion particles............................................................................................................................9 4.1 Types of combustion particles .............................................................................................................9 4.2 Influence of particle sampling ............................................................................................................11 4.3 Measurement techniques...................................................................................................................13 5 Data basis .............................................................................................................................................17 5.1 Participating countries ........................................................................................................................17 5.2 Sources ...............................................................................................................................................18 5.3 Emission factors .................................................................................................................................18 6 Results on emission factors..............................................................................................................19 6.1 Open fireplaces...................................................................................................................................19 6.2 Closed inset appliances (closed fireplaces) .....................................................................................20 6.3 Wood stoves .......................................................................................................................................20 6.4 Log wood boilers.................................................................................................................................22 6.5 Pellet stoves and boilers ....................................................................................................................24 6.6 Overview on residential wood combustion .......................................................................................26 6.7 Influence of ignition method ...............................................................................................................27 6.8 Automatic biomass combustion plants..............................................................................................29 7 Comparison of particle measurements ...........................................................................................32 7.1 Particle sampling: Solid particles, condensables, dilution tunnel ....................................................32 7.2 Particle size measurements...............................................................................................................35 8 Conclusions..........................................................................................................................................37 9 References............................................................................................................................................39 9.1 Literature .............................................................................................................................................39 9.2 Sources of emission factors cited in figures .....................................................................................40
8/14/2019 Particulate emissions from biomass combustion
http://slidepdf.com/reader/full/particulate-emissions-from-biomass-combustion 3/40
3
1 Abstract
Biomass combustion, especially in small-scale applications, is related to high emissions of particulate
matter (PM) smaller than 10 microns (PM10). Since PM10 is regarded as a major indicator for the health
relevance of ambient air pollution, a further propagation of biomass combustion is hindered by the
disadvantage of high PM emissions. The International Energy Agency (IEA) Bioenergy Task 32 on
Biomass Combustion and Cofiring is promoting the utilization of clean biomass combustion applica-
tions to replace fossil fuels and to reduce CO2 emissions. Hence IEA assists the development and
implementation of technically and economically feasible measures for PM reduction. As a basis to set
priorities for the implementation of measures and as a guideline for future regulations, emission factors
from different types of combustion devices under different operation modes are needed. The present
study gives a survey on emission factors as reported from the member countries of the IEA Task 32.
To collect information, a detailed questionnaire was sent to all member countries. A total of 17 institu-
tions from seven countries, i.e., Austria, Denmark, Germany, Norway, The Netherlands, Sweden, and
Switzerland, participated in the survey. Valuable data are available for residential wood combustion,
whereas data from automatic combustion plants are strongly related to particle removal equipment
and national or local emission limits. Hence the results refer mainly to residential wood combustion
and show that huge ranges are found for manual wood combustion devices. For existing stoves and
boilers, ideal operation is regarded as a major target to reduce PM emissions. Furthermore, the me-
thod of ignition is important for the PM emissions of wood stoves and boilers. For typical wood stoves,
ignition from the top of the batch of wood logs instead of ignition from the bottom can often avoid
visible smoke during start-up and reduce the total PM emissions by more than 50%. For log wood
boilers, beside optimised ignition and start-up, the implementation of a heat storage tank is essential,
as thanks to a heat storage, part-load operation related to high PM emissions can be avoided. With
respect to the measurement of PM emissions, the mass on solid particles in the hot flue gas (as
collected on filters) and the additional mass of condensables need to be distinguished. Under poor
combustion conditions, the mass of condensables can exceed the mass of solid particles and hence
should be considered in future immission inventories.
Keywords: Emission factor, particle emissions, condensables, wood combustion.
8/14/2019 Particulate emissions from biomass combustion
http://slidepdf.com/reader/full/particulate-emissions-from-biomass-combustion 4/40
4
2 Introduction
2.1 Motivation
Biomass combustion is an important source of inhalable particulate matter smaller 10 microns (PM10)
in the ambient air. Since PM10 is regarded as one of the most relevant parameters in air pollution
[Dockery et al. 1993, Donaldson et al. 2002], the PM emissions from biomass combustion can hinder
the further propagation of bioenergy. To overcome this disadvantage, detailed information on particles
from different combustion applications are needed. Based on these data, the most significant particle
sources among biomass combustion can be identified and measures for PM reduction can be
deduced. Consequently activities on the characterisation of particle emissions from biomass combus-
tion have been performed in many IEA countries in the past years or are currently ongoing.
2.2 Objectives
The objectives of the present study is to review available data on emission factors of particulate emis-
sions from biomass combustion and measurement techniques applied to characterise particle emis-
sions from biomass combustion. Priority is given to wood fuels used in residential wood combustion
and in district heating plants. To enable a comparison of different data, the sampling and measure-
ment techniques shall be documented and differences due to different sampling or analysis shall be
discussed. Furthermore, the influence of combustion type, fuel parameters and different operation
conditions on PM emissions shall be identified.
2.3 Work programme
The main work method was to collect emission data from research institutes and universities and to
review official national emission factors. Furthermore, information on measurement methods was
collected. For this purpose, a detailed questionnaire on particles was compiled and sent to IEA
appointed experts. Beside this, certain data available from literature were also considered in the
survey. Relating to emission factors the questionnaire comprehends residential wood burning as well
as industrial wood combustion. The residential category consists of fireplaces, manual stoves, manual
boilers and pellet combustion, each case with subcategories oriented on technology and wood fuel
(log wood, pellets). The industrial sector includes automatic boilers with categories from < 70 kW to
> 10 MW and subcategories related to technology. For the emission inventory data a range of values
were requested for best results at ideal operation, typical results at practical operation and worst
results at very bad handling. Values were also differentiated between measurements with and without
start phase emissions and measurements for solid particles (indicated as SP), solid particles plus
condensables found in impinger bottles (SPC), and total particles collected in a dilution tunnel (DT).
8/14/2019 Particulate emissions from biomass combustion
http://slidepdf.com/reader/full/particulate-emissions-from-biomass-combustion 5/40
5
3 Particulate matter in the ambient air
3.1 Characteristics of particulate matter (PM)
Particulate matter (PM) describes the sum of airborne solid particles and droplets. PM, also known as
particle pollution, is a complex mixture of airborne particles and liquid droplets composed of acids
(such as nitrates and sulfates), ammonium, water, black (or “elemental”) carbon, organic chemicals,
metals, and soil (crustal) material. The particle size is the most important parameter for the characteri-
sation of particle behaviour. PM10 summarizes all particles and droplets with an aerodynamic diameter
smaller than 10 micrometer (microns). EPA groups particle pollution into two categories [EPA 2008]:
- "Coarse particles" (PM10-2.5) such as those found near roadways and dusty industries range in dia-
meter from 2.5 to 10 micrometers (or microns). The existing “coarse” particle standard (known as
PM10) includes all particles less than 10 microns in size1. EPA has proposed replacing this standard
with one that includes only particles between 10 and 2.5 microns in size (i.e., PM10-2.5).
- "Fine particles" (or PM2.5) such as those found in smoke and haze have diameters less than 2.5
microns. PM2.5 is referred to as “primary” if it is directly emitted into the air as solid or liquid par-
ticles, and is called “secondary” if it is formed by chemical reactions of gases in the atmosphere.
Beside coarse and fine particles, ultrafine particles smaller than 0.1 microns are distinguished
(e.g. [Hinds 1999]. The size and density affects the retention period and travel distances in the atmos-
phere. Coarse particles tend to settle to the ground by gravity within hours, while fine particles can
remain in the atmosphere for several weeks. Furthermore, limit values for both, particle emissions as
well as PM immissions are indicated as mass concentrations. This does not respect the large surface
of fine particles which can act as potential carrier for toxic substances. Hence beside mass concentra-
tions, additional parameters are relevant for the potential impact of particles on environment and hu-
man health. In particular the particle size, the particle shape, the morphology, and the chemical com-
position are important parameters which need to be respected in addition to the mass. For typical con-
ditions, approximately 90% of PM consists of fine and ultrafine particles [UBA 2005]. Since PM indi-
cate only mass concentrations, there are considerations for further parameters such as particle num-
ber and toxicity which might be respected for future limit values.Particulate matter in the ambient air is a mixture of directly emitted primary aerosols and
secondary aerosols formed in the atmosphere. PM is partially of natural origin, while anthropogenic
emissions lead to additional PM in the ambient caused by primary and secondary aerosols. Coarse
particles from primary aerosols originate mainly from mechanical processes (construction activities,
road dust, re-suspension, wind etc.) whereas fine particles are particularly produced through com-
bustion [WHO 2006]. Main sources of primary particulate matter are Diesel engines and biomass com-
bustion. Secondary aerosols are formed in the atmosphere through conversion of gaseous precursors
1 In German, the expression „Feinstaub“ („fine particles“) is used to describe PM 10, which, however, stands
for the existing „coarse“ particle standard according to EPA.
8/14/2019 Particulate emissions from biomass combustion
http://slidepdf.com/reader/full/particulate-emissions-from-biomass-combustion 6/40
6
such as sulphur oxides (SO2, SO3), nitrogen oxides (NO, NO2), ammonia (NH3) and Non-Methane Vo-
latile Organic Compounds (NMVOC). Reaction products are ammonium sulphates and ammonium
nitrate, aldehydes and ketones as an oxidation product of NMVOC. Greatest producer of secondary
aerosols are stationary combustion processes (energy, industry, domestic fuel: SO2, SO3 and NO,
NO2), agriculture (NH3), Diesel engines (NOX), use of solvent, chemical industry and petro chemistry(NMVOC) [UBA 2005].
Long exposures to particulate matter can cause serious health problems such as higher mor-
bidity, affection of lungs and a shorter life expectancy, mainly in subject with pre-existing heart and
lung diseases. The particle size is a main determinant of health effects. Coarse particles are generally
filtered in the nose and throat where as particulate matter smaller then PM10 can settle in the lungs and
may reach the alveolar region. The size PM10 can’t be seen as a strict edge between respirable and
non-respirable particles, but has been agreed upon for monitoring by most regulatory agencies so far.
WHO though has published 2006 it’s latest Air Quality Guideline (AQGs) based on health effects with
limiting values for PM10 and PM2,5., both for short-term and long- exposures [WHO 2006].
3.2 Health relevance of PM
The aim of the Air Quality Guideline (AQG) of the World Health Organization (WHO) is to support
actions to achieve air quality that protects human health. Countries are encouraged by WHO to con-
sider adopting an increasingly stringent set of standards, tracking progress through the monitoring of
emission reductions and declining concentrations of particulate matter. To assist this process, theguideline and interim target values of the AQG reflect the concentrations at which increased mortality
responses due to particulate matter air pollution are expected based on current scientific findings
[WHO 2006]. Beside the guideline value, three interim targets were defined since countries may find
these interim targets particularly helpful in gauging progress over time in the difficult process of
steadily reducing population exposures to PM. Due to WHO’s Air Quality Guideline both the European
Commission and the United States Environmental Protection Agency have used the approach to
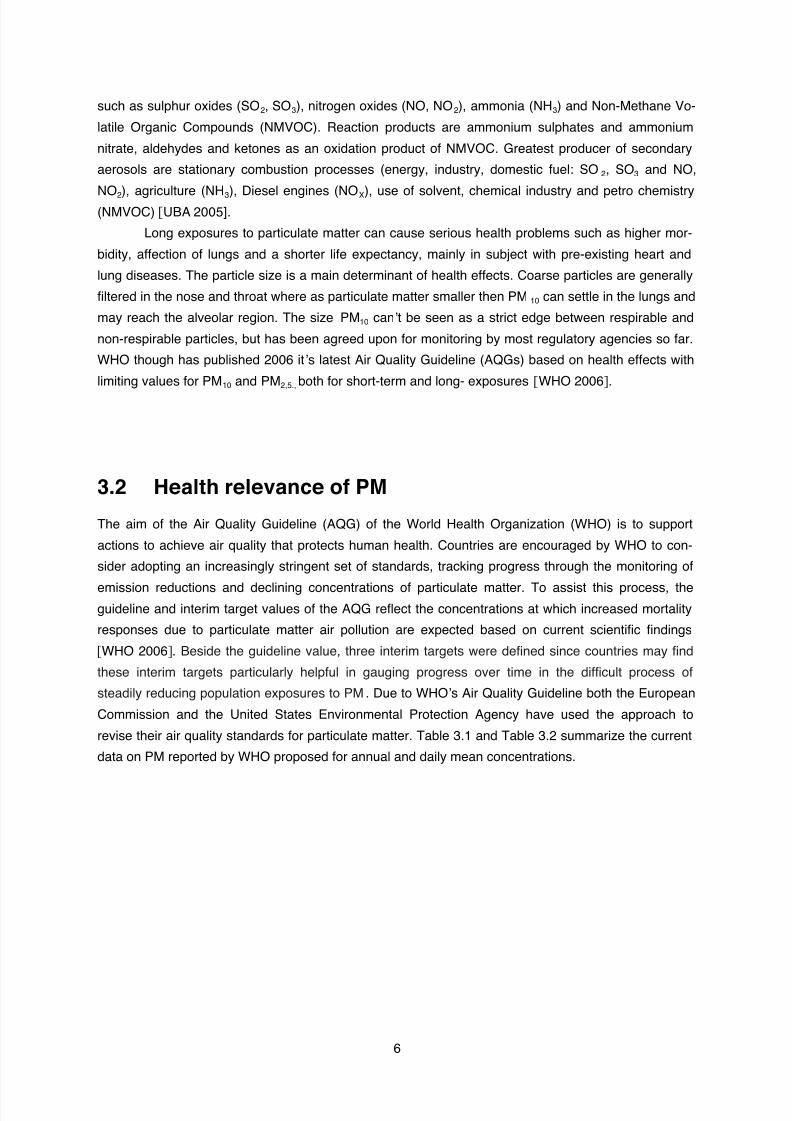
revise their air quality standards for particulate matter. Table 3.1 and Table 3.2 summarize the current
data on PM reported by WHO proposed for annual and daily mean concentrations.
8/14/2019 Particulate emissions from biomass combustion
http://slidepdf.com/reader/full/particulate-emissions-from-biomass-combustion 7/40
7
Table 3.1 WHO air quality guidelines and interim targets for particulate matter: annual mean concentrations.The use of PM2.5 guideline value is preferred.
PM10
[μg/m3] PM2.5
[μg/m3] Basis for the selected level
Interim target-1 70 35 These levels are associated with about a 15% higher long-termmortality risk relative to the AQG level.
Interim target-2 50 25 In addition to other health benefits, these levels lower the risk ofpremature mortality by approximately 6% [2–11%] relative to theIT-1level.
Interim target-3 30 15 In addition to other health benefits, these levels reduce the mortalityrisk by approximately 6% [2-11%] relative to the -IT-2 level.
Air quality
guideline (AQG)
20 10 These are the lowest levels at which total, cardiopulmonary andlung cancer mortality have been shown to increase with more than95% confidence in response to long-term exposure to PM2.5.
Table 3.2 WHO air quality guidelines and interim targets for particulate matter: 24 hour concentrations (99thpercentile (days/year).
PM10
[μg/m3] PM2.5
[μg/m3] Basis for the selected level
Interim target-1 150 75 Based on published risk coefficients from multi-centre studies andmeta-analyses (about 5% increase of short-term mortality over theAQG value).
Interim target-2 100 50 Based on published risk coefficients from multi-centre studies andmeta-analyses (about 2.5% increase of short-term mortality overthe AQG value).
Interim target-3 75 37.5 Based on published risk coefficients from multi-centre studies andmeta-analyses (about 1.2% increase in short-term mortality overthe AQG value).
Air quality
guideline (AQG)
50 25 Based on relationship between 24-hour and annual PM levels.
8/14/2019 Particulate emissions from biomass combustion
http://slidepdf.com/reader/full/particulate-emissions-from-biomass-combustion 8/40
8
3.3 Immission limit values for PM
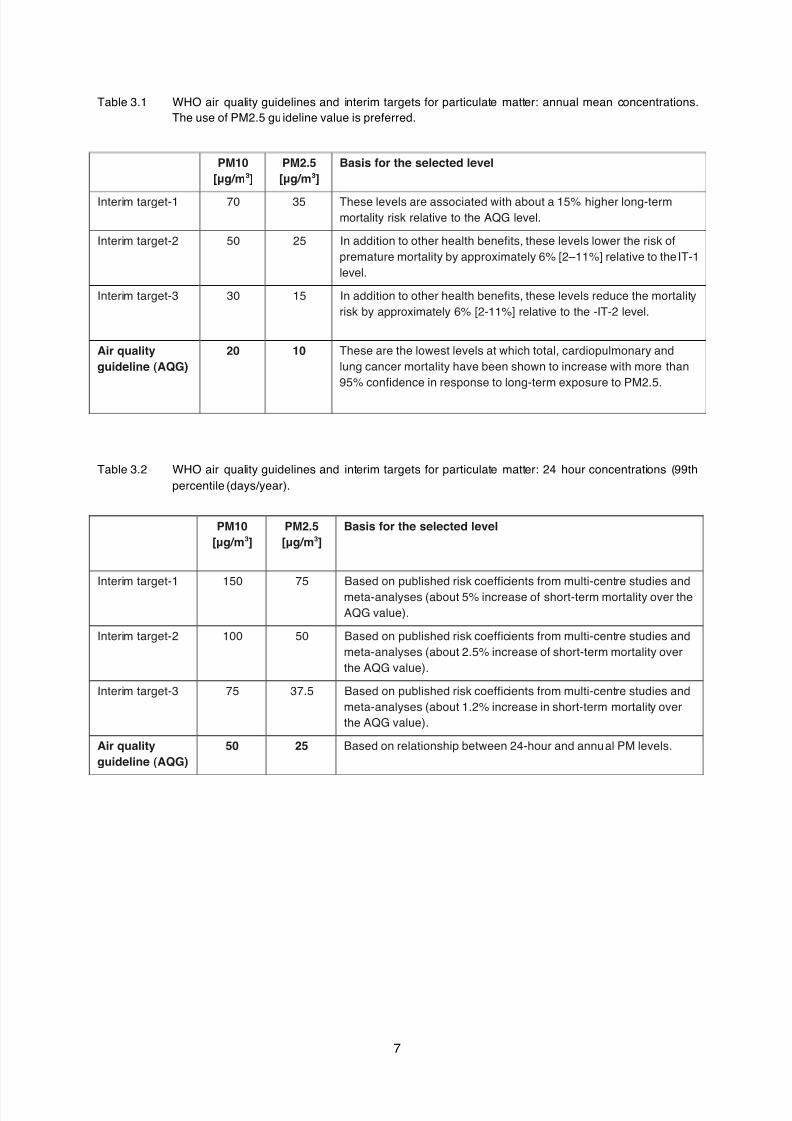
Table 3.3 shows a comparison of immission limit values in different countries.
The European Community has set in directives 1999/30/EC and 96/62/EC limits for PM 10 in the air. On
Jan. 1st 2005 these standards became effective. In a first phase the limit of the yearly average is
40 µg/m3 and for daily average (24 hour mean) 50 µg/m3. The daily average is not allowed to be
exceeded more than 35 times per year. In a second phase starting June 1 st 2010 the yearly average
standard will be 20 µg/m3 and the daily average limit 50 µg/m3 where as the allowed number of daily
exceedances will be reduced to 7 days per year.
Table 3.3 Immission limit values for PM10 (except USA: PM10 and PM 2.5). *indicative value
Country
Annual
limit value
[µg/m3]
24 hour
limit value
[µg/m3] Allowance for 24 h limit value
EC to 1.6.10 40 50 35 exceedances p.a. (Austria: 30)
EC from 1.6.10 20 50 7 exceedances p.a. (Austria: 25)
Switzerland 20 50 1 exceedance p.a.
Norway 35 50
WHO (AQG) 20 50
WHO (AQG) 10 25
USA PM10 150 1 exceedance p.a.on average over 3 a
USA PM2.5 15 65 98% for an average over 3 a
8/14/2019 Particulate emissions from biomass combustion
http://slidepdf.com/reader/full/particulate-emissions-from-biomass-combustion 9/40
9
4 Combustion particles
4.1 Types of combustion particles
Investigations on particle emissions showed, that well designed and properly operated automatic wood
combustion plants achieve a high combustion quality thus resulting in low emissions of unburned
hydrocarbons and soot [Nussbaumer 2005]. However, automatic wood boilers exhibit fairly high mass
concentrations of particle emissions in the raw gas, i.e., typically in the order of magnitude of
100 mg/m3 at 13 Vol.-% O2 for natural wood chips and up to several 100 mg/m3 for other fuels such as
bark. Particles from well designed and operated automatic wood combustion consist mainly of inor-
ganic matter such as salts, while particles from wood stoves operated under poor conditions consist
mainly of soot and organic substances.
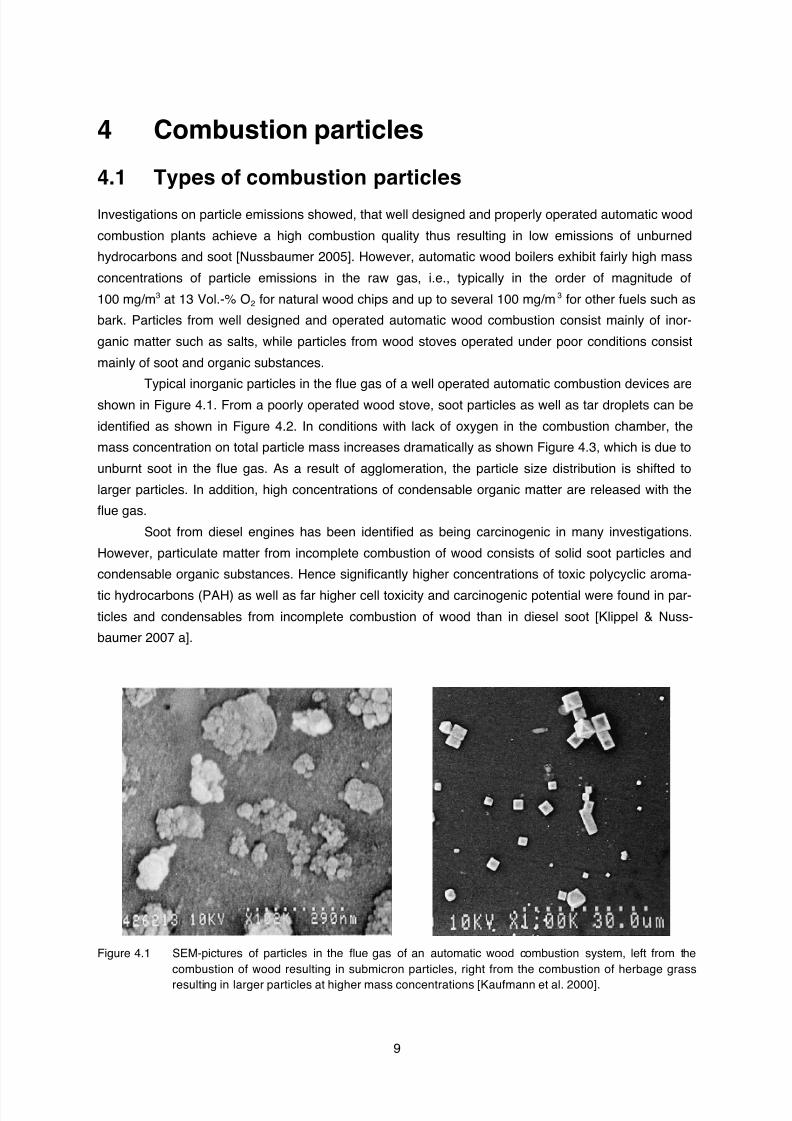
Typical inorganic particles in the flue gas of a well operated automatic combustion devices are
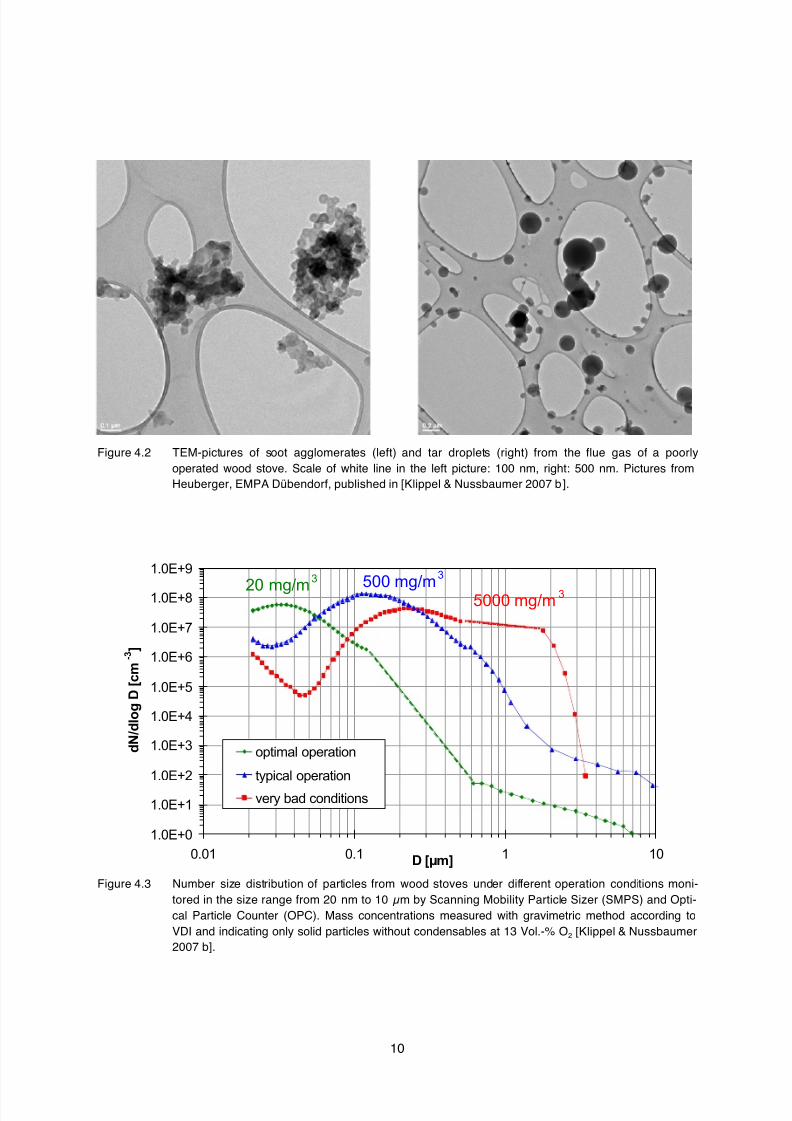
shown in Figure 4.1. From a poorly operated wood stove, soot particles as well as tar droplets can be
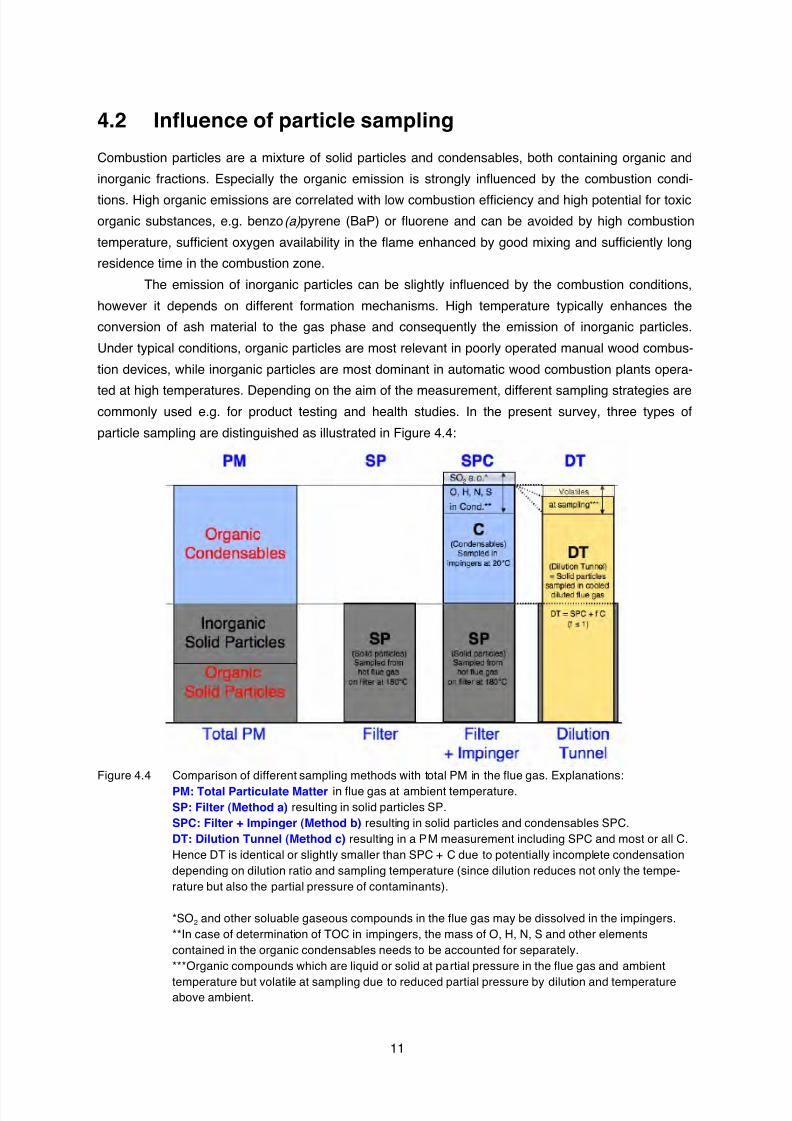
identified as shown in Figure 4.2. In conditions with lack of oxygen in the combustion chamber, the
mass concentration on total particle mass increases dramatically as shown Figure 4.3, which is due to
unburnt soot in the flue gas. As a result of agglomeration, the particle size distribution is shifted to
larger particles. In addition, high concentrations of condensable organic matter are released with the
flue gas.
Soot from diesel engines has been identified as being carcinogenic in many investigations.
However, particulate matter from incomplete combustion of wood consists of solid soot particles and
condensable organic substances. Hence significantly higher concentrations of toxic polycyclic aroma-
tic hydrocarbons (PAH) as well as far higher cell toxicity and carcinogenic potential were found in par-
ticles and condensables from incomplete combustion of wood than in diesel soot [Klippel & Nuss-
baumer 2007 a].
Figure 4.1 SEM-pictures of particles in the flue gas of an automatic wood combustion system, left from thecombustion of wood resulting in submicron particles, right from the combustion of herbage grass
resulting in larger particles at higher mass concentrations [Kaufmann et al. 2000].
8/14/2019 Particulate emissions from biomass combustion
http://slidepdf.com/reader/full/particulate-emissions-from-biomass-combustion 10/40
10
Figure 4.2 TEM-pictures of soot agglomerates (left) and tar droplets (right) from the flue gas of a poorlyoperated wood stove. Scale of white line in the left picture: 100 nm, right: 500 nm. Pictures fromHeuberger, EMPA Dübendorf, published in [Klippel & Nussbaumer 2007 b].
1.0E+0
1.0E+1
1.0E+2
1.0E+3
1.0E+4
1.0E+5
1.0E+6
1.0E+7
1.0E+8
1.0E+9
0.01 0.1 1 10D [!m]
d N / d l o g D [ c m
- 3 ]
optimal operation
typical operation
very bad conditions
20 mg/m3
500 mg/m
3
5000 mg/m3
Figure 4.3 Number size distribution of particles from wood stoves under different operation conditions moni-
tored in the size range from 20 nm to 10 µm by Scanning Mobility Particle Sizer (SMPS) and Opti-cal Particle Counter (OPC). Mass concentrations measured with gravimetric method according toVDI and indicating only solid particles without condensables at 13 Vol.-% O2 [Klippel & Nussbaumer2007 b].
8/14/2019 Particulate emissions from biomass combustion
http://slidepdf.com/reader/full/particulate-emissions-from-biomass-combustion 11/40
11
4.2 Influence of particle sampling
Combustion particles are a mixture of solid particles and condensables, both containing organic and
inorganic fractions. Especially the organic emission is strongly influenced by the combustion condi-
tions. High organic emissions are correlated with low combustion efficiency and high potential for toxicorganic substances, e.g. benzo(a) pyrene (BaP) or fluorene and can be avoided by high combustion
temperature, sufficient oxygen availability in the flame enhanced by good mixing and sufficiently long
residence time in the combustion zone.
The emission of inorganic particles can be slightly influenced by the combustion conditions,
however it depends on different formation mechanisms. High temperature typically enhances the
conversion of ash material to the gas phase and consequently the emission of inorganic particles.
Under typical conditions, organic particles are most relevant in poorly operated manual wood combus-
tion devices, while inorganic particles are most dominant in automatic wood combustion plants opera-
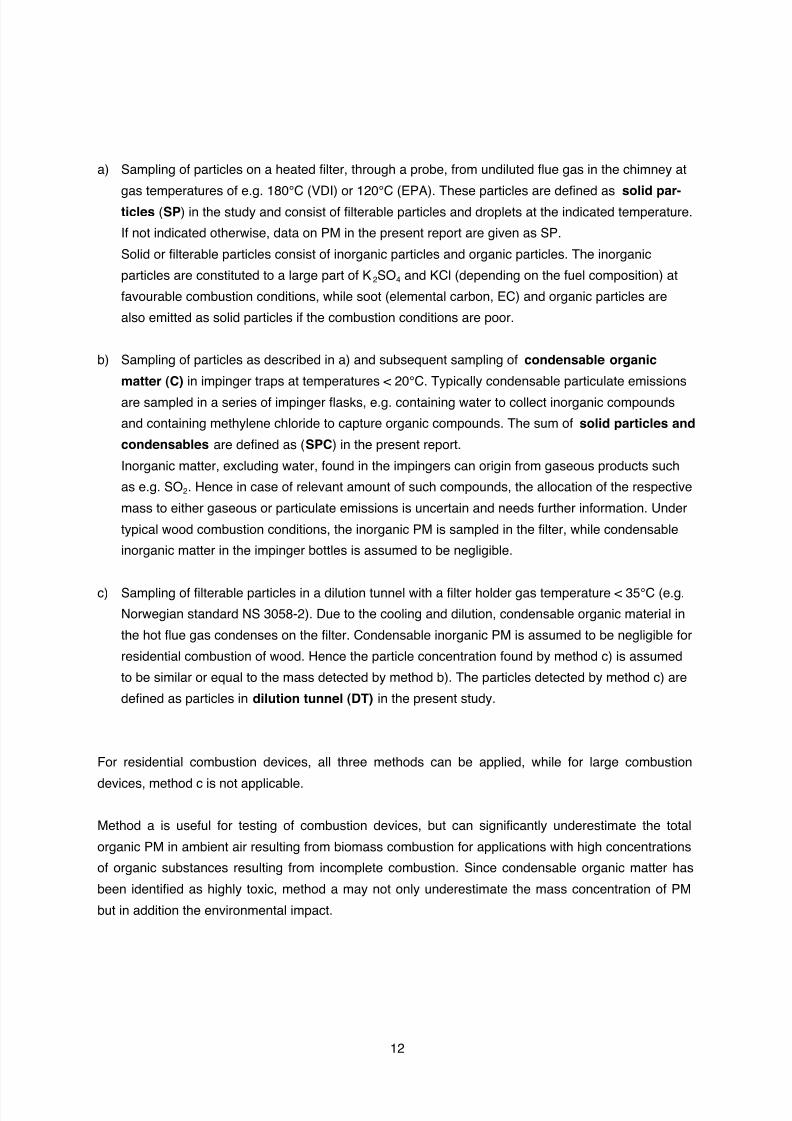
ted at high temperatures. Depending on the aim of the measurement, different sampling strategies arecommonly used e.g. for product testing and health studies. In the present survey, three types of
particle sampling are distinguished as illustrated in Figure 4.4:
Figure 4.4 Comparison of different sampling methods with total PM in the flue gas. Explanations:PM: Total Particulate Matter in flue gas at ambient temperature. SP: Filter (Method a) resulting in solid particles SP. SPC: Filter + Impinger (Method b) resulting in solid particles and condensables SPC.DT: Dilution Tunnel (Method c) resulting in a PM measurement including SPC and most or all C.Hence DT is identical or slightly smaller than SPC + C due to potentially incomplete condensationdepending on dilution ratio and sampling temperature (since dilution reduces not only the tempe-rature but also the partial pressure of contaminants).
*SO2 and other soluable gaseous compounds in the flue gas may be dissolved in the impingers.**In case of determination of TOC in impingers, the mass of O, H, N, S and other elementscontained in the organic condensables needs to be accounted for separately.***Organic compounds which are liquid or solid at partial pressure in the flue gas and ambient
temperature but volatile at sampling due to reduced partial pressure by dilution and temperatureabove ambient.
8/14/2019 Particulate emissions from biomass combustion
http://slidepdf.com/reader/full/particulate-emissions-from-biomass-combustion 12/40
12
a) Sampling of particles on a heated filter, through a probe, from undiluted flue gas in the chimney at
gas temperatures of e.g. 180°C (VDI) or 120°C (EPA). These particles are defined as solid par-ticles (SP) in the study and consist of filterable particles and droplets at the indicated temperature.
If not indicated otherwise, data on PM in the present report are given as SP.
Solid or filterable particles consist of inorganic particles and organic particles. The inorganic
particles are constituted to a large part of K2SO4 and KCl (depending on the fuel composition) at
favourable combustion conditions, while soot (elemental carbon, EC) and organic particles are
also emitted as solid particles if the combustion conditions are poor.
b) Sampling of particles as described in a) and subsequent sampling of condensable organic
matter (C) in impinger traps at temperatures < 20°C. Typically condensable particulate emissions
are sampled in a series of impinger flasks, e.g. containing water to collect inorganic compounds
and containing methylene chloride to capture organic compounds. The sum of solid particles and
condensables are defined as (SPC) in the present report.
Inorganic matter, excluding water, found in the impingers can origin from gaseous products such
as e.g. SO2. Hence in case of relevant amount of such compounds, the allocation of the respective
mass to either gaseous or particulate emissions is uncertain and needs further information. Under
typical wood combustion conditions, the inorganic PM is sampled in the filter, while condensable
inorganic matter in the impinger bottles is assumed to be negligible.
c) Sampling of filterable particles in a dilution tunnel with a filter holder gas temperature < 35°C (e.g.Norwegian standard NS 3058-2). Due to the cooling and dilution, condensable organic material in
the hot flue gas condenses on the filter. Condensable inorganic PM is assumed to be negligible for
residential combustion of wood. Hence the particle concentration found by method c) is assumed
to be similar or equal to the mass detected by method b). The particles detected by method c) are
defined as particles in dilution tunnel (DT) in the present study.
For residential combustion devices, all three methods can be applied, while for large combustion
devices, method c is not applicable.
Method a is useful for testing of combustion devices, but can significantly underestimate the total
organic PM in ambient air resulting from biomass combustion for applications with high concentrations
of organic substances resulting from incomplete combustion. Since condensable organic matter has
been identified as highly toxic, method a may not only underestimate the mass concentration of PM
but in addition the environmental impact.
8/14/2019 Particulate emissions from biomass combustion
http://slidepdf.com/reader/full/particulate-emissions-from-biomass-combustion 13/40
13
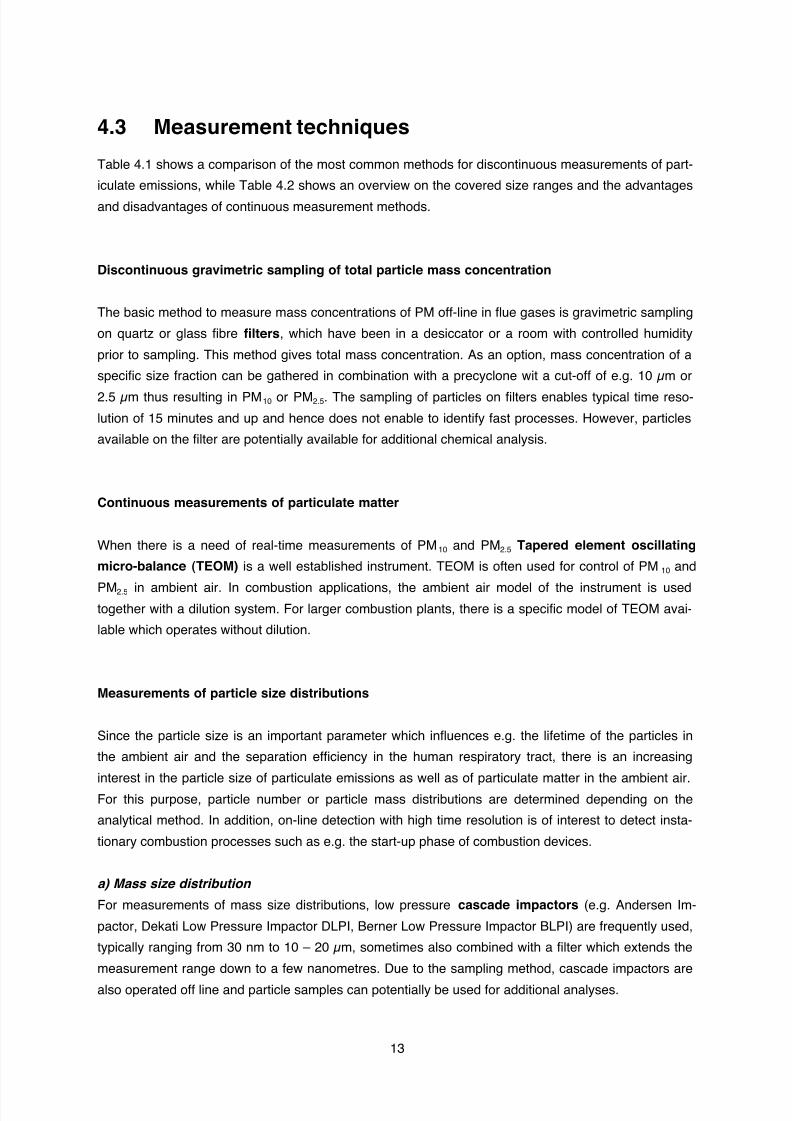
4.3 Measurement techniques
Table 4.1 shows a comparison of the most common methods for discontinuous measurements of part-
iculate emissions, while Table 4.2 shows an overview on the covered size ranges and the advantages
and disadvantages of continuous measurement methods.
Discontinuous gravimetric sampling of total particle mass concentration
The basic method to measure mass concentrations of PM off-line in flue gases is gravimetric sampling
on quartz or glass fibre filters, which have been in a desiccator or a room with controlled humidity
prior to sampling. This method gives total mass concentration. As an option, mass concentration of a
specific size fraction can be gathered in combination with a precyclone wit a cut-off of e.g. 10 µm or
2.5 µm thus resulting in PM10 or PM2.5. The sampling of particles on filters enables typical time reso-lution of 15 minutes and up and hence does not enable to identify fast processes. However, particles
available on the filter are potentially available for additional chemical analysis.
Continuous measurements of particulate matter
When there is a need of real-time measurements of PM10 and PM2.5 Tapered element oscillating
micro-balance (TEOM) is a well established instrument. TEOM is often used for control of PM10 and
PM2.5 in ambient air. In combustion applications, the ambient air model of the instrument is usedtogether with a dilution system. For larger combustion plants, there is a specific model of TEOM avai-
lable which operates without dilution.
Measurements of particle size distributions
Since the particle size is an important parameter which influences e.g. the lifetime of the particles in
the ambient air and the separation efficiency in the human respiratory tract, there is an increasing
interest in the particle size of particulate emissions as well as of particulate matter in the ambient air.
For this purpose, particle number or particle mass distributions are determined depending on the
analytical method. In addition, on-line detection with high time resolution is of interest to detect insta-
tionary combustion processes such as e.g. the start-up phase of combustion devices.
a) Mass size distribution
For measurements of mass size distributions, low pressure cascade impactors (e.g. Andersen Im-
pactor, Dekati Low Pressure Impactor DLPI, Berner Low Pressure Impactor BLPI) are frequently used,
typically ranging from 30 nm to 10 – 20 µm, sometimes also combined with a filter which extends the
measurement range down to a few nanometres. Due to the sampling method, cascade impactors are
also operated off line and particle samples can potentially be used for additional analyses.
8/14/2019 Particulate emissions from biomass combustion
http://slidepdf.com/reader/full/particulate-emissions-from-biomass-combustion 14/40
14
b) Number size distribution
From health aspects there is also an interest in particle number concentrations and particle number
size distributions, since a high number of ultrafine particles are assumed to be relevant at least to
certain health issues. There are several instruments available for on-line measurements of particle
number, mostly in need of dilution systems as they do not cope with high temperatures. The maininstruments are:
• Scanning mobility particle sizer (SMPS) are commonly used for measurement of number con-
centration and corresponding size distribution. There are a number of instrument versions,
working in the size range from a few nanometres to 1 µm.
• Electric low pressure impactor (ELPI) is another instrument for characterisation of number
concentration and distribution, ranging from 7 nm to 10 µm.
• Aerodynamic particle sizer (APS) measures particles from ~0.5 µm to ~10 µm.
• Fast mobility particle sizer (FMPS) is a rather new instrument for number concentrations and
size distributions ranging from 5.6 nm to 0.56 µm.• Optical particle counter (OPC) is another option for measurement of number of particles,
typically ranging from ~0.1 µm to a few micrometers.
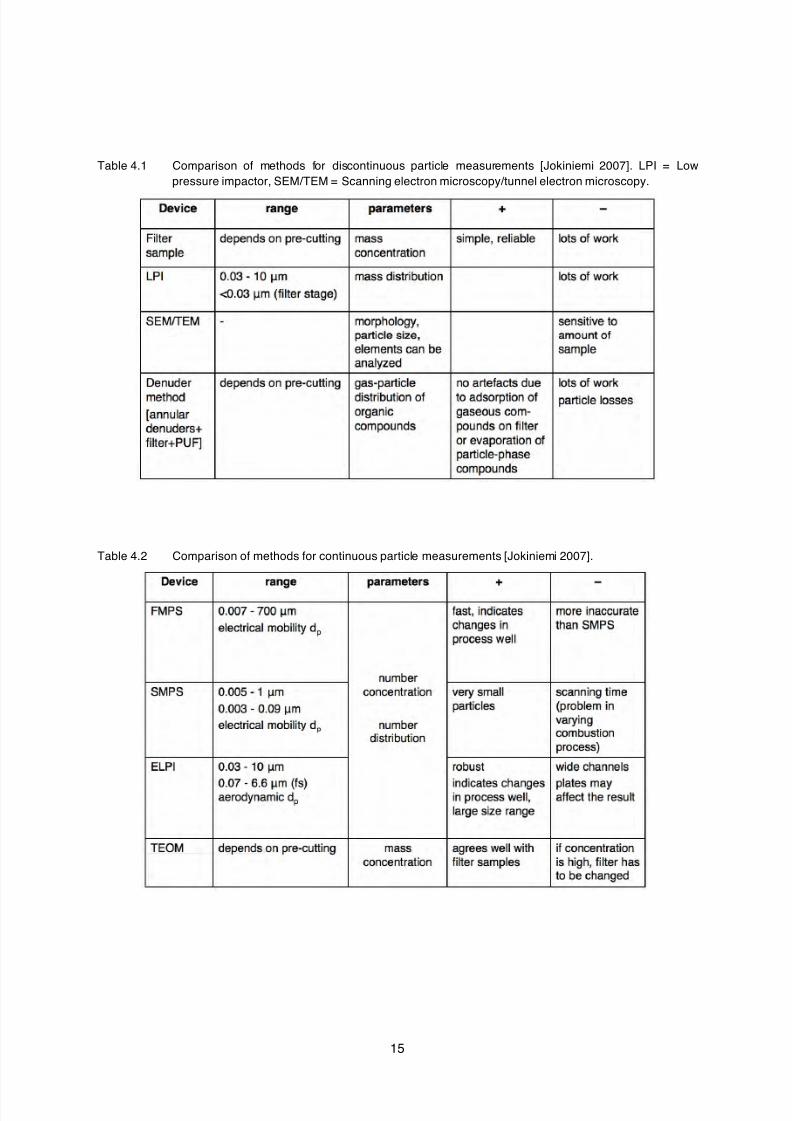
The instruments mentioned use different particle diameters for characterisation of number size distri-
butions. It is important to respect which diameter is considered e.g. to perform calculations from num-
ber to mass concentration. In Figure 4.5 a comparison of SMPS, ELPI, DLPI, and APS is presented in
which all data are converted to aerodynamic diameter by assumption of spherical particles with an
equivalence density of 2 g/cm3 for SMPS and ELPI. With this assumption, ELPI and SMPS show a
reasonable agreement in the submicron range. In the supermicron range, measurements with ELPI
lead to far higher values than DLPI and DLPI leads to far higher values than APS. However, it needsto be respected, that the presented data exhibit a very steep decrease in concentration between 0.1 to
10 µm as they cover a total range in concentration of 9 orders of magnitude. Due to the measurement
principle of successive separation of particles with decreasing size as used by SMPS and ELPI, it is
difficult to cover many orders of magnitudes in concentration, since a minor carry-over of small
particles to the subsequent separation sections lead to a significant over estimation of the number of
large particles. Hence the ELPI over estimates the number concentration in Figure 4.5 for particles
> 0.5 µm. This effect has also been found for a comparison of SMPS and OPC, where in case of
moderate particles concentrations > 0.2 µm (i.e., for good combustion conditions), the SMPS was over
estimating the number concentrations > 0.2 µm, while SMPS and OPC showed good agreement in the
range between 0.1 to 0.5 µm in case of high concentrations (i.e., poor combustion conditions) [Klippel
& Nussbaumer 2007 b]. In such applications, OPC measurement needs to be performed in diluted flue
gas to avoid exceedance of the measurement limit , where two particles may be detected as one.
Additional particle properties
Besides mass and number concentrations surface and volume concentrations are examples of other
parameters that might be interesting to consider in certain applications. Finally, it should also be
emphasized that characterisation of chemical content is very important as it can give information on
combustion conditions and mirrors the ash content in the fuel.
8/14/2019 Particulate emissions from biomass combustion
http://slidepdf.com/reader/full/particulate-emissions-from-biomass-combustion 15/40
15
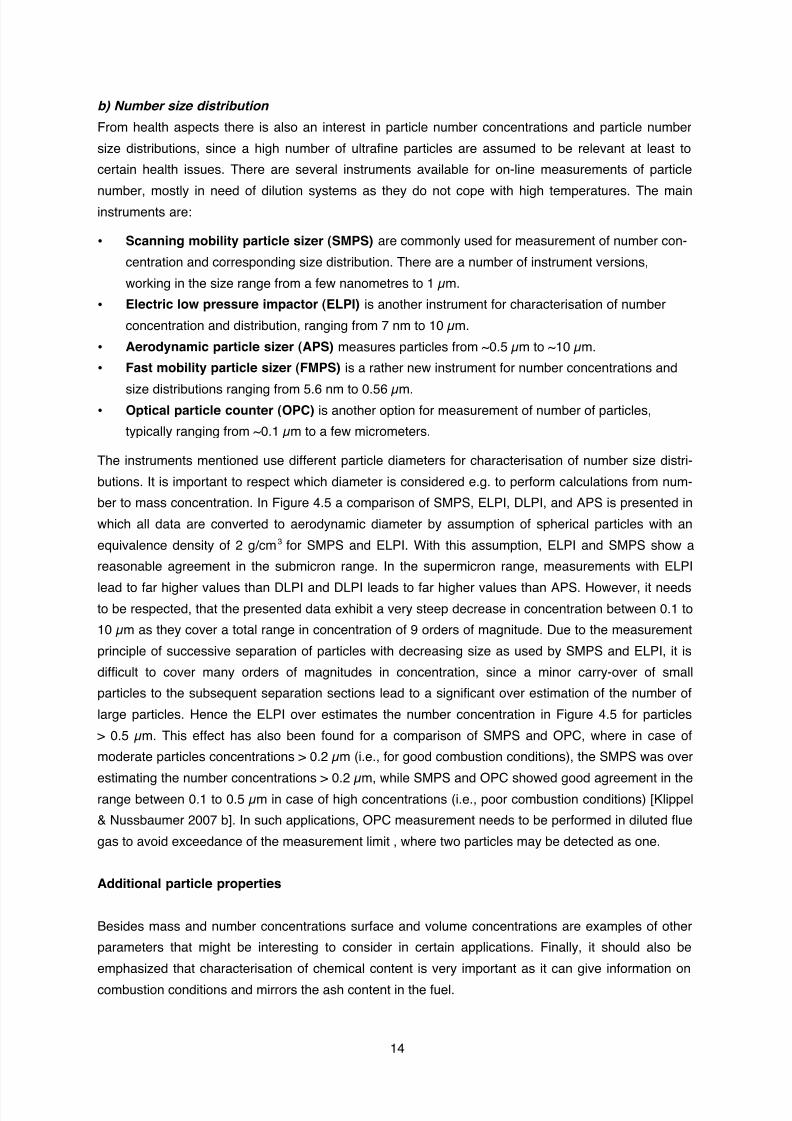
Table 4.1 Comparison of methods for discontinuous particle measurements [Jokiniemi 2007]. LPI = Lowpressure impactor, SEM/TEM = Scanning electron microscopy/tunnel electron microscopy.
Table 4.2 Comparison of methods for continuous particle measurements [Jokiniemi 2007].
8/14/2019 Particulate emissions from biomass combustion
http://slidepdf.com/reader/full/particulate-emissions-from-biomass-combustion 16/40
16
Figure 4.5 Comparison of number size distributions with different measurement instruments at simultaneousmeasurement in flue gas from a residential pellet burner [Pagels et al. 2002].
8/14/2019 Particulate emissions from biomass combustion
http://slidepdf.com/reader/full/particulate-emissions-from-biomass-combustion 17/40
17
5 Data basis
5.1 Participating countries
In total, 17 participants from 7 countries participated in the present survey and contributed with data in
the questionnaire. In addition, data for national emission factors were reported or gathered from
literature.
Table 5.1 List of participating IEA countries and institutions in the survey.
Country Abbreviation Institution (full name)
AUS BLT Biomass Logistics Technology, Wieselburg
Bios Bios Bioenergy and Graz University of Technology, Graz
Joanneum Joanneum Research, Graz
KOV Austrian Tiles Stove Association, Vienna
DEN Force FORCE Technology, Brøndby
GER IE Institute for Energy and Environment, Leipzig
TFZ Technologie- und Förderzentrum, Straubing
Uni Stuttgart University of Stuttgart, Inst. of Process Eng. and Power Plant Technology
ZAE ZAE Bayern, Garching
NET TNO TNO Science and Industry, Apeldoorn
NOR SINTEF SINTEF NBL, Norwegian Fire Research Laboratory, Trondheim
SWE SP Tech. SP Technical Research Institute of Sweden, Borås
Umeå Uni Umeå University, Energy Techn. and Thermal Process Chemistry, Umeå
VXU Växjö University, Dep. of Bioenergy Technology, Växjö
SWI CATSE Centre of Appropriate Technology and Social Ecology, Langenbruck
Verenum Verenum, Zürich and University of Lucerne, Lucerne
Vock Vock Engineering, Maschwanden
8/14/2019 Particulate emissions from biomass combustion
http://slidepdf.com/reader/full/particulate-emissions-from-biomass-combustion 18/40
18
5.2 Sources
Most of the data presented in the following figures have been indicated by the participating experts
from the institutions described in Table 5.1. In these cases, there is no direct literature quotation, as
these data have been collected by the questionnaire sent out in the present study.
In several cases, additional data have been used from reports or literature. In these cases, the
source is cited in the figures with numbers in brackets as e.g. [7] which refer to the literature list in
chapter 9.2.
5.3 Emission factors
Emission factors are representative values which attempt to relate the quantity of a pollutant releasedto the atmosphere with an activity associated with the release of that pollutant [EPA 2007]. Emission
factors for biomass combustion appliances are expressed as the weight of pollutant divided by a unit
energy, volume, or weight of the activity emitting the pollutant (e. g., grams of particulate emitted per
kilogram of wood burned). They are used to make source- or appliance-specific emission estimates.
Emission factors represent an average range of emission rates, roughly half of the subject
sources will have emission rates greater than the emission factor and the other half will have emission
rates less than the factor. Manual operated combustion appliances have an especially wide range of
emission factors. Essential are the operating mode, the fuel type, and the technique of the equipment.
Measures regarding manual operated combustion devices show that the emissions during practicaloperation have a factor leastwise twice as high as during ideal operation whereas by improper hand-
ling the emissions can possibly be even ten times as high. The accuracy of emission factors has a
central impact on the quality of emission inventories.
To obtain a clearer picture of the emission range, one target of the survey is to record values
containing data from best results at ideal operation over typical results at practical operation to worst
results at very poor operation. The collected emission factors are results of measurements and data
from literature of various countries and where delivered in different measures. For comparison reasons
the data are converted to mg particles emitted per MJ end energy contained in the fuel based on lower
heating value and indicated as [mg/MJ]. If not determined in the evaluated literature, emission factors
are assumed to be measured without start.
8/14/2019 Particulate emissions from biomass combustion
http://slidepdf.com/reader/full/particulate-emissions-from-biomass-combustion 19/40
19
6 Results on emission factors
6.1 Open fireplaces
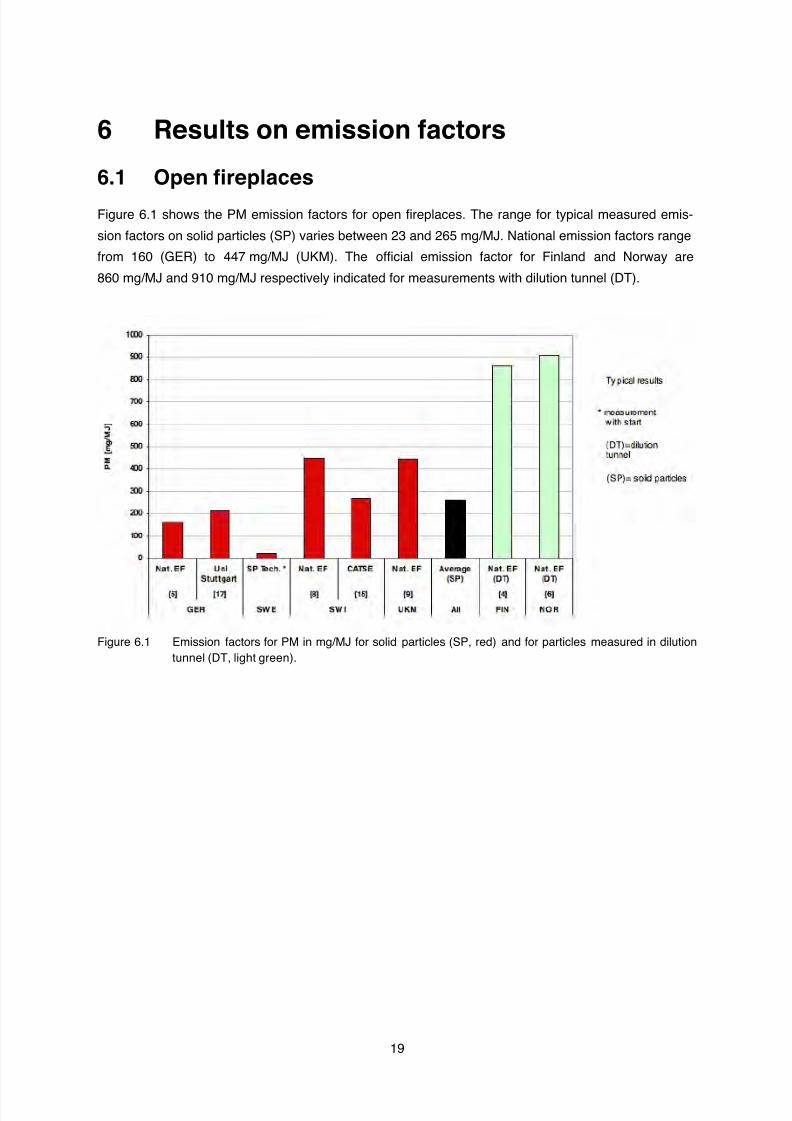
Figure 6.1 shows the PM emission factors for open fireplaces. The range for typical measured emis-
sion factors on solid particles (SP) varies between 23 and 265 mg/MJ. National emission factors range
from 160 (GER) to 447 mg/MJ (UKM). The official emission factor for Finland and Norway are
860 mg/MJ and 910 mg/MJ respectively indicated for measurements with dilution tunnel (DT).
Figure 6.1 Emission factors for PM in mg/MJ for solid particles (SP, red) and for particles measured in dilutiontunnel (DT, light green).
8/14/2019 Particulate emissions from biomass combustion
http://slidepdf.com/reader/full/particulate-emissions-from-biomass-combustion 20/40
20
6.2 Closed inset appliances (closed fireplaces)
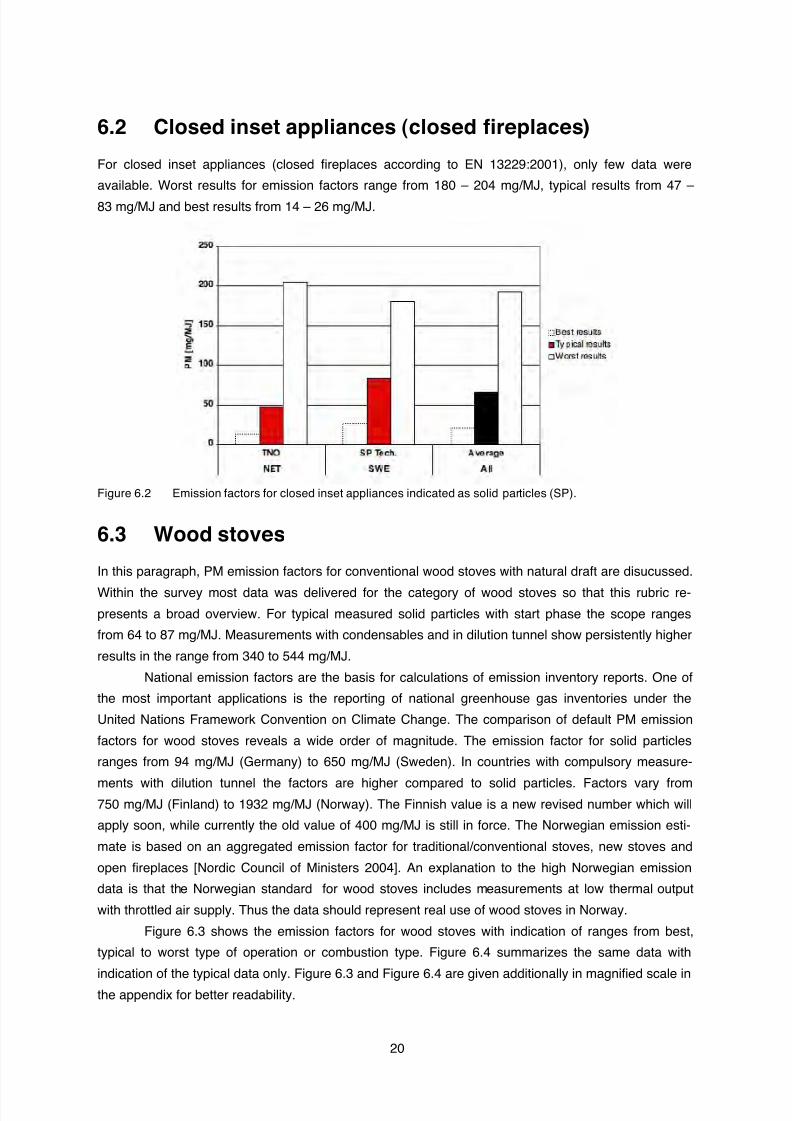
For closed inset appliances (closed fireplaces according to EN 13229:2001), only few data were
available. Worst results for emission factors range from 180 – 204 mg/MJ, typical results from 47 –
83 mg/MJ and best results from 14 – 26 mg/MJ.
Figure 6.2 Emission factors for closed inset appliances indicated as solid particles (SP).
6.3 Wood stoves
In this paragraph, PM emission factors for conventional wood stoves with natural draft are disucussed.
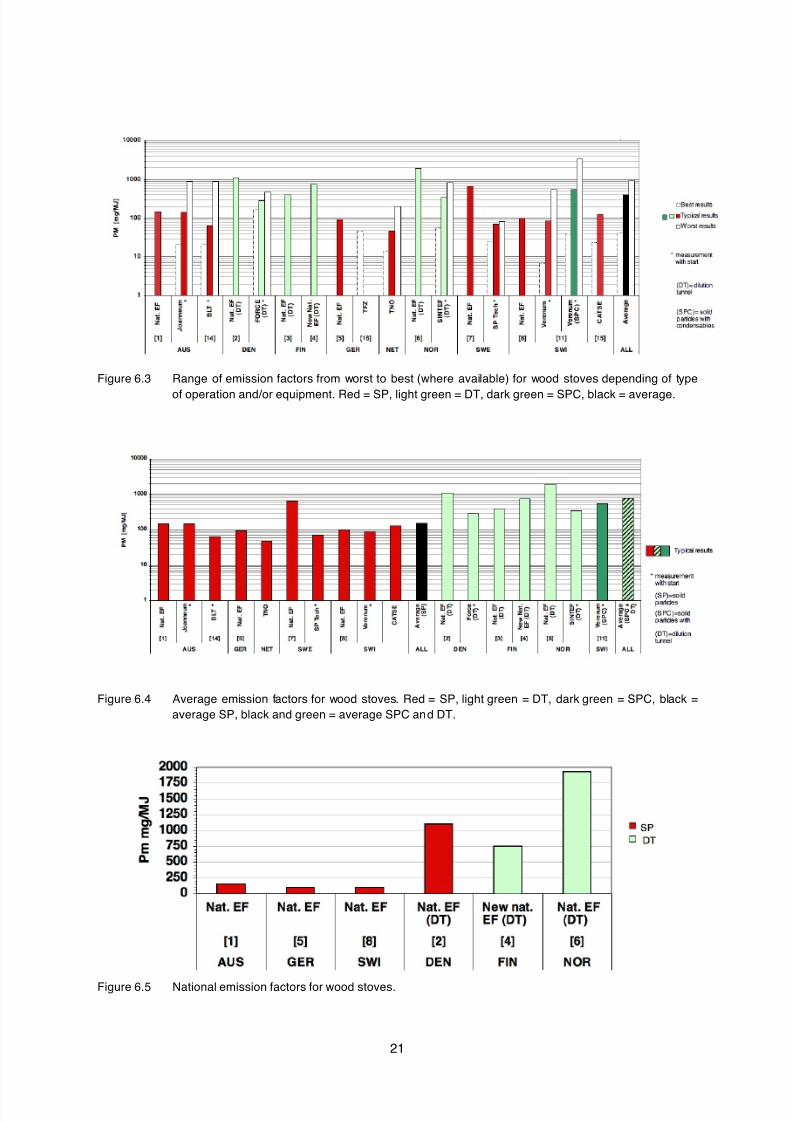
Within the survey most data was delivered for the category of wood stoves so that this rubric re-presents a broad overview. For typical measured solid particles with start phase the scope ranges
from 64 to 87 mg/MJ. Measurements with condensables and in dilution tunnel show persistently higher
results in the range from 340 to 544 mg/MJ.
National emission factors are the basis for calculations of emission inventory reports. One of
the most important applications is the reporting of national greenhouse gas inventories under the
United Nations Framework Convention on Climate Change. The comparison of default PM emission
factors for wood stoves reveals a wide order of magnitude. The emission factor for solid particles
ranges from 94 mg/MJ (Germany) to 650 mg/MJ (Sweden). In countries with compulsory measure-
ments with dilution tunnel the factors are higher compared to solid particles. Factors vary from750 mg/MJ (Finland) to 1932 mg/MJ (Norway). The Finnish value is a new revised number which will
apply soon, while currently the old value of 400 mg/MJ is still in force. The Norwegian emission esti-
mate is based on an aggregated emission factor for traditional/conventional stoves, new stoves and
open fireplaces [Nordic Council of Ministers 2004]. An explanation to the high Norwegian emission
data is that the Norwegian standard for wood stoves includes measurements at low thermal output
with throttled air supply. Thus the data should represent real use of wood stoves in Norway.
Figure 6.3 shows the emission factors for wood stoves with indication of ranges from best,
typical to worst type of operation or combustion type. Figure 6.4 summarizes the same data with
indication of the typical data only. Figure 6.3 and Figure 6.4 are given additionally in magnified scale in
the appendix for better readability.
8/14/2019 Particulate emissions from biomass combustion
http://slidepdf.com/reader/full/particulate-emissions-from-biomass-combustion 21/40
21
Figure 6.3 Range of emission factors from worst to best (where available) for wood stoves depending of type
of operation and/or equipment. Red = SP, light green = DT, dark green = SPC, black = average.
Figure 6.4 Average emission factors for wood stoves. Red = SP, light green = DT, dark green = SPC, black =average SP, black and green = average SPC and DT.
Figure 6.5 National emission factors for wood stoves.
8/14/2019 Particulate emissions from biomass combustion
http://slidepdf.com/reader/full/particulate-emissions-from-biomass-combustion 22/40
22
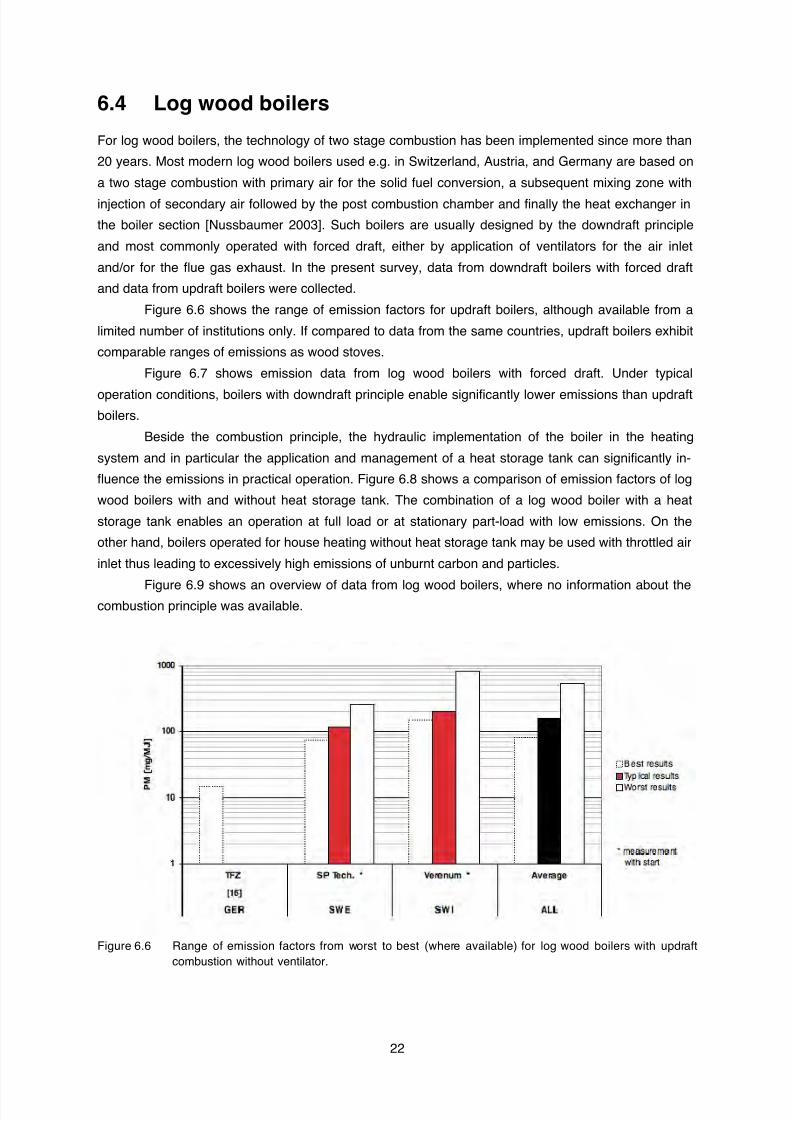
6.4 Log wood boilers
For log wood boilers, the technology of two stage combustion has been implemented since more than
20 years. Most modern log wood boilers used e.g. in Switzerland, Austria, and Germany are based on
a two stage combustion with primary air for the solid fuel conversion, a subsequent mixing zone with
injection of secondary air followed by the post combustion chamber and finally the heat exchanger in
the boiler section [Nussbaumer 2003]. Such boilers are usually designed by the downdraft principle
and most commonly operated with forced draft, either by application of ventilators for the air inlet
and/or for the flue gas exhaust. In the present survey, data from downdraft boilers with forced draft
and data from updraft boilers were collected.
Figure 6.6 shows the range of emission factors for updraft boilers, although available from a
limited number of institutions only. If compared to data from the same countries, updraft boilers exhibit
comparable ranges of emissions as wood stoves.
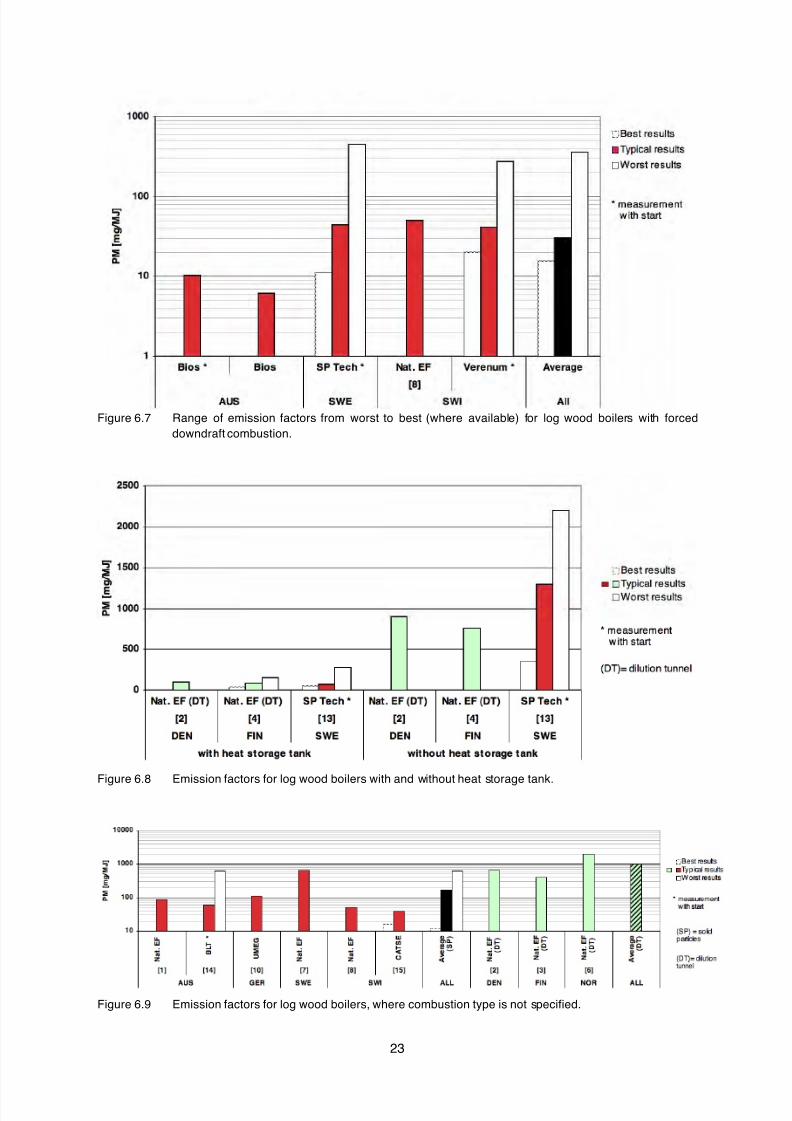
Figure 6.7 shows emission data from log wood boilers with forced draft. Under typical
operation conditions, boilers with downdraft principle enable significantly lower emissions than updraftboilers.
Beside the combustion principle, the hydraulic implementation of the boiler in the heating
system and in particular the application and management of a heat storage tank can significantly in-
fluence the emissions in practical operation. Figure 6.8 shows a comparison of emission factors of log
wood boilers with and without heat storage tank. The combination of a log wood boiler with a heat
storage tank enables an operation at full load or at stationary part-load with low emissions. On the
other hand, boilers operated for house heating without heat storage tank may be used with throttled air
inlet thus leading to excessively high emissions of unburnt carbon and particles.
Figure 6.9 shows an overview of data from log wood boilers, where no information about thecombustion principle was available.
Figure 6.6 Range of emission factors from worst to best (where available) for log wood boilers with updraftcombustion without ventilator.
8/14/2019 Particulate emissions from biomass combustion
http://slidepdf.com/reader/full/particulate-emissions-from-biomass-combustion 23/40
23
Figure 6.7 Range of emission factors from worst to best (where available) for log wood boilers with forceddowndraft combustion.
Figure 6.8 Emission factors for log wood boilers with and without heat storage tank.
Figure 6.9 Emission factors for log wood boilers, where combustion type is not specified.
8/14/2019 Particulate emissions from biomass combustion
http://slidepdf.com/reader/full/particulate-emissions-from-biomass-combustion 24/40
24
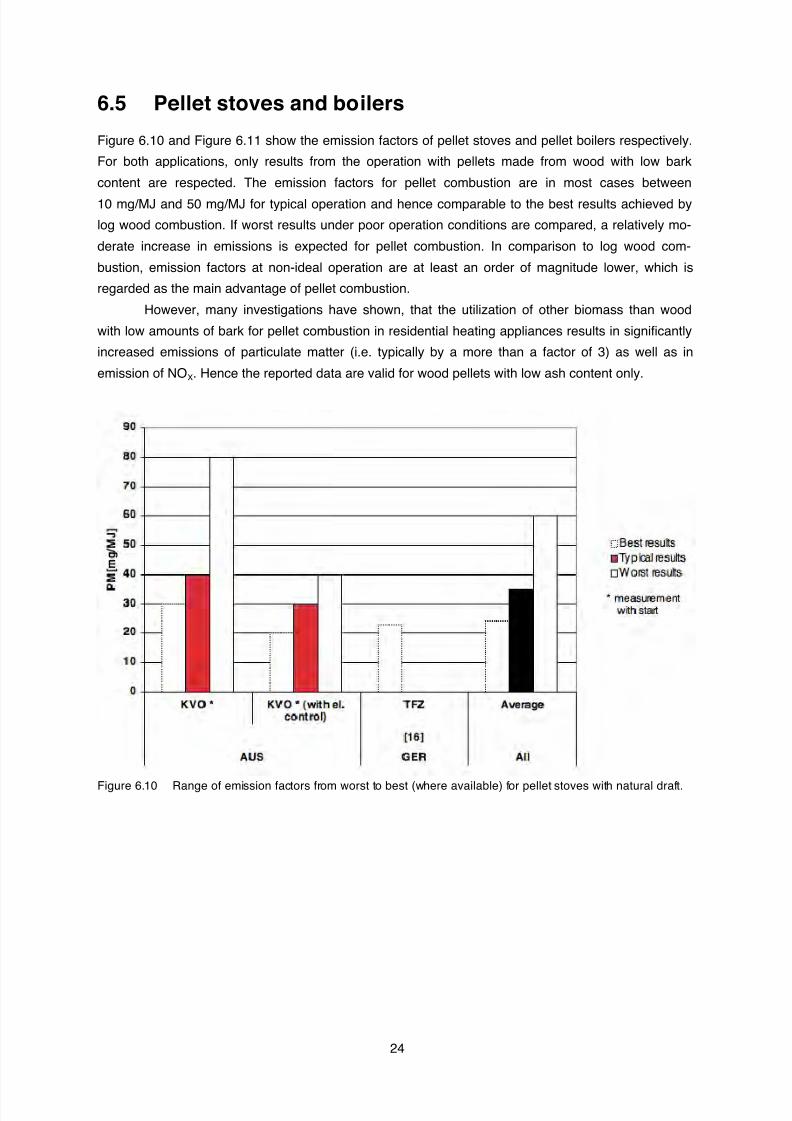
6.5 Pellet stoves and boilers
Figure 6.10 and Figure 6.11 show the emission factors of pellet stoves and pellet boilers respectively.
For both applications, only results from the operation with pellets made from wood with low bark
content are respected. The emission factors for pellet combustion are in most cases between
10 mg/MJ and 50 mg/MJ for typical operation and hence comparable to the best results achieved by
log wood combustion. If worst results under poor operation conditions are compared, a relatively mo-
derate increase in emissions is expected for pellet combustion. In comparison to log wood com-
bustion, emission factors at non-ideal operation are at least an order of magnitude lower, which is
regarded as the main advantage of pellet combustion.
However, many investigations have shown, that the utilization of other biomass than wood
with low amounts of bark for pellet combustion in residential heating appliances results in significantly
increased emissions of particulate matter (i.e. typically by a more than a factor of 3) as well as in
emission of NOX. Hence the reported data are valid for wood pellets with low ash content only.
Figure 6.10 Range of emission factors from worst to best (where available) for pellet stoves with natural draft.
8/14/2019 Particulate emissions from biomass combustion
http://slidepdf.com/reader/full/particulate-emissions-from-biomass-combustion 25/40
25
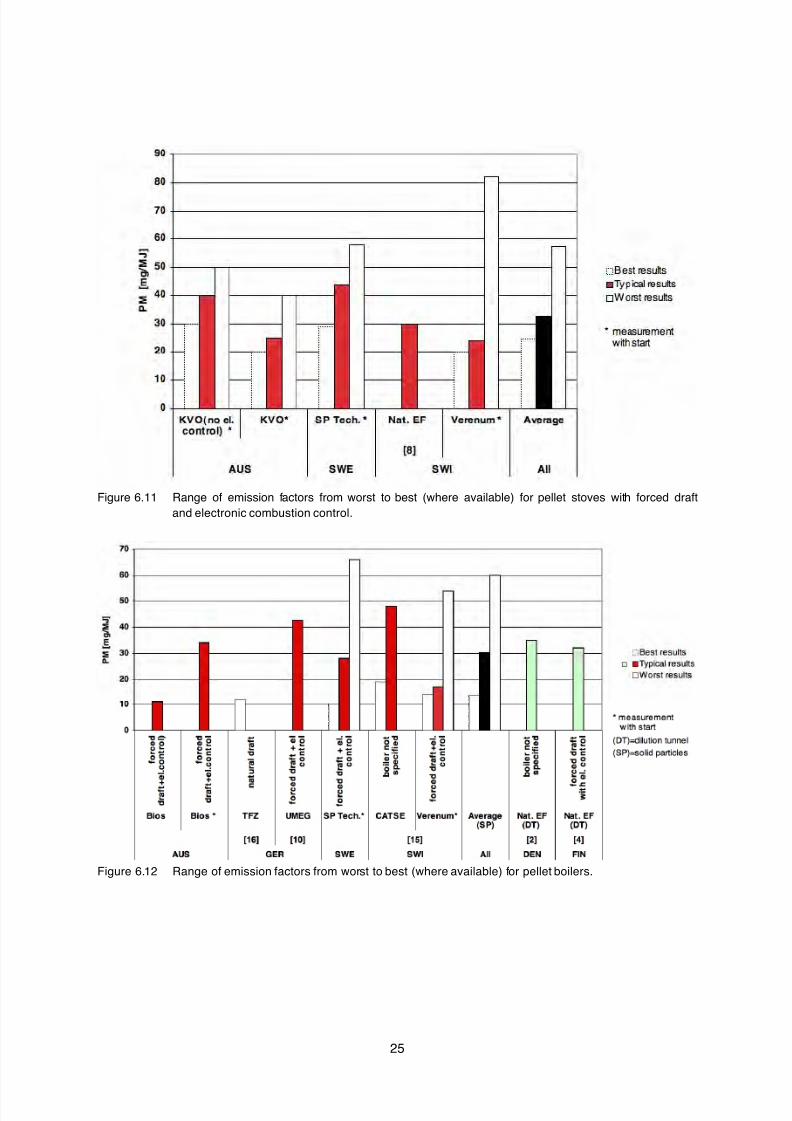
Figure 6.11 Range of emission factors from worst to best (where available) for pellet stoves with forced draftand electronic combustion control.
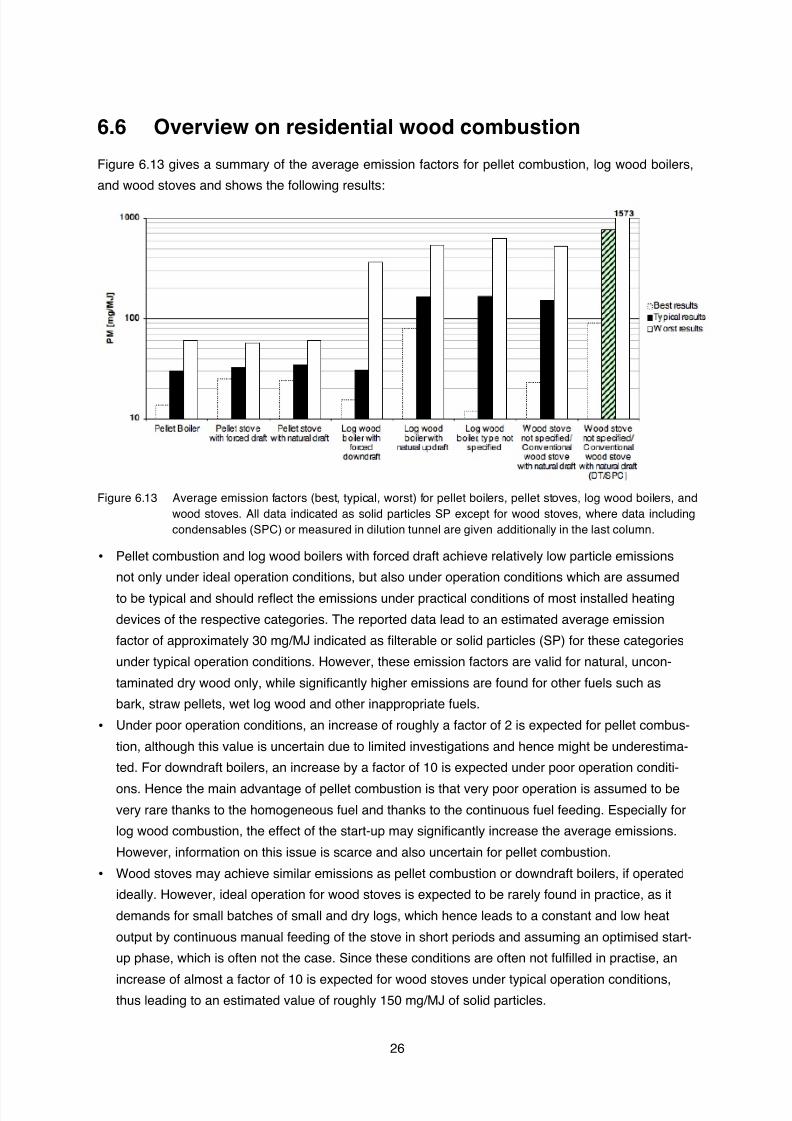
Figure 6.12 Range of emission factors from worst to best (where available) for pellet boilers.
8/14/2019 Particulate emissions from biomass combustion
http://slidepdf.com/reader/full/particulate-emissions-from-biomass-combustion 26/40
26
6.6 Overview on residential wood combustion
Figure 6.13 gives a summary of the average emission factors for pellet combustion, log wood boilers,
and wood stoves and shows the following results:
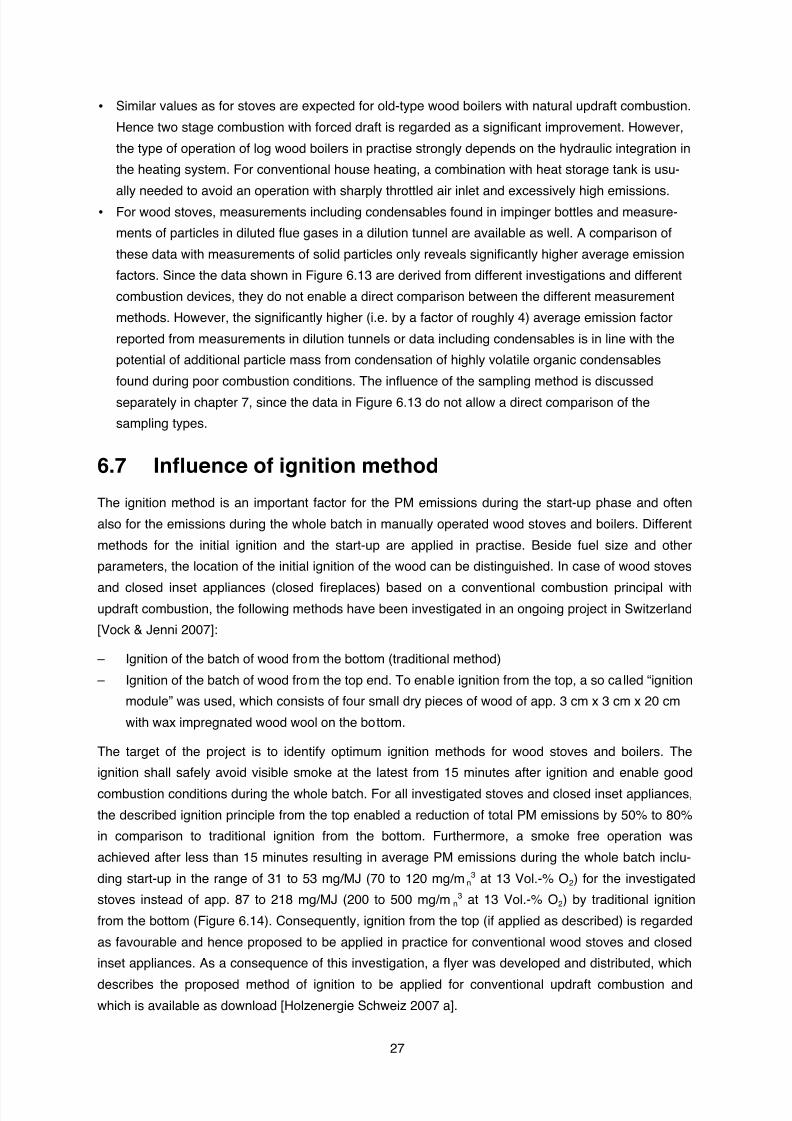
Figure 6.13 Average emission factors (best, typical, worst) for pellet boilers, pellet stoves, log wood boilers, andwood stoves. All data indicated as solid particles SP except for wood stoves, where data includingcondensables (SPC) or measured in dilution tunnel are given additionally in the last column.
• Pellet combustion and log wood boilers with forced draft achieve relatively low particle emissions
not only under ideal operation conditions, but also under operation conditions which are assumed
to be typical and should reflect the emissions under practical conditions of most installed heating
devices of the respective categories. The reported data lead to an estimated average emission
factor of approximately 30 mg/MJ indicated as filterable or solid particles (SP) for these categories
under typical operation conditions. However, these emission factors are valid for natural, uncon-
taminated dry wood only, while significantly higher emissions are found for other fuels such as
bark, straw pellets, wet log wood and other inappropriate fuels.
• Under poor operation conditions, an increase of roughly a factor of 2 is expected for pellet combus-
tion, although this value is uncertain due to limited investigations and hence might be underestima-
ted. For downdraft boilers, an increase by a factor of 10 is expected under poor operation conditi-
ons. Hence the main advantage of pellet combustion is that very poor operation is assumed to bevery rare thanks to the homogeneous fuel and thanks to the continuous fuel feeding. Especially for
log wood combustion, the effect of the start-up may significantly increase the average emissions.
However, information on this issue is scarce and also uncertain for pellet combustion.
• Wood stoves may achieve similar emissions as pellet combustion or downdraft boilers, if operated
ideally. However, ideal operation for wood stoves is expected to be rarely found in practice, as it
demands for small batches of small and dry logs, which hence leads to a constant and low heat
output by continuous manual feeding of the stove in short periods and assuming an optimised start-
up phase, which is often not the case. Since these conditions are often not fulfilled in practise, an
increase of almost a factor of 10 is expected for wood stoves under typical operation conditions,thus leading to an estimated value of roughly 150 mg/MJ of solid particles.
8/14/2019 Particulate emissions from biomass combustion
http://slidepdf.com/reader/full/particulate-emissions-from-biomass-combustion 27/40
27
• Similar values as for stoves are expected for old-type wood boilers with natural updraft combustion.
Hence two stage combustion with forced draft is regarded as a significant improvement. However,
the type of operation of log wood boilers in practise strongly depends on the hydraulic integration in
the heating system. For conventional house heating, a combination with heat storage tank is usu-
ally needed to avoid an operation with sharply throttled air inlet and excessively high emissions.• For wood stoves, measurements including condensables found in impinger bottles and measure-
ments of particles in diluted flue gases in a dilution tunnel are available as well. A comparison of
these data with measurements of solid particles only reveals significantly higher average emission
factors. Since the data shown in Figure 6.13 are derived from different investigations and different
combustion devices, they do not enable a direct comparison between the different measurement
methods. However, the significantly higher (i.e. by a factor of roughly 4) average emission factor
reported from measurements in dilution tunnels or data including condensables is in line with the
potential of additional particle mass from condensation of highly volatile organic condensables
found during poor combustion conditions. The influence of the sampling method is discussed
separately in chapter 7, since the data in Figure 6.13 do not allow a direct comparison of the
sampling types.
6.7 Influence of ignition method
The ignition method is an important factor for the PM emissions during the start-up phase and often
also for the emissions during the whole batch in manually operated wood stoves and boilers. Different
methods for the initial ignition and the start-up are applied in practise. Beside fuel size and other
parameters, the location of the initial ignition of the wood can be distinguished. In case of wood stoves
and closed inset appliances (closed fireplaces) based on a conventional combustion principal withupdraft combustion, the following methods have been investigated in an ongoing project in Switzerland
[Vock & Jenni 2007]:
– Ignition of the batch of wood from the bottom (traditional method)
– Ignition of the batch of wood from the top end. To enable ignition from the top, a so called “ignition
module” was used, which consists of four small dry pieces of wood of app. 3 cm x 3 cm x 20 cm
with wax impregnated wood wool on the bottom.
The target of the project is to identify optimum ignition methods for wood stoves and boilers. The
ignition shall safely avoid visible smoke at the latest from 15 minutes after ignition and enable good
combustion conditions during the whole batch. For all investigated stoves and closed inset appliances,
the described ignition principle from the top enabled a reduction of total PM emissions by 50% to 80%
in comparison to traditional ignition from the bottom. Furthermore, a smoke free operation was
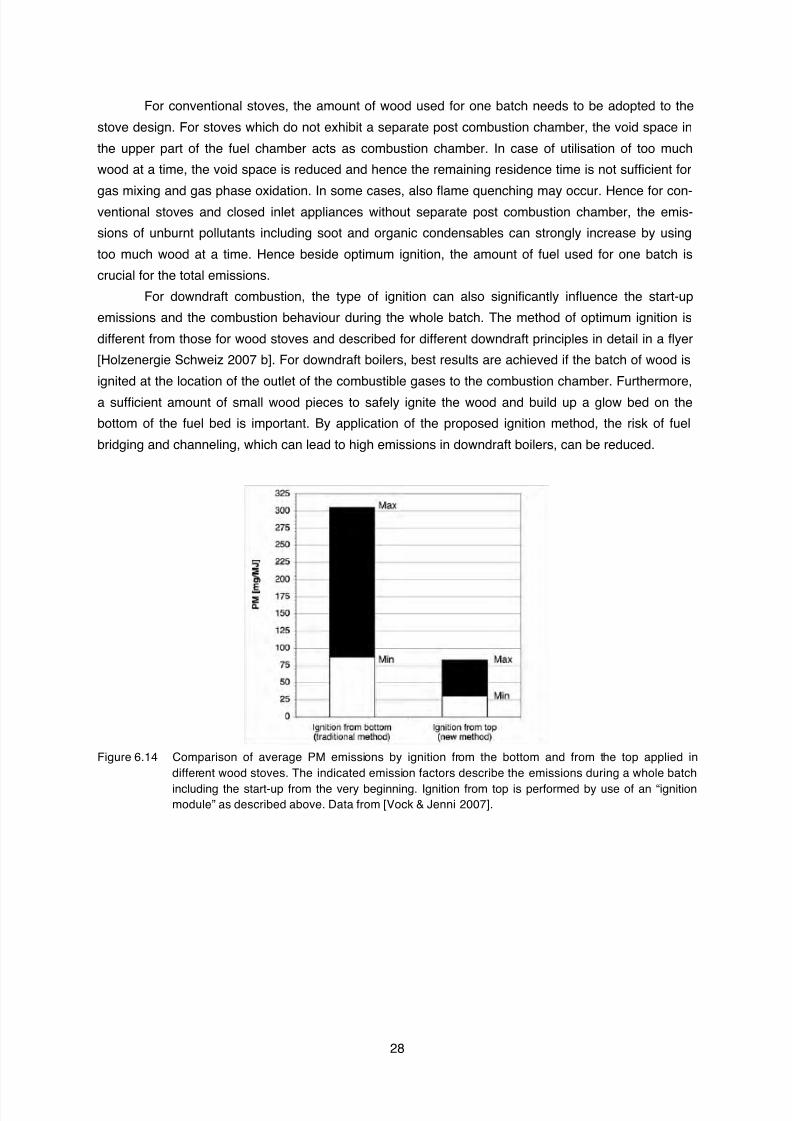
achieved after less than 15 minutes resulting in average PM emissions during the whole batch inclu-
ding start-up in the range of 31 to 53 mg/MJ (70 to 120 mg/mn3 at 13 Vol.-% O2) for the investigated
stoves instead of app. 87 to 218 mg/MJ (200 to 500 mg/mn3 at 13 Vol.-% O2) by traditional ignition
from the bottom (Figure 6.14). Consequently, ignition from the top (if applied as described) is regarded
as favourable and hence proposed to be applied in practice for conventional wood stoves and closed
inset appliances. As a consequence of this investigation, a flyer was developed and distributed, which
describes the proposed method of ignition to be applied for conventional updraft combustion andwhich is available as download [Holzenergie Schweiz 2007 a].
8/14/2019 Particulate emissions from biomass combustion
http://slidepdf.com/reader/full/particulate-emissions-from-biomass-combustion 28/40
28
For conventional stoves, the amount of wood used for one batch needs to be adopted to the
stove design. For stoves which do not exhibit a separate post combustion chamber, the void space in
the upper part of the fuel chamber acts as combustion chamber. In case of utilisation of too much
wood at a time, the void space is reduced and hence the remaining residence time is not sufficient for
gas mixing and gas phase oxidation. In some cases, also flame quenching may occur. Hence for con-ventional stoves and closed inlet appliances without separate post combustion chamber, the emis-
sions of unburnt pollutants including soot and organic condensables can strongly increase by using
too much wood at a time. Hence beside optimum ignition, the amount of fuel used for one batch is
crucial for the total emissions.
For downdraft combustion, the type of ignition can also significantly influence the start-up
emissions and the combustion behaviour during the whole batch. The method of optimum ignition is
different from those for wood stoves and described for different downdraft principles in detail in a flyer
[Holzenergie Schweiz 2007 b]. For downdraft boilers, best results are achieved if the batch of wood is
ignited at the location of the outlet of the combustible gases to the combustion chamber. Furthermore,
a sufficient amount of small wood pieces to safely ignite the wood and build up a glow bed on the
bottom of the fuel bed is important. By application of the proposed ignition method, the risk of fuel
bridging and channeling, which can lead to high emissions in downdraft boilers, can be reduced.
Figure 6.14 Comparison of average PM emissions by ignition from the bottom and from the top applied indifferent wood stoves. The indicated emission factors describe the emissions during a whole batch
including the start-up from the very beginning. Ignition from top is performed by use of an “ignitionmodule” as described above. Data from [Vock & Jenni 2007].
8/14/2019 Particulate emissions from biomass combustion
http://slidepdf.com/reader/full/particulate-emissions-from-biomass-combustion 29/40
29
6.8 Automatic biomass combustion plants
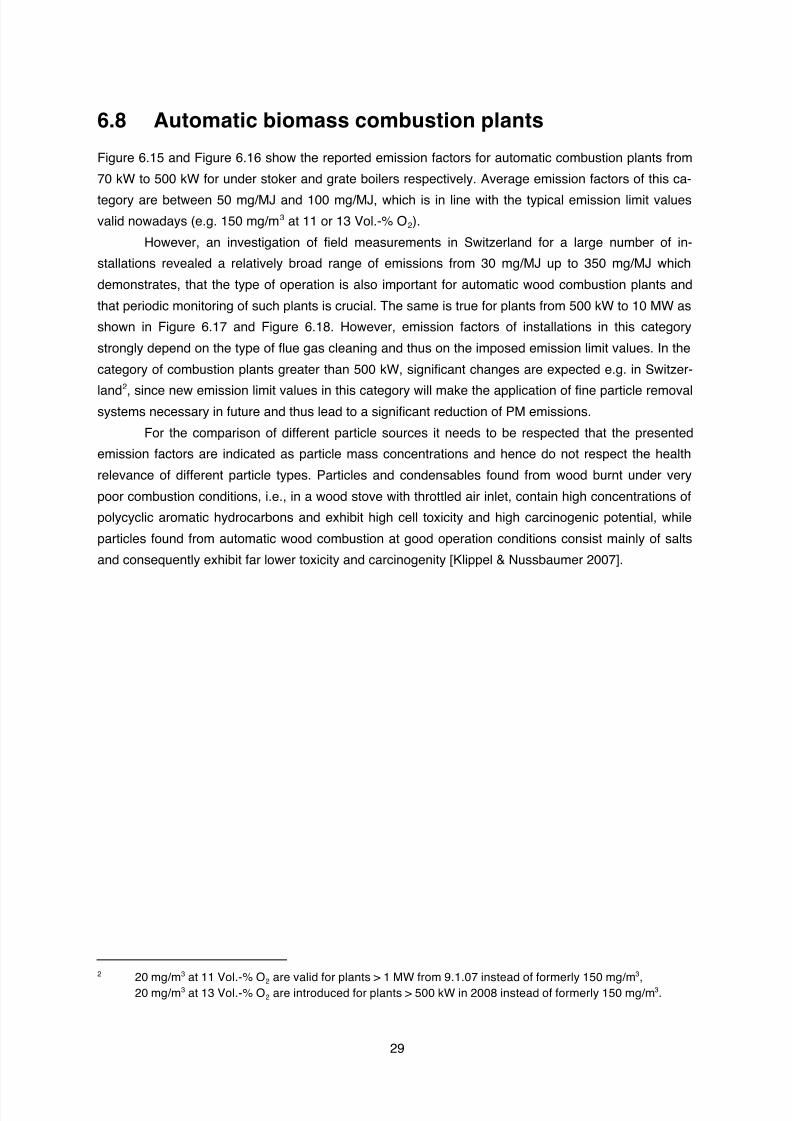
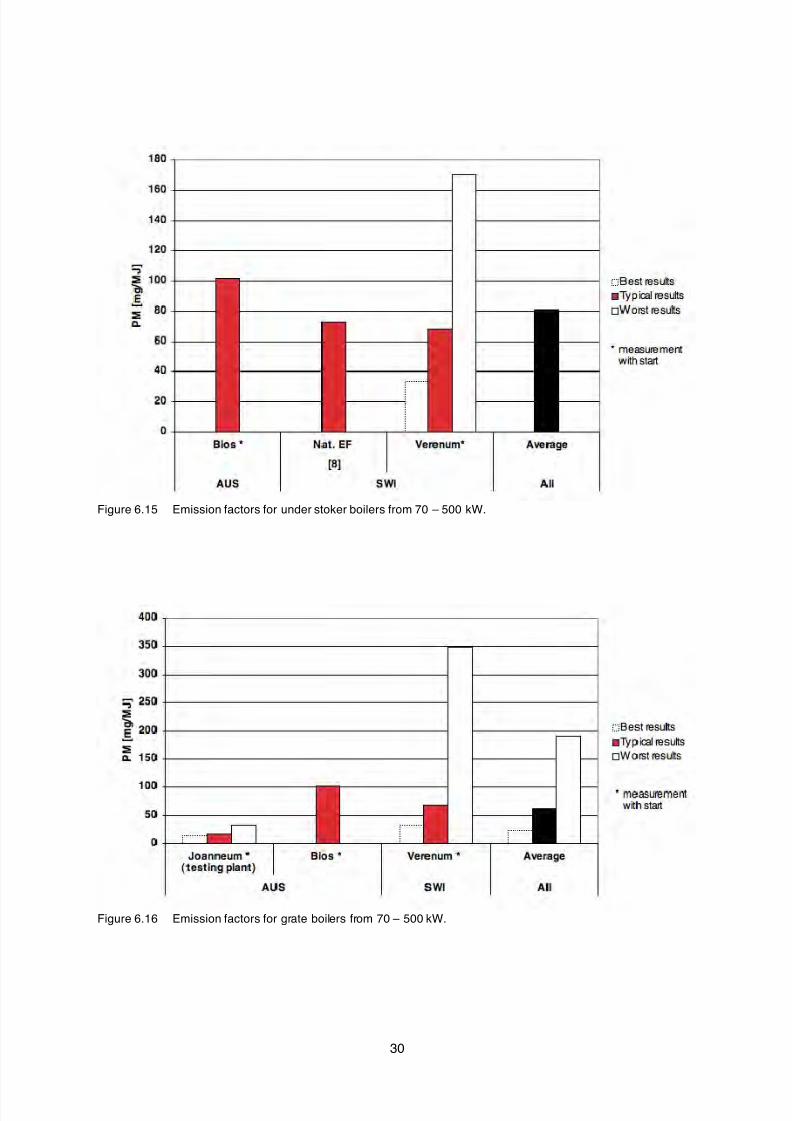
Figure 6.15 and Figure 6.16 show the reported emission factors for automatic combustion plants from
70 kW to 500 kW for under stoker and grate boilers respectively. Average emission factors of this ca-
tegory are between 50 mg/MJ and 100 mg/MJ, which is in line with the typical emission limit valuesvalid nowadays (e.g. 150 mg/m3 at 11 or 13 Vol.-% O2).
However, an investigation of field measurements in Switzerland for a large number of in-
stallations revealed a relatively broad range of emissions from 30 mg/MJ up to 350 mg/MJ which
demonstrates, that the type of operation is also important for automatic wood combustion plants and
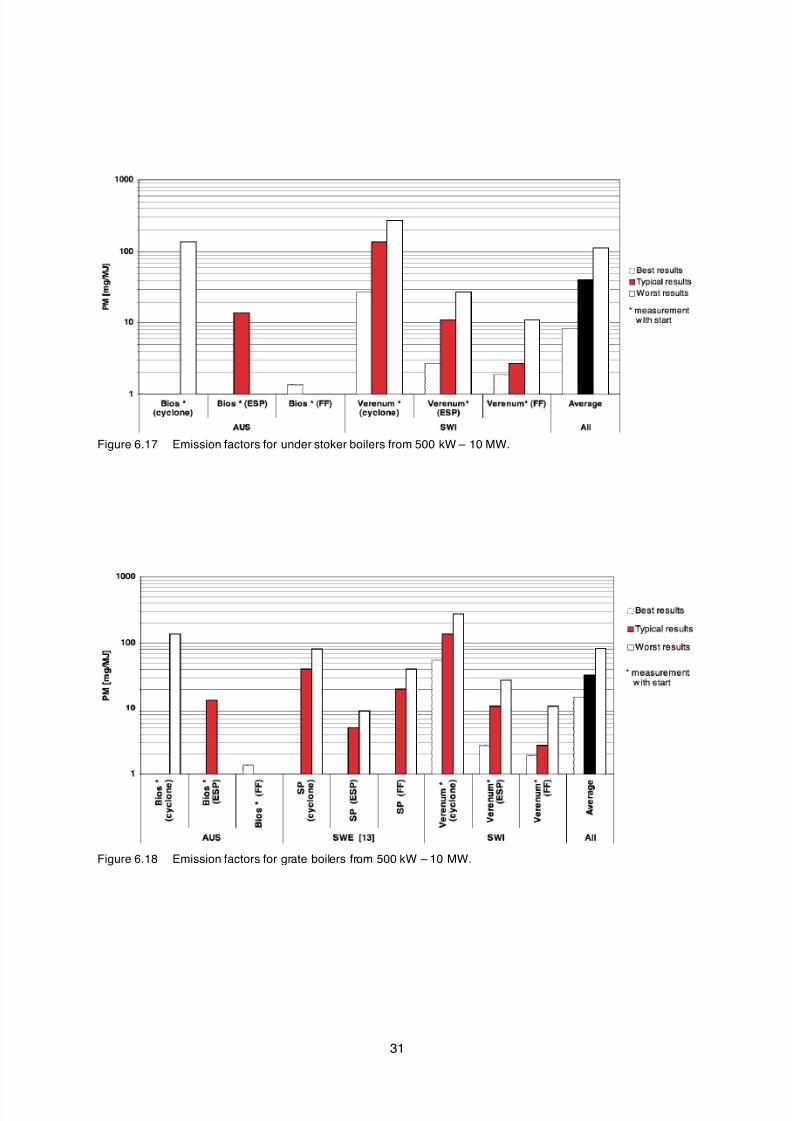
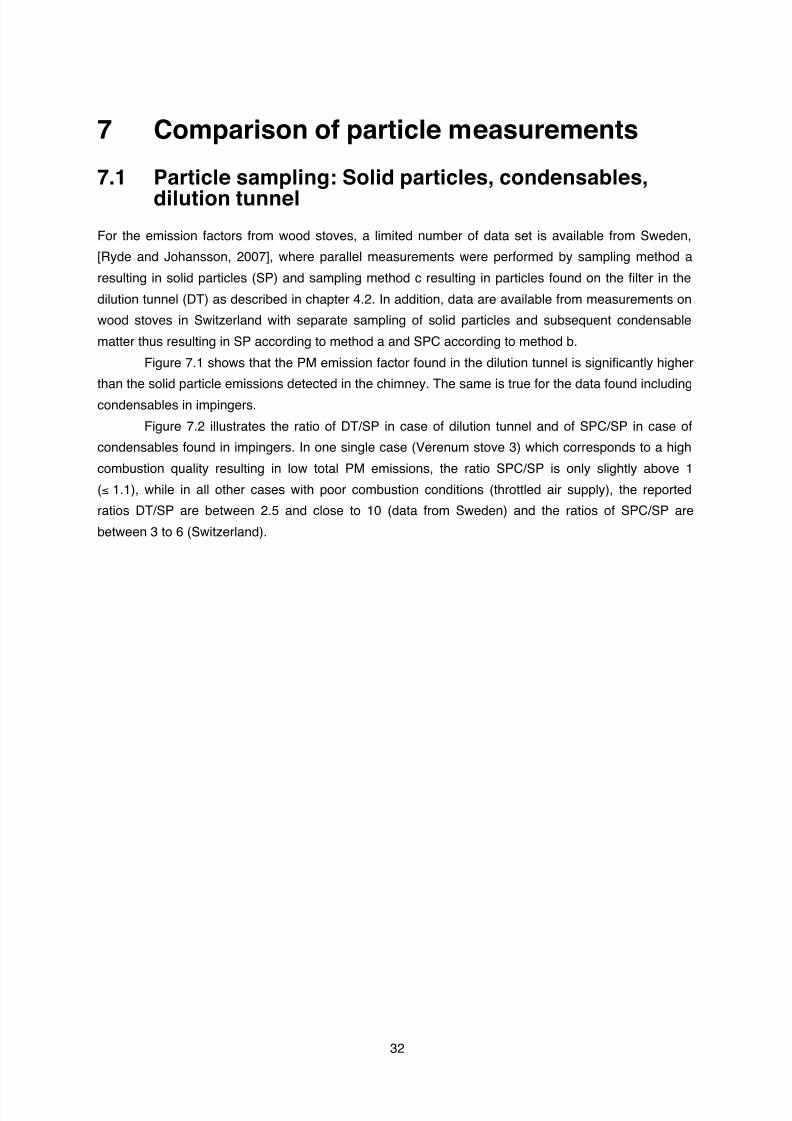
that periodic monitoring of such plants is crucial. The same is true for plants from 500 kW to 10 MW as
shown in Figure 6.17 and Figure 6.18. However, emission factors of installations in this category
strongly depend on the type of flue gas cleaning and thus on the imposed emission limit values. In the
category of combustion plants greater than 500 kW, significant changes are expected e.g. in Switzer-
land2
, since new emission limit values in this category will make the application of fine particle removalsystems necessary in future and thus lead to a significant reduction of PM emissions.
For the comparison of different particle sources it needs to be respected that the presented
emission factors are indicated as particle mass concentrations and hence do not respect the health
relevance of different particle types. Particles and condensables found from wood burnt under very
poor combustion conditions, i.e., in a wood stove with throttled air inlet, contain high concentrations of
polycyclic aromatic hydrocarbons and exhibit high cell toxicity and high carcinogenic potential, while
particles found from automatic wood combustion at good operation conditions consist mainly of salts
and consequently exhibit far lower toxicity and carcinogenity [Klippel & Nussbaumer 2007].
2
20 mg/m
3
at 11 Vol.-% O2 are valid for plants > 1 MW from 9.1.07 instead of formerly 150 mg/m
3
,20 mg/m3 at 13 Vol.-% O2 are introduced for plants > 500 kW in 2008 instead of formerly 150 mg/m3.
8/14/2019 Particulate emissions from biomass combustion
http://slidepdf.com/reader/full/particulate-emissions-from-biomass-combustion 30/40
30
Figure 6.15 Emission factors for under stoker boilers from 70 – 500 kW.
Figure 6.16 Emission factors for grate boilers from 70 – 500 kW.
8/14/2019 Particulate emissions from biomass combustion
http://slidepdf.com/reader/full/particulate-emissions-from-biomass-combustion 31/40
31
Figure 6.17 Emission factors for under stoker boilers from 500 kW – 10 MW.
Figure 6.18 Emission factors for grate boilers from 500 kW – 10 MW.
8/14/2019 Particulate emissions from biomass combustion
http://slidepdf.com/reader/full/particulate-emissions-from-biomass-combustion 32/40
32
7 Comparison of particle measurements
7.1 Particle sampling: Solid particles, condensables,
dilution tunnel
For the emission factors from wood stoves, a limited number of data set is available from Sweden,
[Ryde and Johansson, 2007], where parallel measurements were performed by sampling method a
resulting in solid particles (SP) and sampling method c resulting in particles found on the filter in the
dilution tunnel (DT) as described in chapter 4.2. In addition, data are available from measurements on
wood stoves in Switzerland with separate sampling of solid particles and subsequent condensable
matter thus resulting in SP according to method a and SPC according to method b.
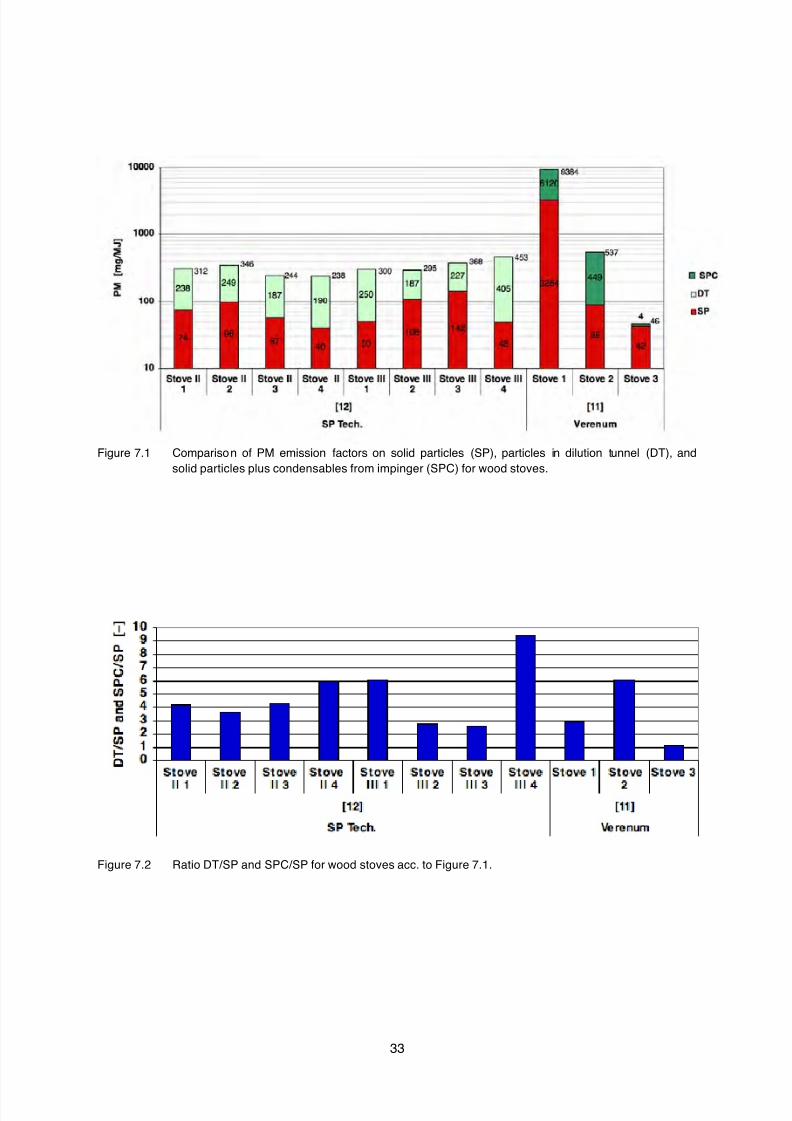
Figure 7.1 shows that the PM emission factor found in the dilution tunnel is significantly higher
than the solid particle emissions detected in the chimney. The same is true for the data found including
condensables in impingers.
Figure 7.2 illustrates the ratio of DT/SP in case of dilution tunnel and of SPC/SP in case of
condensables found in impingers. In one single case (Verenum stove 3) which corresponds to a high
combustion quality resulting in low total PM emissions, the ratio SPC/SP is only slightly above 1
(≤ 1.1), while in all other cases with poor combustion conditions (throttled air supply), the reported
ratios DT/SP are between 2.5 and close to 10 (data from Sweden) and the ratios of SPC/SP are
between 3 to 6 (Switzerland).
8/14/2019 Particulate emissions from biomass combustion
http://slidepdf.com/reader/full/particulate-emissions-from-biomass-combustion 33/40
33
Figure 7.1 Comparison of PM emission factors on solid particles (SP), particles in dilution tunnel (DT), andsolid particles plus condensables from impinger (SPC) for wood stoves.
Figure 7.2 Ratio DT/SP and SPC/SP for wood stoves acc. to Figure 7.1.
8/14/2019 Particulate emissions from biomass combustion
http://slidepdf.com/reader/full/particulate-emissions-from-biomass-combustion 34/40
34
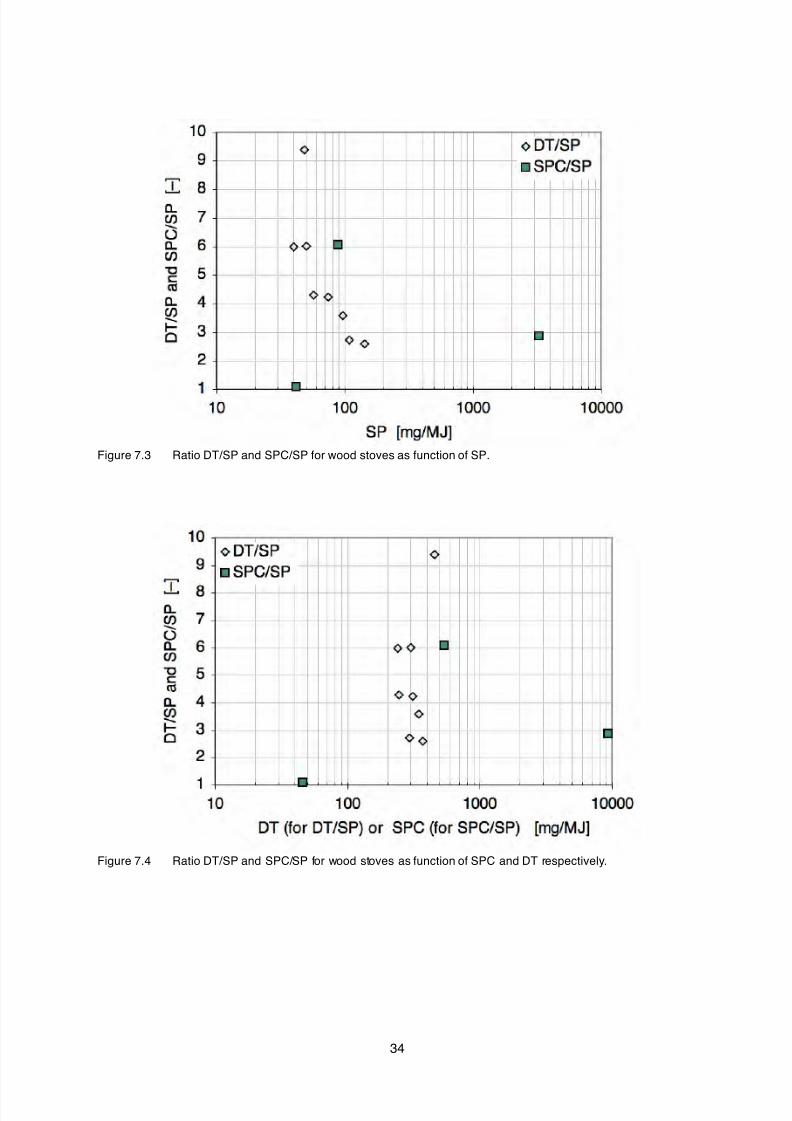
Figure 7.3 Ratio DT/SP and SPC/SP for wood stoves as function of SP.
Figure 7.4 Ratio DT/SP and SPC/SP for wood stoves as function of SPC and DT respectively.
8/14/2019 Particulate emissions from biomass combustion
http://slidepdf.com/reader/full/particulate-emissions-from-biomass-combustion 35/40
35
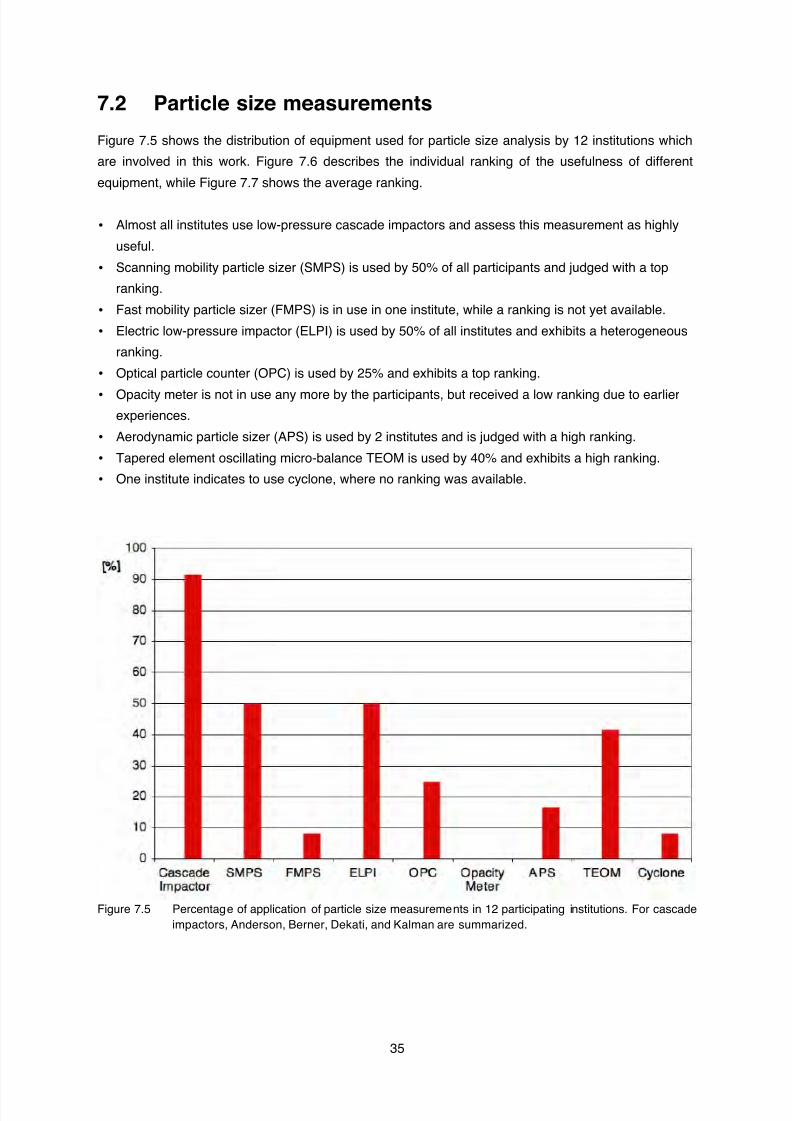
7.2 Particle size measurements
Figure 7.5 shows the distribution of equipment used for particle size analysis by 12 institutions which
are involved in this work. Figure 7.6 describes the individual ranking of the usefulness of different
equipment, while Figure 7.7 shows the average ranking.
• Almost all institutes use low-pressure cascade impactors and assess this measurement as highly
useful.
• Scanning mobility particle sizer (SMPS) is used by 50% of all participants and judged with a top
ranking.
• Fast mobility particle sizer (FMPS) is in use in one institute, while a ranking is not yet available.
• Electric low-pressure impactor (ELPI) is used by 50% of all institutes and exhibits a heterogeneous
ranking.
• Optical particle counter (OPC) is used by 25% and exhibits a top ranking.
• Opacity meter is not in use any more by the participants, but received a low ranking due to earlierexperiences.
• Aerodynamic particle sizer (APS) is used by 2 institutes and is judged with a high ranking.
• Tapered element oscillating micro-balance TEOM is used by 40% and exhibits a high ranking.
• One institute indicates to use cyclone, where no ranking was available.
Figure 7.5 Percentage of application of particle size measurements in 12 participating institutions. For cascadeimpactors, Anderson, Berner, Dekati, and Kalman are summarized.
8/14/2019 Particulate emissions from biomass combustion
http://slidepdf.com/reader/full/particulate-emissions-from-biomass-combustion 36/40
36
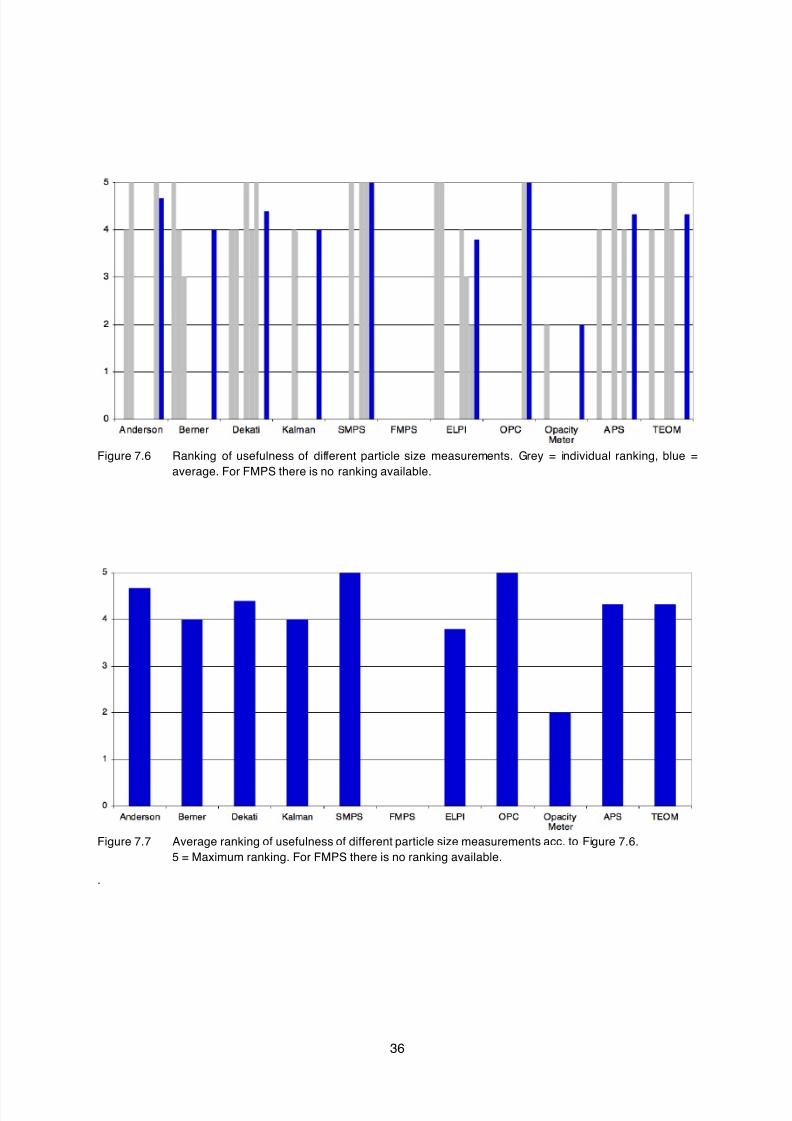
Figure 7.6 Ranking of usefulness of different particle size measurements. Grey = individual ranking, blue =average. For FMPS there is no ranking available.
Figure 7.7 Average ranking of usefulness of different particle size measurements acc. to Figure 7.6.5 = Maximum ranking. For FMPS there is no ranking available.
.
8/14/2019 Particulate emissions from biomass combustion
http://slidepdf.com/reader/full/particulate-emissions-from-biomass-combustion 37/40
37
8 Conclusions
Data on emission factors of residential wood combustion have been collected from 17 institutions in
seven IEA countries. Huge ranges of emission factors are reported for residential wood combustion,
while emission factors of medium and large scale applications mainly depend on particle removal
equipment, related to national or local emission limit values. Consequently, conclusions from the
present study mainly focus on residential applications
• The reported emission factors from manual wood combustion devices exhibit huge ranges from
less than 20 mg/MJ under ideal conditions up to more than 5 000 mg/MJ under poor conditions
(data refer to end energy indicated as lower heating value). Even national emission factors vary
from less than 100 mg/MJ (measured as solid particles in the chimney) up to almost 2 000 mg/MJ
(measured in a dilution tunnel).
• For wood stoves, huge ranges are found due to different operation conditions. Consequently, high
priority should be given to avoid inappropriate operation of manual wood combustion appliances.Excessive PM emissions are found during smoldering conditions at reduced load and at throttled
air supply. This type of operation is not recommended, but nevertheless seems to be relevant in
practical operation in many countries. In many cases, the start-up phase is responsible for more
than 50% of the total PM emissions of a whole batch. Hence measures for optimisation of the start-
up are very important. For conventional wood stoves and closed inset appliances, a comparison of
different ignition methods in Switzerland showed, that ignition from the top enables a reduction of
50% to 80% of the PM emissions in comparison to ignition of the whole batch from the bottom.
Consequently, this method is being proposed for application in practice.
• For wood boilers, excessive PM emissions are reported for boilers operated without heat storagetank. This is in line with the observation found in stoves, since boiler operation for house heating
applied without heat storage tank often leads to part load combustion. Hence, heat storage tanks
are mandatory for log wood boilers in Switzerland, except if the boiler does achieve the emission
limit values at constant heat demand of maximum 30% of the nominal load, which is possible for
pellet boilers but not realistic for log wood boilers. To avoid poor operation of log wood boilers,
similar regulations are recommended, which might not disable new technical solutions in future. In
Sweden, emission limits imply heat storage tanks for new installations, in practice it is mandatory
today, but in the future other technical solutions might fulfil the emission regulations. For log wood
boilers with downdraft principle, optimised ignition can reduce the risk of bridging and channelling in
the fuel bed, which is a current reason for high emissions in such boilers.• For residential wood boilers, the type of combustion is also significantly influencing the PM emis-
sion. Modern boilers with forced downdraft combustion and electronic combustion control devices
enable low particle emissions under appropriate combustion conditions, while old-type boilers with
updraft combustion exhibit higher emissions under similar conditions. However, the influence of
operation mode cannot be evaluated in detail based on the reported data.
• For pellet boilers and stoves, typical particle emissions of around 30 mg/MJ are reported with a
relatively narrow variation from 10 mg/MJ to 50 mg/MJ. Hence, the total PM emissions under typi-
cal operation conditions are expected to be far lower than for manual wood stoves. The problem of
variations between ideal operation and inappropriate operation are certainly less emphasized thanin manual boilers, although data on poorly operated pellet combustion are scarce and hence the
8/14/2019 Particulate emissions from biomass combustion
http://slidepdf.com/reader/full/particulate-emissions-from-biomass-combustion 38/40
38
upper range from pellet combustion is uncertain. It should be noted that the market for pellets is
growing and the production of second grade quality pellets with higher ash content will increase.
The use of these pellets in small-scale equipment without secondary particle reduction will result in
higher emissions. Thus, good quality pellets should be reserved for domestic scale applications.
• For automatic combustion plants, the emission factors for plants without electrostatic precipitator(ESP) or fabric filter (FF) are relatively high, i.e. typically between 50 to 100 mg/MJ, which, under
good combustion conditions, is attributed to high emissions of inorganic particles. Hence clean gas
emissions strongly depend on the type of flue gas cleaning applied, which depends on national or
local emission standards. In many European countries, emission limit values for such applications
have recently been sharpened and hence the situation of typical PM emissions will change in many
countries in the future, since particle removal enable clean gas emissions of typically smaller than
30 mg/MJ (simple ESP) or smaller than 10 mg/MJ (improved ESP or FF).
• For the comparison of different data, the sampling and measurement procedure needs to be con-
sidered. In the present study, three types of data are distinguished: Filterable, solid particles (SP)
collected on heated filters, solid particles plus condensables found by liquid quenching at roomtemperature (SPC), and particulate matter sampled in cold, diluted flue gas in a dilution tunnel (DT).
A comparison between SP and SPC shows that the mass of condensables may significantly ex-
ceed the mass of solid particles during poor combustion conditions in wood stoves. A comparison
between results from a dilution tunnel with sampling in the chimney reveals significantly higher
concentrations in the diluted flue gas and thus shows, that condensables are partially or quanti-
tatively found as filterable material after dilution of the flue gas with cold air. Consequently, PM
immission inventories based on emission factors of solid particles may significantly underestimate
the contribution of biomass to PM in the ambient air. This is in line with results from immission
measurements, where a higher contribution from wood combustion is found than expected from
emission factors used in Switzerland [Prévot et al. 2006]. In addition, data reported from countries
with regulations on solid particles as e.g. Germany, Austria, and Switzerland, cannot be directly
compared with data reported from countries using dilution tunnels as e.g. Norway. Consequently,
the type of measurement is indicated in all results presented in this survey and it is recommended
to clearly indicate the type of measurement for future emission inventories.
• Since condensables from wood combustion have been identified as highly toxic and since they can
significantly contribute to total PM in the ambient air, it is recommended to use emission data in-
cluding condensable PM in immission studies (SPC or DT in this report). Furthermore, since or-
ganic condensables are highly toxic, while solid particle can exhibit low toxicity (in case of salts) or
high toxicity (in case of particles from incomplete combustion), a separate measurement of bothparameters is regarded as advantageous. However, measurement of solid particles only is less
equipment and time consuming and still gives a performance value for PM emissions for compa-
rison of different combustion appliances.
• A survey on equipment used for particle size measurement reveals that nowadays low-pressure
cascade impactors are used in almost all laboratories dealing with particle measurement. In addi-
tion, half of the participating institutions use scanning mobility particle sizer (SMPS) and/or electric
low-pressure impactor (ELPI). Further, optical particle counter (OPC), aerodynamic particle sizer
(APS), and tapered element oscillating micro-balance (TEOM) are currently used.
8/14/2019 Particulate emissions from biomass combustion
http://slidepdf.com/reader/full/particulate-emissions-from-biomass-combustion 39/40
39
9 References
9.1 Literature
Dockery D., C. Pope, X. Xu, J. Spengler, J. Ware, M. Fay, B. Ferris, F. Speizer. (1993): An associationbetween air pollution and mortality in six U.S. Cities. The New England J. of Medicine , Vol. 329, pp.1753-1759.
Donaldson K., Brown D., Clouter A., Duffin R., MacNee W., Renwick L., Tran L., Stone V. (2002): Thepulmonary toxicology of ultrafine particles. Journal of Aerosol Medicine, 15(2), pp. 213-20
EPA: http://www.epa.gov/air/oaqps/efactors.html (access to site: 07/10/07)EPA: National Ambient Air Quality Standards (NAAQS), http://www.epa.gov/air/criteria.html, 6/20/07,EPA: What is PM: www.epa.gov/NE/airquality/pm-what-is.html, 21.1.08Hausammann, B.: Beurteilung der Vergleichbarkeit verschiedener Messverfahren zur Bestimmung der
Partikelgrössenverteilung von Feinstäuben aus Verbrennungsprozessen, Diplomarbeit ETH Züricham Departement UMNW bei T. Nussbaumer und U. Lohmann, Zürich 2006
Hinds, W.: Aerosol Technology, Second Edition, John Wiley & Sons, New York, 1999Holzenergie Schweiz (2007 a): Richtig Anfeuern – Holzfeuerungen mit oberem Abbrand . Publikation
Nr. 315, Holzenergie Schweiz, Zürich 2007, www.holzenergie.chHolzenergie Schweiz (2007 b): Richtig Anfeuern – Holzfeuerungen mit unterem Abbrand . Publikation
Nr. 316, Holzenergie Schweiz, Zürich 2007, www.holzenergie.chJokiniemi, J.: Aerosol sampling and measurement techniques with a special focus on small-scale bio-
mass combustion systems, 3rd International Workshop on Aerosols from Biomass Combustion,International Energy Agency (IEA) Bioenergy Task 32, Jyväskylä (Finland), 3 September 2007,www.ieabcc.nl
Kaufmann, H.; Nussbaumer, T.; Baxter, L.; Yang, N.: Deposit formation on a single cylinder duringcombustion of herbaceous biomass. Fuel 2000, 79, 141-151.
Klippel, N.; Nussbaumer, T.: Health relevance of particles from wood combustion in comparison toDiesel soot, 15th European Biomass Conference, International Conference Centre, Berlin 7–11
May 2007 (a)Klippel, N.; Nussbaumer, T.: Einfluss der Betriebsweise auf die Partikelemissionen von Holzöfen,
Bundesamt für Energie und Bundesamt für Umwelt, Schlussbericht, Zürich 2007, ISBN 3-908705-12-6, 2007 (b)
Nordic Council of Ministers, Sternhufvud C., Karvosenoja N., Illerup J., Kindbom K., Lükewille A., Jo-hannson M., Jensen D., Particulate matter emissions and abatement options in residential woodburning in the Nordic Countries, Copenhagen 2004; p. 34
Norwegian standard NS 3058-2 June 1994, Enclosed wood heaters Smoke emission, Part 2: De-termination of particulate emission
Nussbaumer, T.: Combustion and Co-combustion of Biomass: Fundamentals, Technologies, and Pri-mary Measures for Emission Reduction, Energy & Fuels, Vol. 17, No 6, 2003, 1510–1521
Nussbaumer, T.: Overview on particles from biomass combustion, 14th European Biomass Confe-
rence, Paris, 17-21 October 2005Pagels, J.; Johansson, L.; Hagström, M.; Szpila, A.; Bohgard, M.; Tullin, C.; Sanati, M.: Intercompa-rison of SMPS, ELPI and APS 3320 during sampling of particles emitted from a domestic woodpellet burner, 6th international Aerosol Conference, September 8-13, 2002, Taipei, Taiwan
Prévôt, A.; Wehrli, M.; Alfarra, M.; Lanz, V.; Szidat, S.; Hueglin, C.; Gehrig, R.; Sandradewi, J.; Wei-mer, S.; Baltensperger, U.: The high PM10 episode in January/ February 2006, 10. International ETH-Conference on Combustion Generated Nanoparticles , Zürich, 21 - 23 August 2006
Ryde, D. och Johansson, L., Partikelmätning vid vedeldning -Jämförelse mellan provtagning i skorsten och spädtunnel , Slutrapport för Energimyndighetsprojekt nr 30207-1, SP Arbetsrapport 2007:15,Juli 2007, Borås (In Swedish, summary in English)
UBA: Hintergrundpapier zum Thema Staub/Feinstaub (PM), Umweltbundesamt Berlin, 2005; p.3Vock, W.; Jenni, A.: Bericht zur 1. und 2. Mess-Serie: Emissionsarme Anfeuermethoden für Stückholz-
feuerungen , Bundesamt für Energie, Bundesamt für Umwelt, Kantone AG, BE, BL/BS, LU, SH, SG,SO, TG, TI, VD, ZH, Maschwanden, 10. Juli 2007
8/14/2019 Particulate emissions from biomass combustion
http://slidepdf.com/reader/full/particulate-emissions-from-biomass-combustion 40/40
World Health Organization (WHO): Airquality Guidelines for particulate matter, ozone, nitrogen, dioxideand sulphur dioxide, Global Update 2005, 2006
World Health Organization (WHO): Health Aspects of Air Pollution, Results from the WHO Project„Systematic Review of Health Aspects of Air Pollution in Europe), 2004; p 10
9.2 Sources of emission factors cited in figures[1] Austrian FEA (Federal Environmental Agency) 2004[2] J.B. Illerup & M. Nielsen, National Environmental Research Institute, Improved PM Emissions
Inventory for residential wood combustion, Roskilde 2004[3] C. Sternhuvud, N. Karvosenoja, J. Illerup, K. Kindbom, A. Lükewllle, M. Johansson, D. Jensen,
Nordic Council of Ministers, Particulate matter emissions and abatement options in residentialwood burning in the Nordic Countries, Statistics Finland, 2001 (estimation of emission factorsbased on literature), Copenhagen 2004, p. 31
[4] N. Karvosenoja, Finnish Environement Institute (SYKE), [email protected], State-ment: table of new emission factors which are at this point not yet in use, 21. Aug. 2007
[5] M. Struschka, U. Zuberbühler, A. Dreiseidler, D. Dreizler, G. Baumbach, H. Hartmann, V. Schmid,H. Link, German Federal Environmental Agency (FEA), Ermittlung und Evaluierung der Fein-staubemissionen aus Kleinfeuerungsanlagen im Bereich der Haushalte und Kleinverbrauchersowie Ableitung von geeigneten Massnahmen zur Emissionsminderung, Berlin 2003
[6] C. Sternhuvud, N. Karvosenoja, J. Illerup, K. Kindbom, A. Lükewllle, M. Johansson, D. Jensen,Nordic Council of Ministers, Particulate matter emissions and abatement options in residentalwood burning in the Nordic Countries, Average value for traditional stoves, new stoves andfireplaces, Copenhagen 2004, p. 31
[7] C. Sternhuvud, N. Karvosenoja, J. Illerup, K. Kindbom, A. Lükewllle, M. Johansson, D. Jensen,Nordic Council of Ministers, Particulate matter emissions and abatement options in residentalwood burning in the Nordic Countries, Expert judgement based on ongoing measurementprojects, Copenhagen 2004, p. 31
[8] Swiss Federal Office for the Environment (FOEN), Arbeitsblatt Emissionsfaktoren (Stand Oktober2005), Bern 2006
[9] M. Hobson, G. Thistlethwaite, Emission factors programme Task 7 - Review of Residential &Small-Scale Commercial Combustion Sources, Oxon 2003
[10] Umweltmessungen, Umwelterhebungen und Gerätesicherheit (UMEG), Emissionsmessungen anHolzfeuerungsanlagen im Regelungsbereich der 1. BImSchV, Feldmessprogramm in Baden-Württemberg, Heizperiode 2002/2003, Baden-Württemberg 2003
[11] N. Klippel, T. Nussbaumer, Einfluss der Betriebsweise auf die Partikelemission von Holzöfen,Zürich 2007
[12] D. Ryde, L. Johansson, SP Sveriges Tekniska Forskningsinstitut, Partikelmätning vid vedldning -Jämförelse mellan provtagning i skorsten och spädtunnel, Borås 2007
[13] J. Todorović, H. Broden, N. Padban, S. Lange, L. Gustavsson, L.,Johansson, S. Paulrud, B. Löf-gren, “Syntes och analys av emissionsfaktorer för småskalig biobränsleförbränning” Slutrapport för avtal 503 0506 och 503 0507 på Naturvårdsverket. Nyköping, Borås, Stockholm, 2007 (In
Swedish, summary in English)[14] M. Wörgetter, W. Moser, Austrian Bioenergy & FJ/BLT, Emissionsbilanz von Holzfeuerungenkleiner Leistung in Niederösterriech, Wieselburg 2005
[15] C. Gaegauf, M. Schmid, P. Güntert, Ökozentrum Langenbruck, Elemental and Organic carbon inFlue Gas Particles of Various Wood Combustion Systems, Langenbruck 2005
[16] H. Hartmann, K. Reisinger, K. Thuneke, A. Höldrich, P. Rossmann, Handbuch Bioenergie-Klein-anlagen, Fachagentur nachwachsende Rohstoffe e. V., Rostock 2007
[17] G. Baumbach, Feinstaubemissionenbei der Verbrennung von Biomasse, Vortrag bei derGVC/DECHMA-Jahrestagung 2005, Wiesbaden 7.9.2005