particulate matter in the atmosphere: which particle
TRANSCRIPT

Ž .The Science of the Total Environment 249 2000 85]101
Particulate matter in the atmosphere: which particleproperties are important for its effects on health?
Roy M. HarrisonU, Jianxin Yin
Di ision of En¨ironmental Health and Risk Management, Uni ersity of Birmingham, Edgbaston, Birmingham B15 2TT, UK
Abstract
Whilst epidemiological studies have consistently demonstrated adverse effects of particulate matter exposure onhuman health, the mechanism of effect is currently unclear. One of the major issues is whether the toxicity of theparticles resides in some particular fraction of the particles as defined by chemical composition or size. This articlereviews selected data on the major and minor component composition of PM and PM particulate matter showing2.5 10quite major geographic variations in composition which are not reflected in the exposure-response coefficientsdetermined from the epidemiology which show remarkably little spatial variation. The issue of particle size is moredifficult to address due to the scarcity of data. Overall, the data presented provides little support for the idea that anysingle major or trace component of the particulate matter is responsible for the adverse effects. The issue of particlesize is currently unclear and more research is warranted. Q 2000 Elsevier Science B.V. All rights reserved.
Keywords: Airborne particulate matter; PM ; Human health10
1. Introduction
The London smog of December 1952 is esti-mated to have caused some 4000 excess deaths.The air pollutant concentrations judged againstthose of today in the same city were quite as-tronomic. Concentrations of black smoke ex-
U Corresponding author. Tel.: q44-121-414-3494; fax: q44-121-414-3709.
Ž .E-mail address: [email protected] R.M. Harrison
ceeded 1600 mg my3 and of sulfur dioxide 700ppb. The source of pollution was the burning ofbituminous coal, mainly in domestic fireplaces,which is a source of both smoke and sulfur diox-ide. Due to the very strong correlation of the twopollutants in all air pollution episodes at the time,there was little prospect of disentangling the ef-fects of the two pollutants through epidemiologi-cal work, and the effects were ascribed to themixture, with the World Health Organisation in
Žits 1987 Air Quality Guidelines for Europe WHO,.1987 setting a joint standard for black smoke
0048-9697r00r$ - see front matter Q 2000 Elsevier Science B.V. All rights reserved.Ž .PII: S 0 0 4 8 - 9 6 9 7 9 9 0 0 5 1 3 - 6

( )R.M. Harrison, J. Yin r The Science of the Total En¨ironment 249 2000 85]10186
Žand gravimetrically determined particulate mat-.ter and sulfur dioxide, and the EU’s air quality
Directive of 1980 setting a joint standard in whichthe permissible concentration of sulfur dioxidewas dependent on the ambient concentration of
Žsmoke Council of the European Communities,.1980 .
It was not until the early 1990s that Schwartz etal. applied improved statistical methodologies andwere able to demonstrate effects of particulatematter on health at concentrations hithertobelieved safe, and demonstrated that such effectsdid not depend upon the presence of appreciable
Žconcentrations of sulfur dioxide Department of.Health, 1995 . Much of the thinking regarding the
toxicology of the smokersulfur dioxide mixtureappears to have been based on the idea that theparticulate matter acted as an agent to transfersulfur dioxide on its surface to the deep lung,whereas in the absence of particles, most sulfurdioxide would be removed by uptake in the upperrespiratory tract. The demonstration of effects ofparticles on their own necessitated a rethinking ofthe toxicology of a material which had previouslybeen thought of as relatively innocuous except inthe presence of SO . Indeed, in the early 1990s,2whilst many informed workers were beginning toaccept the results of the epidemiological studies,it was widely stated that there was no plausiblemechanism of effect of particulate matter expo-sure. This view no doubt resulted from theabsence of research, since at the time of writingthis article the literature abounds with plausible
Žmechanisms see for example, Donaldson and.MacNee, 1998 .
Currently, there are, if anything, too manyplausible mechanisms and too little establishedfact. This is not without its problems. In order toprotect public health, governments and interna-tional organisations are quite rightly setting am-bient air quality standards for particulate matterand are legislating for reductions in particle emis-sions from the key sectors. In both the USA andEurope these measures are in place and are setwholly in terms of the mass of particles. In con-sidering the next steps, regulators are quite rightlyposing the question of what property of particu-late matter is responsible for the toxic effects
and, therefore, whether a more cost-effective so-lution would be to regulate purely the toxic com-ponent rather than using the sledge hammer ap-
Žproach which may prove very low on cost-.effectiveness of simply reducing mass emissions
from all those sectors which are susceptible tocontrol. Indeed, one worrying thought is that iftechniques used to reduce the mass of particleemissions simply reduce the mean particle sizeand, therefore, have little influence on the num-ber of particles, they may have little effect onhealth outcomes. The key questions would there-
Ž .fore appear to be: a what influence does chemi-cal composition of particulate matter have on the
Ž .magnitude of its effect; and b what is the influ-ence of particle size on the ability of particles toinduce toxic effects?
2. Particle chemistry
Perhaps the best research outcome, which couldbe hoped for, would be the identification of agiven minor chemical component of particulatematter, which is solely responsible for adverseeffects on health. However, the UK Departmentof Health Committee on the Medical Effects of
Ž .Air Pollution Department of Health, 1995 con-cluded that no known chemical substance is ofsufficient toxicity given the current levels of expo-sure to particulate matter to explain the observedmagnitude of health effects. Even the extremelytoxic agents developed for chemical warfare wouldnot have a sufficient level of toxicity. Epidemio-logical studies also argue against chemistry havingan especially important influence. The greatestnumbers of epidemiological studies have investi-gated the connection between total mortality andexposure to particulate matter measured as PM10Žparticles determined by mass passing an inletwith a 50% cut-off efficiency at a 10-mm aerody-
.namic diameter . There is a remarkable consis-tency between such studies irrespective of where
Žthey are carried out Dockery and Pope, 1994;.Lippmann, 1998 although a more recent review
Ž .by the UK Department of Health 1998 dididentify apparent modest differences between theresults of US and European studies, but did not

( )R.M. Harrison, J. Yin r The Science of the Total En¨ironment 249 2000 85]101 87
offer a full explanation. Generally speaking, totaldaily mortality increases by approximately 1% per10 mg my3 increase in PM concentration. Such10findings appear to apply in both developed anddeveloping countries where the pollutant mixesare expected to be rather different and seem toapply equally to the east and west of the USAwhere particulate matter composition is very dif-ferent, with nitrates playing a major role on thewest coast relative to sulfates and the opposite
Žsituation prevailing on the east coast Lippmann,.1998 .
On the other hand, it is difficult to imagine thatchemical composition does not play a role.Chemical components of PM are highly diverse.10They range from near neutral and highly solublesubstances such as ammonium sulfate, am-monium nitrate and sodium chloride throughsooty particles made up largely of elemental car-bon coated in organic compounds, and essentiallyinsoluble minerals such as particles of clay. Someworkers have expressed the view that it is almostinconceivable that the water-soluble components,which will rapidly dissolve in the well bufferedlining fluids of the respiratory system, can exertany appreciable physiological effect. Yet, thesoluble substances and thus by inference also theinsoluble substances, represent widely differingfractions of the ambient aerosol in different loca-tions, but no obvious differences in the coeffi-cients of the epidemiological studies reflect thisvariation. One toxicological study has claimed todemonstrate that it is the soluble fraction which
Žis responsible for pulmonary toxicity Adamson et.al., 1999 . However, such a conclusion is based
upon making aqueous extracts of airborne parti-cles for laboratory experiments. This is experi-mentally demanding if the presence of ultrafinecolloidal solids is to be wholly avoided, and theauthors present no evidence to confirm that, forexample, colloidal iron oxide particles have beenwholly excluded.
Evidence is also being presented that tracemetals influence the toxicity of airborne particu-late matter. Such evidence derives from toxicolog-ical rather than epidemiological studies and de-pends mechanistically on the idea that metals areredox-active and can, therefore, induce or catal-
yse chemical change leading to production of freeradicals such as the hydroxyl radical which have aknown ability to cause tissue inflammation. Suchfindings are interesting, but as yet very far fromconclusive. In the UK concentrations of mostairborne metals have fallen dramatically in recentyears and more rapidly than those of particulate
Ž .matter as a whole QUARG, 1993 . Unfortu-nately, there seems to be no base of data fromwhich to investigate whether health impacts havecorrelated with either trace metals or particlemass. However, in dealing with trace metals itmust be recognised that a wide range of metalshave been implicated and each has quite separatetrends in concentration. The solubility andbioavailability of the metal will also be important,and this may have changed with time as themake-up of the particles has changed.
3. Particle size
The vast majority of epidemiological studieshave used particle metrics such as PM , black10smoke or sulfate concentration simply becausethese are the variables for which large datasetsare available. There is a case for arguing thatPM might better describe the component of2.5particulate matter responsible for adverse effectssince this smaller size fraction is capable of pene-trating to the alveolar region of the respiratorysystem with far greater efficiency than the coarseparticles of 2.5]10 mm aerodynamic diameterwhich make up the remaining part of PM . In10the UK, and probably in many other countries,concentrations of PM and PM are very highly2.5 10
Ž .correlated, APEG, 1999 making the task of dis-tinguishing between the two metrics in epidemio-logical studies almost impossible since the two donot behave as independent variables. However,studies from other parts of the world have soughtto resolve whether it is PM or PM which is2.5 10the better metric, and do provide limited evidence
Ž .that fine particles PM are more toxic than2.5Ž . Ž .coarse particles PM ]PM Lippmann, 1998 .10 2.5
One of the more interesting findings from thetoxicological studies is that ultrafine particles ofless than 100 nm appear to have considerably

( )R.M. Harrison, J. Yin r The Science of the Total En¨ironment 249 2000 85]10188
enhanced toxicity per unit mass and that theirtoxicity increases as particle size decreasesŽ .Donaldson and MacNee, 1998 . This may beexplained either through a greater surface areaper unit mass if the toxic components residesolely or partially in the surface of the particles,or via the ability of ultrafine particles to pene-trate the pulmonary interstitium. Seaton et al.Ž .1995 have hypothesised that it is the ability ofultrafine particles to penetrate the lung wall in-ducing inflammation in the pulmonary intersti-tium, which in turn stimulates the production ofclotting factors in the blood which is responsiblefor the recognised ability of airborne particles toexacerbate ischaemic heart disease, a health out-come which had previously been extremely hardto explain on mechanistic grounds.
Airborne particulate matter comprises particlesof extremely diverse sizes. The smallest freshlyformed particles are less than 5 nm in diameterand comprise only tens of molecules. Particles inthe 3]50-nm range are highly abundant in urbanair as a result of vehicle emissions. On the otherhand, airborne particles can be as large as 100mm, and even within the PM size range, a10
Žsignificant proportion of particle mass but not.number may well be in the size range close to 10
mm. There are insufficient measurements of air-borne particle size distributions to know how con-sistent size distributions are between cities indifferent parts of the world or how constant on aday-to-day basis. However, the data that are avail-able on such measures as the PM rPM ratio2.5 10indicate that there can be quite appreciable dif-ferences dependent on the climate and sources ofparticles. Yet, the epidemiology based on totalmortality does not show any obvious systematicgeographic variation in the magnitude of effectper unit mass of particulate matter.
4. Factors which may influence the toxicity ofairborne particulate matter
Properties expected to show geographic varia-tion, which may influence particle toxicity, includethe following:
1. bulk chemical composition;2. trace element content;3. strong acid content;4. sulfate content; and5. particle size distribution
These factors will now be considered in turn.
4.1. Bulk chemical composition
Airborne particulate matter may be consideredas made up of major components, each represent-ing several percent of the total mass of particles,together with trace element components usuallyrepresenting less than 1% of total particle massŽ .Harrison and Jones, 1995 . The term ‘bulkchemical composition’ refers to the relative abun-dance of the major components. Air samples fromurban areas from around the world typically showthe same major components, although in con-siderably different proportions according to thelocation of air sampling. These major componentsare typically the following:
1. Sulfate } derived predominantly from sulfurdioxide oxidation in the atmosphere. Becausesulfur dioxide is oxidised only slowly, spatialgradients of sulfate on a scale of tens of miles
Žare expected to be very small Burton et al.,.1996 , over hundreds of miles they can be
significant, and over entire continents, veryŽ .large QUARG, 1996 . There may be a small
Žlocal urban increment in sulfate APEG,.1999 .
2. Nitrate } this is formed mainly from theoxidation of atmospheric nitrogen dioxide, andone major form, ammonium nitrate, isbelieved to be in equilibrium in the atmo-sphere with its precursor gases ammonia and
Ž .nitric acid vapour Harrison and Msibi, 1994 .In some environments, sodium nitrate pre-dominates. Because nitrogen dioxide oxidisesappreciably more rapidly than sulfur dioxide,and due to the sensitivity of ammonium ni-trate concentrations to ambient ammoniaconcentrations which influence the dissocia-tion, the spatial patterns of nitrate are ex-

( )R.M. Harrison, J. Yin r The Science of the Total En¨ironment 249 2000 85]101 89
pected to be considerably less uniform thanthose of sulfate.
3. Ammonium } when formed initially in theatmosphere, sulfate and nitrate are in theform of sulfuric and nitric acids. These areprogressively neutralised by atmospheric am-
Žmonia forming ammonium salts Harrison and.Kitto, 1992 . In most, but not all urban loca-
tions, the ammonium ion appreciably exceedsthe hydrogen ion, which it displaces in theneutralisation process.
4. Chloride } the main sources of chloride aresea spray even at locations hundreds of milesfrom the coast, and during the winter monthsroad de-icing salt. Chlorides also enter atmo-spheric particles as result of ammonia neu-tralisation of hydrochloric acid vapour, whichis emitted, from sources such as incineratorsand power stations.
5. Elemental carbon and organic carbon }combustion processes, nowadays most notablyroad traffic, emit sooty particles which con-tain carbon in the form of a core of solidblack elemental carbon which often has asurface coating of semi-volatile organic com-pounds which condense from the exhaust
Ž .gases Amann and Siegla, 1982 . Further or-ganic carbon can be incorporated in the parti-cles as a result of atmospheric photochemicalprocesses which produce low volatility carbon
Ž .compounds Bowman et al., 1997 .6. Crustal materials } these include soil dusts
and windblown rock-derived minerals. Theyare, therefore, quite diverse in compositionreflecting local geology and surface condi-tions. Their concentration is dependent onclimate as the processes which suspend theminto the atmosphere tend to be favoured bydry surfaces and high winds. These particlesreside mainly in the coarse particle fractionŽ .Harrison et al., 1997a .
7. Biological materials } some studies haveseparately characterised material of biologicalorigin which may include both small organ-isms such as bacteria as well as spores andpollens and fragments of cellulosic plant ma-
Ž .terial Matthias-Maser and Jaenicke, 1994 .With the exception of some viruses, these are
generally coarse in size, and in most studieshave been characterised as organic carbonrather than separately as biological materials.
The bulk chemical composition of particulatematter can vary substantially between urban areasfor a wide range of reasons. As indicated above,climatic factors strongly influence the concentra-tions of crustal material, and hence in dryer cli-mates this component may be of greater relativeimportance. Sulfate particles depend on regionalsulfur dioxide emissions and these can vary ap-preciably between countries and in different parts
Ž .of a large country see Table 1 . The ammoniacontent of the air influences the ammonium con-centration in the particles; since the major sourceof ammonia emissions is intensive agriculture,again spatial variability is to be expected. Varia-tions within one large country are exemplified bythe data in Fig. 1 showing typical compositions ofPM , PM and coarse particles in the eastern10 2.5and western US. The most important differenceslie in the PM fraction with far lower sulfate2.5concentrations and higher elemental and organiccarbon concentrations in the western US than inthe eastern US. Also in the eastern US, sulfatefar exceeds nitrate, whilst in the western US,nitrate predominates. There are a number ofreasons for this difference which relate to therelative importance of electricity generation fromfossil fuels and road traffic as pollution sourcesŽthe former tends to emit sulfur dioxide, the latter
.predominantly nitrogen oxides and the greaterabundance of ammonia in the western US thanthe east, which tends to ‘fix’ the nitrate into theparticles, whereas in the eastern US with lowammonia levels, ammonium nitrate is potentiallyunstable.
Ž .Data from Leeds, UK collected in 1982 Fig. 2Ž .and Birmingham, UK collected in 1995 Fig. 3
show considerable similarity despite the passageof time. In the UK the sulfate-to-nitrate ratio bymass generally exceeds one, but does not ap-proach the extremely high values seen in theeastern US. The UK, therefore, typically liessomewhere between the situation in the easternand western USA with respect to sulfate andnitrate composition. The western US shows con-

()
R.M
.Harrison,J.Y
inr
The
Scienceofthe
TotalE
n¨ironment249
200085
]10190
Table 1aŽ .Bulk chemical composition % of particulate matter samples collected in different urban areas around the world
yy 2y qŽ .Locations Reference Size mm Total EC OC Organic TC NO SO NH Cl Crustal Minerals Other3 4 4mass
y3Ž .mg m
- 10 ] 3.3 6.1 8.5 9.4 1.2 27.8 10.7 ] ] 19.6 28.9Ž .Eastern US USEPA 1996 - 2.5 ] 3.9 14.9 20.9 18.8 1.1 34.1 13.0 ] ] 4.3 22.8
2.5]10 ] ] ] ] ] ] 4.9 1.8 ] ] 51.8 41.5- 10 ] 5.1 21.4 30.0 26.5 24.0 4.6 6.7 ] ] 36.3 0.0
Ž .Western US USEPA, 1996 - 2.5 ] 14.7 27.8 38.9 42.5 15.7 10.8 7.5 ] ] 14.6 0.02.5]10 ] ] ] ] ] ] 3.1 0.8 ] ] 69.3 26.8
bSouth-west US Vasconcelos et al. - 2.5 3.4 ] ] ] 29.3 ] 13.3 26.7 ] 24.0 ] 6.7Ž .1994 2.5]15 4.8 ] ] ] ] ] 1.3 2.5 ] 88.5 ] 7.7
Ž .Southern Chow et al. 1994 - 10 71.7 3.5 ] 20.0 ] 12.7 13.2 5.7 1.3 18.2 ] 19.3California -2.5 37.0 5.0 ] 26.5 ] 9.8 20.9 9.0 0.4 2.5 ] 23.9
bŽ .urbanŽ .Edison, Chow et al. 1996 - 10 52.5 5.7 19.7 27.6 25.4 3.0 6.3 2.0 ] 46.1 ] 4.3
bCalifornia- 2.5 49.6 6.0 31.4 44.0 37.4 3.0 6.0 2.0 ] 35.0 ] 0.0
bLos Angeles Kao and Friedlander - 3.5 74.3 7.5 8.2 ] 15.7 10.8 8.3 5.0 ] ] 3.6 56.6Ž .1994 - 15 35.5 ] ] ] 33.8 7.9 19.2 6.8 4.2 ] 28.1 0.0
Ž .Leeds, UK Clarke et al. 1984 - 2.5 22.2 ] ] ] 50.0 6.6 26.1 9.9 1.8 ] 5.6 0.02.5]15 13.3 ] ] ] 13.3 5.8 7.4 2.5 8.2 ] 62.8 0.0
Birmingham, Harrison et al. - 10 25.7 18.0 20.0 ] 38.0 6.0 17.0 6.0 2.0 ] ] 31.0Ž .UK 1997a - 10 18.9 10.0 ] 21.0 ] ] 3.0 6.0 18.0 22.0 ] 20.0
Ž .Brisbane, Chan et al. 1997 - 2.5 7.3 19.3 ] 27.0 ] 2.6 5.0 10.0 9.7 6.1 ] 20.3Australia 2.5]10 10.4 2.8 ] 13.0 ] 4.3 1.4 2.7 22.0 29.0 ] 24.7
bSapporo, Japan Kaneyasu et al. - 10 24.8 13.9 14.2 ] 28.1 4.2 16.4 2.9 2.2 ] 9.7 36.5Ž .1995
Ž .Lahore, Smith et al. 1996 TSP 607 2.9 13.1 ] 16.0 2.1 3.0 1.2 ] ] 16.4 61.3bPakistan
b Ž .Hong Kong Qin et al. 1997 RSP 66.2 ] ] ] 57.1 2.8 14.4 3.3 2.3 ] 6.1 14.0bAntwerp, Van Borm et al. 0.2]15 18.1 ] ] ] 21.3 ] 18.9 ] 3.2 ] 30.0 26.6
Ž .Belgium 1989
a Ž .Note. 1 TC s EC q OC; ‘] ’ means not measured.bIndicates reconstructed.

( )R.M. Harrison, J. Yin r The Science of the Total En¨ironment 249 2000 85]101 91
Fig. 1. Comparison of typical major component composition of airborne particulate matter from the eastern and western USAŽ .USEPA, 1996 .
siderably more organic and elemental carbon thanthe eastern US with concentrations in Leeds andBirmingham more similar to the western US.
Published data for other cities such as SapporoŽ . Ž . ŽJapan Kaneyasu et al., 1995 , Antwerp Bel-
. Ž .gium Van Borm et al., 1989 and BrisbaneŽ . Ž .Australia Chan et al., 1997 are available andfit broadly within the range exemplified by theeastern and western USA, although in Brisbane
Žthe contribution of seasalt is appreciable 12.6%.of PM .10
4.2. Trace element content
It has long been recognised that some tracemetals such as lead, cadmium and mercury arehighly toxic in sizeable doses, but exposuresthrough inhalation of urban airborne particulatematter in the developed world are likely to bewholly insufficient to cause toxic effects through
Žclassical mechanisms of toxicity Department of.Health, 1995 . However, some recently published
work has suggested that transition metals, and
particularly iron, may have adverse effects throughnon-classical mechanisms such as contributing tothe production of hydroxyl radicals through the
Ž .Fenton reaction Gilmour et al., 1996 .Since concentrations of trace metals in the
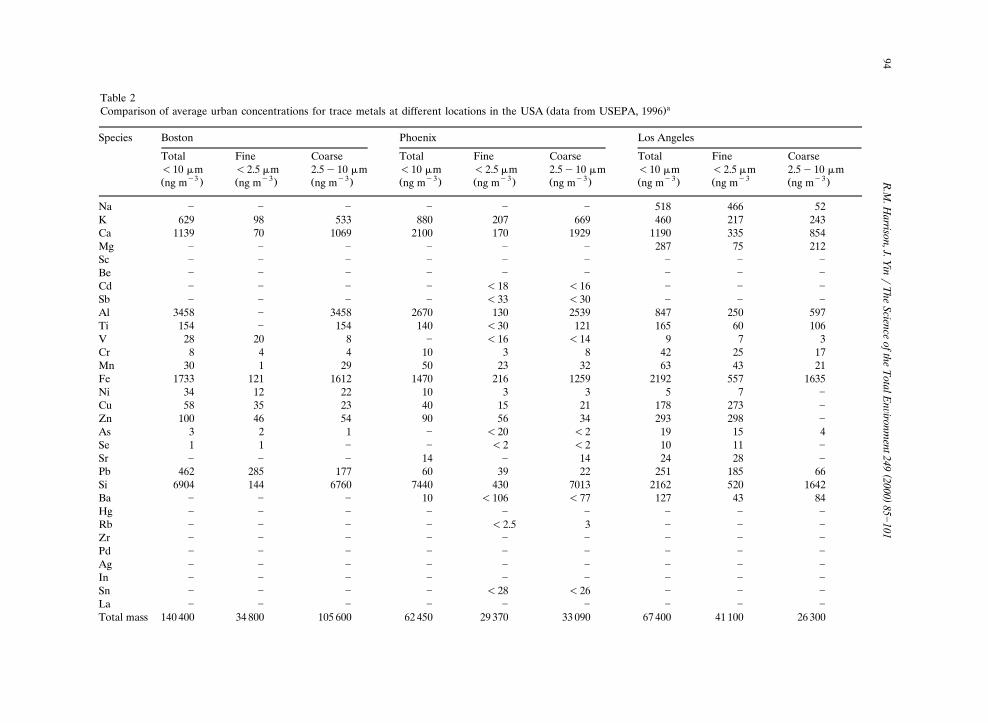
atmospheres of most cities in the developed worldhave declined sharply in response to pollutioncontrol measures in recent years, rather littleattention is now given to their measurement. Withthe exception of metals such as lead, whose pre-dominant source in many countries is still fromroad traffic leading to wide dispersal in city air,other trace metals which arise predominantly fromindustrial sources are less spatially uniform andhence data are very sensitive to the precise loca-tion of measurements. However, as Tables 2 and3 demonstrate, reported concentrations of tracemetals in major cities do not vary immenselybetween the cities. An important point to noteregarding the majority of these trace metals isthat their chemical speciation, and hence bio-availability and potential to participate in specificchemical reactions such as the Fenton reaction,

( )R.M. Harrison, J. Yin r The Science of the Total En¨ironment 249 2000 85]10192
varies significantly according to their source,hence, simple measurements of the total airborneconcentrations of a metal may not be representa-tive of its potential to participate in processesdeleterious to health.
4.3. Strong acid content
As noted earlier, when nitrate and sulfate areformed in the atmosphere from oxidation of ni-trogen dioxide and sulfur dioxide, respectively,they are formed as their strong acids, nitric acidand sulfuric acid. Nitric acid is a vapour whichcan only incorporate into airborne particles toany significant degree by loss of its acidity eitherthrough displacing hydrochloric acid from seasaltparticles to form sodium nitrate, or by ammonia
Žneutralisation to form ammonium nitrate Harri-.son and Allen, 1990 . In the case of sulfuric acid,
however, the acid is involatile, and once formed,is immediately incorporated into airborne parti-cles which are only subsequently neutralised byatmospheric ammonia. Thus, in environments withlow airborne ammonia concentrations, airborneparticles may have an appreciable strong acidcontent reflecting wholly or partially unneu-tralised sulfuric acid. This is relatively difficult tomeasure and there have been only a very limitednumber of reports of its concentration in theatmosphere. No recent review of these data is
Ž .available, but Kitto and Harrison 1992 , review-ing data published in North America and Europe
Žover the period 1978]1991, which is not neces-.sarily representative of the 1990s , found large
geographic variations in the range of measure-ments. The same is reflected in US data reported
Ž .in USEPA 1996 .One major difference between the eastern and
western US which is not clearly exemplified byFig. 1 is that airborne particles in the western UStend to be relatively neutral due to ample ammo-
Ž .nia availability USEPA, 1996 , whereas in theeastern US ammonia concentrations are far lowerand appreciable atmospheric acidity can be
Ž .observed. Lippmann 1989 has argued forciblythat it is the strong acid content of airborneparticles which is responsible for their toxic ac-tion. Were this to be the case, one would expect
Fig. 2. Composition of airborne particulate matter sampled inŽ .Leeds, UK, 1982 Clarke et al., 1984 .
to see considerable differences between expo-sure-response functions for PM from the east-10ern and western US and between the eastern USand countries such as the UK, where at inlandlocations particulate matter tends to be well neu-tralised.
4.4. Sulfate content
Two cross-sectional studies, the Harvard Six

( )R.M. Harrison, J. Yin r The Science of the Total En¨ironment 249 2000 85]101 93
Ž .Fig. 3. Major component composition of PM sampled in Birmingham, UK, 1995 Harrison et al., 1997a .10
Ž .Cities study Dockery et al., 1993 and the Ameri-Ž .can Cancer Society study Pope et al., 1995 have
related mortality rates to airborne concentrationsof sulfate showing a strong correlation. Additio-nally, some time series studies have used sulfate
Žas a surrogate for fine particulate matter Ostro,. Ž .1990 . Schwartz et al. 1996 have also carried out
time series studies of daily mortality in relation toPM , PM and sulfate in each or the six cities,10 2.5finding a stronger association for PM than for2.5sulfate, and it appears that as it is a major compo-nent of PM , sulfate may be acting as a surro-2.5gate for the entire fine particle mass or for someother specific component. As may be seen fromthe earlier discussion on the bulk chemical com-position of airborne particulate matter, the sul-fate content of particles is highly variable from
Žcity-to-city. A study in Philadelphia Burton et al.,.1996 showed 48% of PM to comprise sulfate-10
related fine particles, whereas in Rubidoux, Cali-fornia, sulfate comprised only 6.2% of PM10Ž .Chow et al., 1992 . Whilst, if sulfate represents arelatively constant proportion of PM , it might10
act as a surrogate in a time series study, if itsrelative abundance varies between locations thendifferences in the PM -health outcome coeffi-10cients for different locations would be expected.
4.5. Particle size distribution
Ž .The work of Schwartz et al. 1996 has demon-strated a strong relationship between PM and2.5mortality in six cities based on time series studiesand shown little, if any, relationship with coarseparticles in the 2.5]10-mm size range. Addition-ally, the mechanistic work of Oberdorster, Do-¨
Ž .naldson and others e.g. Oberdorster et al., 1995¨has attached special importance to ultrafine parti-
Ž .cles usually defined as less than 100 nm , or eventhose less than 50 nm diameter. Thus, the sizedistribution of airborne particles may have animportant consequence for the health impacts.
Ž .Friedlander 1977 has introduced the conceptof the ‘self-preserving aerosol size distribution’.This concept argues that over typical atmospherictimescales airborne particulate matter will tend
()
R.M
.Harrison,J.Y
inr
The
Scienceofthe
TotalE
n¨ironment249
200085
]10194
Table 2aŽ .Comparison of average urban concentrations for trace metals at different locations in the USA data from USEPA, 1996
Species Boston Phoenix Los Angeles
Total Fine Coarse Total Fine Coarse Total Fine Coarse-10 mm -2.5 mm 2.5y10 mm -10 mm -2.5 mm 2.5y10 mm -10 mm -2.5 mm 2.5y10 mm
y3 y3 y3 y3 y3 y3 y3 y3 y3Ž . Ž . Ž . Ž . Ž . Ž . Ž . Ž Ž .ng m ng m ng m ng m ng m ng m ng m ng m ng m
Na ] ] ] ] ] ] 518 466 52K 629 98 533 880 207 669 460 217 243Ca 1139 70 1069 2100 170 1929 1190 335 854Mg ] ] ] ] ] ] 287 75 212Sc ] ] ] ] ] ] ] ] ]
Be ] ] ] ] ] ] ] ] ]
Cd ] ] ] ] -18 -16 ] ] ]
Sb ] ] ] ] -33 -30 ] ] ]
Al 3458 ] 3458 2670 130 2539 847 250 597Ti 154 ] 154 140 -30 121 165 60 106V 28 20 8 ] -16 -14 9 7 3Cr 8 4 4 10 3 8 42 25 17Mn 30 1 29 50 23 32 63 43 21Fe 1733 121 1612 1470 216 1259 2192 557 1635Ni 34 12 22 10 3 3 5 7 ]
Cu 58 35 23 40 15 21 178 273 ]
Zn 100 46 54 90 56 34 293 298 ]
As 3 2 1 ] -20 -2 19 15 4Se 1 1 ] ] -2 -2 10 11 ]
Sr ] ] ] 14 ] 14 24 28 ]
Pb 462 285 177 60 39 22 251 185 66Si 6904 144 6760 7440 430 7013 2162 520 1642Ba ] ] ] 10 -106 -77 127 43 84Hg ] ] ] ] ] ] ] ] ]
Rb ] ] ] ] -2.5 3 ] ] ]
Zr ] ] ] ] ] ] ] ] ]
Pd ] ] ] ] ] ] ] ] ]
Ag ] ] ] ] ] ] ] ] ]
In ] ] ] ] ] ] ] ] ]
Sn ] ] ] ] -28 -26 ] ] ]
La ] ] ] ] ] ] ] ] ]
Total mass 140 400 34 800 105 600 62 450 29 370 33 090 67 400 41 100 26 300

()
R.M
.Harrison,J.Y
inr
The
Scienceofthe
TotalE
n¨ironment249
200085
]10195
Ž .Table 2 Continued
Species Chicago Houston St. Louis
Total Fine Coarse Total Fine Coarse Total Fine Coarse-10 mm -2.5 mm 2.5y10 mm -10 mm -2.5 mm 2.5y10 mm -10 mm -2.5 mm 2.5y10 mm
y3 y3 y3 y3 y3 y3 y3 y3 y3Ž . Ž . Ž . Ž . Ž . Ž . Ž . Ž Ž .ng m ng m ng m ng m ng m ng m ng m ng m ng m
Na 22 22 -17 -1490 -380 -740 ] ] ]
K 161 61 101 289 119 170 653 261 392Ca 761 45 716 2935 155 2780 2949 132 2817Mg 118 12 106 ] ] ] ] ] ]
Sc ] ] ] ] ] ] ] ] ]
Be ] ] ] ] ] ] ] ] ]
Cd -41 -29 -12 -12 -3 -6 5 4 1Sb -59 -42 -17 6 6 -9 7 6 1Al 269 46 223 1216 123 1093 1412 203 1209Ti 19 -29 19 36 -14 36 587 112 475V -13 -9 -4 -45 -8 -30 6 2 4Cr -7.3 -5 -2.4 7 -5 7 15 6 9Mn 13 5 8 35 14 21 71 36 35Fe 432 89 344 766 162 604 1493 275 1218Ni -1.8 -1 -0.7 8 4 4 9 4 5Cu 17 11 6 46 28 18 43 29 14Zn 90 52 38 142 84 58 175 101 74As -4.3 -3 -1.3 -15 -5 -6 3 2 1Se -1.7 -1 -0.6 -3 -2 ] 5 4 1Sr ] 1 ] ] -2 -8 9 2 7Pb 32 27 5 589 465 124 877 688 189Si 831 74 739 3200 210 2990 4928 458 4470Ba -130 -91 38 139 48 91 54 20 34Hg ] ] ] ] ] ] ] ] ]
Rb ] ] ] -6 -2 -3 2 0 2Zr ] ] ] ] ] ] ] ] ]
Pd ] ] ] ] ] ] ] ] ]
Ag ] ] ] ] ] ] ] ] ]
In ] ] ] ] ] ] ] ] ]
Sn -70 -49 -21 ] -5 -9 10 9 1La ] ] ] ] ] ] ] ] ]
Total mass 28 540 13 570 14 970 63 400 38 600 24 800 62 000 34 000 28 000
a Ž . Ž . Ž . Ž . Ž . Ž . Ž . Ž .Note. a Sampling sites: 1 Boston, eastern US 1980 ; 2 Phoenix, western US 13r10r1989]17r1r1990 ; 3 Los Angeles, western US Summer, 1987 ; 4Ž . Ž . Ž . Ž . Ž . Ž .Chicago, Central US 7r1994 ; 5 Houston, Central US 10]19r9r1980 ; 6 St. Louis, Central US 8]9r1976 ; and b ‘]’ means not measured.

( )R.M. Harrison, J. Yin r The Science of the Total En¨ironment 249 2000 85]10196
towards a rather constant distribution of sizes asvery small particles are lost by coagulation withlarger particles, and very large particles depositfrom the atmosphere by gravitational and othermechanisms. This concept provides a sound un-derstanding of the behaviour of aerosols on timescales of days, but many of the processes involvedare too slow to influence the aerosol size distribu-tion substantially on urban scales. Thus, differ-ences in particle size distributions are to be ex-pected between and within urban areas, but cur-rently insufficient data are available to allow fullquantification of this effect. However, data from
Birmingham, UK show considerable seasonableinfluence on the proportion of coarse particlesŽ .2.5]10 mm in PM , ranging from approxi-10mately 20% in the winter to 50% in the summer
Ž .months Harrison et al., 1997a . Looking at datafrom across the USA, PM and PM show a2.5 10highly variable relationship, with some daily datashowing in excess of 90% coarse particles whilstat other sites on other days the percentage ofcoarse particles is only approximately 10%. Based
Ž .on the work of Schwartz et al. 1996 relationshipsbased on PM are far more likely to be transfer-2.5able than those based on PM , especially in10
Table 3aComparison of average urban concentrations for trace metals at different locations in Europe, Asia and USA
3 41 2Species Lahore WageningenBirmingham UK CoimbraTSP TotalFine Coarse Total Fine Coarse Total y3Ž .ng m -10 mm-2.1 mm 2.1y10 mm -10 mm -0.95 mm 0.95y10 mm -10 mm y3Ž .ng my3 y3 y3 y3 y3 y3Ž . Ž . Ž . Ž . Ž . Ž .ng m ng m ng m ng m ng m ng m
Na 348 698 1050 360 1130 1490 2740 200.5K 127 71.5 199 320 190 510 3300 367Ca 40 168 208 520 1240 1760 4060 ]
Mg ] ] ] 30 100 130 490 ]
Sc 4.6 8.1 12.7 ] ] ] ] ]
Be ] ] ] 0.2 0.1 0.3 9.2 ]
Cd ] ] ] 1.5 0.2 1.8 43.4 ]
Sb ] ] ] 0.4 0.5 0.9 ] ]
Al ] ] ] 840 500 1340 37400 ]
Ti 4.7 11.9 16.6 ] ] ] ] ]
V 5.0 2.4 7.4 12.1 3.9 15.9 127 9.5Cr 6.4 6.2 12.6 19.9 5.0 24.9 113 ]
Mn 9.9 6.4 16.3 13.5 8.7 22.2 350 13Fe 114. 187. 301. 190. 340 530 9930 425.5Ni 2.9 1.9 4.8 4.9 1.2 6.1 79.7 ]
Cu 30.2 8.5 38.7 22.4 17.8 40.2 420 22Zn 297 55.6 353. 50. 20. 70. 27700 148As 4.2 1.5 5.7 1.9 0.5 2.4 29.4 ]
Se 2 1.1 3.1 0.6 0.2 0.8 ] ]
Sr ] ] ] ] ] ] ] ]
Pb 73.9 17.1 91 250 60 310 3920 ]
Si ] ] ] ] ] ] ] 649.5Ba ] ] ] ] ] ] ] ]
Hg ] ] ] ] ] ] ] ]
Rb ] ] ] ] ] ] ] ]
Zr ] ] ] ] ] ] ] ]
Pd ] ] ] ] ] ] ] ]
Ag ] ] ] ] ] ] ] ]
In ] ] ] ] ] ] ] ]
Sn ] ] ] ] ] ] ] ]
La ] ] ] ] ] ] ] ]
Total mass ] ] 47000 29600 22500 52100 607000 35700

( )R.M. Harrison, J. Yin r The Science of the Total En¨ironment 249 2000 85]101 97
Ž .Table 3 Continued
5 6 7 8Species Arnhem Anaheim Azusa Edison
Total Fine Total Fine Total Fine Total Fine-10 mm -2.5 mm -10 mm -2.5 mm -10 mm -2.5 mm -10 mm -2.5 mm
y3 y3 y3 y3 y3 y3 y3 y3Ž . Ž . Ž . Ž . Ž . Ž . Ž . Ž .ng m ng m ng m ng m ng m ng m ng m ng m
Na 327. 59 1659.3 231.8 1541.8 193.4 ] ]
K 268.5 88 278.7 92.9 617.9 111.3 1378 1186Ca ] ] 491 8.4 1304.7 150.4 1204 1043Mg ] ] 348.8 36 604.5 55.4 ] ]
Sc ] ] ] ] ] ] ] ]
Be ] ] ] ] ] ] ] ]
Cd ] ] ] ] ] ] 3 4Sb ] ] ] ] ] ] 9 6Al ] ] 701.2 35.1 2270.5 187.4 2684 1824Ti ] ] 59.9 3.6 251 29.9 173 151V 5.5 3.5 5.1 5.6 7.5 5.7 3 3Cr ] ] 19.6 18.5 19.6 18 1 0Mn 24.5 13 23.6 12.2 79.2 15.7 36 33Fe 1168.5 241 598.9 29.6 1840.9 281.9 2140 1953Ni ] ] 4.7 4.5 4.6 4.5 4 3Cu 140 13.5 10.3 39.6 13.6 13.4 11 10Zn 185 38 24.8 33.3 168. 55.3 28 25As ] ] 7 12.1 7.3 18.1 2 2Se ] ] 8.4 11.5 8.7 11.5 1 1Sr ] ] 18.7 17.6 18.4 19.2 13 11Pb ] ] 50.4 34.6 81.1 48.6 10 9Si 1139.5 147 1922.8 33.8 5721.3 482.9 6708 5020Ba ] ] 42 7.5 137.5 26.5 68 70Hg ] ] 20.2 20.4 21.1 19.8 ] ]
Rb ] ] ] ] ] ] 5 4Zr ] ] ] ] ] ] 3 3Pd ] ] ] ] ] ] 5 6Ag ] ] ] ] ] ] 8 6In ] ] ] ] ] ] 6 4Sn ] ] ] ] ] ] 9 10La ] ] ] ] ] ] 23 21Total mass 68150 38950 51300 26800 92100. 47100 52464 49647
a Ž . Ž . Ž . Ž . Ž .Note. a Reference: 1, Smith 1995 ; 2, Harrison et al. 1997b ; 3, Smith et al. 1996 ; 4 and 5, Janssen et al. 1997 ; 6 and 7,Ž . Ž . Ž . Ž .Chow et al. 1994 ; 8, Chow et al. 1996 . b Sampling sites: 1 Birmingham University campus, UK 2r92 and 8r92 ; 2 Santa Cruz
Ž . Ž .Church, Coimbra, Beira Litoral, Portugal 3r92 ; 3 University of Engineering and Technology, Lahore, Pakistan 3r92 ; 4 and 5Ž . Ž .Street and background sites in Wageningen 1r94 and Arnhem 10]11r94 , Netherlands; 6 and 7 11 day sampling
Ž . Ž . Ž .19r6r87]3r9r87 at Anaheim and Azusa, Southern California, USA; 8 Edison, Central California, USA 13r7]24r8, 1990 ; c‘]’ means not measured.
relation to cities with widely varying proportionsof coarse particle mass.
There are far fewer data from which to makeany judgement on the proportion of ultrafineparticles in the atmosphere. Such particles arebetter represented by measurements of particlenumber which respond very largely to particlesless than 100 nm in diameter which dominate the
number count, rather than of mass of particlesbelow a given size threshold, such as 100 nm. Thedata which are available suggest that ultrafineparticle numbers are very responsive to localsources and thus measurements close to combus-tion sources can show concentrations orders ofmagnitude above the local background. This localsmall scale variability makes any assessment of

( )R.M. Harrison, J. Yin r The Science of the Total En¨ironment 249 2000 85]10198
Table 4aŽ .Particle count and mass measurements made in Birmingham, UK, 1995 Harrison et al., 1999
bSite Central Ward End Hodge HillBirmingham
ŽMean particle count 1000 sy3particles cm 36.6 28.6 96
y3Ž .Mean PM10 mg m 23.6 23.5 PM : 20.010PM : 13.02.5
ŽPMrparticle count slope fromy1 5 y1.regression line, =10 g particle 0.4 0.38]0.46 PM : 0.0810
hourly values PM : 0.072.5ŽPMrparticle count slope from
15 y1.regression line, =10 g particle 0.35 0.3]0.37 PM : 0.110daily values PM : 0.082.5
9ŽReciprocal of slope =10 particles PM : 12.510y1.mg hourly values 2.5 2.2]2.6 PM : 14.32.5
9ŽReciprocal of slope =10 particles PM : 10.010y1.mg daily values 2.9 2.7]3.3 PM : 12.52.5
aNote. Data are aggregates of more than one sampling period at each site.bSites are influenced by local traffic, Hodge Hill)Central Birmingham)Ward End.
differences between cities extremely difficult.However, a well selected background site wouldprobably represent background ultrafine particleconcentrations across a considerable area, andwork in Birmingham has shown a rather goodcorrelation between daily particle count and PM10
Žmass for such a site QUARG, 1996; Harrison et.al., 1999 . However, at hotspot locations strongly
influenced by local traffic or other sources, suchcorrelations are unlikely to be found. At presentthe data are so limited that it is not possible tosay whether ultrafine particle number or total
Ž .particle count as surrogate shows a similarnumerical ratio to PM in all cities. Indeed,10within Birmingham even background sites showed
Ž .some variability in the ratio see Table 4 and themore traffic-influenced Hodge Hill site showed amuch different ratio to the better located back-ground locations. Results of other studies in whichparticle number counts have been reported aresummarised in Table 5.
5. Conclusions
In general there are strong similarities betweenairborne particulate matter sampled in cities indeveloped countries across the world. The same
bulk chemical components are present as well astrace elements at broadly comparable concentra-tion levels. In some less developed countries,however, the situation is very different due tohigh pollutant loadings and much wind-blown
Ž .coarse dust Harrison et al., 1997b . Strong acidand sulfate contents can vary appreciably betweenlocations. As a typical range it is clear that whenexpressed as a percentage of PM mass, any of10the components described could readily vary byone order of magnitude between cities with dif-fering pollution climates. In this context the ap-parent similarity of exposure-response functionsfrom cities around the world is surprising.
If the crucial factor relates to the particle sizedistribution, the data are far more sparse andconclusions are more difficult to draw. Whilstsystematic variations undoubtedly exist betweenthe PM rPM ratios for different cities, over a2.5 10period of a year these are likely to be of the orderof two or three at most between cities and un-likely to be as great as an order of magnitude forcities in the developed world. If it is ultrafineparticle number or mass which is the criticalfactor, the data are currently far too few to drawany conclusions whatever regarding relationshipsbetween cities. Local spatial variability is alsolikely to be so great in relation to ultrafine parti-

()
R.M
.Harrison,J.Y
inr
The
Scienceofthe
TotalE
n¨ironment249
200085
]10199
Table 5Measurements of particle number count in urban areas
Location Nature of site Sampling Instrument Particle count and mass Referenceperiod
4 y3 Ž .Birmingham Urban centre 13r9r94y23r10r94 TSI, 3025 CNC & Mean particle count: 3.7=10 cm Harrison et al. 1999y3Centre, UK TEOM Mean PM : 23.6 mg m10
4 y3 Ž .Birmingham Urban 9]11r1995 TSI, 3022 CNC & Mean particle count: 2.9=10 cm Harrison et al. 1999y3east, UK background TEOM Mean PM : 23.5 mg m10
4 y3 Ž .Birmingham, Urban ] CNC & TEOM Mean particle count: 9.6=10 cm Harrison et al. 1999y3Hodge Hill, background Mean PM : 20.0 mg m10y3UK Mean PM : 13.0 mg m2.5
5 y3 Ž .Birmingham Roadside 22r11r96 TSI, 3071 Mean particle count: 1.6]1.9=10 cm Shi et al. 1999a y3UK 1]2r12r97 SMPSrCPC 3022 Mean PM : 40.6 mg m10
4 Ž .Pasadena Urban 1]2r1996 TSI, 3071 Mean particle count: 1.3=10 Hughes et al. 1998y3 3CA, USA DMArCNC 3760 cm "8.9=10
y3& MOUDI, 100 PM : 14.02]25.52 mg m1.84 y3 Ž .Erfurt City Urban 10r91]5r92 DEMA & OPC Mean particle count: 1.8=10 cm Tuch et al. 1997
a y3Germany Mean PM : 73.8 mg m2.5Ž .Helsinki Urban centre 1r11r96] TSI, 3010 &3022 Daily mean particle count: Buzorius et al. 1999
3 4 y3Finland and background 1r5r97 CPC; DMPS 2=10 ]8=10 cmŽ .Brisbane Urban ] SMPS Particle count range: Morawska et al., 1999
3 4 y3Australia 5=10 ]7=10 cm
a Derived from the particle volume data.

( )R.M. Harrison, J. Yin r The Science of the Total En¨ironment 249 2000 85]101100
cle to PM relationships that any assessment will10be experimentally difficult to conduct.
References
Adamson IYR, Prieditis H, Vincent R. Pulmonary toxicity ofan atmospheric particulate sample is due to the solublefraction. Toxicol Appl Pharmacol 1999;157:43]50.
Amann CA, Siegla DC. Diesel particulates } what they areand why. Aerosol Sci Technol 1982;1:73]101.
APEG. Source apportionment of airborne particulate matterin the United Kingdom. Airborne Particles Expert Group.Department of the Environment, Transport and the Re-gions. London, 1999
Bowman FM, Odum JR, Seinfeld JH, Pandis SN. Mathemati-cal model for gas-particle partitioning of secondary organicaerosols. Atmos Environ 1997;31:3921]3931.
Burton RM, Suh HH, Koutrakis P. Spatial variation in partic-ulate concentrations within metropolitan Philadelphia. En-viron Sci Technol 1996;30:400]407.
Buzorius G, Hameri K, Pekkanen J, Kulmala M. Spatial¨variation of aerosol number concentration in Helsinki City.Atmos Environ 1999;33:553]565.
Chan YC, Simpson RW, McTainsh GH, Vowles PD, CohenDD, Bailey GM. Characterisation of chemical species inPM and PM aerosols in Brisbane, Australia. Atmos2.5 10Environ 1997;31:3773]3785.
Chow JC, Watson JG, Lu Z et al. Descriptive analysis ofPM and PM at regionally representative locations dur-2.5 10ing SJVAQSrAUSPEX. Atmos Environ 1996;30:2079]2112.
Chow JC, Watson JG, Fujita EM, Lu S, Lawson DR. Tem-poral and spatial variations of PM and PM aerosol in2.5 10the southern California air quality study. Atmos Environ1994;28:2016]2080.
Chow JC, Liu CS, Cassmassi J, Watson JG, Lu Z, PritchettLC. A neighborhood-scale study of PM source contribu-10tions in Rubidoux, California. Atmos Environ 1992;26A:693]706.
Clarke AG, Willison MJ, Zeki EM. A comparison of urbanand rural aerosol composition using dichotomous samplers.Atmos Environ 1984;18:1767]1775.
Ž .Council of the European Communities, 1980 . Council Direc-tive of 15 July 1980 on Air Quality Limit Values forSulphur Dioxide and Suspended Particulates. O.J.,L229r30.
Department of Health, 1995. Committee on the medical ef-fects of air pollution. Non-biological particles and health.London: HMSO, 1995.
Department of Health. Committee on the Medical Effects ofAir Pollution. Quantification of the Effects of Air Pollutionon Health in the United Kingdom. Stationery Office. Lon-don, 1998.
Dockery DW, Pope CA, Xu X et al. An association betweenair pollution and mortality in six US cities. N Engl J Med1993;329:1753]1759.
Dockery DW, Pope CA. Acute respiratory effects of particu-late air pollution. Annu Rev Public Health 1994;15:107]132.
Donaldson K, MacNee W. The mechanism of lung injurycaused by PM . Issues in Environmental Science and10Technology, No. 10, Hester RE, Harrison RM, editors.Royal Society of Chemistry, 1998:21]32.
Friedlander SK. Smoke dust and haze. New York: Wiley, 1977.Gilmour PS, Brown DM, Lindsay TG, Beswick PH, MacNee
W, Donaldson K. Adverse health effects of PM particles:10involvement of iron in generation of hydroxyl radical. Oc-cup Environ Med 1996;53:817]822.
Harrison RM, Allen AG. Measurements of atmosphericHNO , HCl and associated species on a small network in3eastern England. Atmos Environ 1990;24A:369]376.
Harrison RM, Deacon AR, Jones MR, Appleby RS. Sourcesand processes affecting concentrations of PM and PM10 2.5in Birmingham, UK. Atmos Environ 1997a;31:4103]4117.
Harrison RM, Smith DJT, Pio CA, Castro LM. Comparativereceptor modelling study of airborne particulate pollutants
Ž . Ž .in Birmingham United Kingdom , Coimbra Portugal andŽ .Lahore Pakistan . Atmos Environ 1997b;31:3309]3321.
Harrison RM, Jones M, Collins GC. Measurements of thephysical properties of particles in the urban atmosphere.Atmos Environ 1999;33:309]321.
Harrison RM, Jones M. The chemical composition of airborneparticles in the UK atmosphere. Sci Total Environ 1995;168:195]214.
Harrison RM, Kitto AMN. Estimation of the rate constant forthe reaction of acid sulphate aerosol with NH gas from3atmospheric measurements. J Atmos Chem 1992;15:133]143.
Harrison RM, Msibi IM. Validation of techniques for fastresponse measurement of HNO and NH and determina-3 3
w xw xtion of the NH HNO concentration product. Atmos3 3Environ 1994;28:247]255.
Hughes LS, Cass GR, Gone J, Ames M, Olmez I. Physical andchemical characterization of atmospheric ultrafine particlesin Los Angeles area. Environ Sci Technol 1998;32:1153]1161.
Janssen NAH, Mansom KFMV, Jagt KVD, Harssema H,Hoek G. Mass concentration and elemental composition ofairborne particulate matter at street and background loca-tions. Atmos Environ 1997;31:1185]1193.
Kaneyasu N, Ohta S, Murao N. Seasonal variation in thechemical composition of atmospheric aerosols and gaseousspecies in Sapporo, Japan. Atmos Environ 1995;29:1559]1568.
Kao AS, Friedlander SK. Chemical signatures of the LosŽ .Angeles aerosol dp-3.5 mm . Aerosol Sci Technol 1994;
21:283]293.Kitto AMN, Harrison RM. Processes affecting concentrations
of aerosol strong acidity at sites in eastern England. AtmosEnviron 1992;26:2389]2399.
Lippmann M. Background on health effects of acid aerosols.Environ Health Perspect 1989;79:3]6.
Lippmann M. The 1997 US EPA standards for particulatematter and ozone, In Issues in Environmental Science and

( )R.M. Harrison, J. Yin r The Science of the Total En¨ironment 249 2000 85]101 101
Technology, 10, Hester RE, Harrison RM, editors. RoyalSociety of Chemistry, 1998:75]99.
Matthias-Maser S, Jaenicke R. Examination of atmosphericbioaerosol particles with radii )0.2 mm. J Aerosol Sci1994;25:1605]1613.
Morawska L, Thomas S, Gilbert D, Greenaway C, Rijnders E.A study of the horizontal and vertical profile of submi-crometer particles in relation to a busy road. Atmos Envi-ron 1999;33:1261]1274.
Oberdorster G, Gelein RM, Ferin J, Weiss B. Association of¨particulate air pollution and acute mortality: involvementof ultrafine particles? Inhal Tox 1995;7:111]124.
Ostro BD. Associations between morbidity and alternativemeasures of particulate matter. Risk Anal 1990;10:421]427.
Pope CA, Thunn MJ, Namboodiri MM et al. Particulate airpollution as a predictor of mortality in a prospective studyof US adults. Am J Respir Crit Care Med 1995;151:669]674.
Qin Y, Chan CK, Chan LY. Characteristics of chemical com-positions of atmospheric aerosols in Hong Kong: spatialand seasonal distributions. Sci Total Environ 1997;206:25]37.
QUARG. Urban Air Pollution in the United Kingdom. TheFirst Report from the Quality of Urban Air Review Group.Department of the Environment. UK, 1993.
QUARG. Airborne Particulate Matter in the United King-dom. The Third Report from the Quality of Urban AirReview Group. Department of the Environment. UK, 1996.
Schwartz J, Dockery DW, Neas LM. Is daily mortality associ-ated specifically with fine particles? Air Waste ManageAssoc 1996;46:927]939.
Seaton A, MacNee W, Donaldson K, Godden D. Particulateair pollution and acute health effects. Lancet1995;345:176]178.
Shi JP, Khan AA, Harrison RM. Measurements of ultrafineparticle concentration and size distribution in the urbanatmosphere. Sci Total Environ 1999;235:51]64.
Smith DJT. Source apportionment of atmsopheric particles inthe UK, Portugal and Pakistan. Ph.D. Thesis. University ofBirmingham, 1995
Smith DJT, Harrison RM, Luhana L et al. Concentrations ofparticulate airborne polycyclic aromatic hydrocarbons andmetals collected in Lahore, Pakistan. Atmos Environ1996;30:4031]4040.
Tuch TH, Brand P, Wichmann HE, Heyder J. Variation ofparticle number and mass concentration in various sizeranges of ambient aerosols in eastern Germany. AtmosEnviron 1997;31:4193]4197.
USEPA. Review of the Ambient Air Quality Standard forParticulate Matter: Policy Assessment of Scientific andTechnical Information. OAQPS Staff Paper. EPA-452_R-96-013. Research Triangle Park. North Carolina, 1996.
Van Borm WA, Adams FC, Maenhaut W. Characterisation ofindividual particles in the Antwerp aerosol. Atmos Environ1989;23:1139]1151.
Vasconcelos LAP, Macias ES, White WH. Aerosol composi-tion as a function of haze and humidity levels in thesouthwestern US. Atmos Environ. 1994;28:3679]3691.
WHO. Air Quality Guidelines for Europe. World HealthOrganisation European Office. Copenhagen, 1987.