partitioning of foraging habitat by breeding sabine's gulls and arctic
TRANSCRIPT

THE WILSON BULLETIN A QUARTERLY MAGAZINE OF ORNITHOLOGY
Published by the Wilson Ornithological Society
VOL. 96, No. 2 JUNE 1984 PAGES 16 l-346
Wilson Bull., 96(2), 1984, pp. 161-172
PARTITIONING OF FORAGING HABITAT BY BREEDING SABINE’S GULLS AND
ARCTIC TERNS
DIANA M. ABRAHAM AND C. DAVISON ANRNEY
Arctic Terns (Sterna paradisaea) and Sabine’s Gulls (Xema sabinz] are Holarctic nesting larids which are sympatric in many areas of their breed- ing range (Godfrey 1966). They are similar in ecology (habitat, nest dis- persion), morphology (body size and shape), and behavior (flight char- acteristics, foraging techniques) (Sutton 1932, Gabrielson and Lincoln 1959, Bannerman 1962). Their diets usually differ: Arctic Terns take mostly fish and Sabine’s Gulls mostly invertebrates (Pearson 1968, Lem- metyinen 1976, Divoky 1978). However, Arctic Terns do take crustaceans and insects more than do many other terns (Ashmole 1968, Pearson 1968). Consequently, there is some dietary overlap. We report here on the pat- terns of habitat (and food) use by Arctic Terns and Sabine’s Gulls breeding in a mixed colony.
Our main objective was to determine if shared, possibly limiting, habitat and food resources were partitioned, and to describe how such partitioning was achieved. Although interspecific competition for limiting resources comes most readily to mind as a mechanism which promotes resource partitioning, it was not our aim to evaluate its role in this study. The issue is raised in speculation when results are discussed within the frame- work of three possible interpretations. We present indirect evidence which supports the competition interpretation with the intention of laying a foundation for further investigation into the patterns of habitat use within mixed colonies of Arctic Terns and Sabine’s Gulls.
STUDY AREA AND METHODS
Arctic Terns and Sabine’s Gulls have persisted in mixed colonies at East Bay, Southampton Island, N.W.T. (63”58’N, 8 loSOW), since at least 1957 when they were first noted there by
161
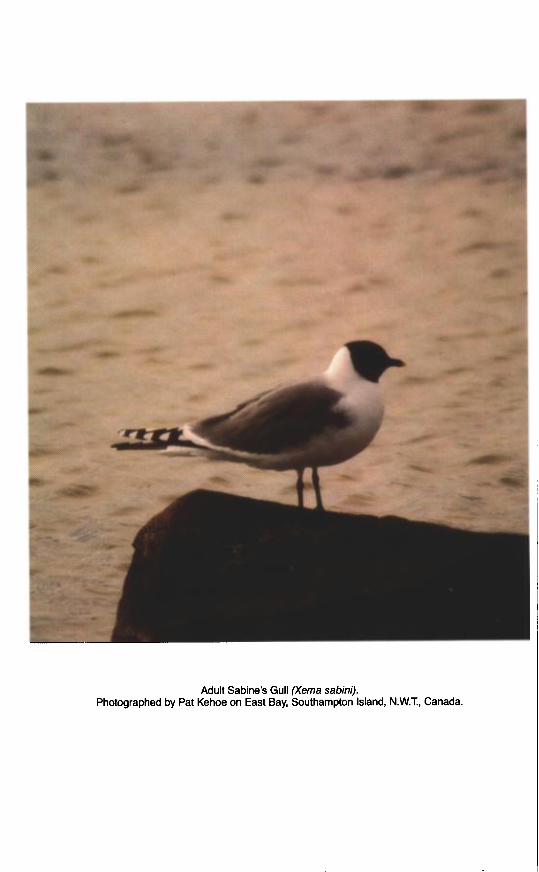
Adult Sabine’s Gull (Xema sabini). Photographed by Pat Kehoe on East Bay, Southampton Island, N.W.T., Canada.
162 THE WILSON BULLETIN l Vol. 96, No. 2, June 1984
0.5 km
t I
EAST BAY
SOUTHAMPTON
HUDSON BAY
/ , shore at mid-tide
SALT WATER
shore at high tide
FRESHWATE R
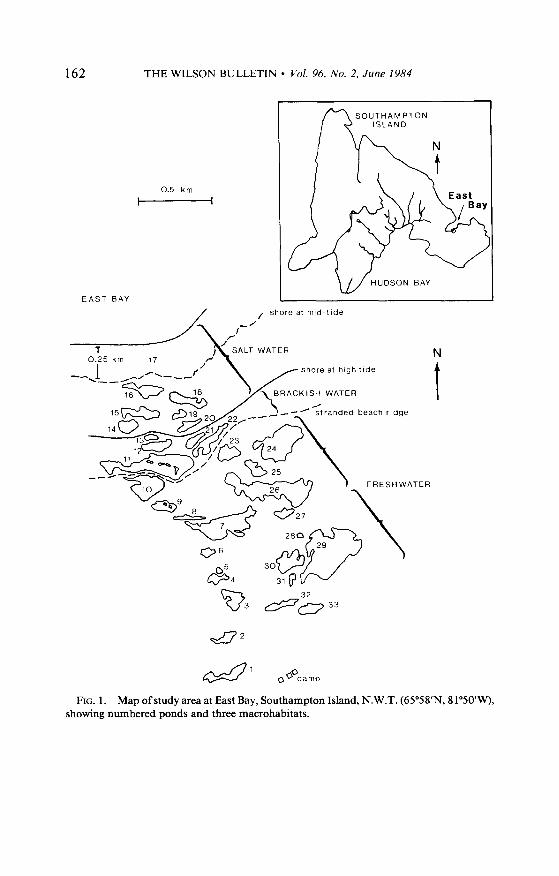
FIG. 1. Map ofstudy area at East Bay, Southampton Island, N.W.T. (65”58’N, 81”5o’w), showing numbered ponds and three macrohabitats.

Abraham and Ankney l HABITAT PARTITIONING BY LARIDS 163
T. W. Barry (pers. comm.). Both are abundant at East Bay, nesting together in varying concentrations along much of the south shore. Nesting is largely restricted to a narrow band of brackish water habitat just above the summer high tide line.
Our research was conducted on a 2.0 x 0.5-km study area located on the south shore of East Bay (Fig. l), from 9 June to 14 August 1980. Thirty pairs of Sabine’s Gulls and 42 pairs of Arctic Terns were nesting. A 4.5-km transect ran through the study area, incor- porating 32 ponds, plus 0.25 km2 of East Bay. The transect was established between 26 June and 5 July, as ponds became visible beneath the snow, coveting 2 1 freshwater ponds, five brackish water ponds, and including the Bay, seven salt water “ponds.”
Three aquatic macrohabitats were recognizable at East Bay: fresh-, brackish, and salt water (after Hoar 1975). Water salinities on the study area were measured in milli-osmols (mOsm) with an osmometer, and converted to parts per thousand (ppt) (Weast 1972-73). Ponds which registered between 0 and 5 ppt salinity were classified as freshwater; ponds measuring more than 5 ppt salinity and located above the summer high tide line were classed as brackish; water registering salinities greater than 30 ppt or located below the summer high tide line were considered salt water. The salt water macrohabitat at East Bay consisted of two distinct subunits: the intertidal region and the Bay itself. The intertidal region was characterized by numerous discrete basins which, by definition, were completely inundated by the waters of East Bay at high tide. These basins remained full when the tide receded, resulting in a series of salt water “ponds.”
Within macrohabitats, four microhabitats were recognized: pond center (Z 1 m from shore), pond edge (2 1 m from shore), flooded tundra, and dry land (within 10 m of a transect pond). When sampling at the Bay, we used a 5-m boundary to distinguish edge from center, and “shore” was defined as the current tide line.
Sampling the Food Resource
The numbers, distribution (both among and within macrohabitats), and sizes of inver- tebrates (and vertebrates) in transect ponds were determined. Systematic water-column (sweep) sampling began 27 June and continued weekly until 8 August. We sampled each pond with a standardized sweep of 1 m2 in surface area at both the center and edge using netting with 7.9 meshes/cm (after Bergman et al. 1977). We also took shallow benthic samples from transect ponds following the sweep sampling schedule. We used a squared-off coffee tin for benthic samples 5 cm wide, 10 cm long, and 1 cm deep.
Calculating biomass. -A selection of species-specific regression equations relating dry weight to length was made from the literature; these were used to calculate biomass (mg dry weight) from the number and average length (mm) of individuals in each prey group. A complete list of the equations used, including sources, and an explanation of their application is given in Abraham (1982).
Sampling Habitat Use by Gulls and Terns
The transect was walked at a slow and steady pace, once or twice per day, over all times of day. Complete coverage took approximately 3 h. Care was taken to keep a steady pace so the time spent at any one pond was the same from day to day.
The sampling technique used to quantify gull and tern foraging on the transect was a combination of instantaneous and ad libitum sampling (Altmann 1974). Instantaneous sampling records an individual’s behavior at pre-determined moments (e.g., every 5 min for 2 h). In this study, each “pre-determined moment” began when the observer reached a pond on the transect and lasted until the pond was left behind- hence, the ad lib aspect of the method. A foraging attempt was defined as a strike of the bill at the feeding substrate.

164 THE WILSON BULLETIN l Vool. 96, No. 2, June 1984
The first foraging attempt by each bird at a pond was recorded, and the location (macro- and microhabitat) was noted. We also recorded the level of tides during each walk.
Supplemental observations of foraging gulls and terns were recorded as for transect ob- servations. An observation was supplemental if it was made either: (1) off the transect at any time; or (2) on the transect, but not during a transect walk. Transect observations were used to analyse the use of macrohabitats by foraging gulls and terns; transect and supple- mental observations were used for analysis of microhabitat use. When comparisons were made within macrohabitats, the bias of unequal effort introduced by the supplemental data was avoided.
Measuring Niche Segregation
The degree of ecological segregation (S,) between two or more species (i.e., the probability that different resources are being used) can be quantified and expressed as the complement of niche overlap. Estimates of overlap (R,) were calculated by Schoener’s (1968) equation. R, ranges from O-l inclusive. Thus, its complement S, is (1 - R,).
RESULTS
The Food Resource
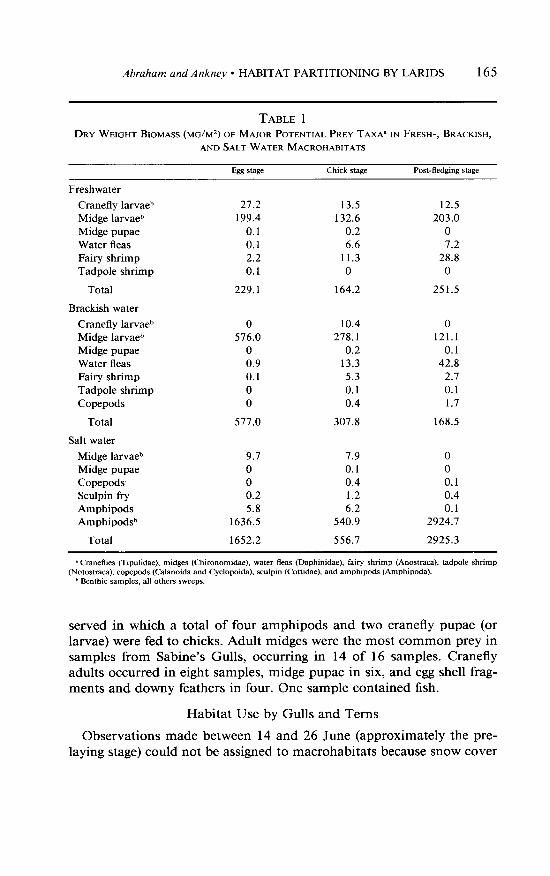
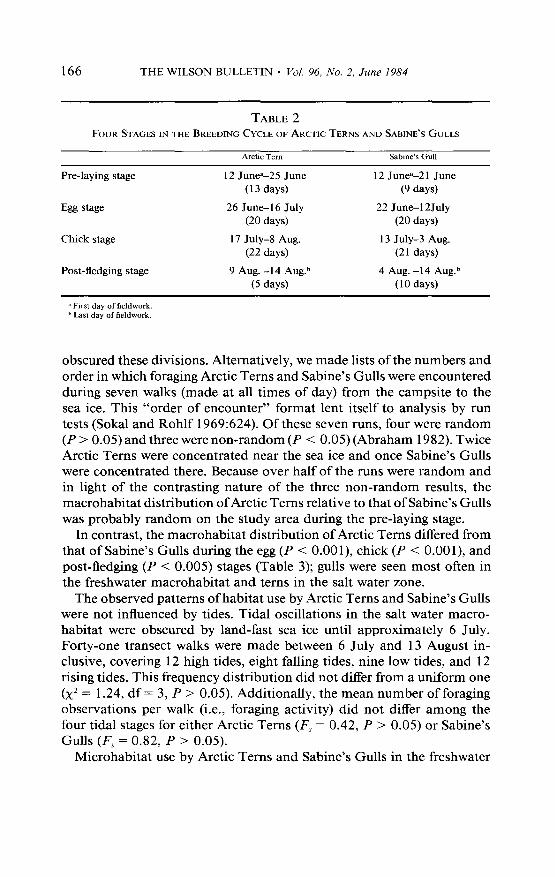
Specimens of potential prey collected in sweep and benthic samples from transect ponds represented eight taxa (Table 1). To detect changes in dry weight biomass (mg/m’) among macrohabitats and over time for each of these groups, we divided the season into the stages of the birds’ breeding cycle: pre-laying, egg (i.e., laying and incubation), chick-rearing, and post-fledging (Table 2). Because prey sampling started early in the egg stage, calculations of prey biomass were made using only the last three categories.
Midge larvae constituted the largest single contribution to the season’s biomass in both fresh- (83.0%) and brackish water (92.6%) macrohabitats (Table 1). The salt water macrohabitat supported the greatest prey biomass of all macrohabitats, with amphipods providing virtually all of the total biomass (99.6%). Early in the egg stage, however, snow and ice on the salt water macrohabitat made prey inaccessible to foraging gulls and terns. Until the ice melted from East Bay (5-8 July), most foraging by both species was in the freshwater macrohabitat where prey was most accessible (Abraham 1982).
During the chick-rearing period, six Arctic Tern and 11 Sabine’s Gull chicks were found dead. In addition to the stomach contents of these 17 individuals, regurgitations by four young and one adult Sabine’s Gull were collected.
We analysed the diets of Arctic Tern and Sabine’s Gull chicks on a presence-absence level. Of the six tern chick stomachs, amphipods oc- curred in two, single copepods in two, cranefly larvae in one, and cranefly adults in one. Additionally, six feedings of Arctic Tern chicks were ob-
Abraham and Ankney l HABITAT PARTITIONING BY LARIDS 165
TABLE 1
DRY WEIGHT BIOMASS (MG/M~) OF MAJOR POTENTIAL PREY TAXA~ IN FRESH-, BRACKISH,
AND SALT WATER MACROHABITATS
&g Stage Chick stage Post-fledging stage
Freshwater
Cranefly larvaeb Midge larvaeb Midge pupae Water fleas Fairy shrimp Tadpole shrimp
21.2 13.5 12.5 199.4 132.6 203.0
0.1 0.2 0 0.1 6.6 7.2 2.2 11.3 28.8 0.1 0 0
Total 229.1 164.2 251.5
Brackish water
Cranefly larva@ Midge larvaeb Midge pupae Water fleas Fairy shrimp Tadpole shrimp Copepods
0 10.4 0 576.0 278.1 121.1
0 0.2 0.1 0.9 13.3 42.8 0.1 5.3 2.7 0 0.1 0.1 0 0.4 1.7
Total 577.0 307.8 168.5
Salt water
Midge larvaeb Midge pupae Copepods Sculpin fi-y Amphipods Amphipod@
9.7 7.9 0 0 0.1 0 0 0.4 0.1 0.2 1.2 0.4 5.8 6.2 0.1
1636.5 540.9 2924.7
Total 1652.2 556.7 2925.3
* Craneflies (Tipulidae), midges (Chironomidae), water fleas (Daphinidae), fairy shrimp (Anostraca), tadpole shrimp (Notostraca), copepods (Calanoida and Cyclopoida), sculpin (Cottidae), and amphipods (Amphipcda).
b Fknthic samples, all others sweeps.
served in which a total of four amphipods and two cranefly pupae (or larvae) were fed to chicks. Adult midges were the most common prey in samples from Sabine’s Gulls, occurring in 14 of 16 samples. Cranefly adults occurred in eight samples, midge pupae in six, and egg shell frag- ments and downy feathers in four. One sample contained fish.
Habitat Use by Gulls and Terns
Observations made between 14 and 26 June (approximately the pre- laying stage) could not be assigned to macrohabitats because snow cover
166 THE WILSON BULLETIN l Vol. 96, No. 2, June 1984
TABLE 2
FOURSTAGESINTHEBREEDINGCYCLEOFARCTICTERNSANDSABINE'SGULLS
Arctic Tern Sabme's Gull
Pre-laying stage
Egg stage
Chick stage
Post-fledging stage
12 June=-25 June (13 days)
26 June-16 July (20 days)
17 July-8 Aug. (22 days)
9 Aug. -14 Aug.”
(5 days)
12 June=-21 June
(9 days)
22 June-l 2July (20 days)
13 July-3 Aug. (21 days)
4 Aug. -14 Aug.” (10 days)
a First day of fieldwork b Last day of fieldwork.
obscured these divisions. Alternatively, we made lists of the numbers and order in which foraging Arctic Terns and Sabine’s Gulls were encountered during seven walks (made at all times of day) from the campsite to the sea ice. This “order of encounter” format lent itself to analysis by run tests (Sokal and Rohlf 1969:624). Of these seven runs, four were random (P > 0.05) and three were non-random (P < 0.05) (Abraham 1982). Twice Arctic Terns were concentrated near the sea ice and once Sabine’s Gulls were concentrated there. Because over half of the runs were random and in light of the contrasting nature of the three non-random results, the macrohabitat distribution of Arctic Terns relative to that of Sabine’s Gulls was probably random on the study area during the pre-laying stage.
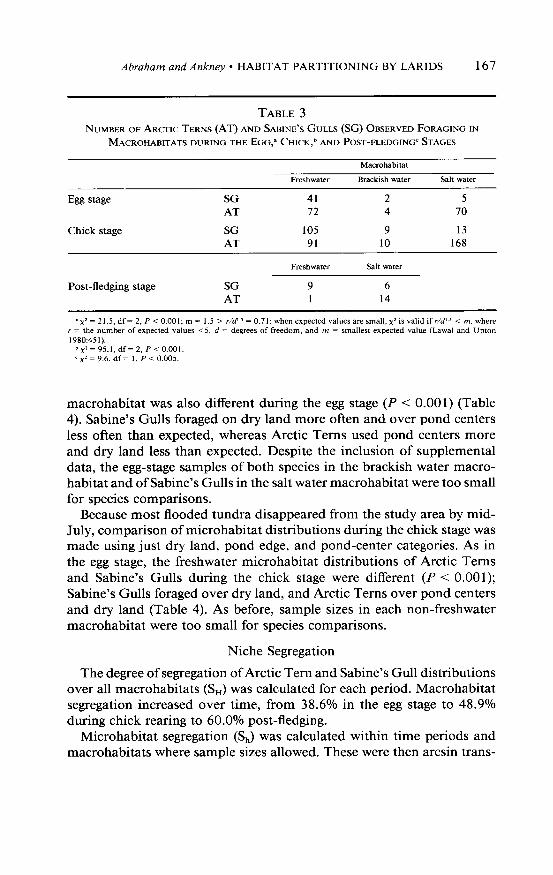
In contrast, the macrohabitat distribution of Arctic Terns differed from that of Sabine’s Gulls during the egg (P < O.OOl), chick (P < O.OOl), and post-fledging (P < 0.005) stages (Table 3); gulls were seen most often in the freshwater macrohabitat and terns in the salt water zone.
The observed patterns of habitat use by Arctic Terns and Sabine’s Gulls were not influenced by tides. Tidal oscillations in the salt water macro- habitat were obscured by land-fast sea ice until approximately 6 July. Forty-one transect walks were made between 6 July and 13 August in- clusive, covering 12 high tides, eight falling tides, nine low tides, and 12 rising tides. This frequency distribution did not differ from a uniform one (x2 = 1.24, df = 3, P > 0.05). Additionally, the mean number of foraging observations per walk (i.e., foraging activity) did not differ among the four tidal stages for either Arctic Terns (F, = 0.42, P > 0.05) or Sabine’s Gulls (F, = 0.82, P > 0.05).
Microhabitat use by Arctic Terns and Sabine’s Gulls in the freshwater
Abraham and Ankney l HABITAT PARTITIONING BY LARIDS 167
TABLE 3 NUMBER OF ARCYTIC TERNS (AT) AND SABINE’S GULB (SG) OBSERVED FORAGING IN
MACROHABITATS DURING THE EGG,= CHICK,~ AND POST-FLEDGING= STAGES
Macrohabitat
Freshwater Brackish water Salt wata
Egg stage SG 41 2 5 AT 72 4 70
Chick stage SG 105 9 13 AT 91 10 168
Post-fledging stage SG 9 6 AT 1 14
.x2 = 21.5, df = 2, P < 0.001; m = I.5 > r/d" = 0.71: when expected values are small, x’ is valid if r/d" < m, where r = the number of expected values ~5, d = degrees of freedom, and m = smallest expected value (Lawal and Upton 1980:451).
b~2=95_l,df=2,P<0.001. ‘ x’ = 9.6, df = I, P < 0.005.
macrohabitat was also different during the egg stage (P < 0.001) (Table 4). Sabine’s Gulls foraged on dry land more often and over pond centers less often than expected, whereas Arctic Terns used pond centers more and dry land less than expected. Despite the inclusion of supplemental data, the egg-stage samples of both species in the brackish water macro- habitat and of Sabine’s Gulls in the salt water macrohabitat were too small for species comparisons.
Because most flooded tundra disappeared from the study area by mid- July, comparison of microhabitat distributions during the chick stage was made using just dry land, pond edge, and pond-center categories. As in the egg stage, the freshwater microhabitat distributions of Arctic Terns and Sabine’s Gulls during the chick stage were different (P < 0.001); Sabine’s Gulls foraged over dry land, and Arctic Terns over pond centers and dry land (Table 4). As before, sample sizes in each non-freshwater macrohabitat were too small for species comparisons.
Niche Segregation
The degree of segregation of Arctic Tern and Sabine’s Gull distributions over all macrohabitats (S,) was calculated for each period. Macrohabitat segregation increased over time, from 38.6% in the egg stage to 48.9% during chick rearing to 60.0% post-fledging.
Microhabitat segregation (S,) was calculated within time periods and macrohabitats where sample sizes allowed. These were then arcsin trans-

168 THE WILSON BULLETIN l Vol. 96, No. 2, June 1984
TABLE 4
NUMBER OF ARCTIC TERNS (AT) AND SABINE’S GULLS (SG) OBSERVED FORAGING IN
FRESHWATER MICROHABITATS DURING THE EGG= AND CHICKS STAGES
Microhabitat
Dry land Flooded tundra Pond edge Pond center
Egg stage SG 22 24 4 0 AT 10 40 4 54
Dry land Pond edge Pond center
Chick stage SG 129 11 7 AT 66 2 41
‘x2=47.4, df= 3, P< 0.001, m = 2.6 > ,/d’5=0.38, seeTable 3. b x2 = 46.0, df = 2, P < 0.001.
formed (Zar 1974: 185) and averaged within each period. Average micro- habitat segregation decreased over time from 40.5% in the egg stage to 33.2% during chick rearing.
Within each period, an estimate of total habitat segregation (ST) was calculated across all macro- and microhabitat categories. Because of the complementary nature of the S, and S, trends, ST values were relatively constant across the three periods: 69.4% in the egg stage, 64.3% during chick rearing, and 63.5% post-fledging.
DISCUSSION
Resource Partitioning
Pre-laying stage. - Sabine’s Gulls and Arctic Terns arrived at East Bay when the tundra was still mostly snow-covered and the Bay frozen. For- aging opportunities were scarce for the first 6 days while less than 2% of the study area was open water (Abraham 1982). At that time, potential invertebrate prey included adult beetles (Coleoptera), springtails (Collem- bola), and “snow” spiders (Arachnida). Sabine’s Gulls are known to prey heavily on “snow” spiders before melt (Sutton 1932, Bannerman 1962). In addition to invertebrates, seeds and other plant materials may provide an early food source for Sabine’s Gulls (Sutton 1932).
At the onset of melt, both Sabine’s Gulls and Arctic Terns were observed foraging in shallow melt pools throughout the study area. Potential prey included midge and cranefly larvae and adults, springtails, copepods, and the adults and larvae of aquatic and terrestrial beetles. During this pre- laying period, there was virtually no segregation of gulls and terns by macrohabitat. Widely scattered foraging opportunities and low prey avail-

Abraham and Ankney l HABITAT PARTITIONING BY LARIDS 169
ability encouraged individuals of both species to forage opportunistically, and to range over large areas in search of food.
Egg, chick, and post-jledging stages.-As the season progressed, the availability of foraging habitat (and prey) increased, and Arctic Terns and Sabine’s Gulls showed different patterns of habitat (and food) use. Throughout the egg, chick, and post-fledging stages, macrohabitat seg- regation of Sabine’s Gulls and Arctic Terns served to loosely partition total food resources; dipteran larvae and adults were available to Sabine’s Gulls in the freshwater macrohabitat and amphipods to Arctic Terns in the salt water zone. These patterns of habitat and food use are similar to those published for other mixed colonies of Sabine’s Gulls and Arctic Terns (McLaren et al. 1977) and for colonies of Arctic Terns (Parmelee and MacDonald 1960, Lemmetyinen 1976). However, fish usually form an important component of Arctic Tern diets. At East Bay, there was an apparent paucity of fish (Table l), and Arctic Terns relied on amphipods and other aquatic invertebrates for feeding chicks. Sabine’s Gulls preyed almost exclusively on insects; fish and large crustaceans were less well represented in the diets of Sabine’s Gulls at East Bay than elsewhere (Gabrielson and Lincoln 1959, Divoky 1978, Blomqvist and Elander 198 1). Microhabitat segregation facilitated further partitioning between gulls and terns within the shared freshwater macrohabitat; the adults and terrestrial larvae of dipterans were available to Sabine’s Gulls on dry land, and fairy shrimp, water fleas, and emerging adult dipterans to Arctic Terns in pond centers.
Interpretation
Why do Arctic Terns and Sabine’s Gulls at East Bay prefer the habitats (and foods) they do? We offer three interpretations of the observed pat- terns: (1) coincidence, (2) optimal foraging, and (3) interspecific compe- tition. Suppose the patterns of resource partitioning by these larids were purely coincidental, i.e., evolved in each species independently. If so, the degree and nature of macro- and microhabitat segregation of the two species would be due to chance. At East Bay, macro- and microhabitat segregations were complementary. That is, similarity along one dimension coincided with dissimilarity along the other, and resulted in a relatively constant level of spatial segregation. Interspecific differences “regulated” by chance, not natural selection, would probably be less systematic.
An alternate interpretation of the observed patterns of habitat and food use is optimal foraging, i.e., each species pursued the prey it was best suited to hunt. Patterns of habitat use by gulls and terns could then be explained in terms of the habitats used by their prey. This interpretation is satisfactory for Arctic Terns because they are behavioral specialists
170 THE WILSON BULLETIN l Vol. 96, No. 2, June 1984
when foraging and their concentration in the salt water zone probably has an anatomical/behavioral basis. Because terns do not regurgitate undigest- ed foods (Tinbergen 196 l), they are limited to carrying one prey item per feeding trip. Thus, when feeding chicks, the pursuit of large prey is likely the most economical strategy (Schoener 197 1). Amphipods, measuring up to 25 mm in length, were the largest prey in samples at East Bay and were found in the salt water macrohabitat. The only time terns regularly used the freshwater macrohabitat, where prey were small, was before hatch; some continued to forage there even after the salt water zone became free of snow and ice (Abraham 1982). Sabine’s Gulls, on the other hand, can (and do, especially at other colonies) efficiently use both small and large prey items throughout the season because they feed their chicks by regurgitation (Brown et al. 1967). At East Bay, most amphipods (96%) were found in shallow benthic samples at the edges of salt water “ponds” and were as accessible to Sabine’s Gulls as freshwater dipteran larvae. Yet, during the egg and chick stages, Sabine’s Gulls did not exploit the salt water macrohabitat despite the greater prey biomass available. As a third alternative, we suggest that Sabine’s Gulls were excluded from the salt water zone because of the abundance and competitive abilities of Arctic Terns there. Below, we present evidence to support this interpre- tation.
Partitioning of habitat and food resources by East Bay Arctic Terns and Sabine’s Gulls occurred during the 1980 breeding season. However, the mere presence of niche differences among coexisting species, i.e., “first- level” (Huey 1979) evidence for competition, is inconclusive (Schoener 1974, Huey 1979, Nudds 1982). Therefore, we considered “second-level” evidence, such as niche complementarity (Rosenzweig and Winakur 1969, Schoener 1974) necessary before invoking interspecific competition as a possible factor in the origin and/or maintenance of resource partitioning by East Bay Arctic Terns and Sabine’s Gulls. Second-level evidence from this study supports the interpretation that interspecific competition may have influenced the evolution of the observed niche differences: macro- and microhabitat segregations were complementary. Suc’h systematic changes in the segregation of species along complementary dimensions represent one of three predicted patterns of niche “over-dispersion” that Schoener (1974) suggested result from interspecific competition (see also Rosenzweig and Winakur 1969).
To further examine this interpretation, natural and/or manipulative experiments are needed. Ideally, the patterns offoraging habitat (and food) use by Arctic Terns and Sabine’s Gulls breeding in single-species colonies should be quantified and compared to those in mixed colonies. Such an approach could generate a third level of evidence for a competition hy- pothesis.

Abraham and A&my l HABITAT PARTITIONING BY LARIDS 171
SUMMARY
The patterns of habitat use by foraging Arctic Terns (Sterna purudisueu) and Sabine’s Gulls (Xemu subinz) were quantified and compared at East Bay, Southampton Island, N.W.T., during the 1980 breeding season.
Segregation of gulls and terns at the macrohabitat level served to loosely partition total food resources; dipteran larvae and adults were available to Sabine’s Gulls in the freshwater macrohabitat and amphipods to Arctic Terns in the salt water zone. Microhabitat segregation resulted in further partitioning, especially when macrohabitat segregation was lowest (i.e., during egg-laying and incubation). Three explanations for these patterns are discussed: coincidence, optimal foraging, and interspecific competition. Arguments in support of both optimal foraging and competition interpretations are offered to best account for the habitat preferences of Arctic Terns and Sabine’s Gulls at East Bay.
ACKNOWLEDGMENTS
We thank K. Abraham, D. Boyd, B. Chappell, P. Kehoe, T. Nakoolak, and especially K. Taylor for assistance in the field, and the Coral Harbour Hamlet Council for their cooperation during the study. K. F. Abraham, R. H. Green, P. T. Handford, M. H. A. Keenleyside, and D. M. Scott gave advice on methodology and data analysis. We also thank R. G. B. Brown, P. T. Handford, T. D. Nudds, D. M. Scott, and T. E. Quinney for their suggestions on earlier drafts of the manuscript. The photo for the color Frontispiece was provided by Pat Kehoe. Funding was provided by the Department of Indian and Northern Affairs, the Canadian Wildlife Service University Research Support Fund, and Natural Sciences and Engineering Research Council support to C. D. Ankney.
LITERATURE CITED
ABRAHAM, D. M. 1982. Resource partitioning between Sabine’s Gulls and Arctic Terns during the breeding season. M.S. thesis, Univ. Western Ontario, London, Ontario.
ALTMANN, J. 1974. Observational study of behaviours: sampling methods. Behaviour 49: 227-267.
ASHMOLE, N. P. 1968. Body size, prey size and ecological segregation in five sympatric tropical terns (Aves: Laridae). Syst. Zool. 17:292-304.
BANNERMAN, D. A. 1962. The birds of the British Isles. Vol. II. Oliver and Boyd, Edinburgh, Scotland.
BERGMAN, R. D., R. L. HOWARD, K. F. ABRAHAM, AND M. W. WELLER. 1977. Water birds and their wetland resources in relation to oil development at Storkersen Point, Alaska. U.S. Dept. Interior, Fish and Wildl. Serv. Resour. Publ. No. 129.
BLOMQVIST, S. AND M. ELANDER. 1981. Sabine’s Gull (Xemu subinz), Ross’s Gull (Rho- dostethiu roseu) and Ivory Gull (Pugophilu eburneu)-Gulls in the Arctic: A review. Arctic 34:122-132 and 388.
BROWN, R. G. B., N. G. BLURTON-JONES, AND D. J. T. HUSSEL. 1967. The breeding behaviour of Sabine’s Gull (Xemu s&m]. Behaviour 28: 110-140.
DIVOKY, G. J. 1978. Identification, documentation and delineation of coastal migratory bird habitat in Alaska. II. Feeding habits of birds in the Beaufort Sea. Pp. 549-569 in Environmental assessment of the Alaskan continental shelf. Vol. I. Receptors-mam- mals, birds. Natl. Oceanic and Atmos. Admin., Boulder, Colorado.
GABRIELSON, I. N. AND F. C. LINCOLN. 1959. Birds of Alaska. Stackpole Books, Harrisburg, Pennsylvania.
GODFREY, W. E. 1966. The birds of Canada. Natl. Mus. Canada Bull. 203.

172 THE WILSON BULLETIN l Vol. 96, No. 2, June 1984
HOAR, W. S. 1975. General and comparative physiology. 2nd ed. Prentice-Hall Inc., Englewood Cliffs, New Jersey.
HUEY, R. B. 1979. Parapatry and niche complementarity of Peruvian Desert Geckos (Ph~lZoductylus): the ambiguous role of competition. Oecologia 38:249-259.
LAWAL, H. B. AND G. J. G. UPTON. 1980. An approximation to the distribution of the x2 goodness-of-fit statistic for use with small expectations. Biometrika 67:447-453.
LEMMETYINEN, R. 1976. Feeding segregation in the Arctic and Common terns in southern Finland. Auk 93:637-640.
MCLAREN, M. A., P. L. MCLAREN, AND W. G. ALLISTON. 1977. Bird populations in the Rasmussen Basin lowlands, N. W. T. June-Sept. 1976. Prepared for Polar Gas Project by LGL Environmental Research Associates, Toronto, Ontario.
NUDDS, T. D. 1982. Ecological separation of grebes and coots: interference competition or microhabitat selection? Wilson Bull. 94:505-5 14.
PARMELEE, D. F. AND S. D. MACDONALD. 1960. The birds of west-central Ellesmere Island and adjacent areas. Natl. Mus. Canada Bull. 169.
PEARSON, T. H. 1968. The feeding biology of sea-bird species breeding on the Fame Islands, Northumberland. J. Anim. Ecol. 37:521-552.
ROSENZWEIG, M. L. AND J. WINAKUR. 1969. Population ecology of desert rodent com- munities: habitats and environmental complexity. Ecology 50:558-572.
SCHOENER, T. W. 1968. The Anolis lizards of Bimini: resource partitioning in a complex fauna. Ecology 49:704-726.
-. 1971. Theory of feeding strategies. Ann. Rev. Ecol. Syst. 2:369-404. -. 1974. Resource partitioning in ecological communities. Science 185:27-39. SOKAL, R. R. AND F. J. ROHLF. 1969. Biometry. W. H. Freeman and Co., San Francisco,
California. SUTTON, G. M. 1932. The exploration of Southampton Island. Pt. 2. Zoology, Sec. 2. The
birds of Southampton Island. Carnegie Mus. Mem. X11:3-268. TINBERGEN, N. 196 1. The Herring Gull’s world. Anchor Books, Doubleday and Co., Inc.,
Garden City, New York. WEAST, R. C., ED. 1972-73. CRC handbook of chemistry and physics. 53rd ed. CRC Press,
The Chemical Rubber Co. Publishers, Cleveland, Ohio. ZAR, J. H. 1974. Biostatistical analysis. Prentice-Hall Inc., Englewood Cliffs, New Jersey.
DEPT. ZOOLOGY, UNIV. WESTERN ONTARIO, LONDON, ONTARIO N6A 5B7 CAN-
ADA. (PRESENT ADDRESS DMA: P.O. BOX 4, MOOSONEE, ONTARIO POL 1~0
CANADA.) ACCEPTED 17 FEB. 1984.